Embed Size (px)
Citation preview

Copyright © 2010 SAS Institute Inc. All rights reserved.
Data Mining Using SAS®
Enterprise Miner 7.1Lorne [email protected] StatisticianSAS Institute (Canada) Inc.
2
Copyright © 2010, SAS Institute Inc. All rights reserved.
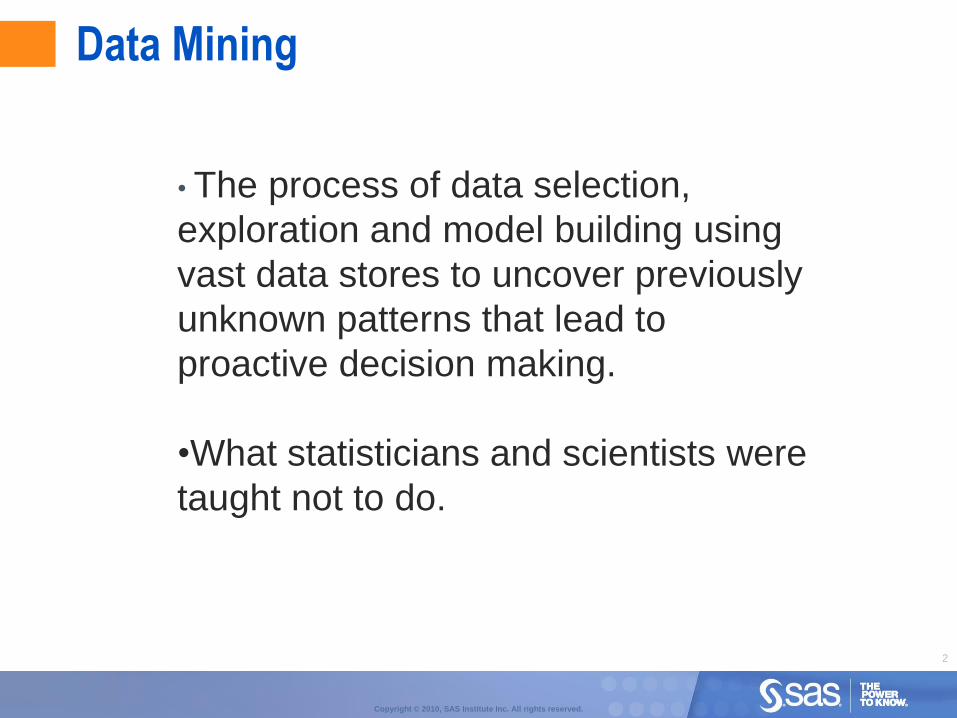
• The process of data selection,
exploration and model building using
vast data stores to uncover previously
unknown patterns that lead to
proactive decision making.
•What statisticians and scientists were
taught not to do.
Data Mining
3
Copyright © 2010, SAS Institute Inc. All rights reserved.
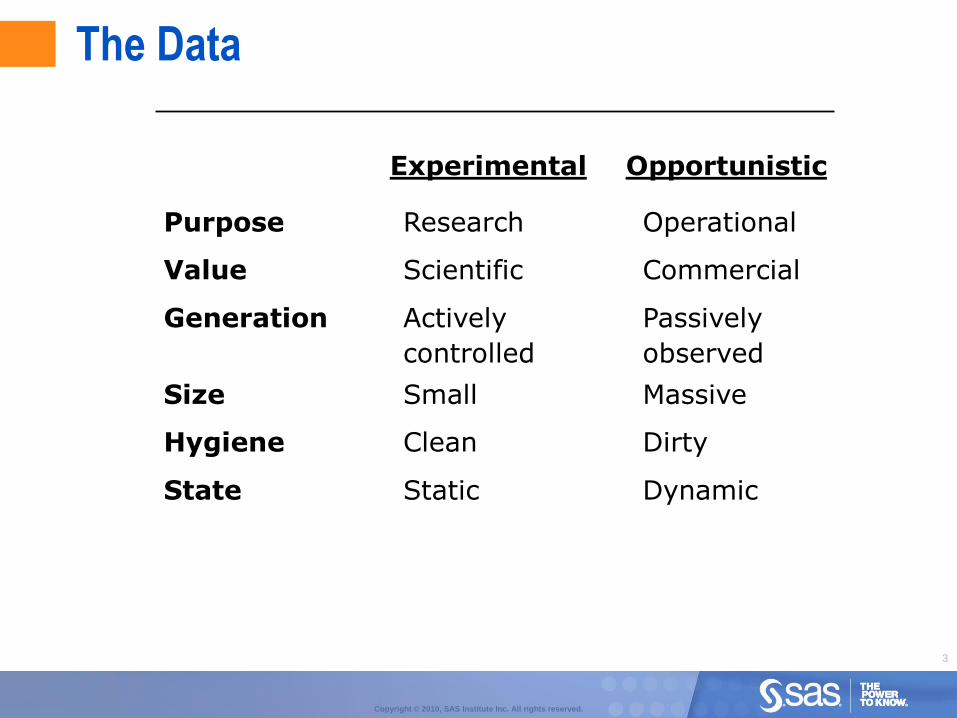
Experimental Opportunistic
Purpose Research Operational
Value Scientific Commercial
Generation Actively Passively
controlled observed
Size Small Massive
Hygiene Clean Dirty
State Static Dynamic
The Data
4
Copyright © 2010, SAS Institute Inc. All rights reserved.
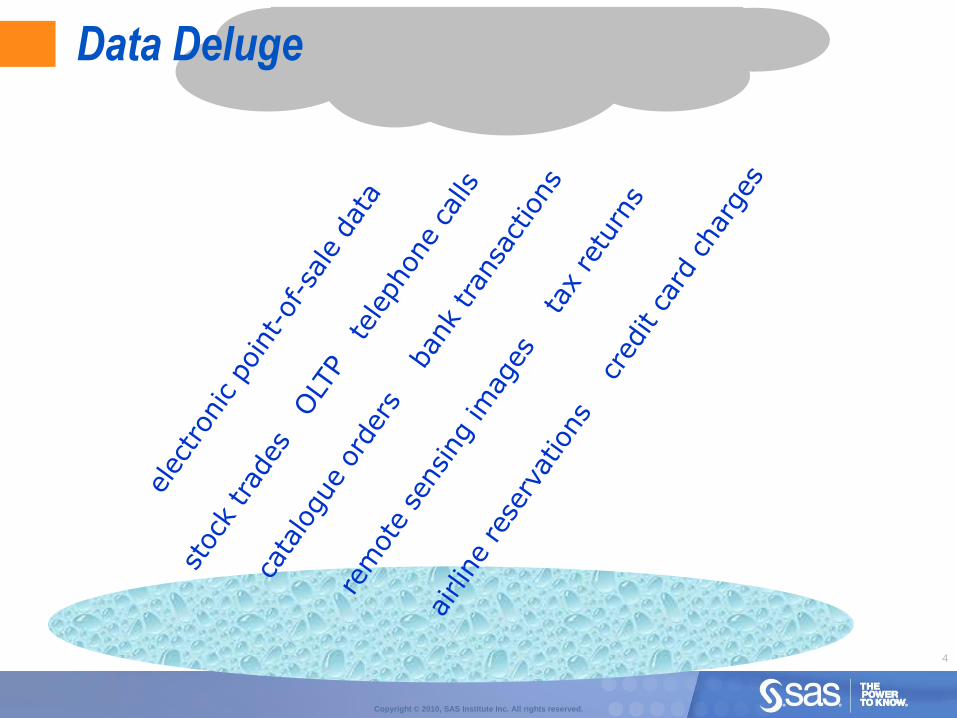
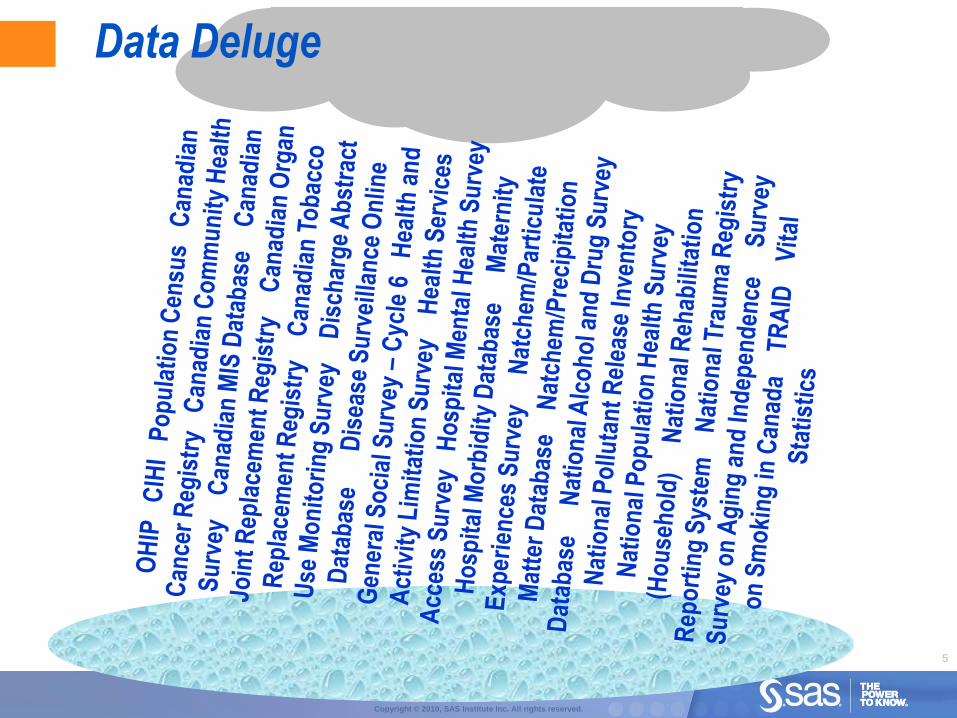
Data Deluge
5
Copyright © 2010, SAS Institute Inc. All rights reserved.
Data Deluge
6
Copyright © 2010, SAS Institute Inc. All rights reserved.
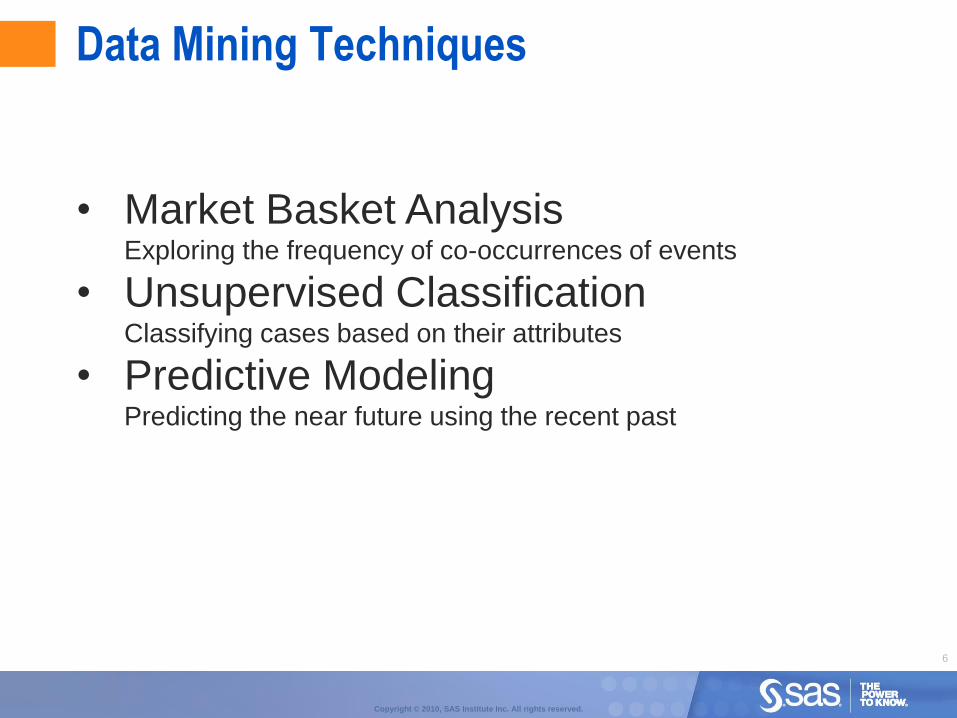
Data Mining Techniques
• Market Basket Analysis Exploring the frequency of co-occurrences of events
• Unsupervised Classification Classifying cases based on their attributes
• Predictive Modeling Predicting the near future using the recent past
7
Copyright © 2010, SAS Institute Inc. All rights reserved.
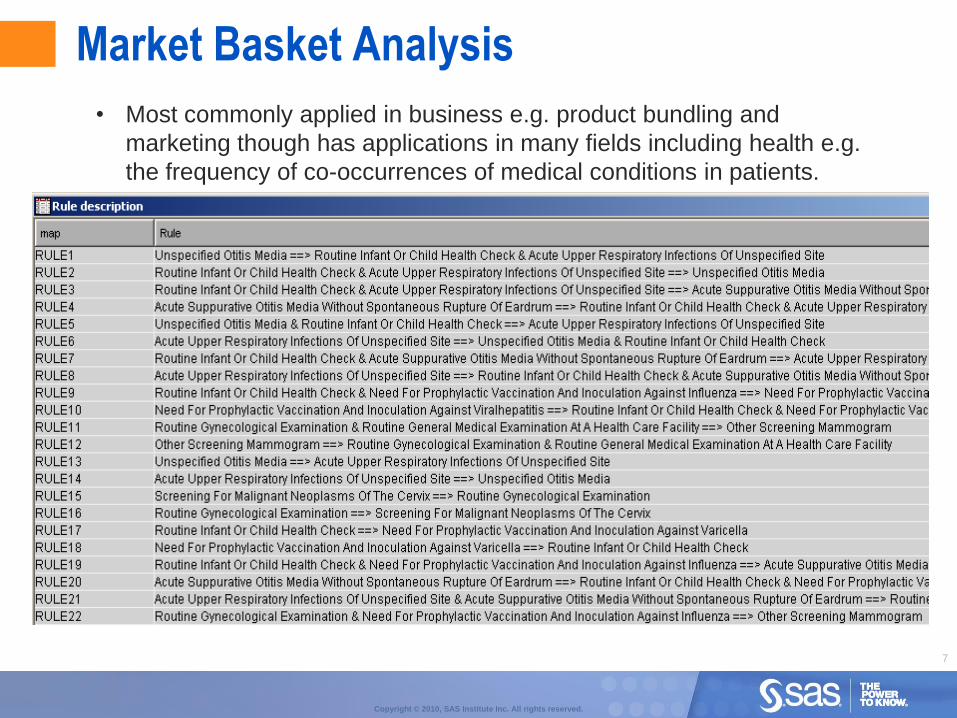
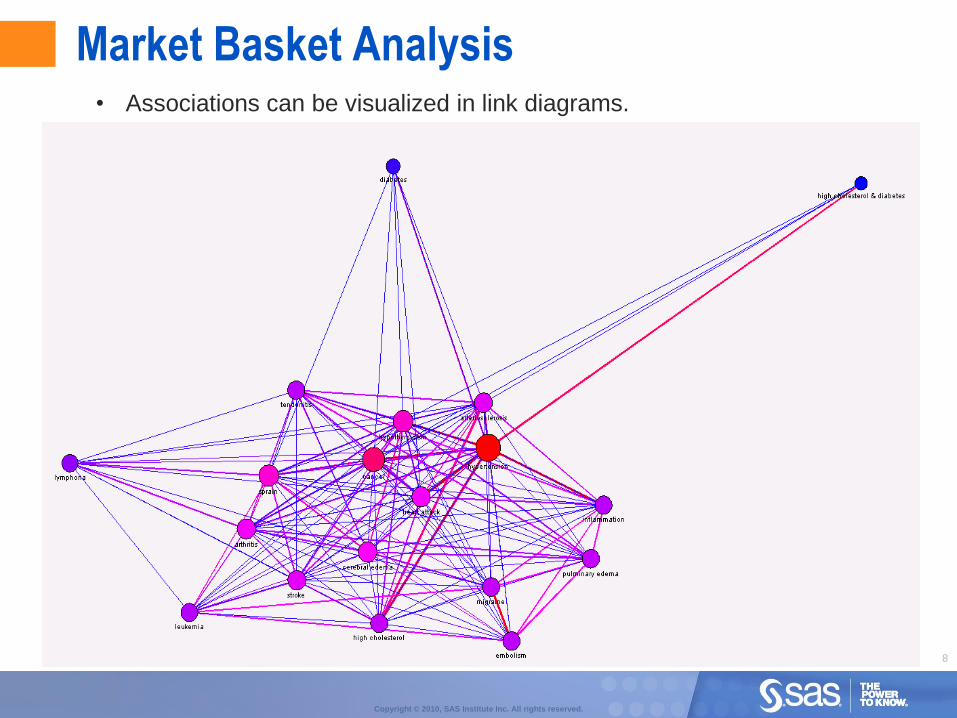
Market Basket Analysis
• Most commonly applied in business e.g. product bundling and
marketing though has applications in many fields including health e.g.
the frequency of co-occurrences of medical conditions in patients.
8
Copyright © 2010, SAS Institute Inc. All rights reserved.
Market Basket Analysis• Associations can be visualized in link diagrams.
9
Copyright © 2010, SAS Institute Inc. All rights reserved.
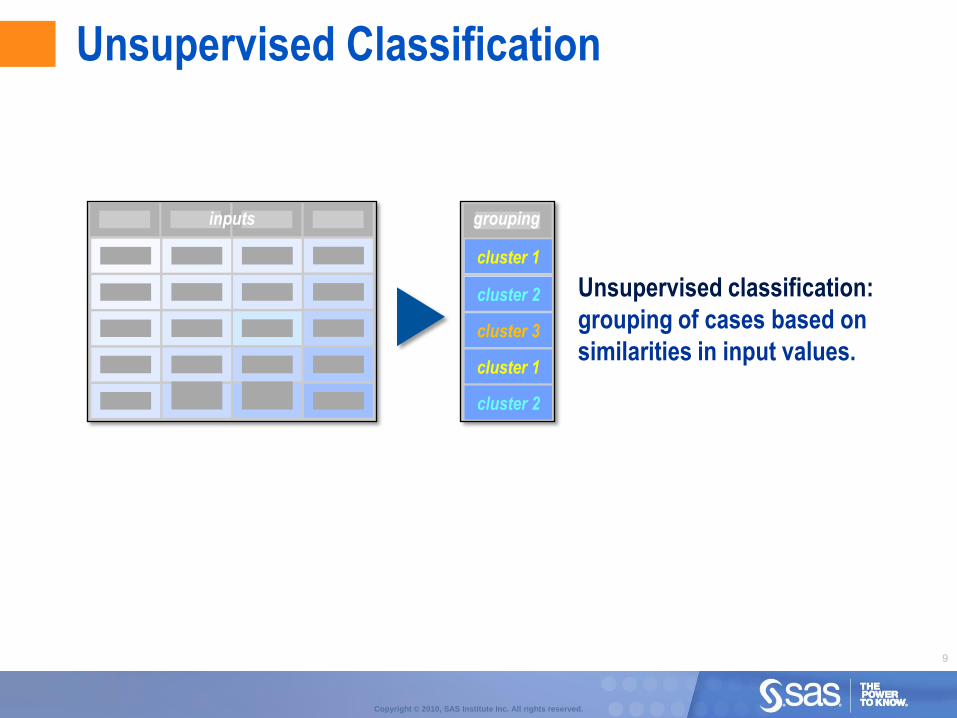
Unsupervised Classification
inputs
Unsupervised classification:
grouping of cases based on
similarities in input values.
grouping
cluster 1
cluster 2
cluster 2
cluster 1
cluster 3
10
Copyright © 2010, SAS Institute Inc. All rights reserved.
10
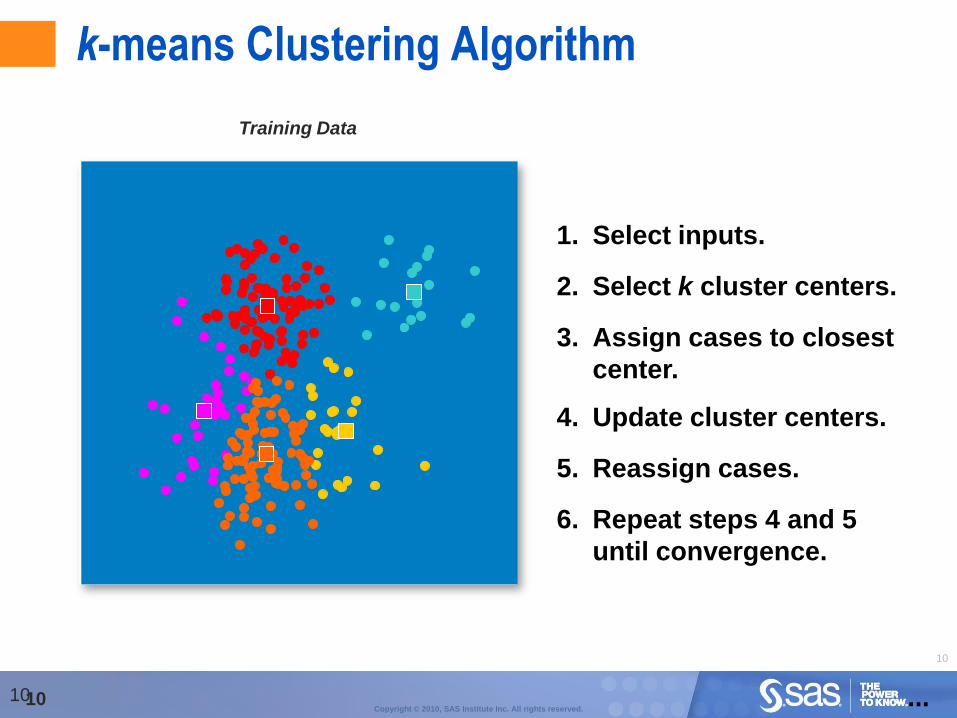
k-means Clustering Algorithm
10
Training Data
1. Select inputs.
2. Select k cluster centers.
3. Assign cases to closest
center.
4. Update cluster centers.
5. Reassign cases.
6. Repeat steps 4 and 5
until convergence.
...

11
Copyright © 2010, SAS Institute Inc. All rights reserved.
Predictive Modeling
12
Copyright © 2010, SAS Institute Inc. All rights reserved.
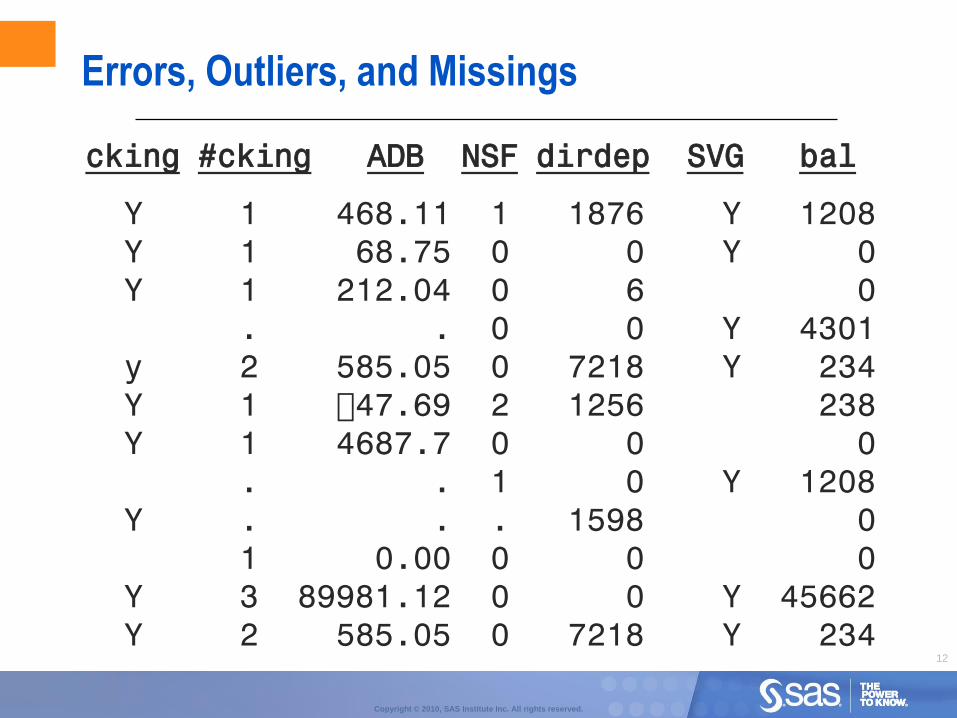
cking #cking ADB NSF dirdep SVG bal
Y 1 468.11 1 1876 Y 1208Y 1 68.75 0 0 Y 0Y 1 212.04 0 6 0
. . 0 0 Y 4301y 2 585.05 0 7218 Y 234Y 1 47.69 2 1256 238Y 1 4687.7 0 0 0
. . 1 0 Y 1208Y . . . 1598 0
1 0.00 0 0 0Y 3 89981.12 0 0 Y 45662Y 2 585.05 0 7218 Y 234
Errors, Outliers, and Missings
13
Copyright © 2010, SAS Institute Inc. All rights reserved.
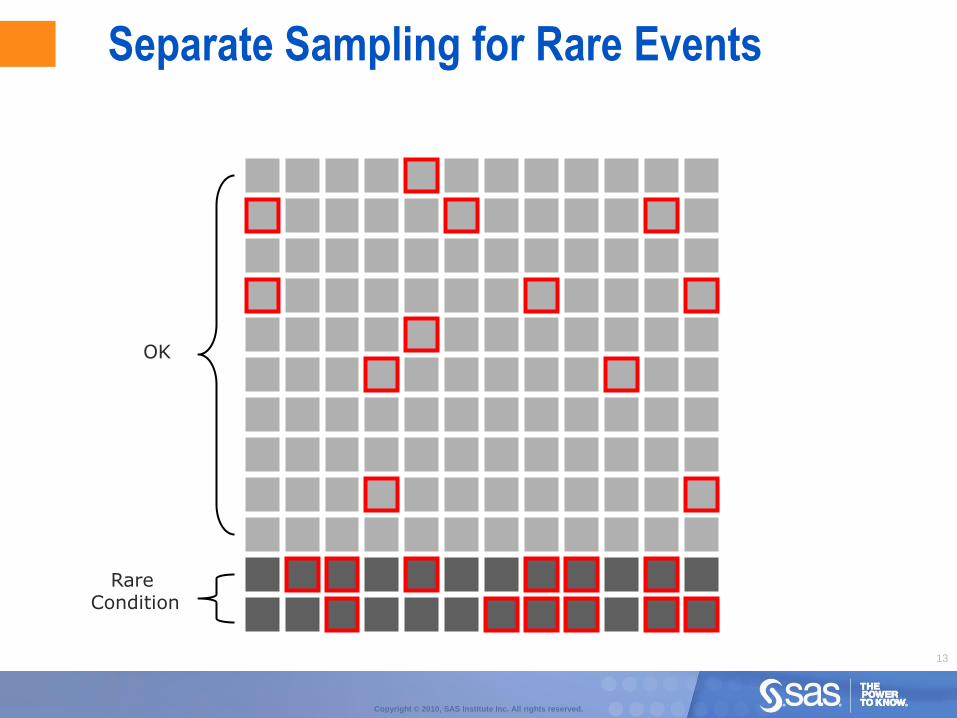
OK
Rare Condition
Separate Sampling for Rare Events
14
Copyright © 2010, SAS Institute Inc. All rights reserved.
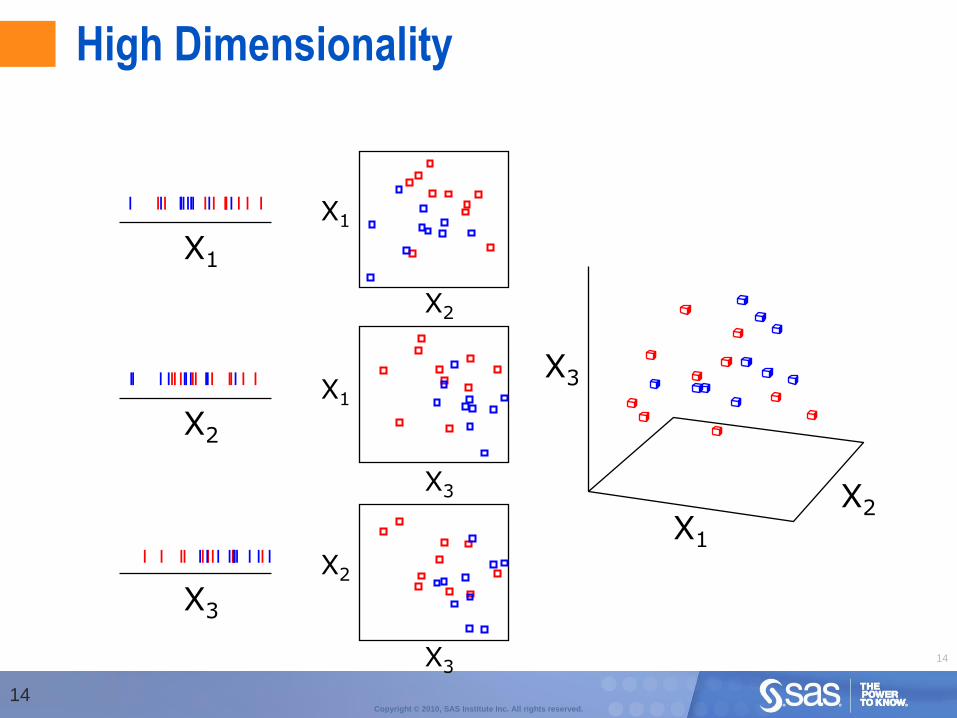
High Dimensionality
14
II IIII II III III I III II
II I I III III IIII II II II
II III III I II II II II I II
X1
X2
X3
X1
X2
X1
X3
X2
X3
X1
X2
X3
15
Copyright © 2010, SAS Institute Inc. All rights reserved.
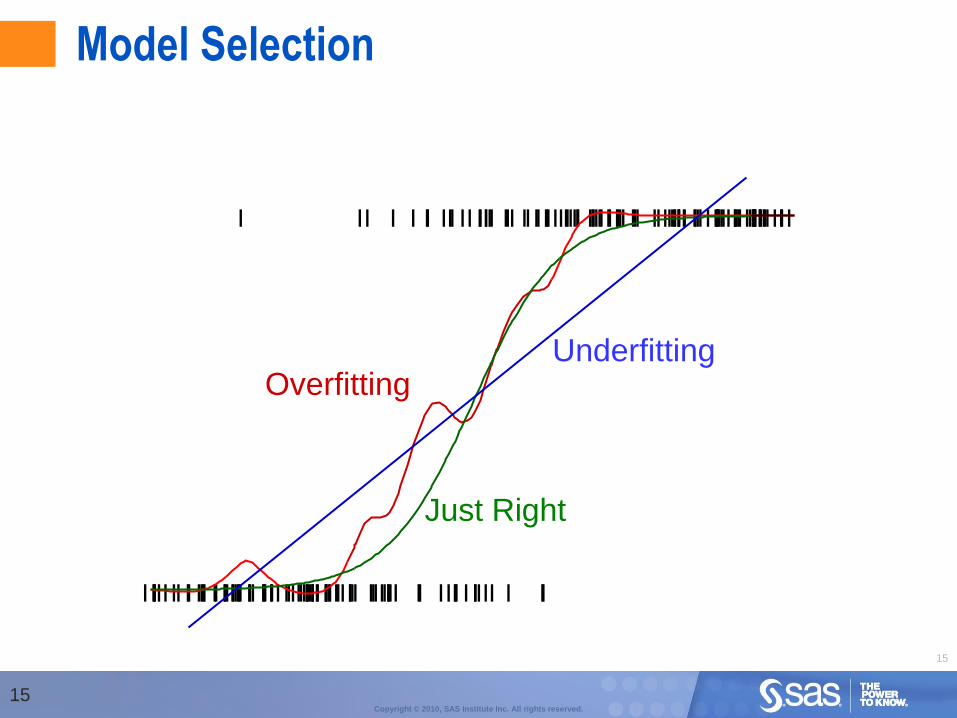
Model Selection
15
Underfitting
IIIIIIII II IIII IIIIIIIIIII
I
III IIIIIIIIIIIIIIIIIIIIIIIIIIIIIIIII
II
IIIIIIII
I
I
I
II
II
I
I
I
II
III
I
I
I
III
II
I
IIII
I
II
I
I IIII
II
IIIIIIIIIII IIIIIIIIIIII III IIIIIIIIIIII IIIIIIIIIIIIIIIIIIIIIIIIIIIIIIIIIIII
Overfitting
Just Right
16
Copyright © 2010, SAS Institute Inc. All rights reserved.
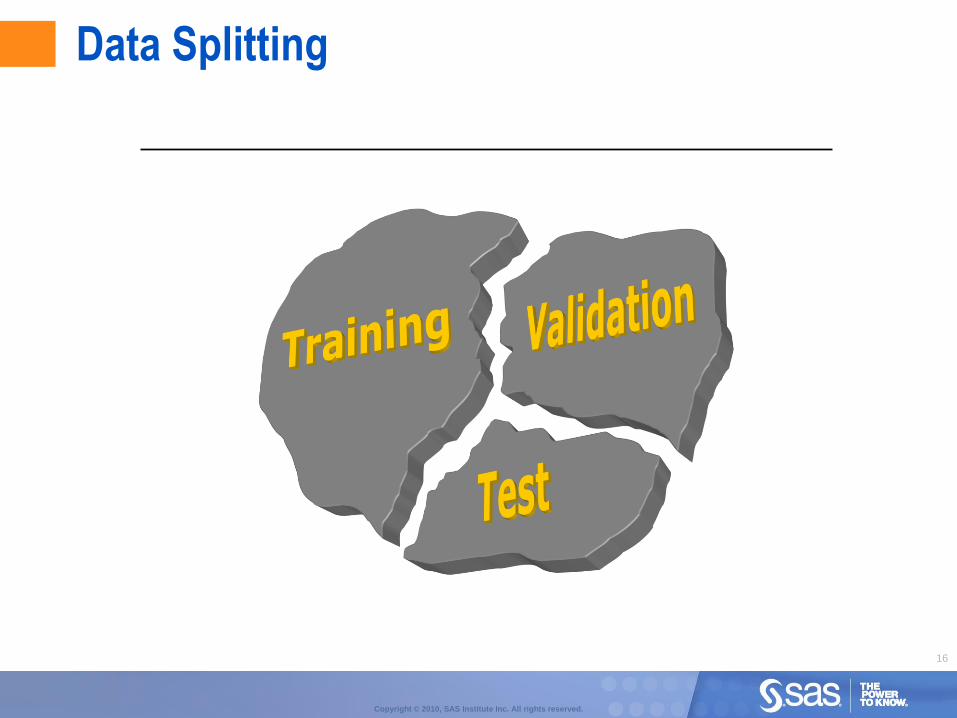
Data Splitting
17
Copyright © 2010, SAS Institute Inc. All rights reserved.
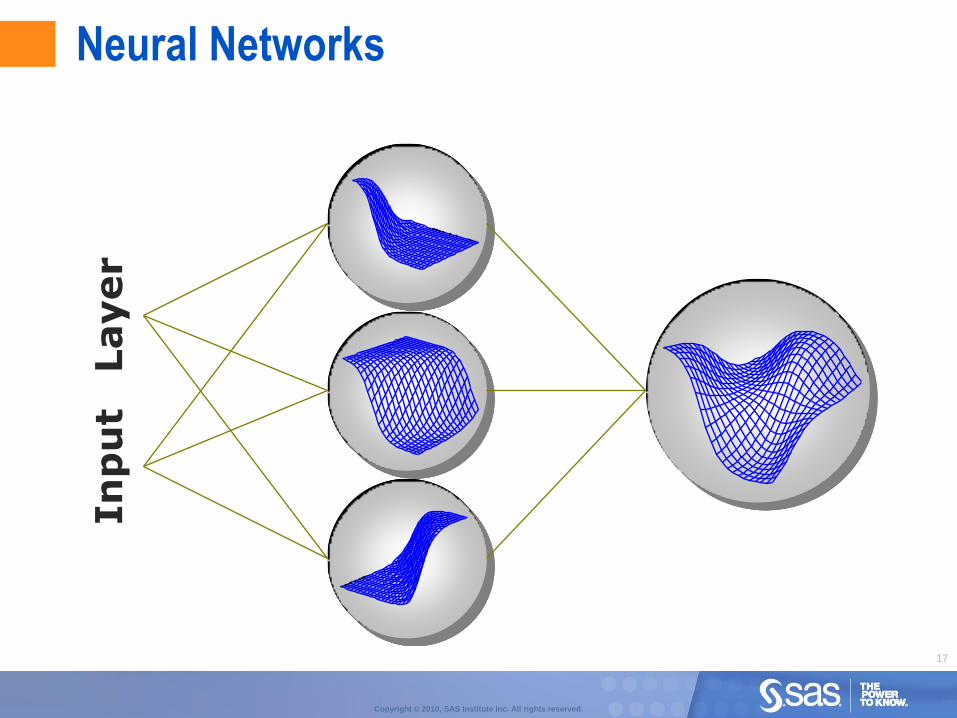
Layer
Input
Neural Networks
18
Copyright © 2010, SAS Institute Inc. All rights reserved.
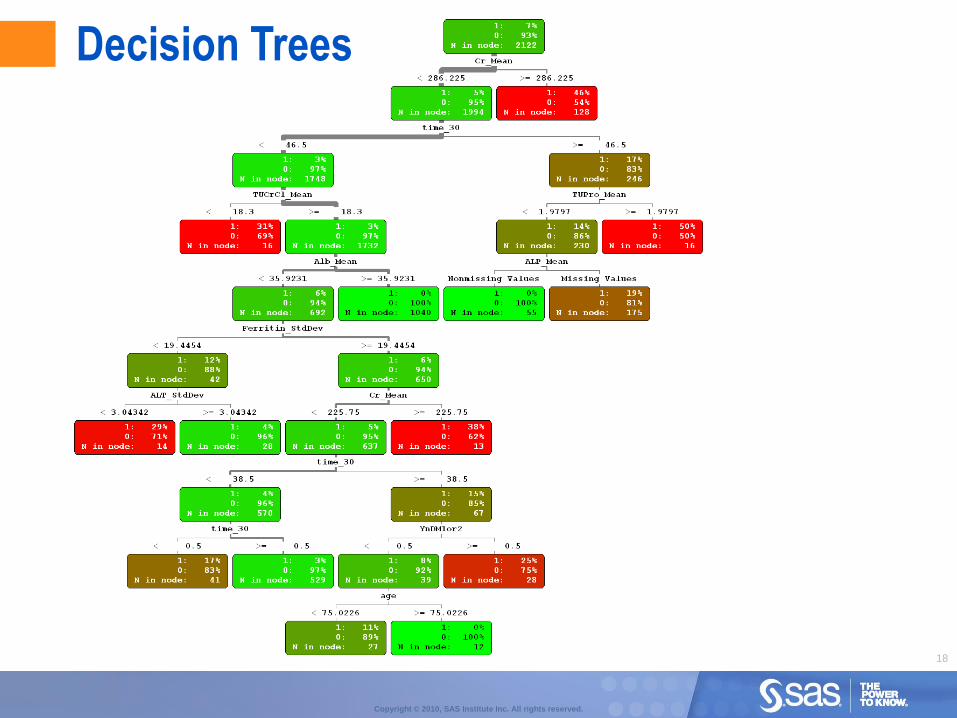
Decision Trees
19
Copyright © 2010, SAS Institute Inc. All rights reserved.
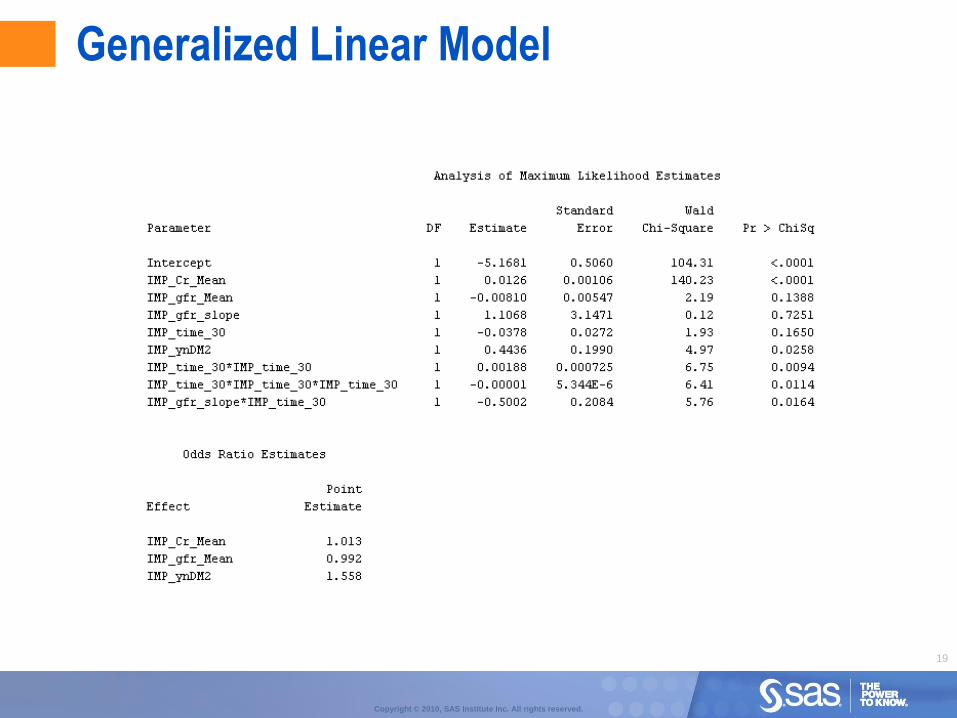
Generalized Linear Model
20
Copyright © 2010, SAS Institute Inc. All rights reserved.
• Gradient Boosting
• Rule Induction
• Memory Based Reasoning
• Support Vector Machines
• Least Angular Regression
• Partial Least Squares
• SAS Rapid Predictive Modeler
• Two Stage Models
• Ensemble Models
…And Other Modeling Tools
21
Copyright © 2010, SAS Institute Inc. All rights reserved.
• North Carolina births for 2000 and 2001.
• The original data sets included over 120,000 births in each year
and contain data on the race, age, education level and marital
status of the parents; prenatal medical care received; and
information on the mother's reproductive history including number
of previous pregnancies and live births (State Center for Health
Statistics, 2001, 2002). Plural births were filtered from the data.
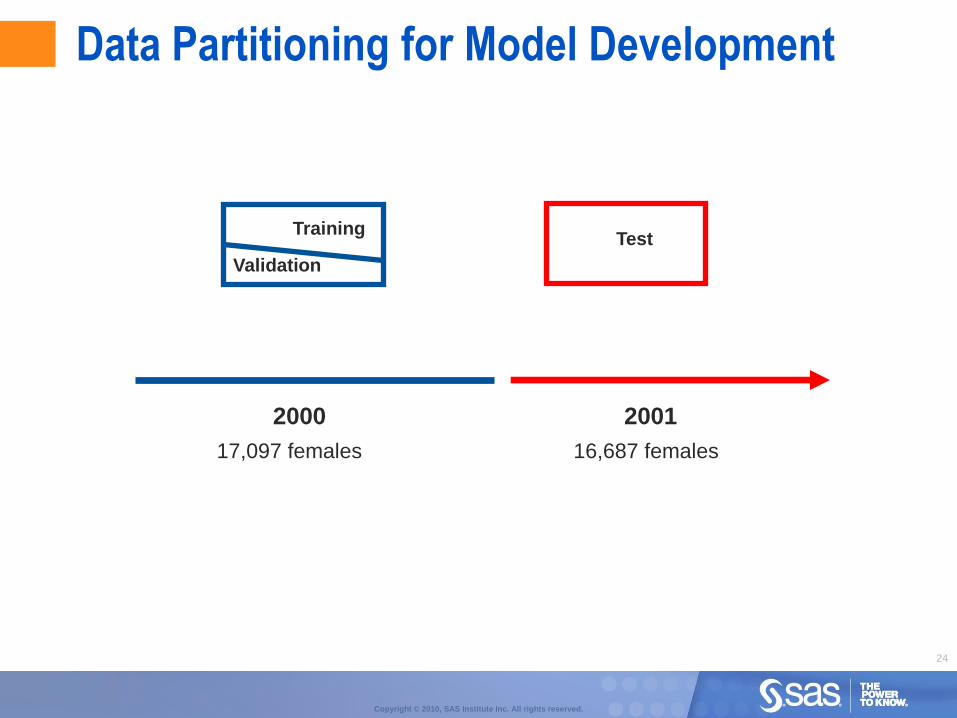
• The set, DEVELOP00 represents an oversample (50% LBWT=1,
50% LBWT=0) of 17,097 records from 2000 to be used for
training and validation. The percentage of low birth weight babies
prior to oversampling is 7.2%.
• The data, TEST01 represents an oversample (50% LBWT=1,
50% LBWT=0) of 16,687 records from 2001 to be used as a
„future‟ test set. The percentage of low birth weight was also
7.2%.
Scenario: Early Detection for Low Birth Weight
22
Copyright © 2010, SAS Institute Inc. All rights reserved.
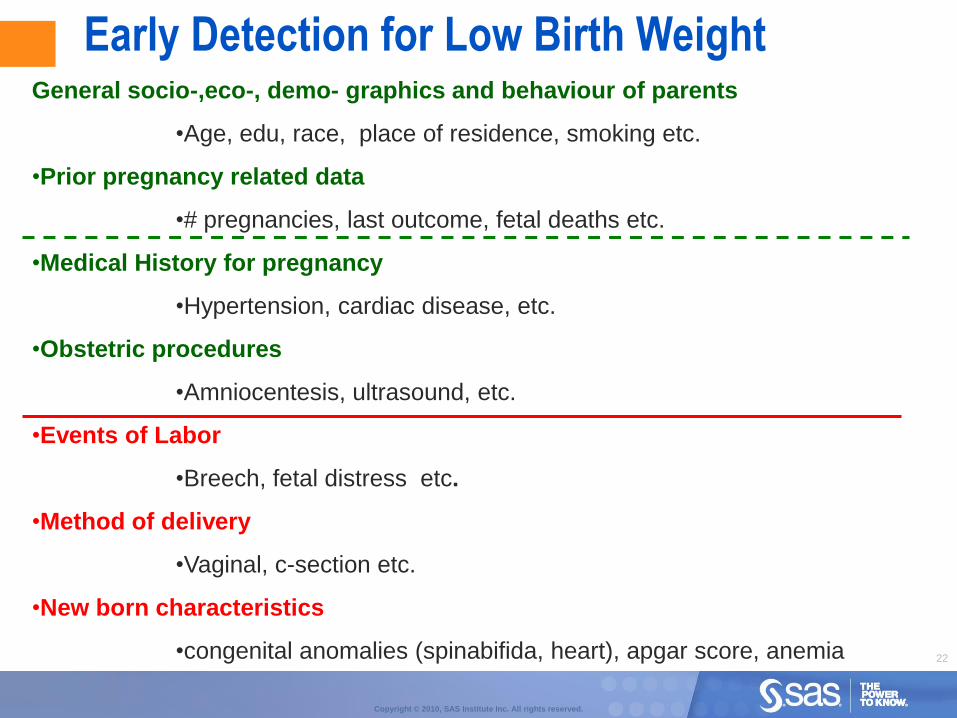
General socio-,eco-, demo- graphics and behaviour of parents
•Age, edu, race, place of residence, smoking etc.
•Prior pregnancy related data
•# pregnancies, last outcome, fetal deaths etc.
•Medical History for pregnancy
•Hypertension, cardiac disease, etc.
•Obstetric procedures
•Amniocentesis, ultrasound, etc.
•Events of Labor
•Breech, fetal distress etc.
•Method of delivery
•Vaginal, c-section etc.
•New born characteristics
•congenital anomalies (spinabifida, heart), apgar score, anemia
Early Detection for Low Birth Weight
23
Copyright © 2010, SAS Institute Inc. All rights reserved.
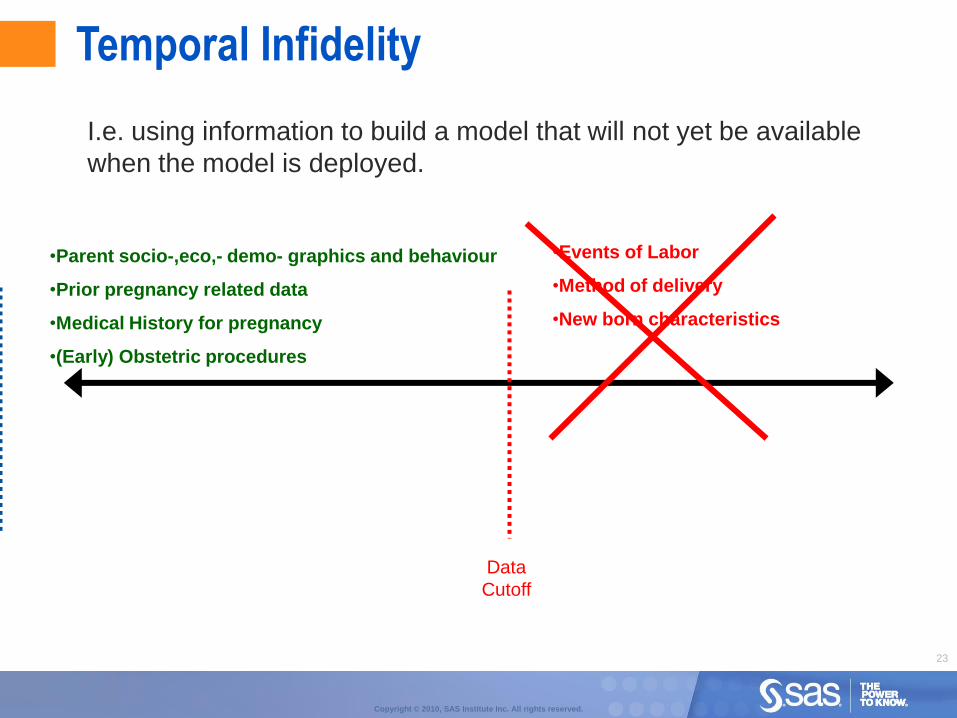
Data
Cutoff
•Parent socio-,eco,- demo- graphics and behaviour
•Prior pregnancy related data
•Medical History for pregnancy
•(Early) Obstetric procedures
•Events of Labor
•Method of delivery
•New born characteristics
Temporal Infidelity
I.e. using information to build a model that will not yet be available
when the model is deployed.
24
Copyright © 2010, SAS Institute Inc. All rights reserved.
Training
Validation
2000 2001
Test
17,097 females 16,687 females
Data Partitioning for Model Development
25
Copyright © 2010, SAS Institute Inc. All rights reserved.
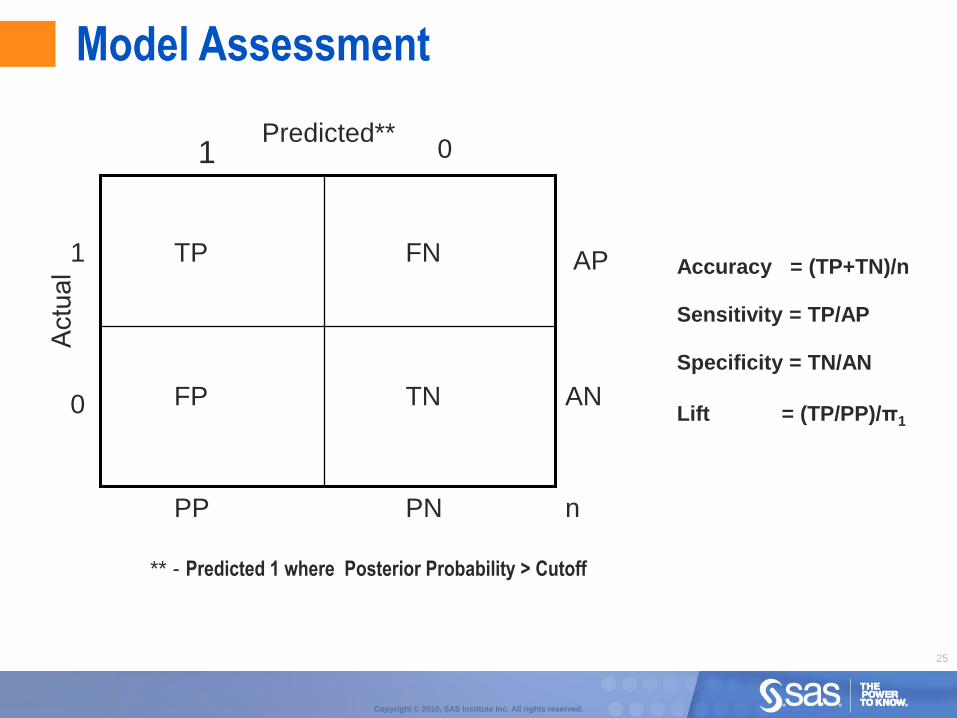
1 0
1
0
Predicted**
TP
FP
FN
TN AN
AP
PP PN n
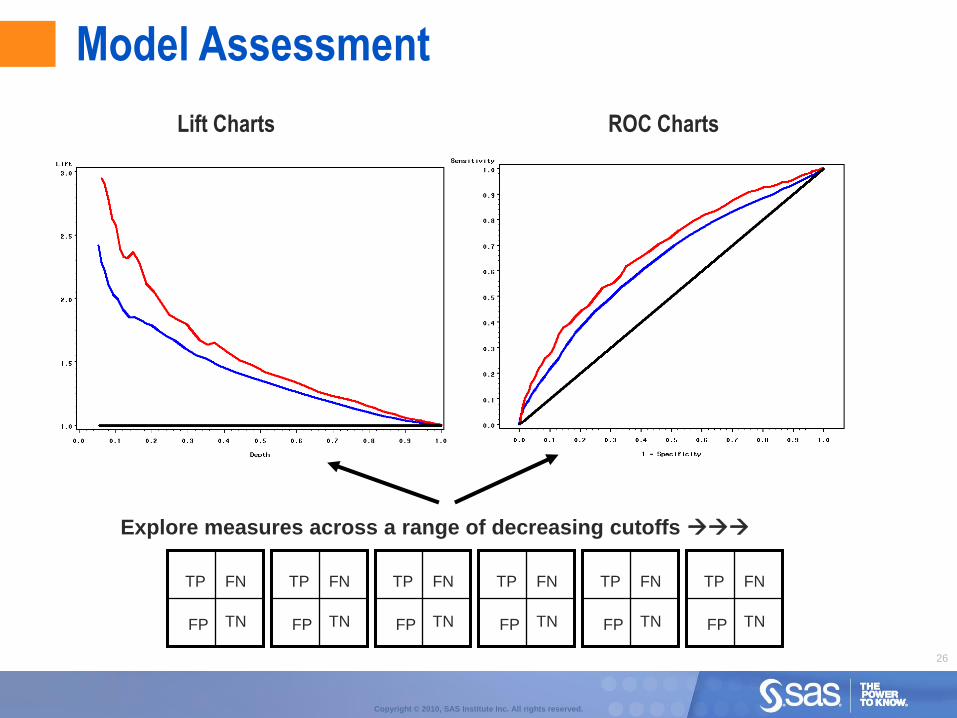
Accuracy = (TP+TN)/n
Sensitivity = TP/AP
Specificity = TN/AN
Lift = (TP/PP)/π1
** - Predicted 1 where Posterior Probability > Cutoff
Model Assessment
26
Copyright © 2010, SAS Institute Inc. All rights reserved.
TP
TN
FN
FP
TP
TN
FN
FP
TP
TN
FN
FP
TP
TN
FN
FP
TP
TN
FN
FP
TP
TN
FN
FP
Explore measures across a range of decreasing cutoffs
Lift Charts ROC Charts
Model Assessment
27
Copyright © 2010, SAS Institute Inc. All rights reserved.
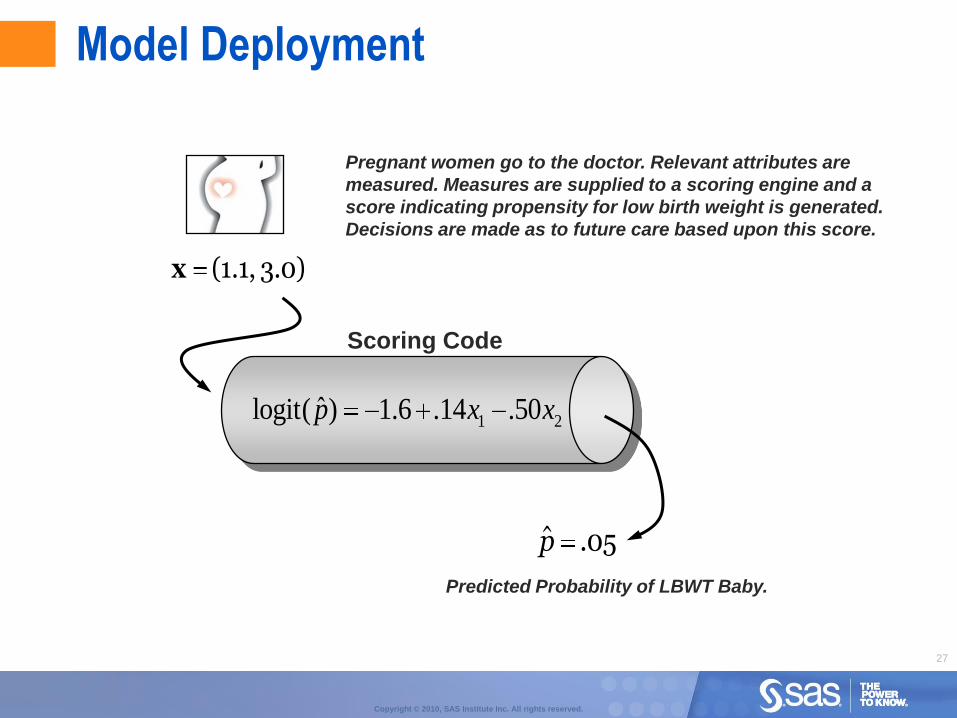
Scoring Code
Pregnant women go to the doctor. Relevant attributes are
measured. Measures are supplied to a scoring engine and a
score indicating propensity for low birth weight is generated.
Decisions are made as to future care based upon this score.
Predicted Probability of LBWT Baby.
05.p̂
)0.3,1.1(x
1 2ˆlogit( ) 1.6 .14 .50p x x
Model Deployment
28
Copyright © 2010, SAS Institute Inc. All rights reserved.
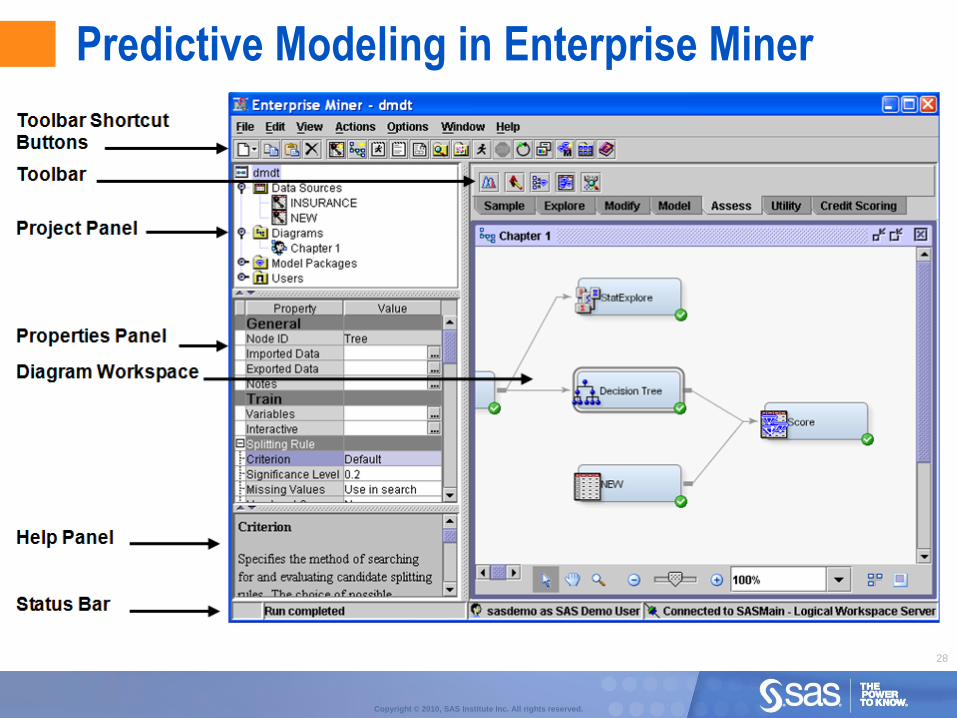
Predictive Modeling in Enterprise Miner
29
Copyright © 2010, SAS Institute Inc. All rights reserved.
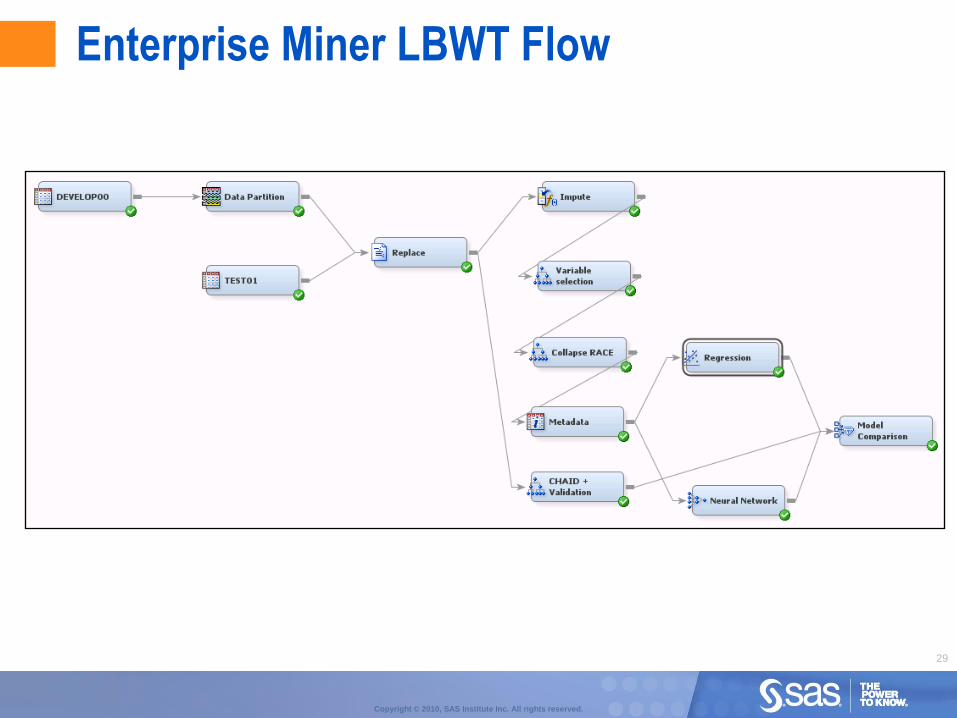
Enterprise Miner LBWT Flow
30
Copyright © 2010, SAS Institute Inc. All rights reserved.
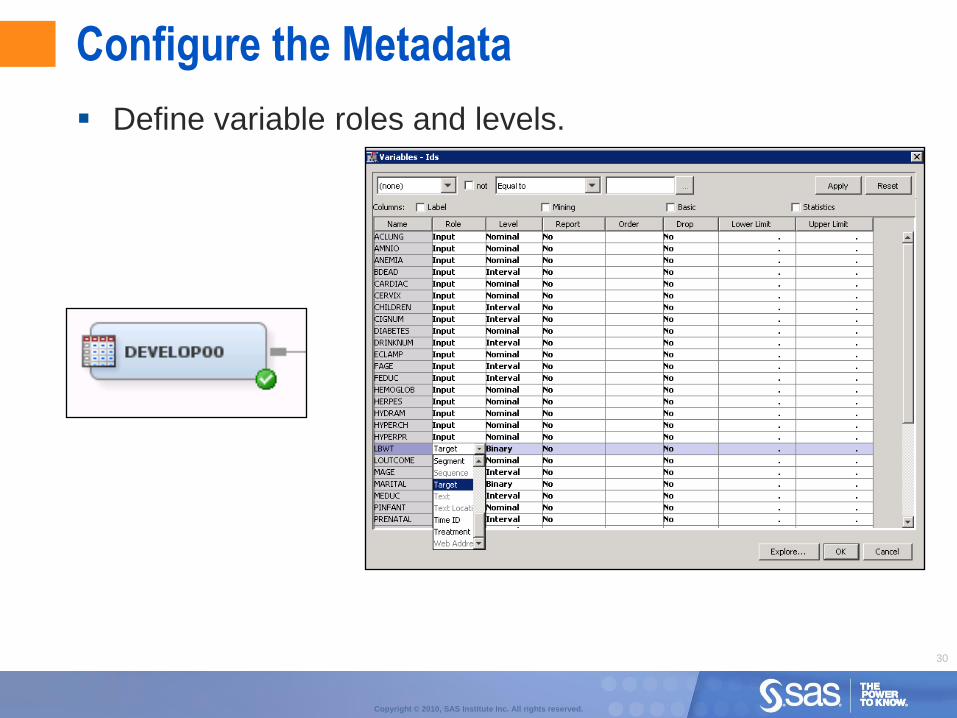
Configure the Metadata
Define variable roles and levels.
31
Copyright © 2010, SAS Institute Inc. All rights reserved.
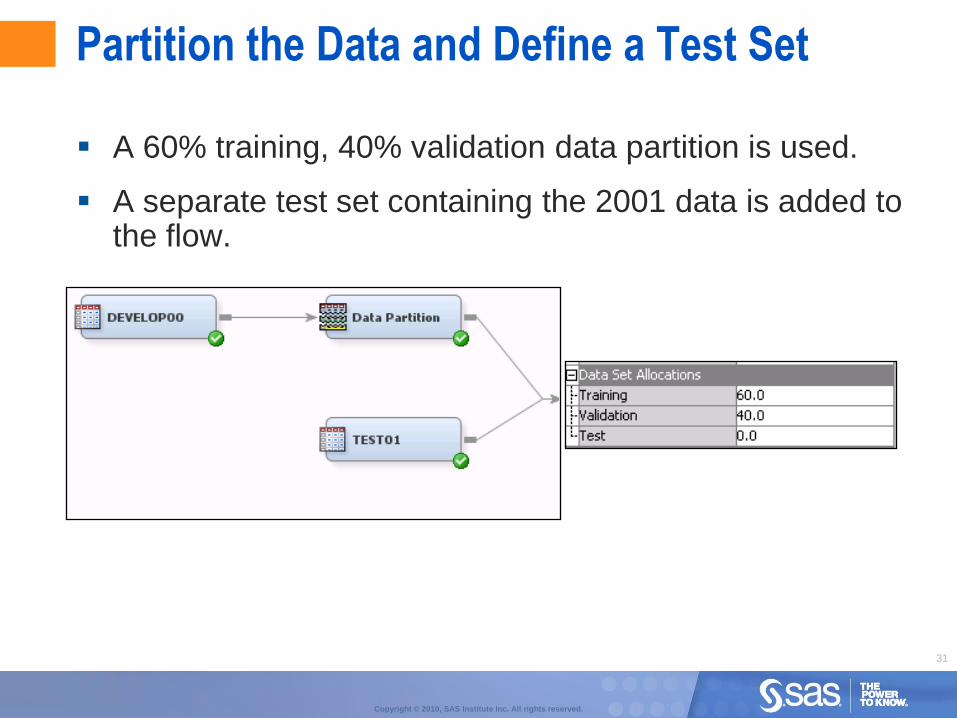
Partition the Data and Define a Test Set
A 60% training, 40% validation data partition is used.
A separate test set containing the 2001 data is added to the flow.
32
Copyright © 2010, SAS Institute Inc. All rights reserved.
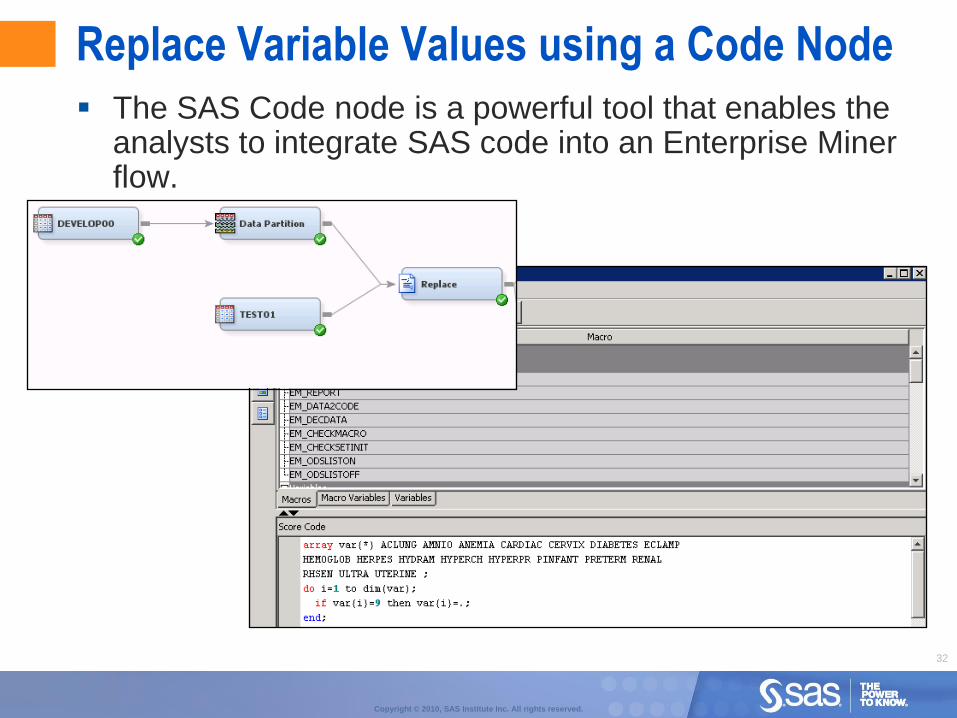
Replace Variable Values using a Code Node
The SAS Code node is a powerful tool that enables the analysts to integrate SAS code into an Enterprise Miner flow.
33
Copyright © 2010, SAS Institute Inc. All rights reserved.
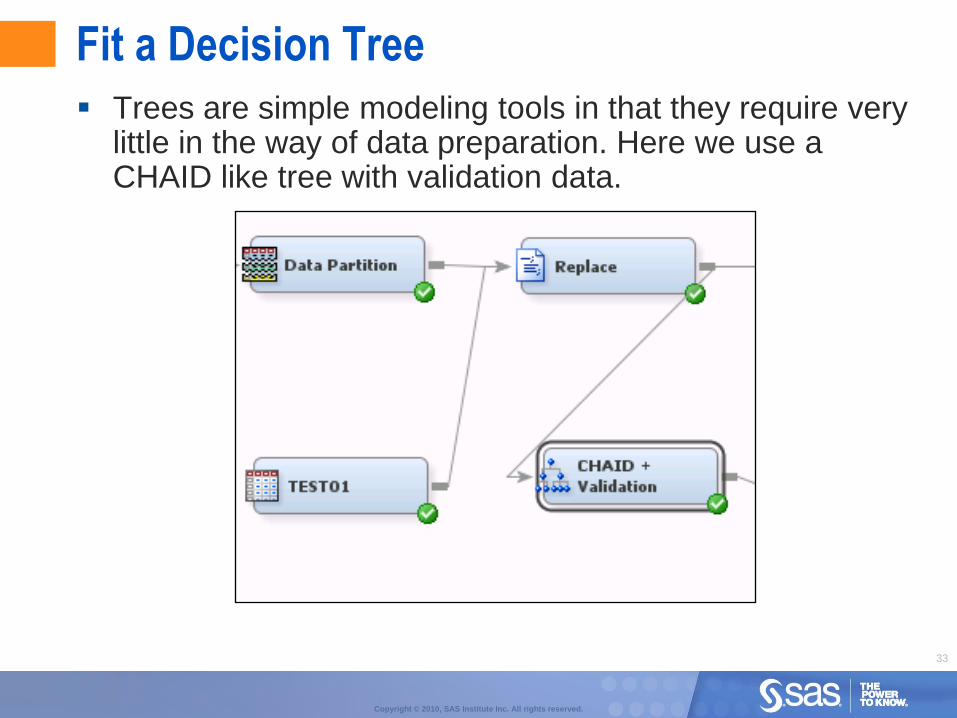
Fit a Decision Tree
Trees are simple modeling tools in that they require very little in the way of data preparation. Here we use a CHAID like tree with validation data.
34
Copyright © 2010, SAS Institute Inc. All rights reserved.
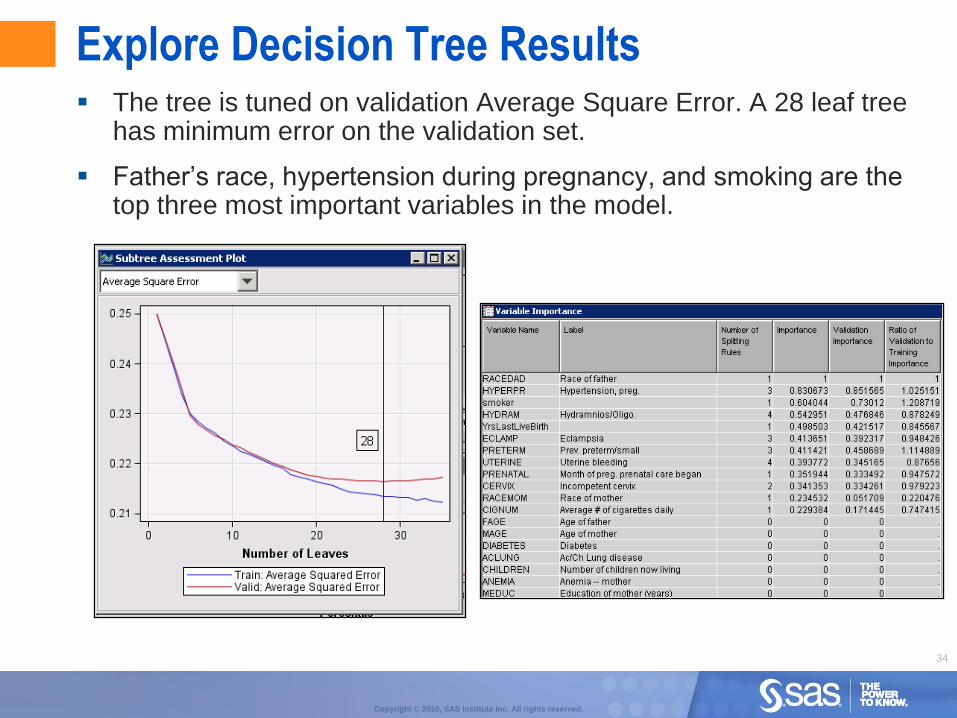
Explore Decision Tree Results The tree is tuned on validation Average Square Error. A 28 leaf tree
has minimum error on the validation set.
Father‟s race, hypertension during pregnancy, and smoking are the top three most important variables in the model.
35
Copyright © 2010, SAS Institute Inc. All rights reserved.
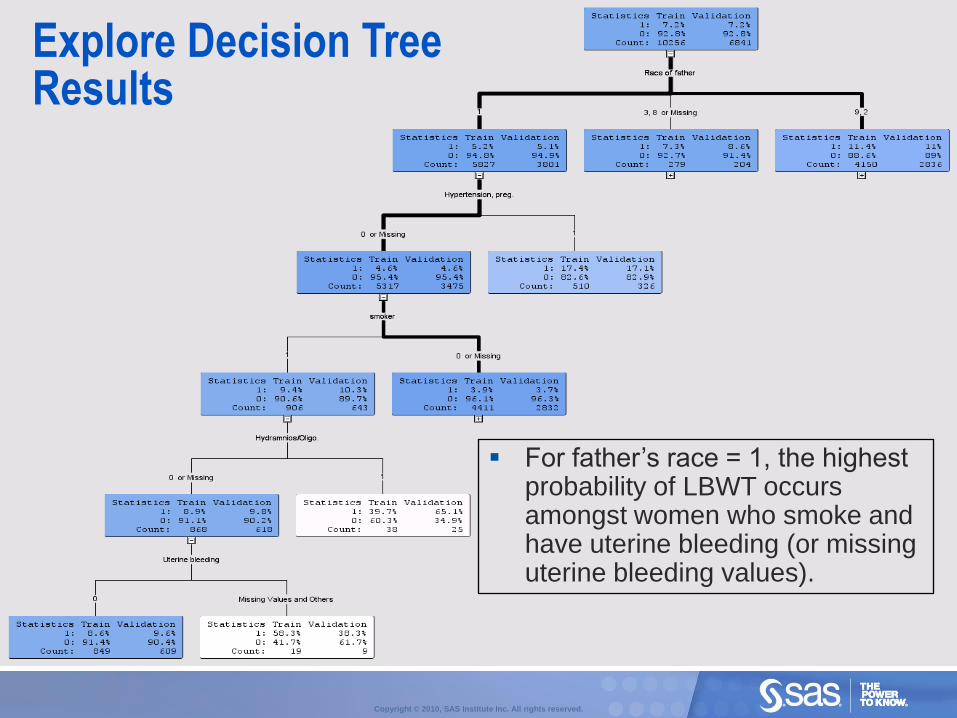
Explore Decision Tree Results
For father‟s race = 1, the highest probability of LBWT occurs amongst women who smoke and have uterine bleeding (or missing uterine bleeding values).
36
Copyright © 2010, SAS Institute Inc. All rights reserved.
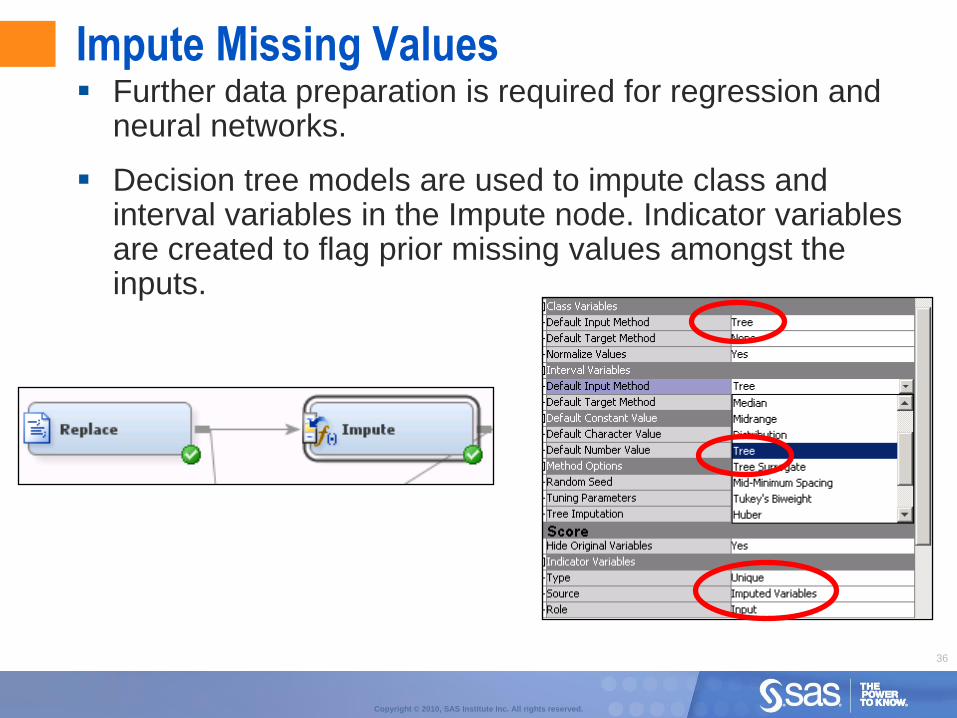
Impute Missing Values Further data preparation is required for regression and
neural networks.
Decision tree models are used to impute class and interval variables in the Impute node. Indicator variables are created to flag prior missing values amongst the inputs.
37
Copyright © 2010, SAS Institute Inc. All rights reserved.
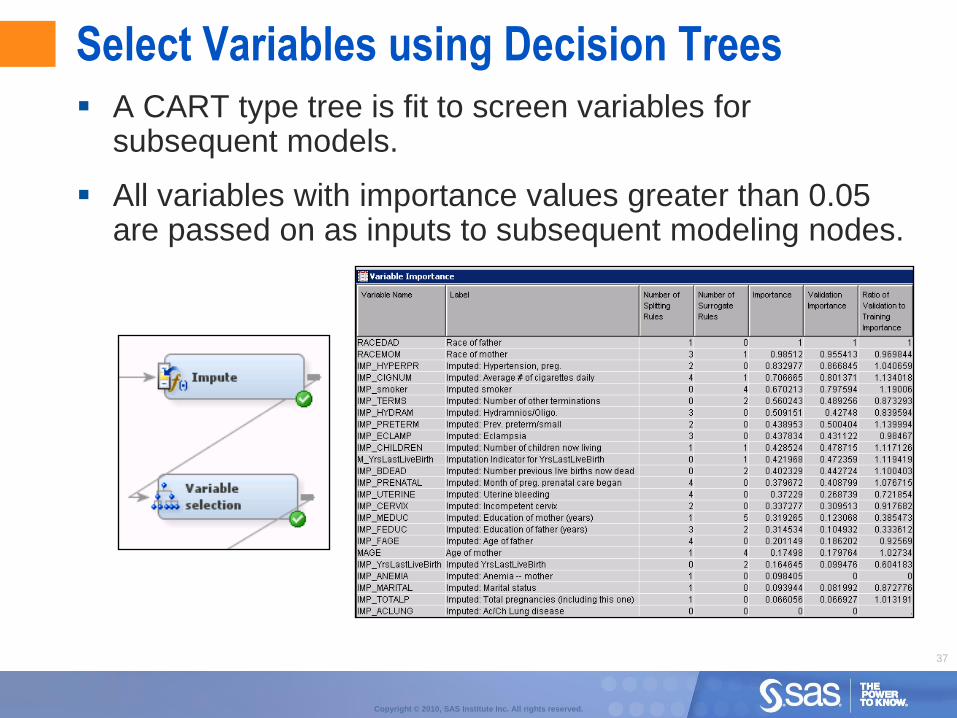
Select Variables using Decision Trees
A CART type tree is fit to screen variables for subsequent models.
All variables with importance values greater than 0.05 are passed on as inputs to subsequent modeling nodes.
38
Copyright © 2010, SAS Institute Inc. All rights reserved.
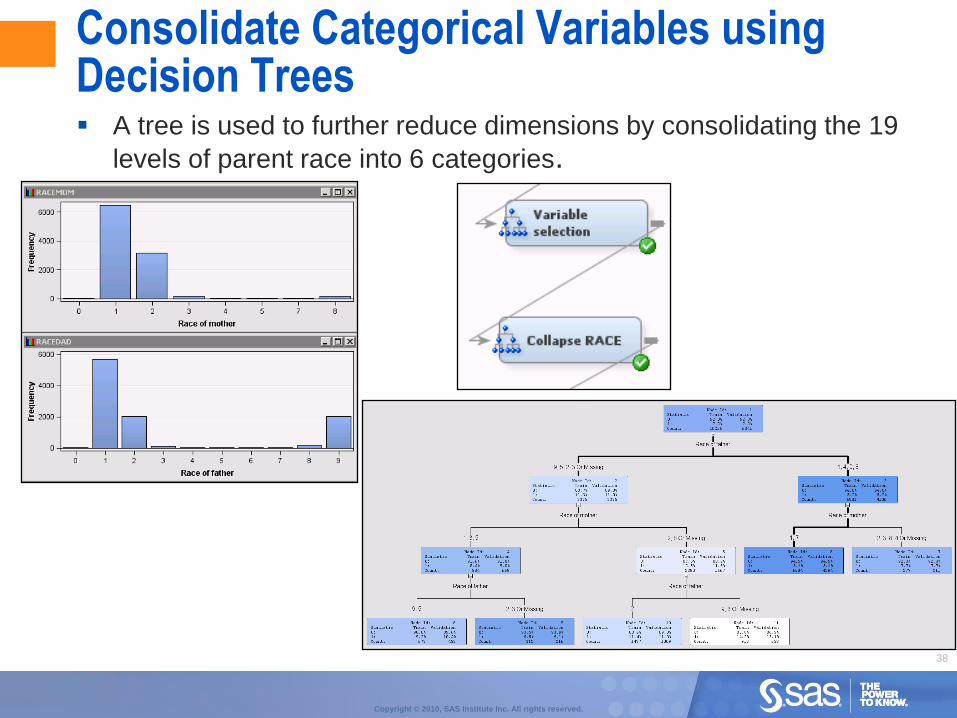
Consolidate Categorical Variables using Decision Trees A tree is used to further reduce dimensions by consolidating the 19
levels of parent race into 6 categories.
39
Copyright © 2010, SAS Institute Inc. All rights reserved.
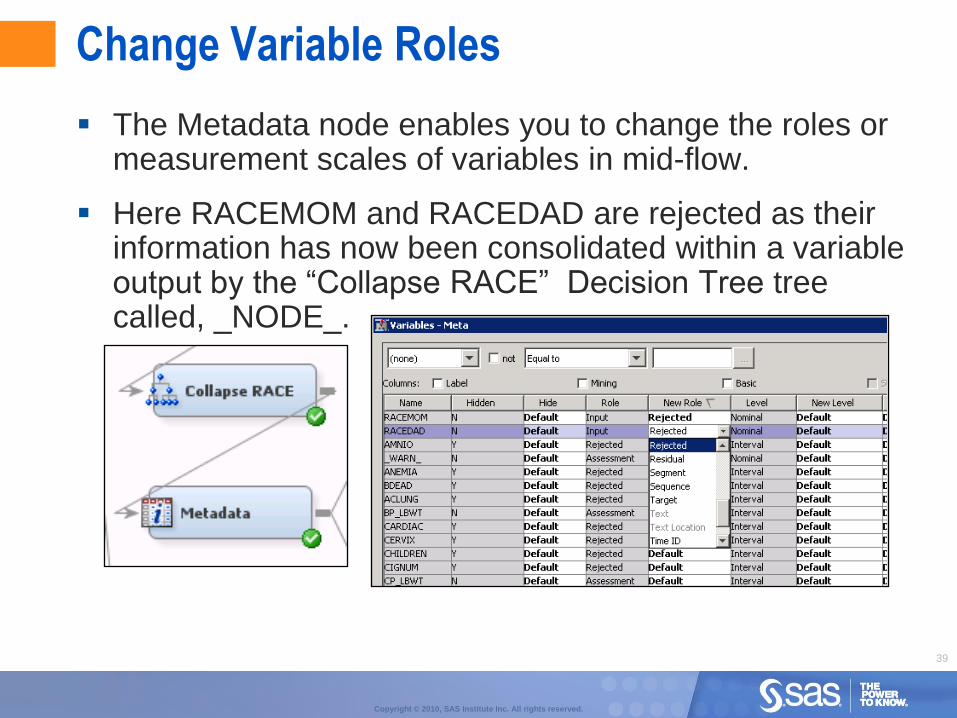
Change Variable Roles
The Metadata node enables you to change the roles or measurement scales of variables in mid-flow.
Here RACEMOM and RACEDAD are rejected as their information has now been consolidated within a variable output by the “Collapse RACE” Decision Tree treecalled, _NODE_.
40
Copyright © 2010, SAS Institute Inc. All rights reserved.
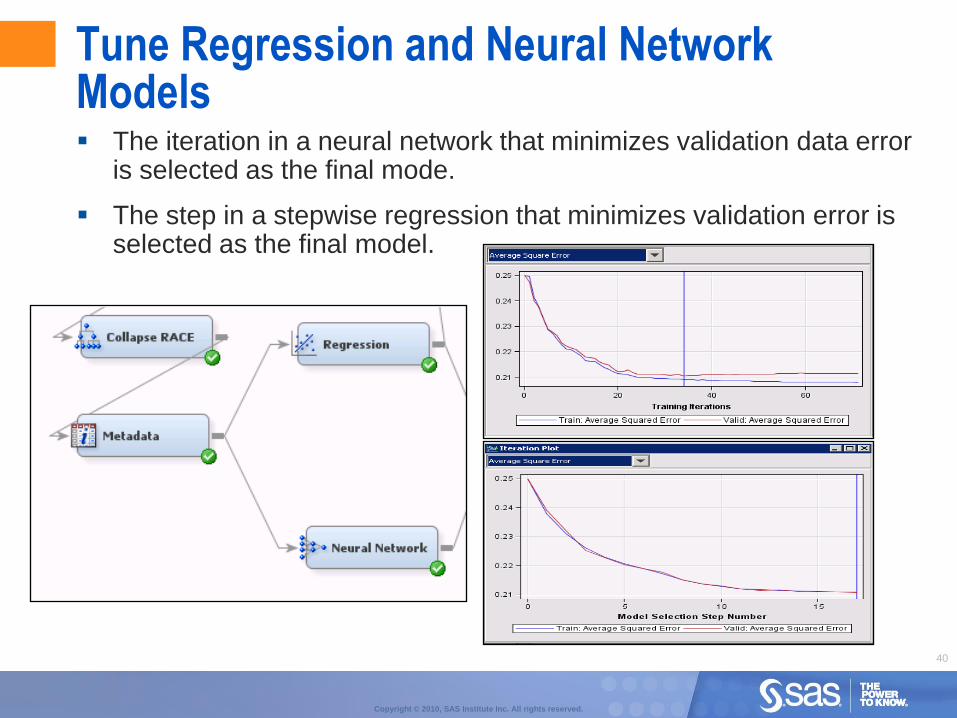
Tune Regression and Neural Network Models The iteration in a neural network that minimizes validation data error
is selected as the final mode.
The step in a stepwise regression that minimizes validation error is selected as the final model.
41
Copyright © 2010, SAS Institute Inc. All rights reserved.
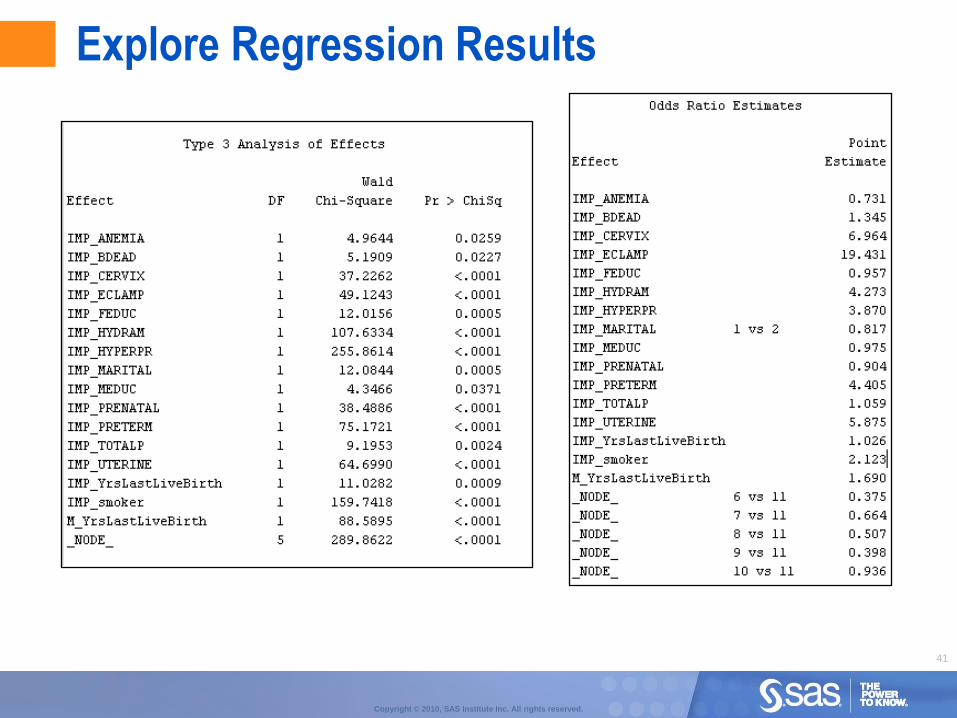
Explore Regression Results
42
Copyright © 2010, SAS Institute Inc. All rights reserved.
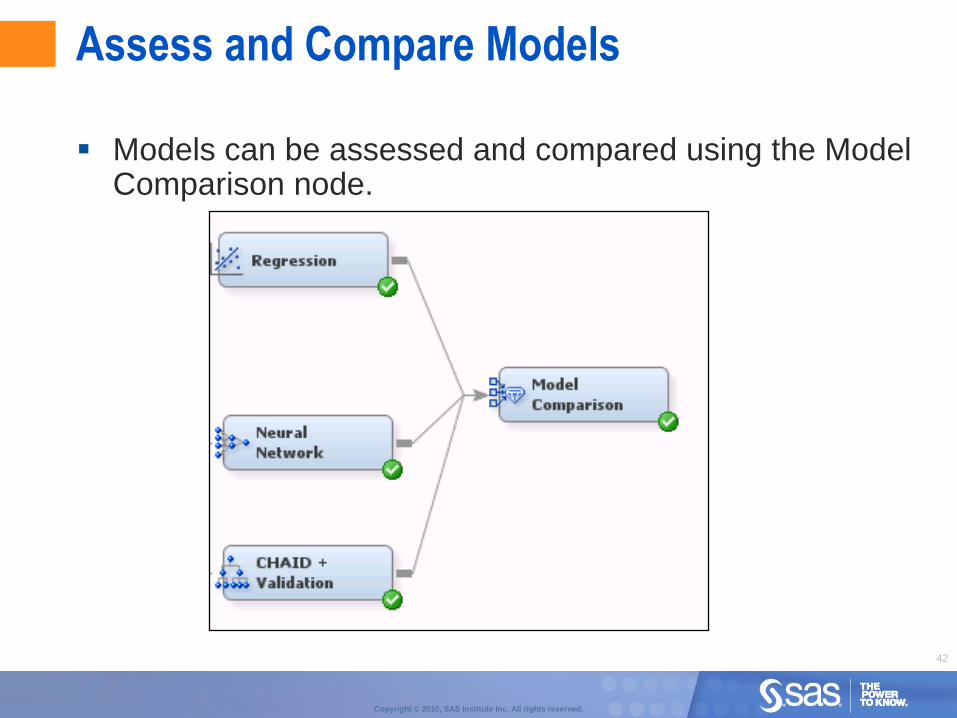
Assess and Compare Models
Models can be assessed and compared using the Model Comparison node.
43
Copyright © 2010, SAS Institute Inc. All rights reserved.
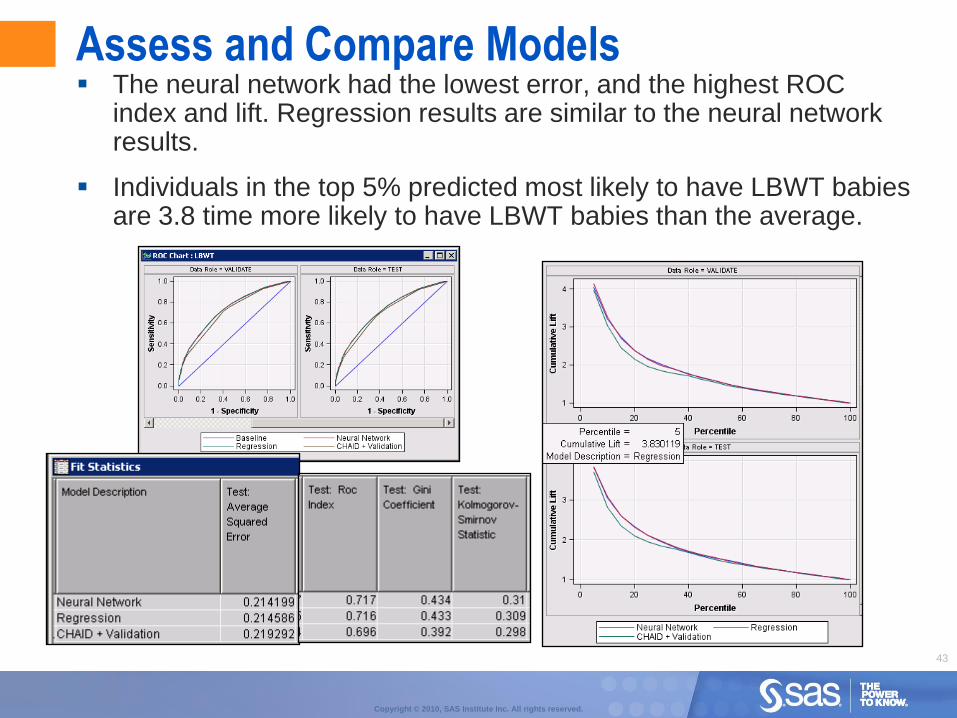
Assess and Compare Models The neural network had the lowest error, and the highest ROC
index and lift. Regression results are similar to the neural network results.
Individuals in the top 5% predicted most likely to have LBWT babies are 3.8 time more likely to have LBWT babies than the average.
44
Copyright © 2010, SAS Institute Inc. All rights reserved.
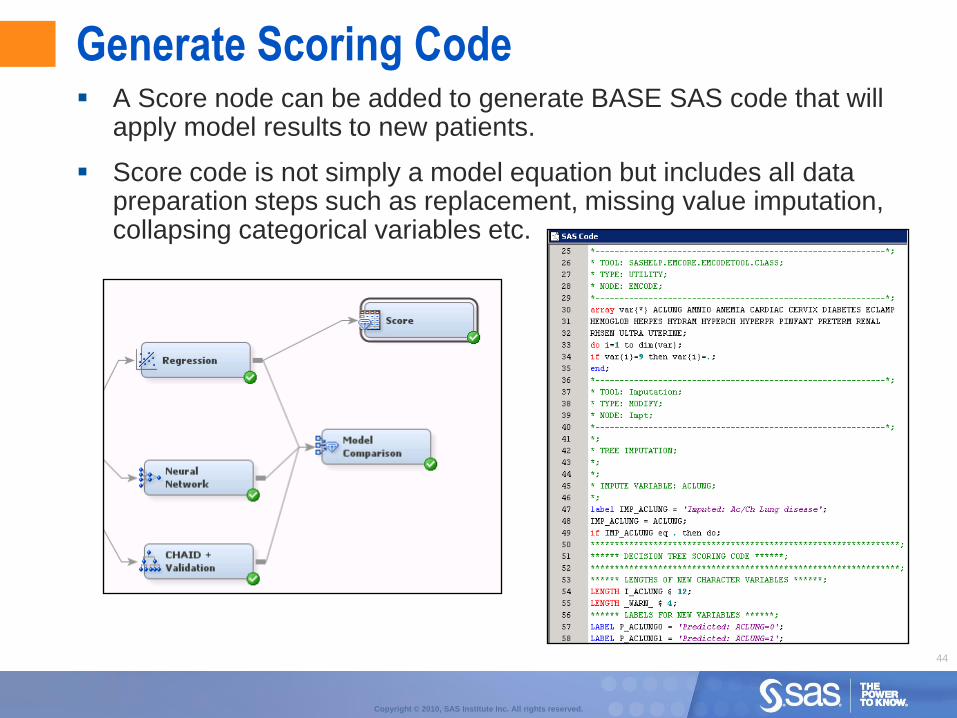
Generate Scoring Code A Score node can be added to generate BASE SAS code that will
apply model results to new patients.
Score code is not simply a model equation but includes all data preparation steps such as replacement, missing value imputation, collapsing categorical variables etc.
45
Copyright © 2010, SAS Institute Inc. All rights reserved.
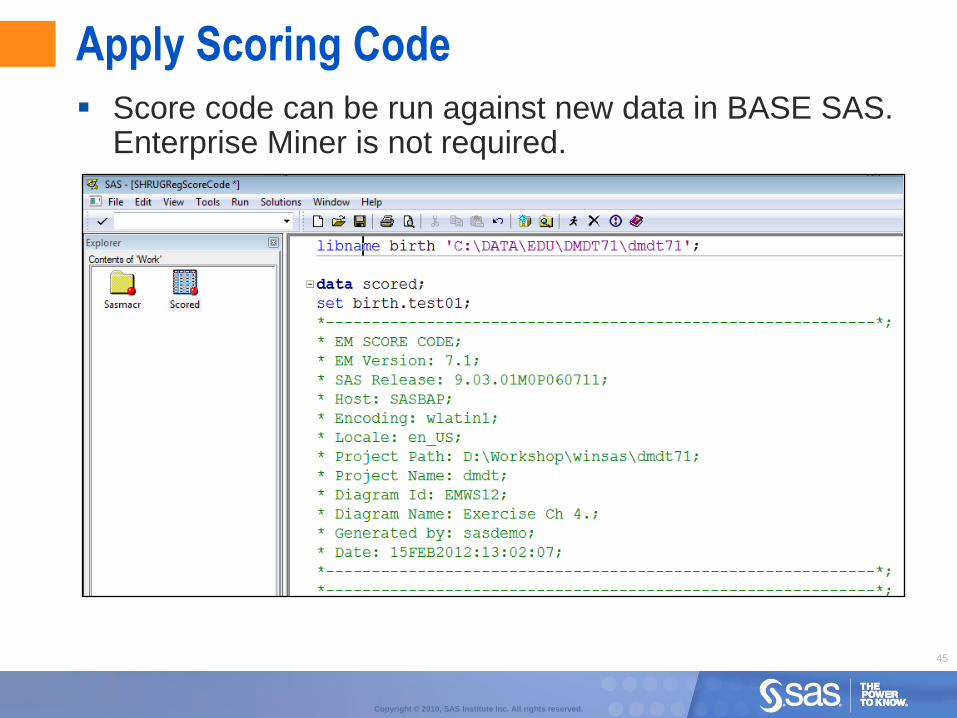
Score code can be run against new data in BASE SAS. Enterprise Miner is not required.
Apply Scoring Code
46
Copyright © 2010, SAS Institute Inc. All rights reserved.
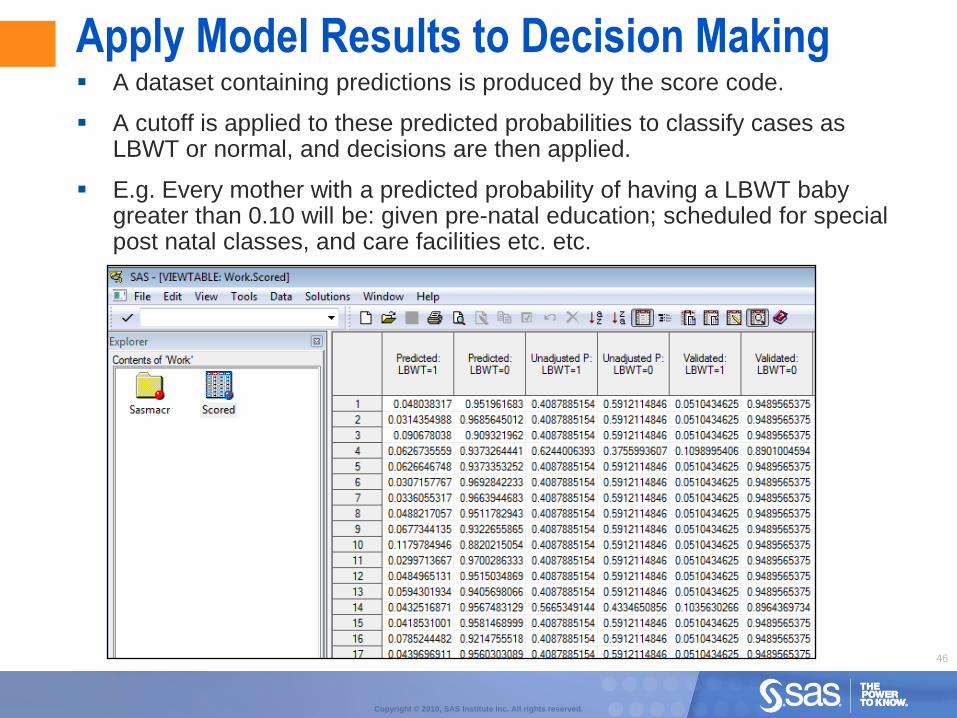
Apply Model Results to Decision Making A dataset containing predictions is produced by the score code.
A cutoff is applied to these predicted probabilities to classify cases as LBWT or normal, and decisions are then applied.
E.g. Every mother with a predicted probability of having a LBWT baby greater than 0.10 will be: given pre-natal education; scheduled for special post natal classes, and care facilities etc. etc.

Copyright © 2010 SAS Institute Inc. All rights reserved.
THANK YOU Lorne RothmanPrincipal StatisticianSAS Institute (Canada) [email protected]