Embed Size (px)
Citation preview
Data, Models and Model Calibration
Qingyun Duan
GCESS/Beijing Normal University
October 26, 2016
Global Conference on “G‐WADI more than a decade enhancing water and sustainable development for arid regions”, Beijing, China, October 25‐27, 2016
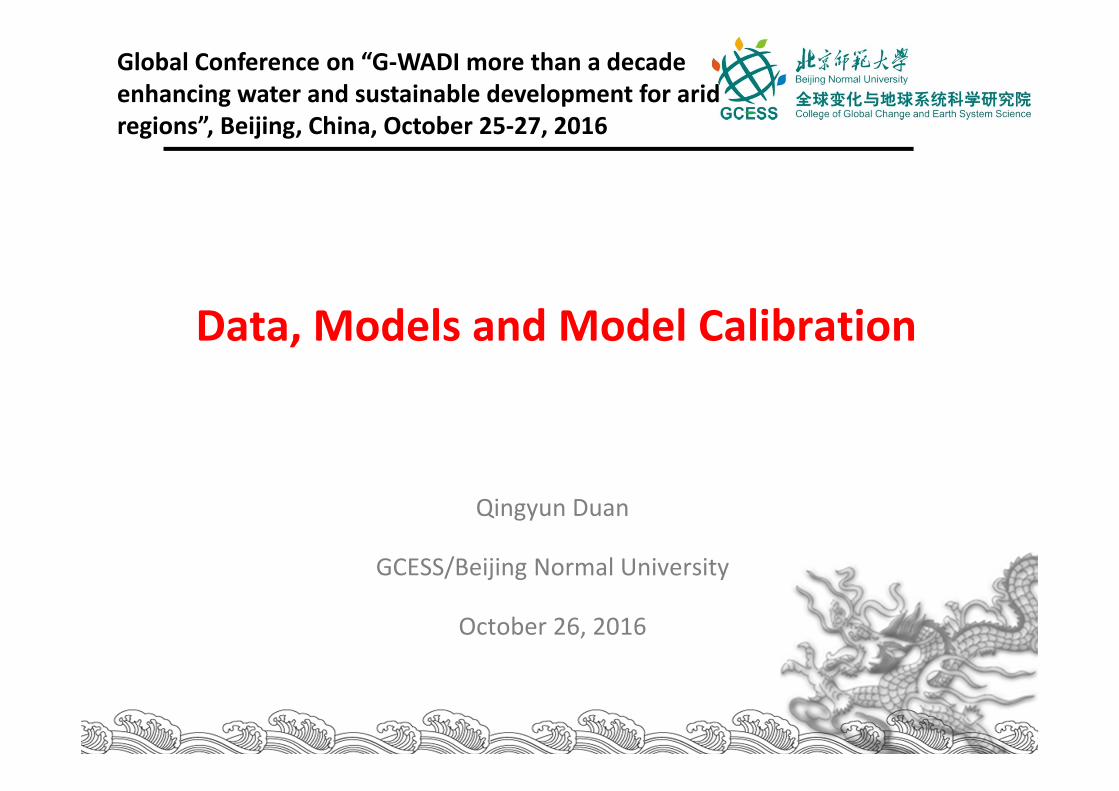
A Plethora of Hydrological Models with Different Aims and Complexities
IN T E R F L O WS U R FA C ER U N O F F
IN F ILT R A T IO NT E N S IO N
T E N S IO N T E N S IO N
P E R C O L A T IO N
L O W E RZ O N E
U P P E RZ O N E
P R IM A R YF R E E
S U P P L E -M E N T A L
F R E E
R E S E R V E D R E S E R V E D
F R E E
E V A P O T R A N S P IR A T IO N
B A S E F L O W
S U B S U R FA C EO U T F L O W
D IR E C TR U N O F F
P re c ip ita t io n
QB
QR
t
q
t
F ‐ Interception
Surface Runoff
Streamflow Discharge
P
API ‐Model Sacramento Model
VIC Model Mike‐SHE Model
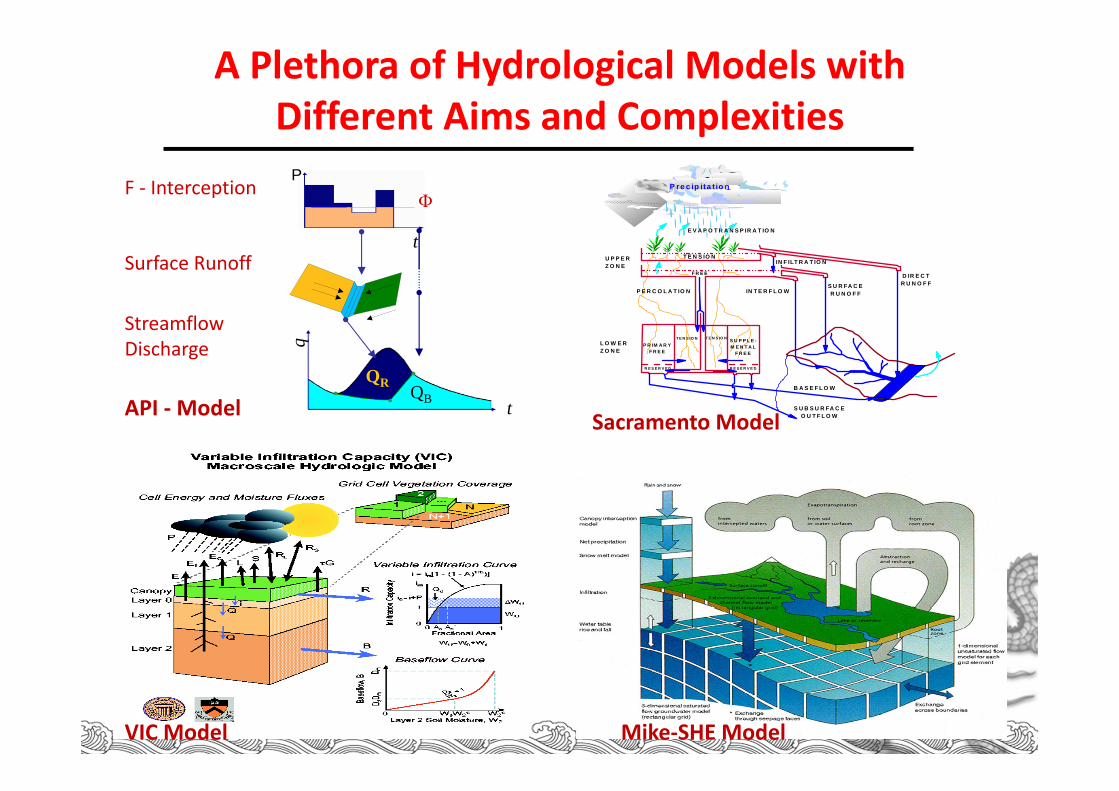
How to Improve the Performance of Weather/Climate Models?
• Enhance the Model Physics– Better models– Higher space/time resolution– Better numerical schemes
• Enhance the Representations of External Forcings and Boundary Conditions– Better Observational Systems – Better Data Assimilation Methods
• Enhance the Estimation of Model Parameters– Quantifying parameter uncertainties– Tuning model parameters so simulations match observations
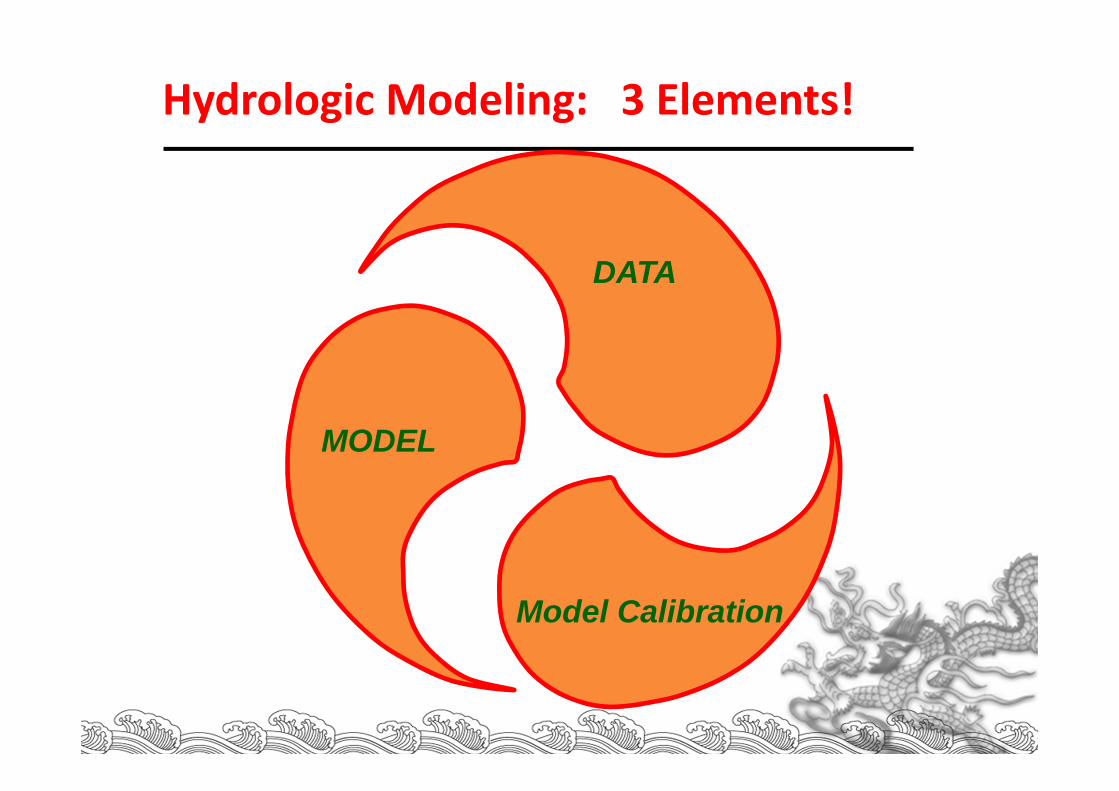
MODEL
Model Calibration
DATA
Hydrologic Modeling: 3 Elements!
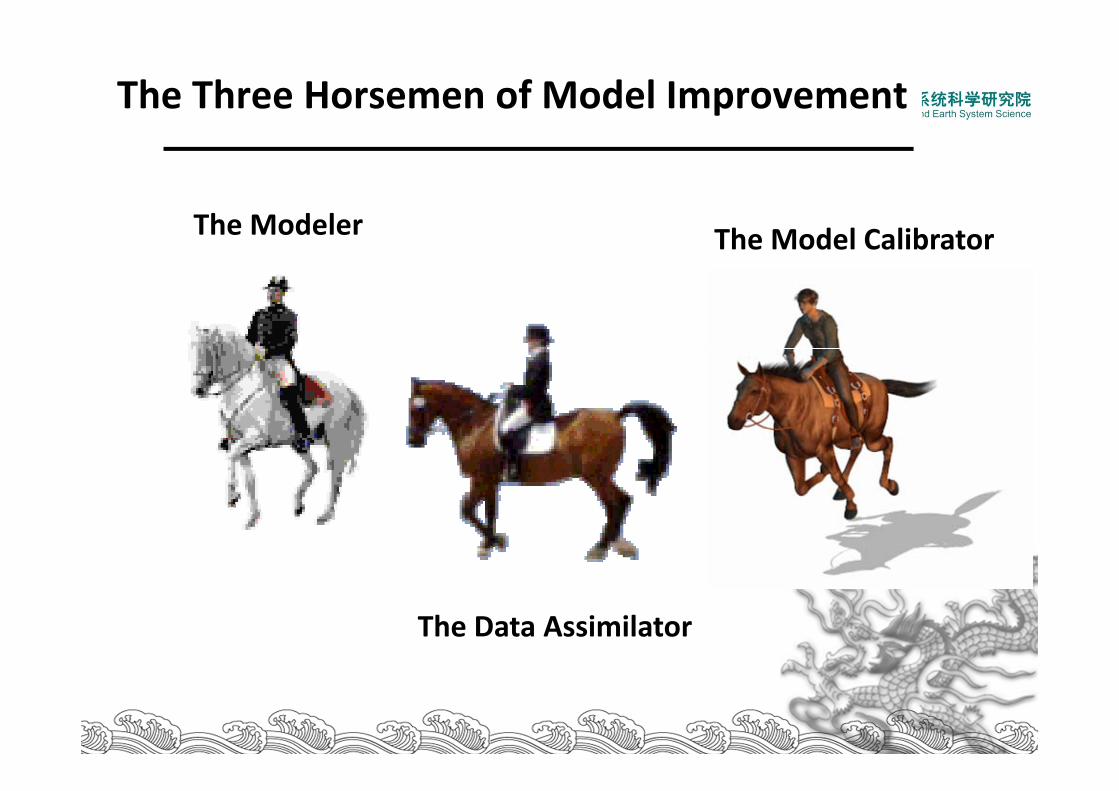
The Three Horsemen of Model Improvement
The Modeler
The Data Assimilator
The Model Calibrator
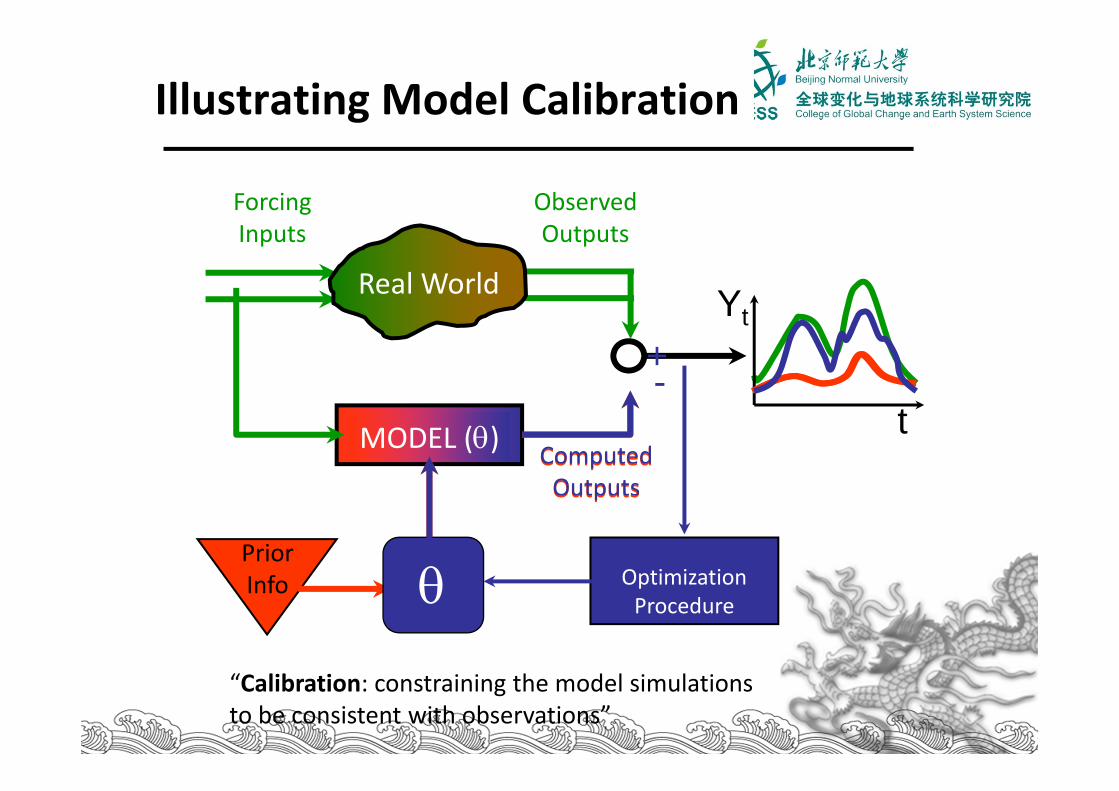
Illustrating Model Calibration
ObservedOutputs
Yt
t
Real World
ForcingInputs
MODEL ()ComputedOutputs
PriorInfo
ComputedOutputs
+-
OptimizationProcedure
“Calibration: constraining the model simulations to be consistent with observations”
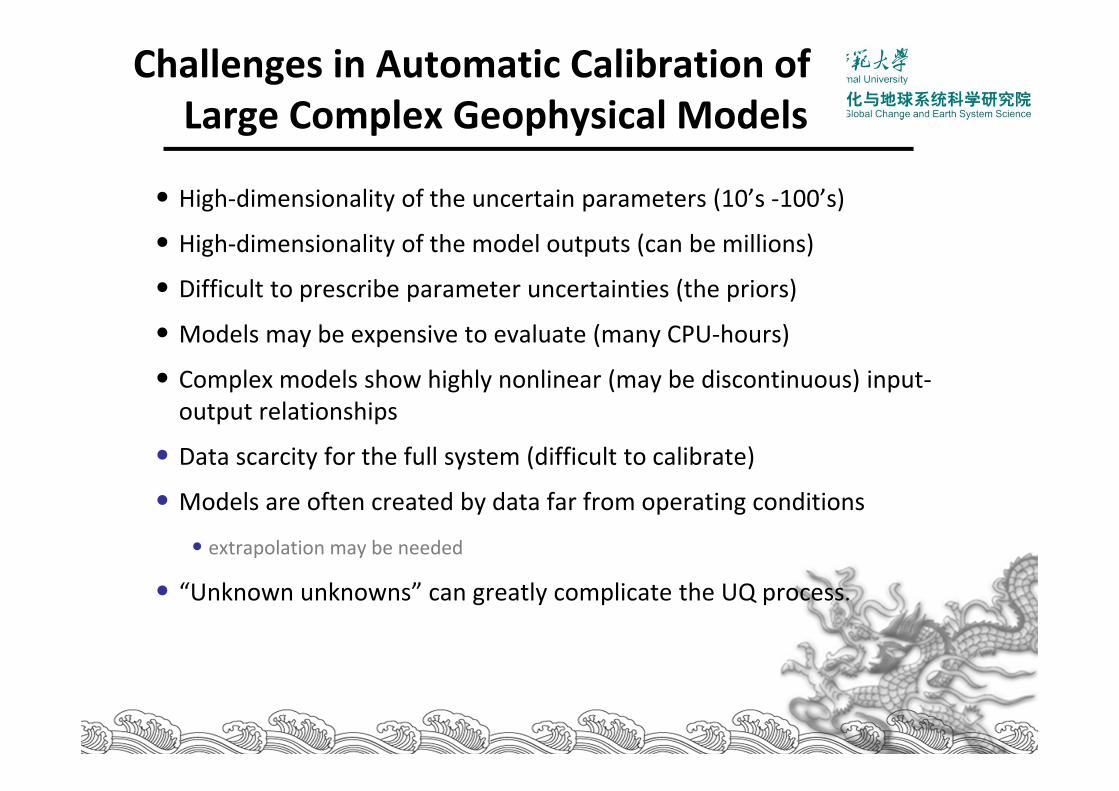
Challenges in Automatic Calibration of Large Complex Geophysical Models
• High‐dimensionality of the uncertain parameters (10’s ‐100’s)
• High‐dimensionality of the model outputs (can be millions)
• Difficult to prescribe parameter uncertainties (the priors)
• Models may be expensive to evaluate (many CPU‐hours)
• Complex models show highly nonlinear (may be discontinuous) input‐output relationships
• Data scarcity for the full system (difficult to calibrate)
• Models are often created by data far from operating conditions
• extrapolation may be needed
• “Unknown unknowns” can greatly complicate the UQ process.
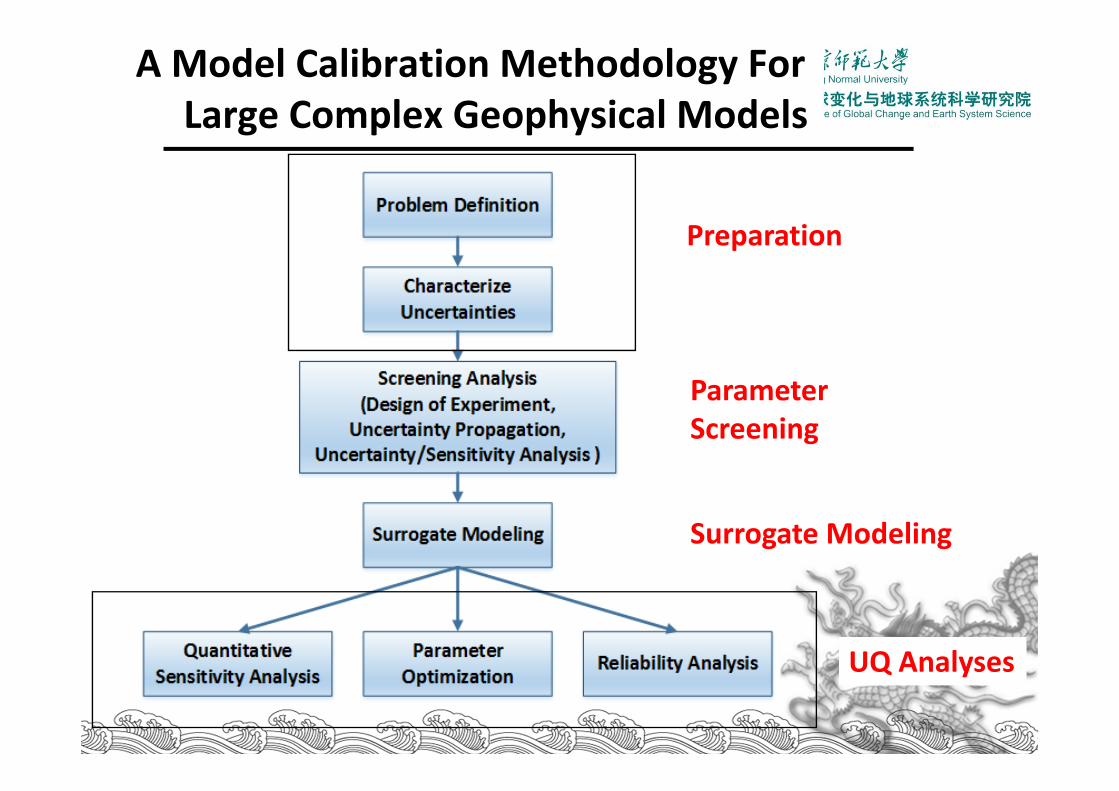
A Model Calibration Methodology For Large Complex Geophysical Models
Preparation
ParameterScreening
Surrogate Modeling
UQ Analyses

Uncertainty Quantification Python Laboratory (UQ‐PyL)
http://uq‐pyl.com
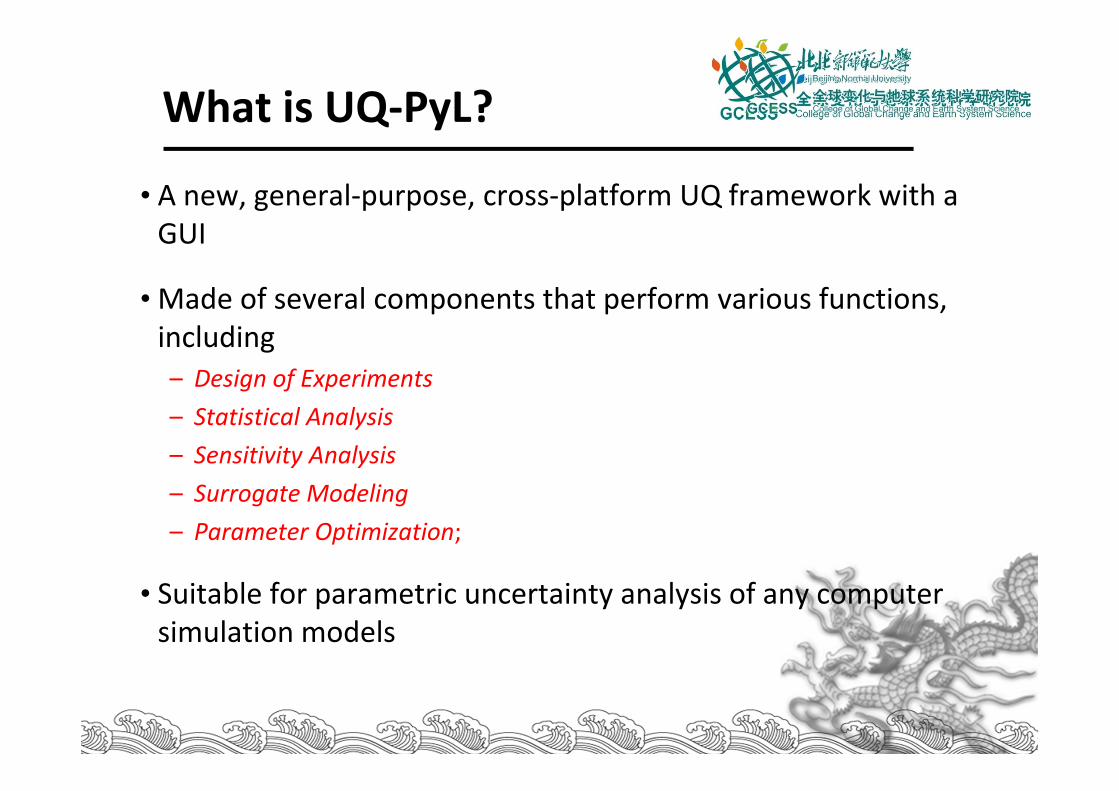
What is UQ‐PyL?
• A new, general‐purpose, cross‐platform UQ framework with a GUI
• Made of several components that perform various functions, including – Design of Experiments– Statistical Analysis– Sensitivity Analysis– Surrogate Modeling– Parameter Optimization;
• Suitable for parametric uncertainty analysis of any computer simulation models

The Front‐page of UQ‐PyL
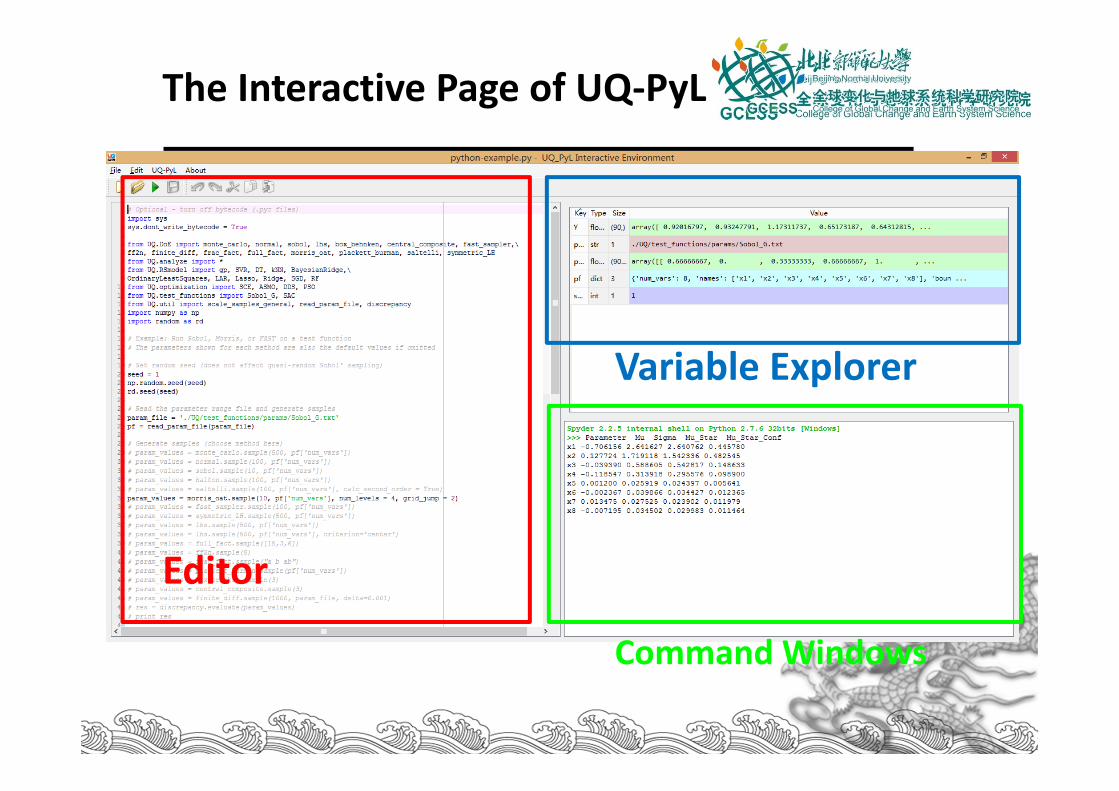
The Interactive Page of UQ‐PyL
Command Windows
Editor
Variable Explorer
ANALYSIS AND OPTIMIZATION OF PARAMETRIC UNCERTAINTY OF WRF MODEL
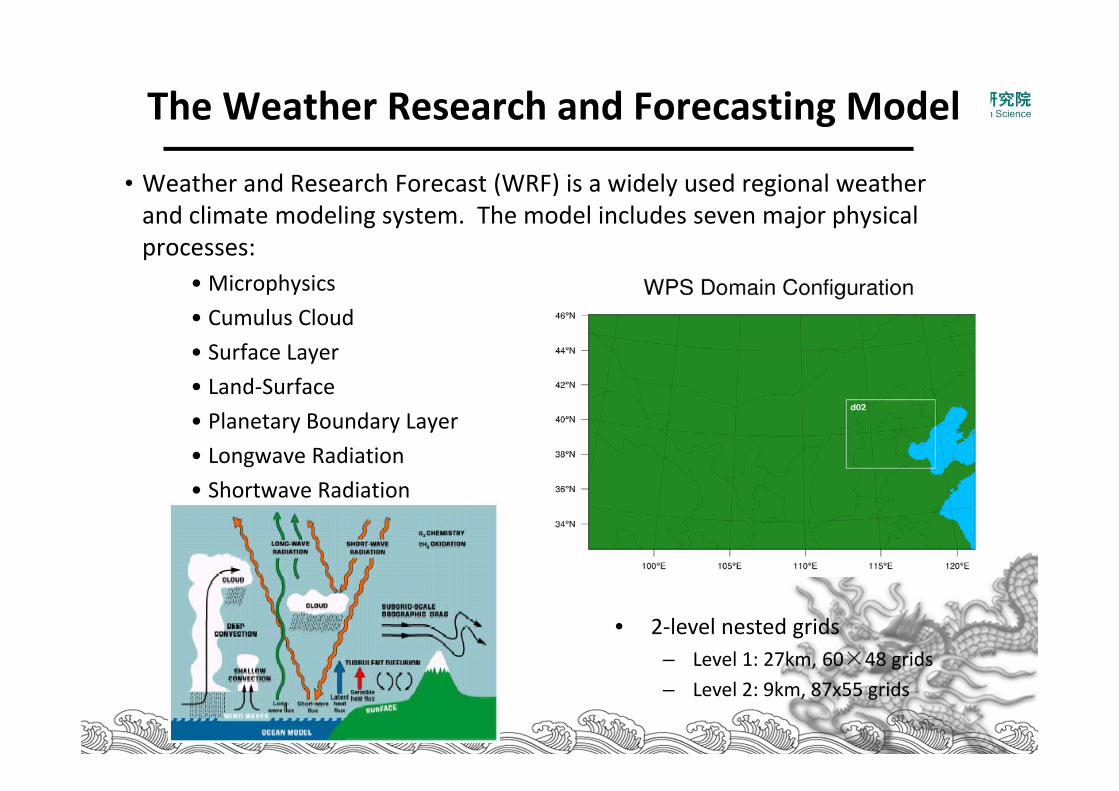
The Weather Research and Forecasting Model
• Weather and Research Forecast (WRF) is a widely used regional weather and climate modeling system. The model includes seven major physical processes:
• Microphysics • Cumulus Cloud• Surface Layer • Land‐Surface • Planetary Boundary Layer• Longwave Radiation• Shortwave Radiation
• 2‐level nested grids– Level 1: 27km, 60×48 grids– Level 2: 9km, 87x55 grids
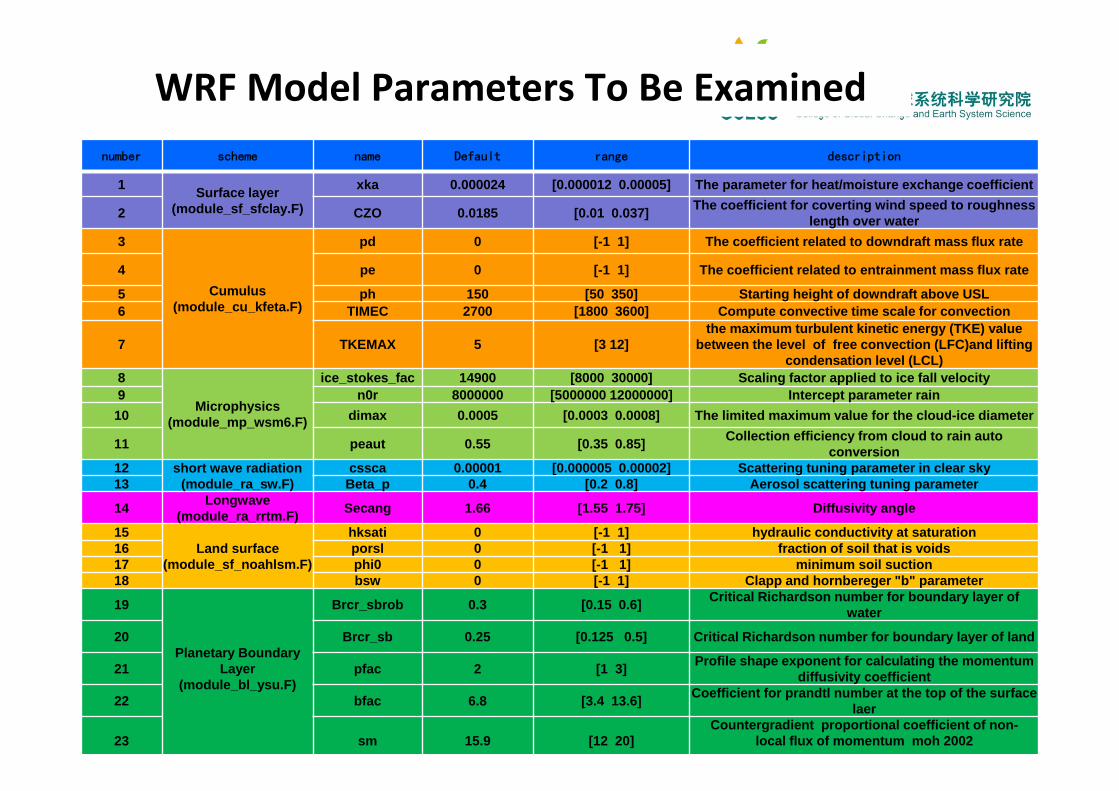
number scheme name Default range description
1 Surface layer (module_sf_sfclay.F)
xka 0.000024 [0.000012 0.00005] The parameter for heat/moisture exchange coefficient
2 CZO 0.0185 [0.01 0.037] The coefficient for coverting wind speed to roughness length over water
3
Cumulus(module_cu_kfeta.F)
pd 0 [-1 1] The coefficient related to downdraft mass flux rate
4 pe 0 [-1 1] The coefficient related to entrainment mass flux rate
5 ph 150 [50 350] Starting height of downdraft above USL6 TIMEC 2700 [1800 3600] Compute convective time scale for convection
7 TKEMAX 5 [3 12]the maximum turbulent kinetic energy (TKE) value
between the level of free convection (LFC)and lifting condensation level (LCL)
8
Microphysics(module_mp_wsm6.F)
ice_stokes_fac 14900 [8000 30000] Scaling factor applied to ice fall velocity 9 n0r 8000000 [5000000 12000000] Intercept parameter rain 10 dimax 0.0005 [0.0003 0.0008] The limited maximum value for the cloud-ice diameter
11 peaut 0.55 [0.35 0.85] Collection efficiency from cloud to rain auto conversion
12 short wave radiation(module_ra_sw.F)
cssca 0.00001 [0.000005 0.00002] Scattering tuning parameter in clear sky 13 Beta_p 0.4 [0.2 0.8] Aerosol scattering tuning parameter
14 Longwave(module_ra_rrtm.F) Secang 1.66 [1.55 1.75] Diffusivity angle
15Land surface
(module_sf_noahlsm.F)
hksati 0 [-1 1] hydraulic conductivity at saturation 16 porsl 0 [-1 1] fraction of soil that is voids 17 phi0 0 [-1 1] minimum soil suction 18 bsw 0 [-1 1] Clapp and hornbereger "b" parameter
19
Planetary Boundary Layer
(module_bl_ysu.F)
Brcr_sbrob 0.3 [0.15 0.6] Critical Richardson number for boundary layer of water
20 Brcr_sb 0.25 [0.125 0.5] Critical Richardson number for boundary layer of land
21 pfac 2 [1 3] Profile shape exponent for calculating the momentum diffusivity coefficient
22 bfac 6.8 [3.4 13.6] Coefficient for prandtl number at the top of the surface laer
23 sm 15.9 [12 20]Countergradient proportional coefficient of non-
local flux of momentum moh 2002
WRF Model Parameters To Be Examined
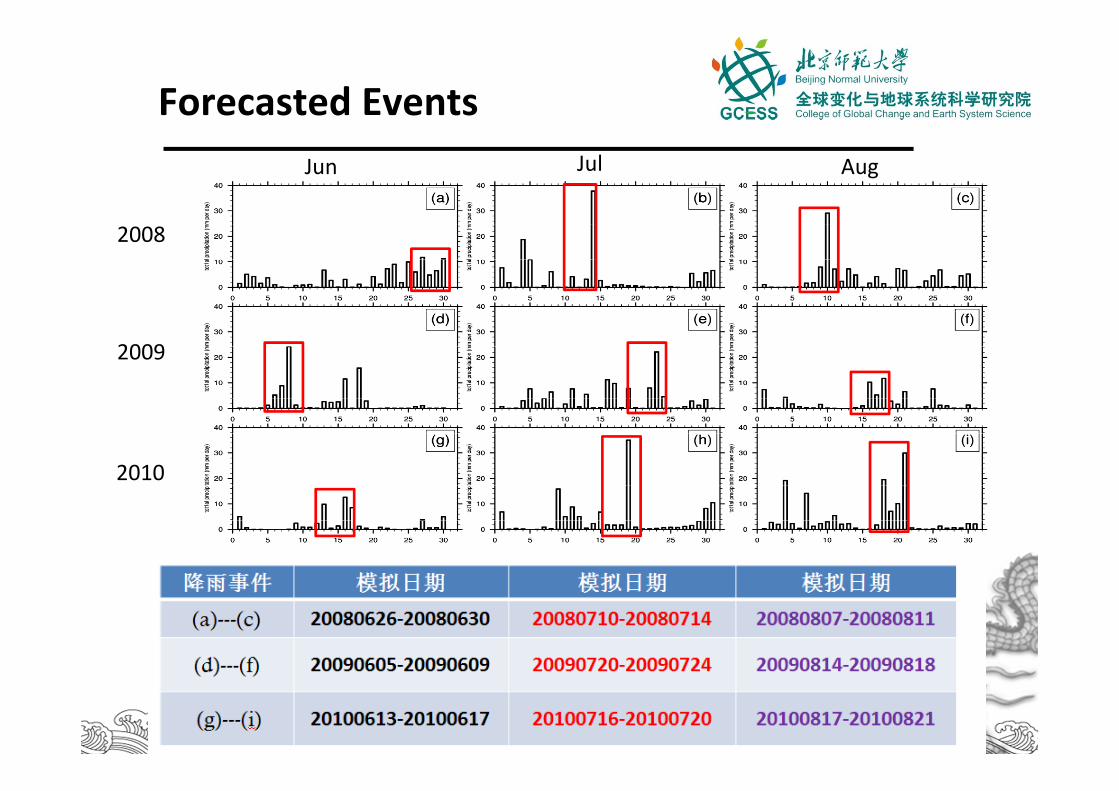
2008
2009
2010
Jun Jul Aug
Forecasted Events
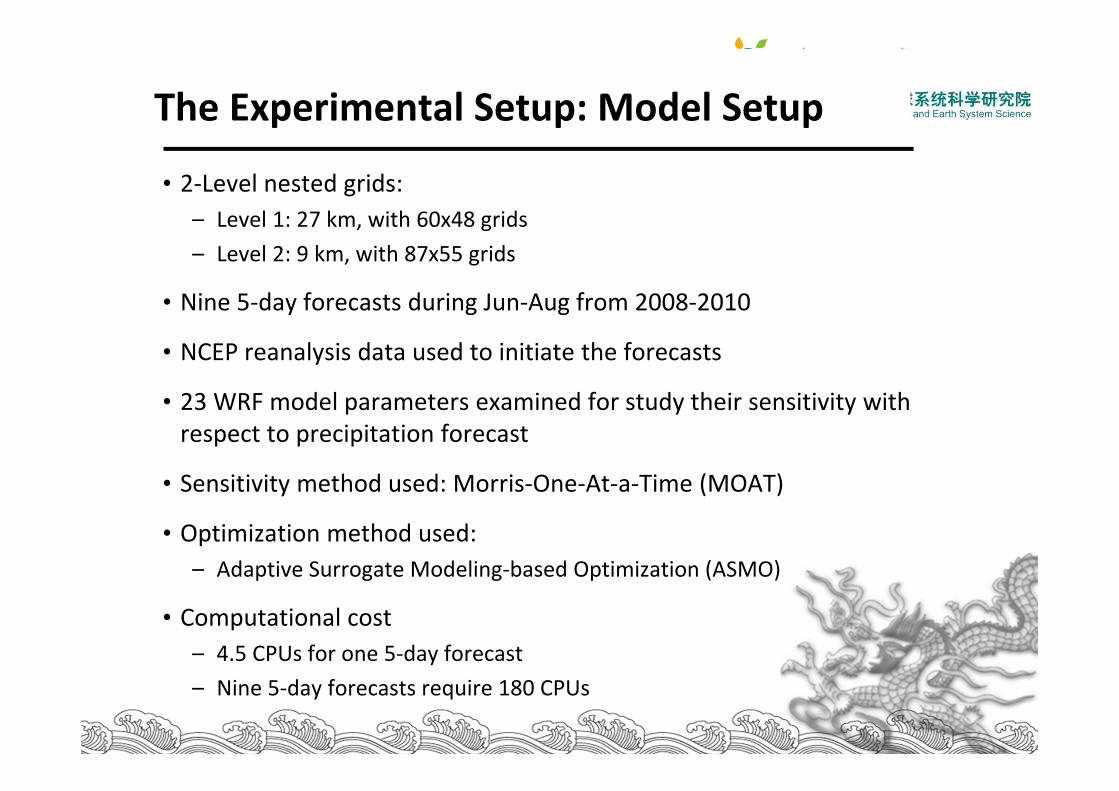
The Experimental Setup: Model Setup
• 2‐Level nested grids:– Level 1: 27 km, with 60x48 grids– Level 2: 9 km, with 87x55 grids
• Nine 5‐day forecasts during Jun‐Aug from 2008‐2010
• NCEP reanalysis data used to initiate the forecasts
• 23 WRF model parameters examined for study their sensitivity with respect to precipitation forecast
• Sensitivity method used: Morris‐One‐At‐a‐Time (MOAT)
• Optimization method used: – Adaptive Surrogate Modeling‐based Optimization (ASMO)
• Computational cost– 4.5 CPUs for one 5‐day forecast– Nine 5‐day forecasts require 180 CPUs
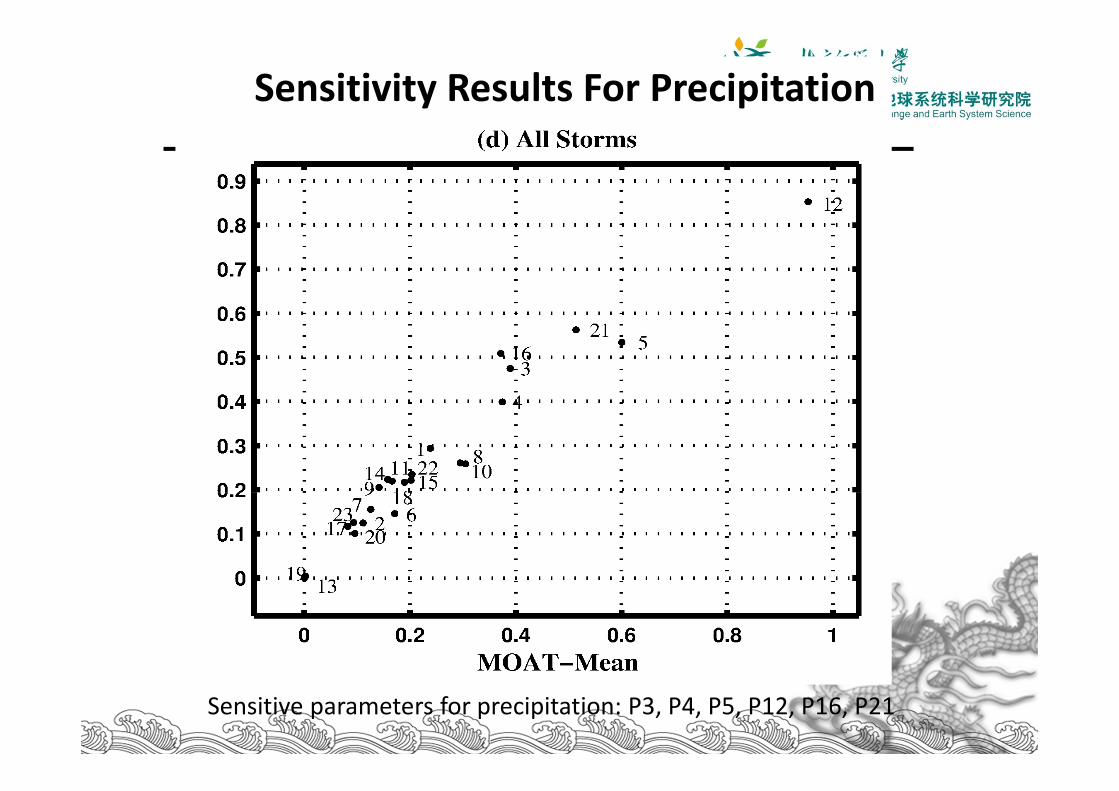
Sensitivity Results For Precipitation
Sensitive parameters for precipitation: P3, P4, P5, P12, P16, P21
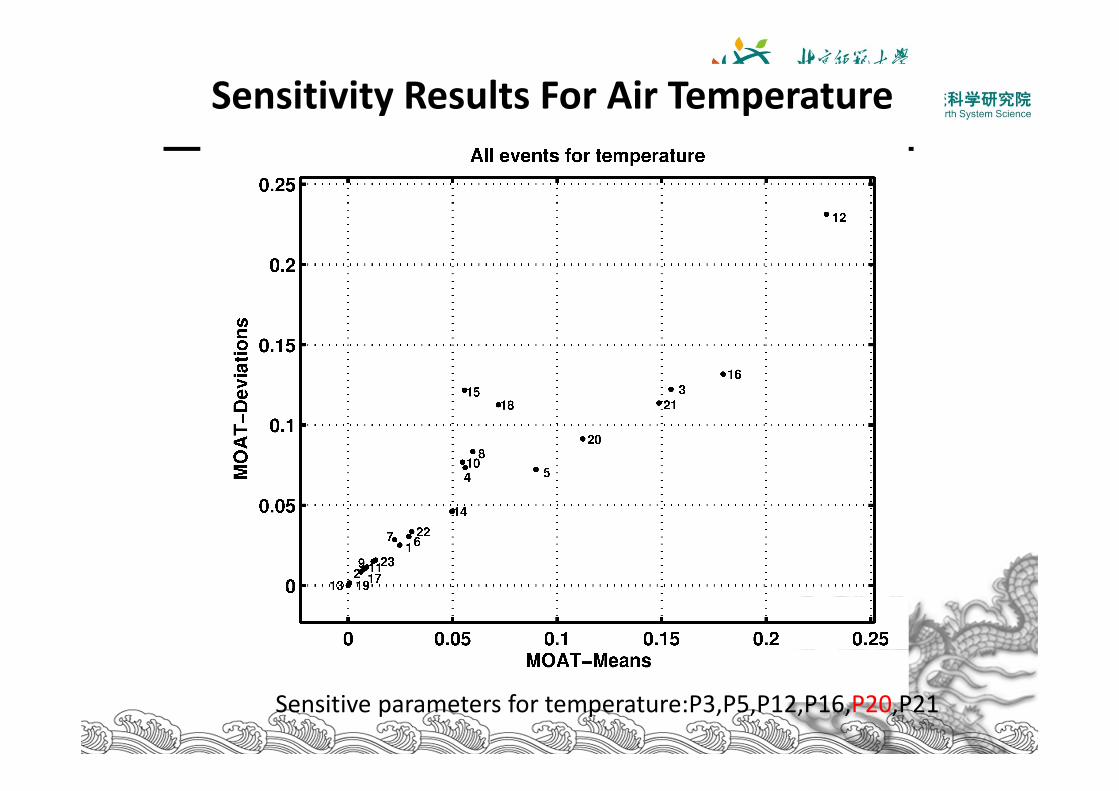
Sensitivity Results For Air Temperature
Sensitive parameters for temperature:P3,P5,P12,P16,P20,P21
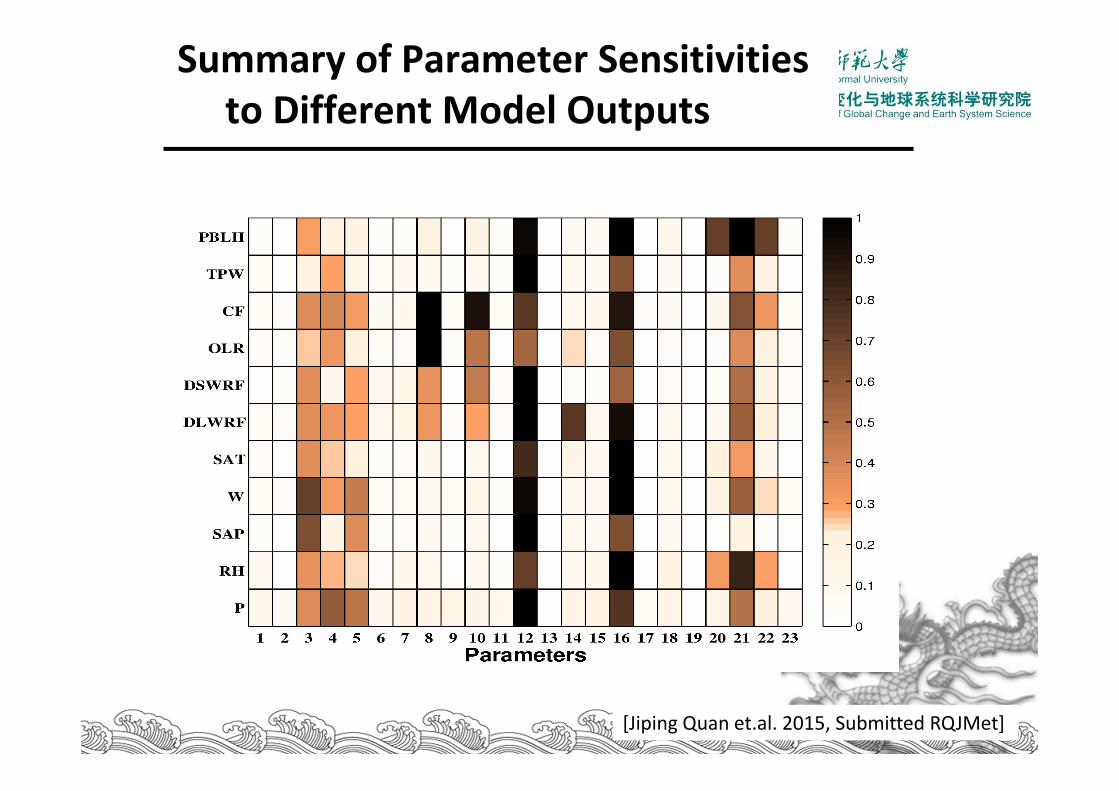
Summary of Parameter Sensitivitiesto Different Model Outputs
[Jiping Quan et.al. 2015, Submitted RQJMet]
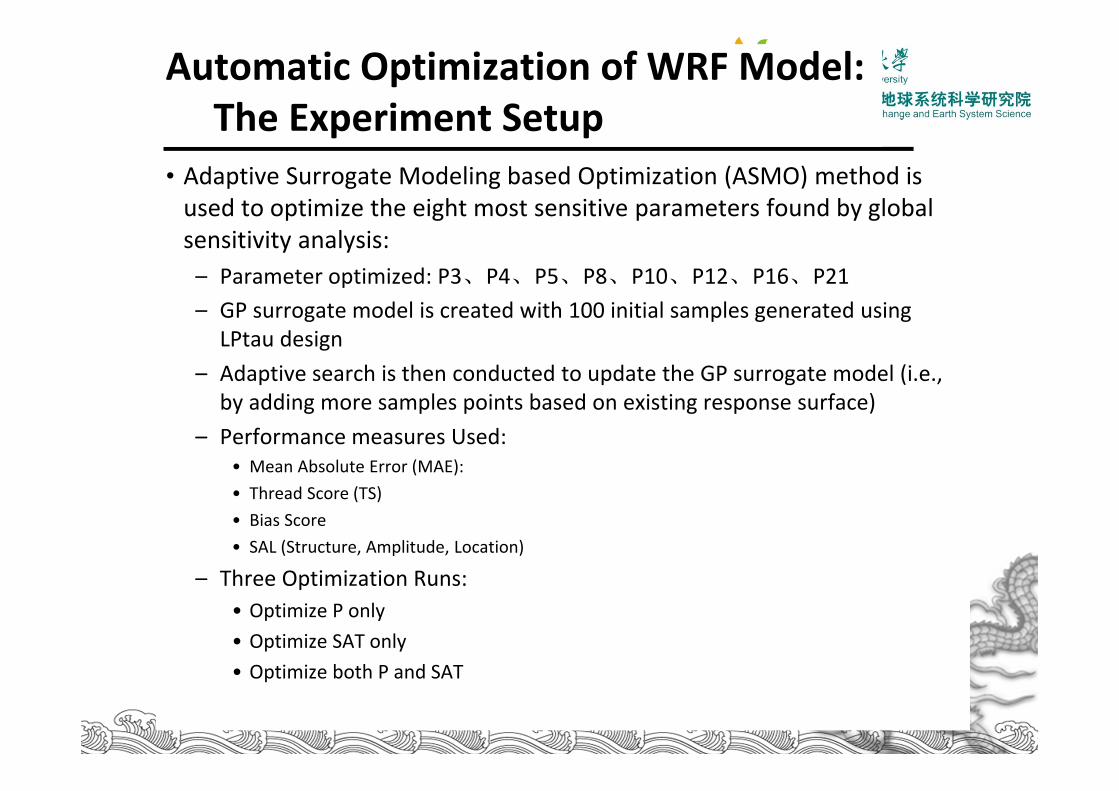
Automatic Optimization of WRF Model: The Experiment Setup
• Adaptive Surrogate Modeling based Optimization (ASMO) method is used to optimize the eight most sensitive parameters found by global sensitivity analysis:– Parameter optimized: P3、P4、P5、P8、P10、P12、P16、P21– GP surrogate model is created with 100 initial samples generated using
LPtau design– Adaptive search is then conducted to update the GP surrogate model (i.e.,
by adding more samples points based on existing response surface)– Performance measures Used:
• Mean Absolute Error (MAE):• Thread Score (TS)• Bias Score• SAL (Structure, Amplitude, Location)
– Three Optimization Runs:• Optimize P only• Optimize SAT only• Optimize both P and SAT
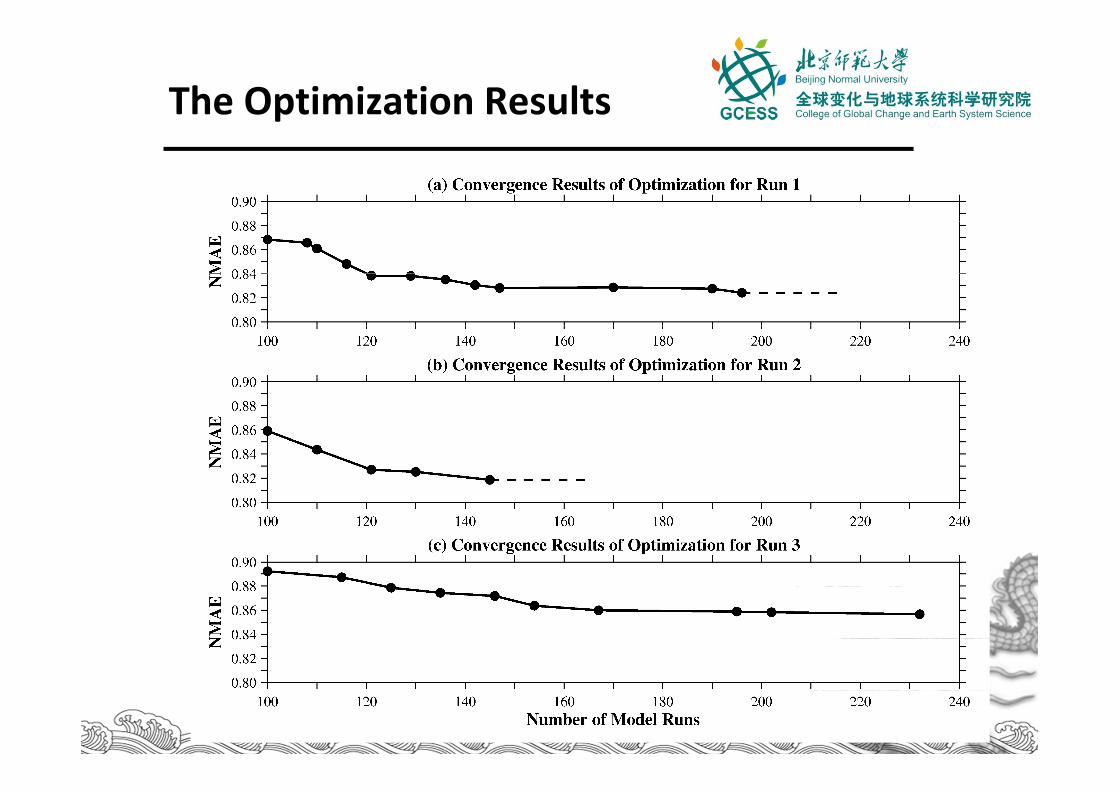
The Optimization Results
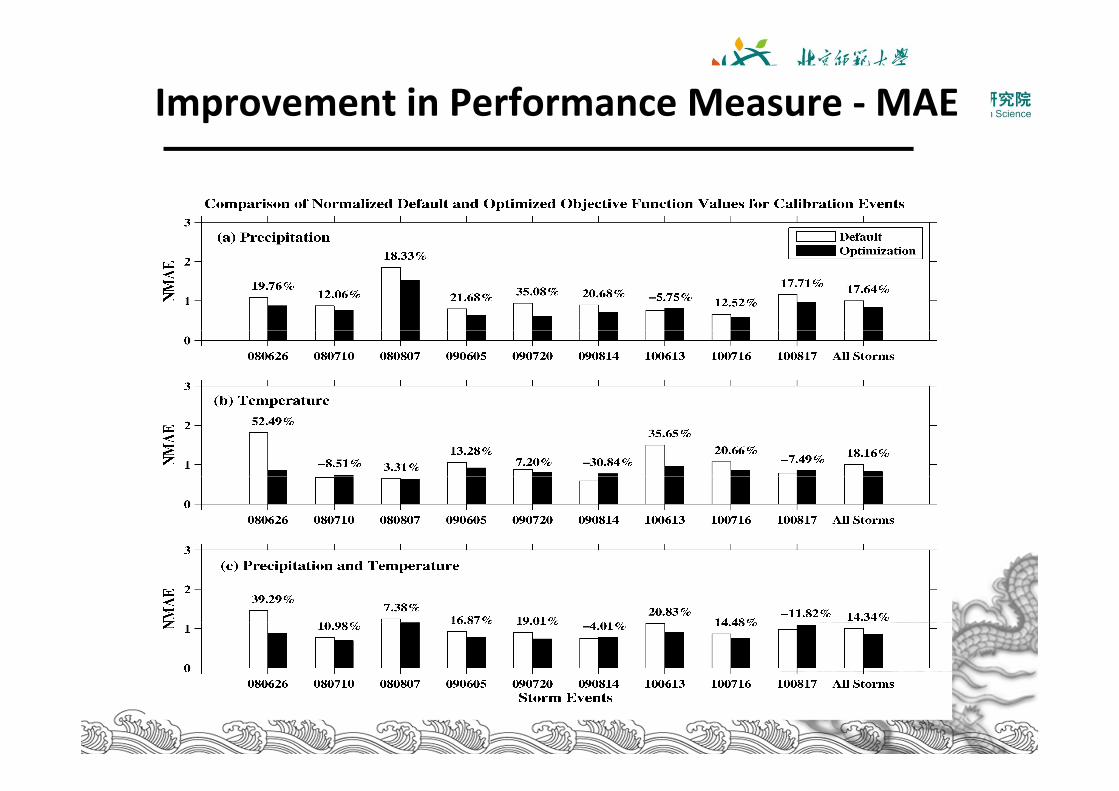
Improvement in Performance Measure ‐MAE
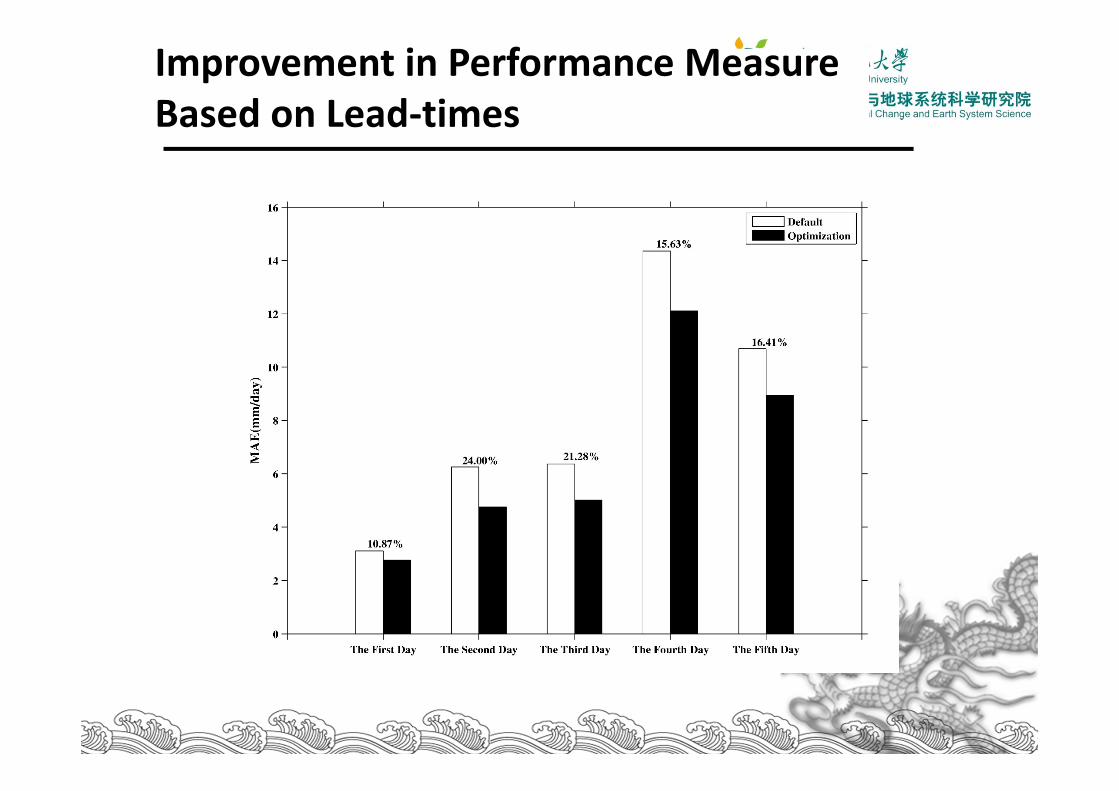
Improvement in Performance Measure Based on Lead‐times
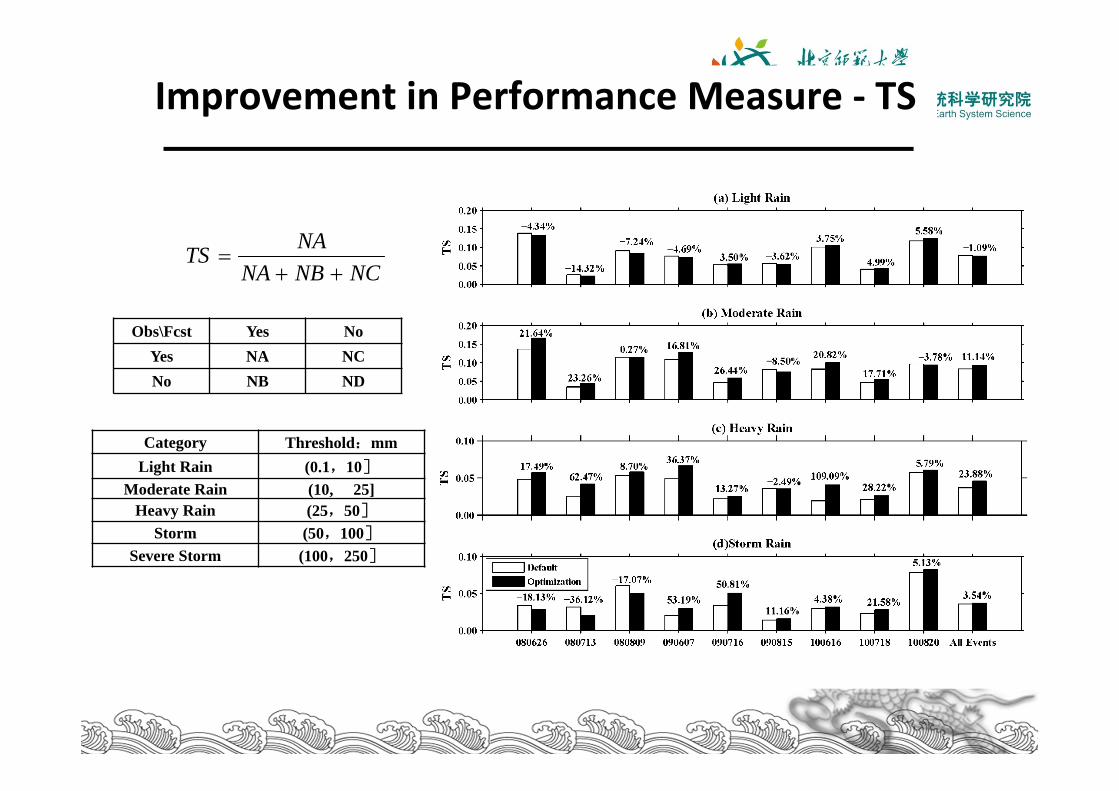
Improvement in Performance Measure ‐ TS
Obs\Fcst Yes NoYes NA NCNo NB ND
NCNBNANATS
Category Threshold:mmLight Rain (0.1,10]
Moderate Rain (10, 25]Heavy Rain (25,50]
Storm (50,100]Severe Storm (100,250]
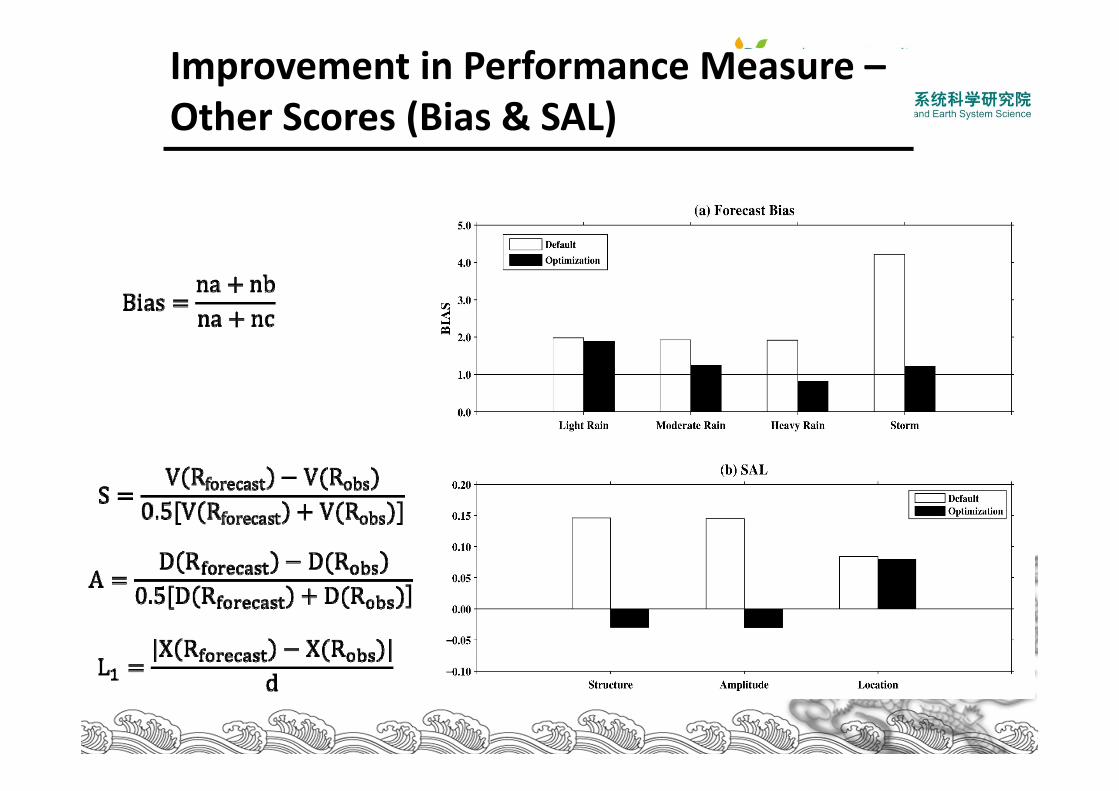
Improvement in Performance Measure –Other Scores (Bias & SAL)
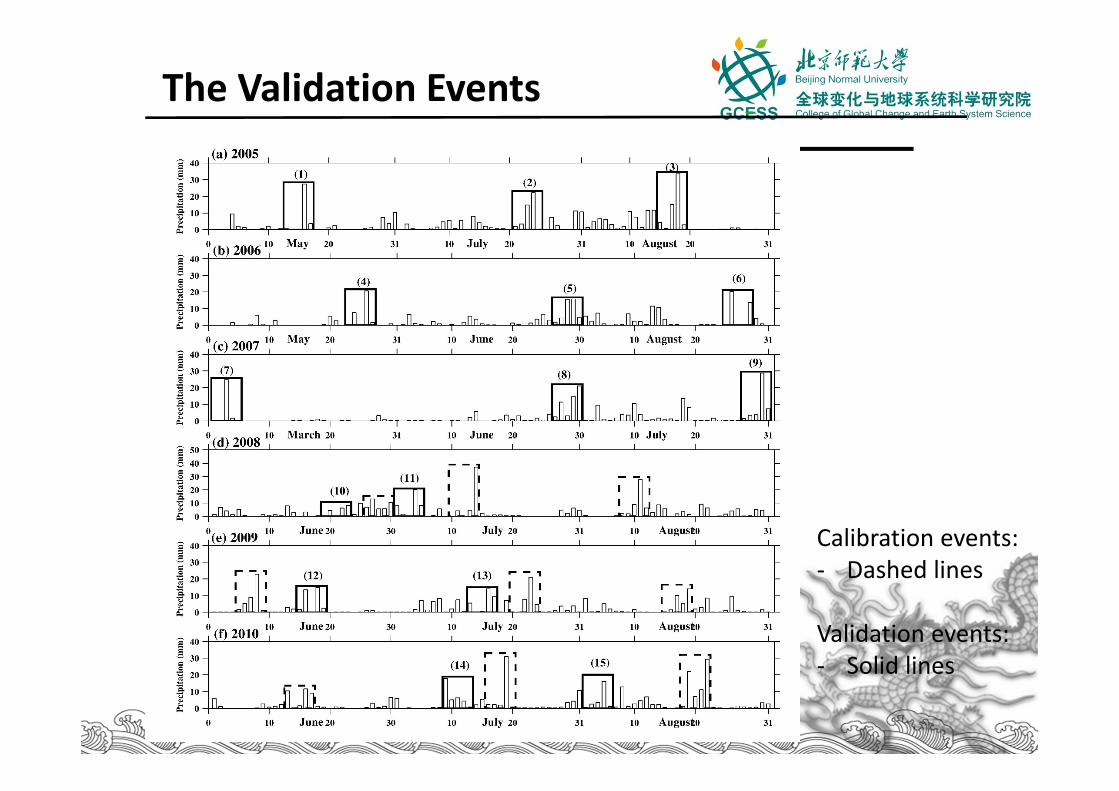
The Validation Events
Calibration events:‐ Dashed lines
Validation events:‐ Solid lines
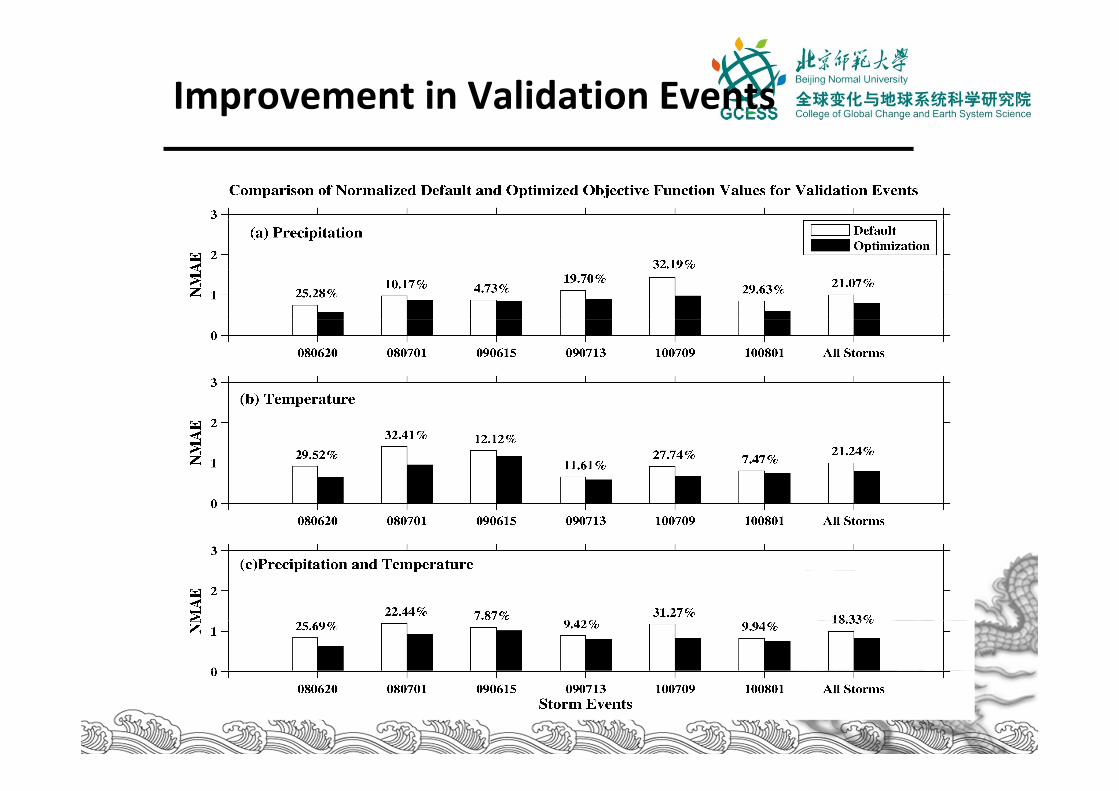
Improvement in Validation Events
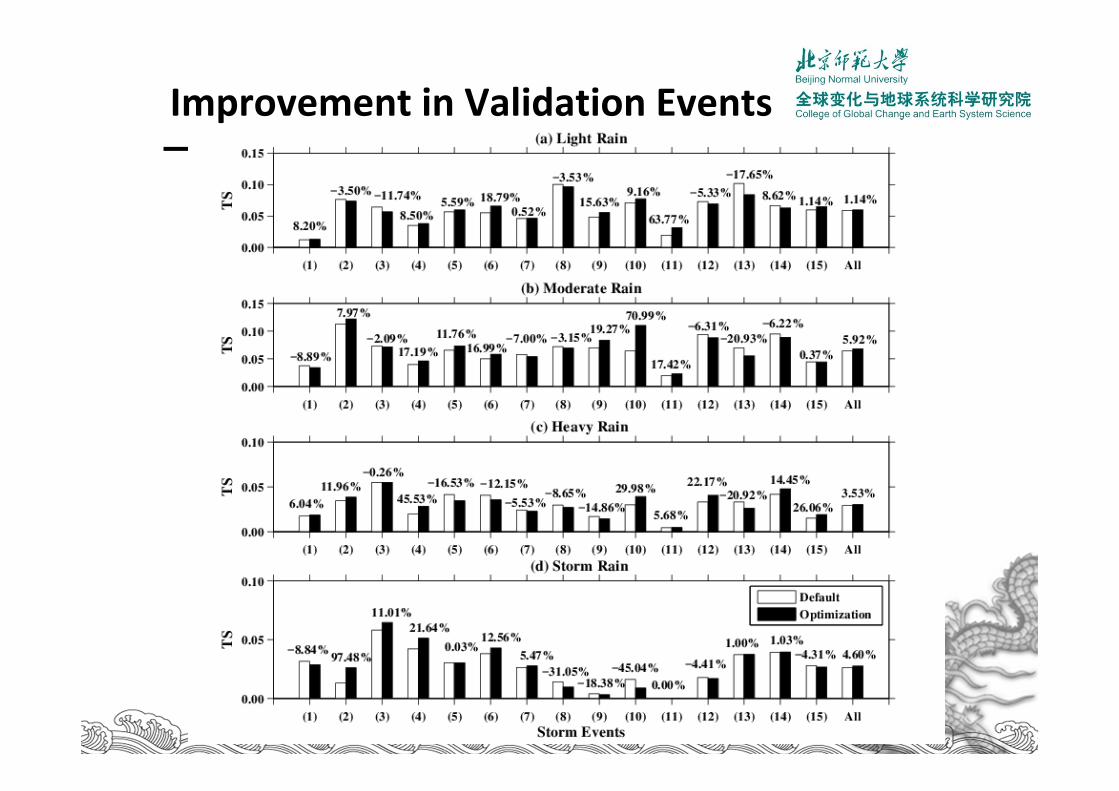
Improvement in Validation Events
Summary and Discussion of WRF Parametric Uncertainty and Optimization Research
• Considerable parametric uncertainties exist in NWP models
• UQ‐PyL contains tools for screening and optimizing important parameters
• The most sensitive parameters identified for precipitation and surface air temperature are:– P3, P4, P5, P8, P12, P16, P18, and P21
• Optimization experiments with the eight most sensitive parameters for 8 calibrated events has improved the model performance by 14‐18%
• Other performance measures for calibrated events confirmed the improvement
• Validation using 15 independent storm data shows an improved model performance by 18‐21%

Questions ?