Embed Size (px)
Citation preview
U.S. Department of the InteriorU.S. Geological Survey
Data Series 307
National Water-Quality Assessment Program Toxic Substances Hydrology Program
Data on Mercury in Water, Bed Sediment, and Fish from Streams Across the United States, 1998–2005

Cover photographs: Top left, fish collection by electrofishing Middle, stream-water processing Bottom right, streambed sediment sampling Background, cutthroat trout (Oncorhynchus clarkii)
All photographs by Dennis A. Wentz, U.S. Geological Survey
Data on Mercury in Water, Bed Sediment, and Fish from Streams Across the United States, 1998–2005
By Nancy J. Bauch, Lia C. Chasar, Barbara C. Scudder, Patrick W. Moran, Kerie J. Hitt, Mark E. Brigham, Michelle A. Lutz, and Dennis A. Wentz
Data Series 307
U.S. Department of the InteriorU.S. Geological Survey
National Water-Quality Assessment Program Toxic Substances Hydrology Program
U.S. Department of the InteriorKEN SALAZAR, Secretary
U.S. Geological SurveySuzette M. Kimball, Acting Director
U.S. Geological Survey, Reston, Virginia: 2009
For more information on the USGS—the Federal source for science about the Earth, its natural and living resources, natural hazards, and the environment, visit http://www.usgs.gov or call 1-888-ASK-USGS
For an overview of USGS information products, including maps, imagery, and publications, visit http://www.usgs.gov/pubprod
To order this and other USGS information products, visit http://store.usgs.gov
Any use of trade, product, or firm names is for descriptive purposes only and does not imply endorsement by the U.S. Government.
Although this report is in the public domain, permission must be secured from the individual copyright owners to reproduce any copyrighted materials contained within this report.
Suggested citation: Bauch, N.J., Chasar, L.C., Scudder, B.C., Moran, P.W., Hitt, K.J., Brigham, M.E., Lutz, M.A., and Wentz, D.A., 2009, Data on mercury in water, bed sediment, and fish from streams across the United States, 1998–2005: U.S. Geological Survey Data Series 307, 33 p.
iii
FOREWORDThe U.S. Geological Survey (USGS) is committed to providing the Nation with reliable scientific information that helps to enhance and protect the overall quality of life and that facilitates effective management of water, biological, energy, and mineral resources (http://www.usgs.gov/). Information on the Nation’s water resources is critical to ensuring long-term availability of water that is safe for drinking and recreation and is suitable for industry, irrigation, and fish and wildlife. Population growth and increasing demands for water make the availability of that water, measured in terms of quantity and quality, even more essential to the long-term sustainability of our communities and ecosystems.
The USGS implemented the National Water-Quality Assessment (NAWQA) Program in 1991 to support national, regional, State, and local information needs and decisions related to water-quality management and policy (http://water.usgs.gov/nawqa). The NAWQA Program is designed to answer: What is the quality of our Nation’s streams and ground water? How are conditions changing over time? How do natural features and human activities affect the quality of streams and ground water, and where are those effects most pronounced? By combining information on water chemistry, physical characteristics, stream habitat, and aquatic life, the NAWQA Program aims to provide science-based insights for current and emerging water issues and priorities. From 1991 to 2001, the NAWQA Program completed interdisciplinary assessments and established a baseline understanding of water-quality conditions in 51 of the Nation’s river basins and aquifers, referred to as Study Units (http://water.usgs.gov/nawqa/studyu.html).
National and regional assessments are ongoing in the second decade (2001–2012) of the NAWQA Program as 42 of the 51 Study Units are selectively reassessed. These assessments extend the findings in the Study Units by determining water-quality status and trends at sites that have been consistently monitored for more than a decade and filling critical gaps in characterizing the quality of surface water and ground water. For example, increased emphasis has been placed on assessing the quality of source water and finished water associated with many of the Nation’s largest community water systems. During the second decade, NAWQA is addressing five national priority topics that build an understanding of how natural features and human activities affect water quality, and establish links between sources of contaminants, the transport of those contaminants through the hydrologic system, and the potential effects of contaminants on humans and aquatic ecosystems. Included are studies on the fate of agricultural chemicals, effects of urbanization on stream ecosystems, bioaccumulation of mercury in stream ecosystems, effects of nutrient enrichment on aquatic ecosystems, and transport of contaminants to public-supply wells. In addition, national syntheses of information on pesticides, volatile organic compounds (VOCs), nutrients, trace elements, and aquatic ecology are continuing.
The USGS aims to disseminate credible, timely, and relevant science information to address practical and effective water-resource management and strategies that protect and restore water quality. We hope this NAWQA publication will provide you with insights and information to meet your needs and will foster increased citizen awareness and involvement in the protection and restoration of our Nation’s waters.
The USGS recognizes that a national assessment by a single program cannot address all water-resource issues of interest. External coordination at all levels is critical for cost-effective management, regulation, and conservation of our Nation’s water resources. The NAWQA Program, therefore, depends on advice and information from other agencies—Federal, State, regional, interstate, Tribal, and local—as well as nongovernmental organizations, industry, academia, and other stakeholder groups. Your assistance and suggestions are greatly appreciated.
Matthew C. Larsen Associate Director for Water
iv
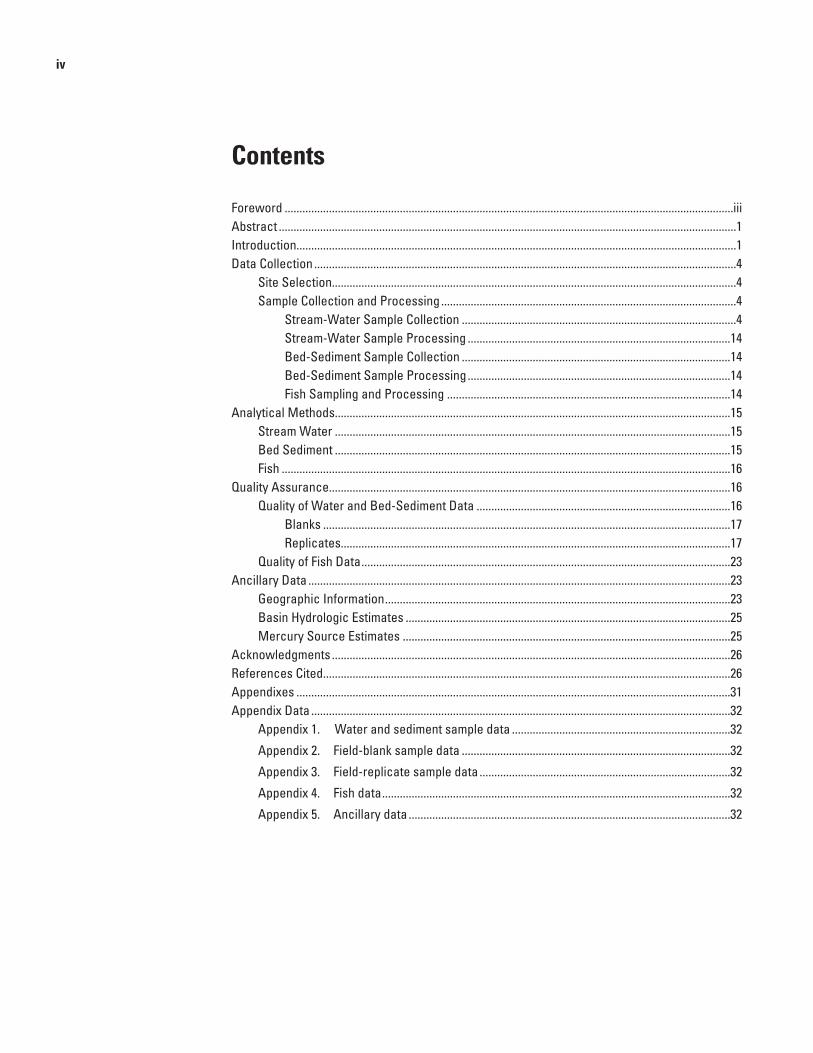
Contents
Foreword ........................................................................................................................................................iiiAbstract ...........................................................................................................................................................1Introduction.....................................................................................................................................................1Data Collection ...............................................................................................................................................4
Site Selection.........................................................................................................................................4Sample Collection and Processing ....................................................................................................4
Stream-Water Sample Collection .............................................................................................4Stream-Water Sample Processing .........................................................................................14Bed-Sediment Sample Collection ...........................................................................................14Bed-Sediment Sample Processing .........................................................................................14Fish Sampling and Processing ................................................................................................14
Analytical Methods......................................................................................................................................15Stream Water ......................................................................................................................................15Bed Sediment ......................................................................................................................................15Fish ........................................................................................................................................................16
Quality Assurance........................................................................................................................................16Quality of Water and Bed-Sediment Data ......................................................................................16
Blanks ..........................................................................................................................................17Replicates....................................................................................................................................17
Quality of Fish Data .............................................................................................................................23Ancillary Data ...............................................................................................................................................23
Geographic Information .....................................................................................................................23Basin Hydrologic Estimates ..............................................................................................................25Mercury Source Estimates ...............................................................................................................25
Acknowledgments .......................................................................................................................................26References Cited..........................................................................................................................................26Appendixes ...................................................................................................................................................31Appendix Data ..............................................................................................................................................32
Appendix 1. Water and sediment sample data ..........................................................................32
Appendix 2. Field-blank sample data ...........................................................................................32
Appendix 3. Field-replicate sample data .....................................................................................32
Appendix 4. Fish data ......................................................................................................................32
Appendix 5. Ancillary data .............................................................................................................32
v
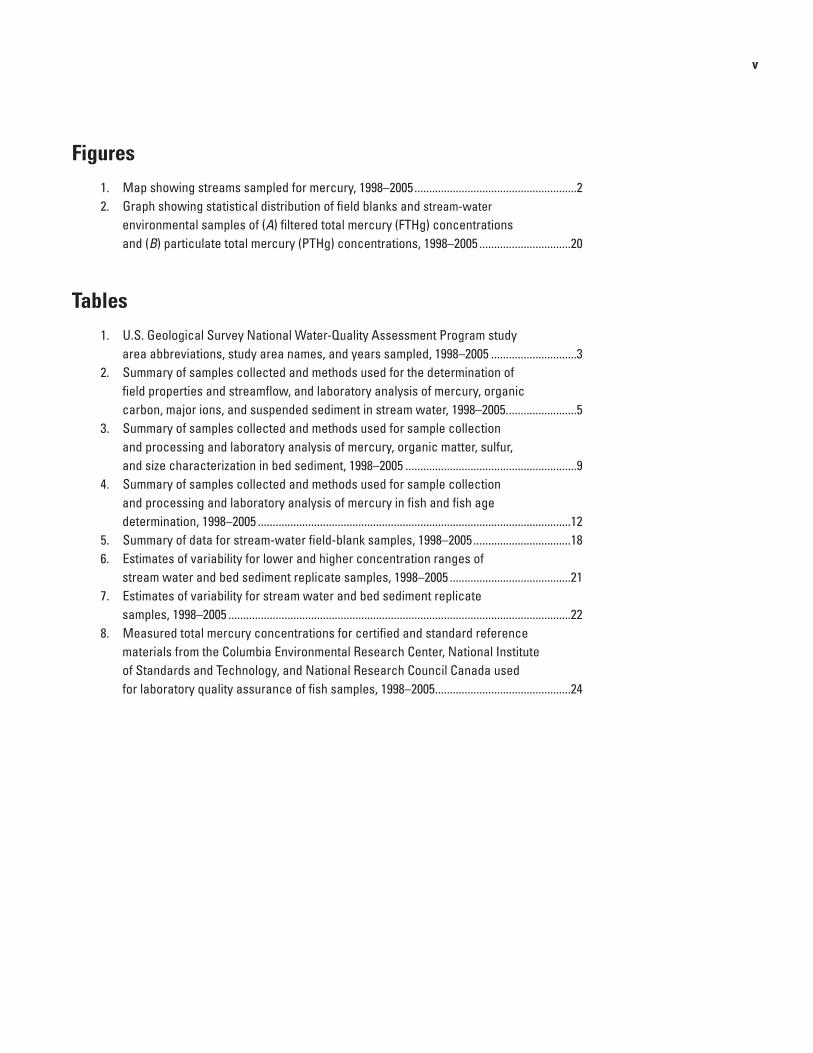
Figures
1. Map showing streams sampled for mercury, 1998–2005 .......................................................2 2. Graph showing statistical distribution of field blanks and stream-water environmental samples of (A) filtered total mercury (FTHg) concentrations and (B) particulate total mercury (PTHg) concentrations, 1998–2005 ...............................20
Tables
1. U.S. Geological Survey National Water-Quality Assessment Program study area abbreviations, study area names, and years sampled, 1998–2005 .............................3 2. Summary of samples collected and methods used for the determination of field properties and streamflow, and laboratory analysis of mercury, organic carbon, major ions, and suspended sediment in stream water, 1998–2005. .......................5 3. Summary of samples collected and methods used for sample collection and processing and laboratory analysis of mercury, organic matter, sulfur, and size characterization in bed sediment, 1998–2005 ..........................................................9 4. Summary of samples collected and methods used for sample collection and processing and laboratory analysis of mercury in fish and fish age determination, 1998–2005 ..........................................................................................................12 5. Summary of data for stream-water field-blank samples, 1998–2005 .................................18 6. Estimates of variability for lower and higher concentration ranges of stream water and bed sediment replicate samples, 1998–2005 .........................................21 7. Estimates of variability for stream water and bed sediment replicate samples, 1998–2005 ....................................................................................................................22 8. Measured total mercury concentrations for certified and standard reference materials from the Columbia Environmental Research Center, National Institute of Standards and Technology, and National Research Council Canada used for laboratory quality assurance of fish samples, 1998–2005 ..............................................24
vi
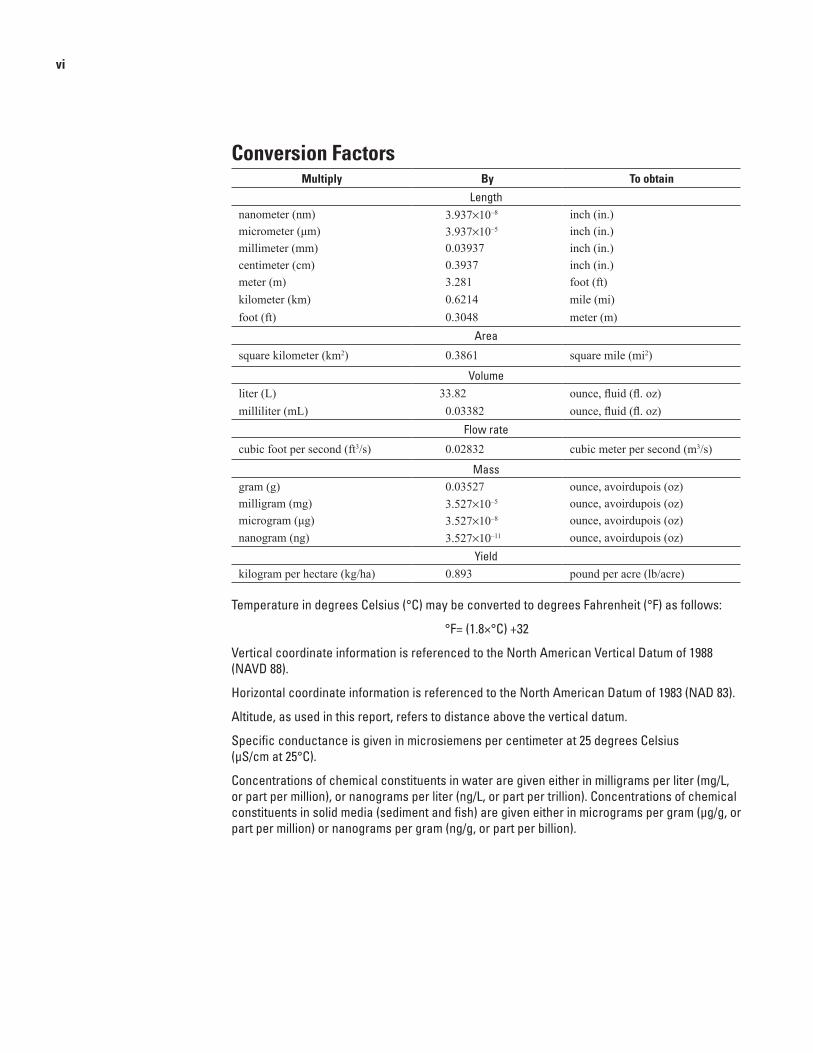
Conversion FactorsMultiply By To obtain
Lengthnanometer (nm) 3.937×10⁻⁸ inch (in.)micrometer (μm) 3.937×10⁻⁵ inch (in.)millimeter (mm) 0.03937 inch (in.)centimeter (cm) 0.3937 inch (in.)meter (m) 3.281 foot (ft)kilometer (km) 0.6214 mile (mi)foot (ft) 0.3048 meter (m)
Area
square kilometer (km2) 0.3861 square mile (mi2)
Volumeliter (L) 33.82 ounce, fluid (fl. oz)milliliter (mL) 0.03382 ounce, fluid (fl. oz)
Flow rate
cubic foot per second (ft3/s) 0.02832 cubic meter per second (m3/s)
Massgram (g) 0.03527 ounce, avoirdupois (oz)milligram (mg) 3.527×10⁻⁵ ounce, avoirdupois (oz)microgram (μg) 3.527×10⁻⁸ ounce, avoirdupois (oz)nanogram (ng) 3.527×10⁻¹¹ ounce, avoirdupois (oz)
Yieldkilogram per hectare (kg/ha) 0.893 pound per acre (lb/acre)
Temperature in degrees Celsius (°C) may be converted to degrees Fahrenheit (°F) as follows:
°F= (1.8×°C) +32
Vertical coordinate information is referenced to the North American Vertical Datum of 1988 (NAVD 88).
Horizontal coordinate information is referenced to the North American Datum of 1983 (NAD 83).
Altitude, as used in this report, refers to distance above the vertical datum.
Specific conductance is given in microsiemens per centimeter at 25 degrees Celsius (µS/cm at 25°C).
Concentrations of chemical constituents in water are given either in milligrams per liter (mg/L, or part per million), or nanograms per liter (ng/L, or part per trillion). Concentrations of chemical constituents in solid media (sediment and fish) are given either in micrograms per gram (µg/g, or part per million) or nanograms per gram (ng/g, or part per billion).
vii
Abbreviations and Acronyms
AVS acid-volatile sulfide BrCl bromine monochloride CERC Columbia Environmental Research Center CVAFS cold vapor atomic fluorescence spectroscopy DOC dissolved organic carbon DOLT dogfish (Squalus acanthias) liver DORM dogfish (Squalus acanthias) muscle FMeHg methylmercury in filtered water FTHg total mercury in filtered water GIRAS Geographic Information Retrieval and Analysis System GIS Geographic Information System > greater than HCl hydrochloric acid Hg mercuryITIS Integrated Taxonomic Information System < less than LOI loss on ignition LULC Land Use and Land Cover MAS/MILS Mineral Availability System/Mineral Industry Location System MDL method detection limit MeHg methylmercuryMRDS Mineral Resources Data SystemN normal (moles of equivalents per liter)NADP National Atmospheric Deposition Program NAWQA National Water-Quality Assessment NFM National Field Manual NIST National Institute of Standards and Technology NLCD National Land Cover Data NRCC National Research Council Canada NRP OCTL National Research Program Organic Carbon Transformations Laboratory NWIS National Water Information System NWQL National Water Quality Laboratory PETG polyethylene terephthalate copolyester, glycol-modified PMeHg methylmercury in particulate matter PRISM Parameter-elevation Regressions on Independent Slopes Model PTHg total mercury in particulate matter QC quality control RSD relative standard deviation SD standard deviation SGL Sulfur Geochemistry Laboratory SMeHg methylmercury in bed sediment SnCl
2 stannous chloride
STATSGO State Soil Geographic
STHg total mercury in bed sediment SUVA specific ultraviolet absorbance TEAM Trace Elements Analysis Model TERL Trace Element Research Laboratory (at Texas A&M University, College Station, Texas) THg total mercury µg/m2 microgram per square meter UMeHg methylmercury in unfiltered water USEPA U.S. Environmental Protection Agency USGS U.S. Geological Survey UTHg total mercury in unfiltered water WMRL Wisconsin Mercury Research Laboratory

Abstract
The U.S. Geological Survey (USGS) National Water-Quality Assessment (NAWQA) and Toxic Substances Hydrol-ogy Programs conducted the National Mercury Pilot Study in 1998 to examine relations of mercury (Hg) in water, bed sediment and fish in streams across the United States, includ-ing Alaska and Hawaii. Water and bed-sediment samples were analyzed for total Hg (THg), methylmercury (MeHg), and other constituents; fish were analyzed for THg. Similar sam-pling was conducted at additional streams across the country in 2002 and 2004–05. This report summarizes sample collec-tion and processing protocols, analytical methods, environ-mental data, and quality-assurance data for stream water, bed sediment, and fish for these national studies. To extend the geographic coverage of the data, this report also includes four regional USGS Hg studies conducted during 1998–2001 and 2004. The environmental data for these national and regional Hg studies are provided in an electronic format.
Introduction
In 1998, the U.S. Geological Survey (USGS) National Water-Quality Assessment (NAWQA) and Toxic Substances Hydrology Programs conducted the National Mercury Pilot Study with the goal of examining relations of mercury (Hg) in water, bed sediment, and fish in streams across the Nation, including Alaska and Hawaii (Krabbenhoft and others, 1999; Brumbaugh and others, 2001). At each stream site, investigators conducted a one-time sampling of water, bed sediment, and fish for the analysis of total Hg (THg), methylmercury (MeHg), and other constituents. This Pilot study was the first known study in which nationwide multimedia sampling occurred jointly with low-level Hg speciation analysis (Krabbenhoft and others, 1999). The USGS conducted similar national and regional studies at additional streams across the Nation during 1998–2001,
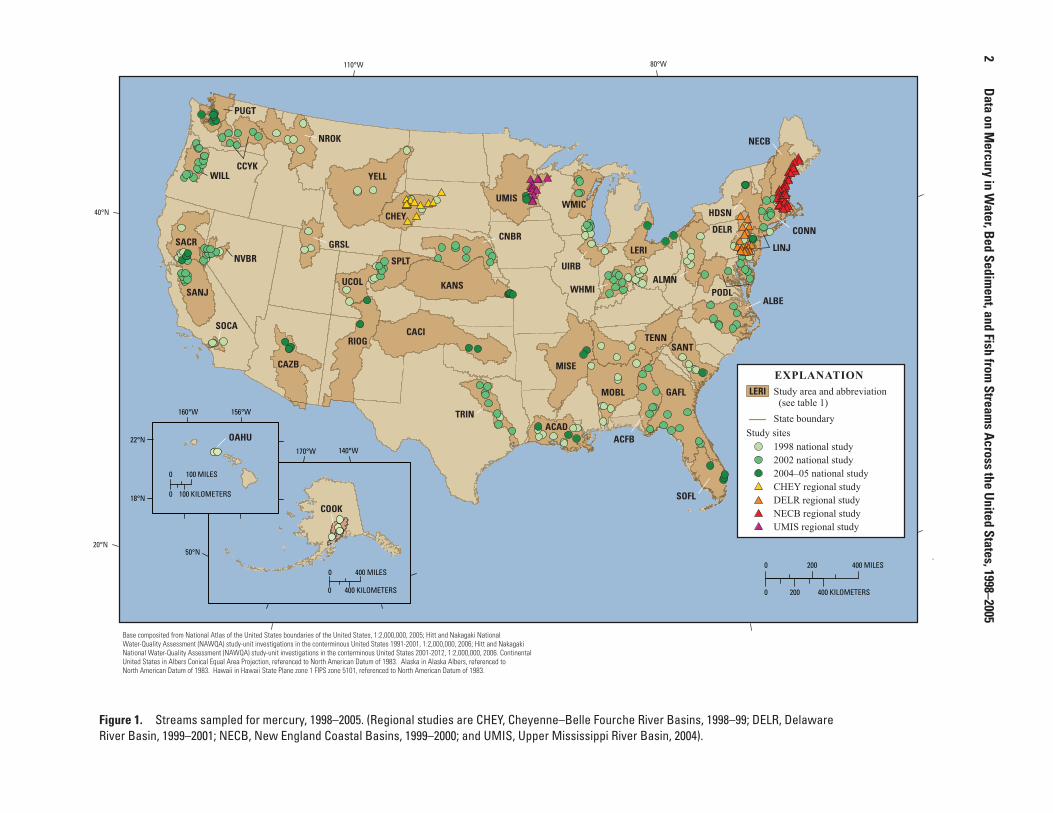
2002, and 2004–05 (fig. 1, table 1). For the remainder of this report, results from the 1998 National Mercury Pilot Study are described together with results from the national and regional studies conducted during 1998–2005.
This report describes sample collection and process-ing procedures, analytical methods, environmental data, and quality-assurance data for water, bed sediment, and fish samples collected from 266 stream sites in 42 NAWQA study areas during national studies conducted in 1998, 2002, and 2004–05, and for samples collected from 101 stream sites during regional USGS studies in four study areas conducted in 1998–2001 and 2004. Water-quality, bed-sediment, and fish data, along with quality-assurance data and ancillary site data, are available for download on the Appendix Data page at http://pubs.usgs.gov/ds/307/. Analytical data for water include filtered THg (FTHg), filtered MeHg (FMeHg), particulate THg (PTHg), particulate MeHg (PMeHg), dissolved organic carbon (DOC) concentration, specific fractions and specific ultraviolet absorbance (SUVA) of DOC, sulfate and suspended-sediment concentrations, and suspended-sediment grain size. Bed-sediment data include THg, MeHg, loss on ignition (LOI, a measure of organic carbon content of sediment), acid-volatile sulfide (AVS), and grain size. Fish data include THg, type of cut (whole fish, skin-on fillet, skin-off fillet), weight and length measurements, and fish age. Data on streamflow, field measurements (water temperature, pH, specific conductance, and dissolved oxygen concentration), and ancillary site infor-mation are provided.
In all, 367 streams were sampled for national and regional studies combined. Fish Hg concentrations (715 samples) are available for 291 streams; concentrations of Hg in water and bed sediment are available for 342 streams. All three media (water, bed sediment, and fish) were sampled at 267 streams. Scudder and others (2009) describe the occur-rence and spatial distribution of the Hg data in relation to regional and national gradients of Hg source strength and land-use/land-cover types; they also discuss associations among the Hg data and other measures of stream-water and bed-sediment chemistry.
Data on Mercury in Water, Bed Sediment, and Fish from Streams Across the United States, 1998–2005
By Nancy J. Bauch, Lia C. Chasar, Barbara C. Scudder, Patrick W. Moran, Kerie J. Hitt, Mark E. Brigham, Michelle A. Lutz, and Dennis A. Wentz
2
Data on M
ercury in Water, B
ed Sediment, and Fish from
Streams A
cross the United States, 1998–2005
0 400 MILES
0 400 KILOMETERS
140°W170°W
50°N
0 100 MILES
0 100 KILOMETERS
156°W160°W
22°N
18°N
80°W110°W
40°N
20°N
EXPLANATION
State boundary
Study area and abbreviation (see table 1)
LERI
Study sites1998 national study2002 national study2004–05 national studyCHEY regional studyDELR regional studyNECB regional studyUMIS regional study
0 200 400 MILES
0 200 400 KILOMETERS
YELL
CACI
GAFL
KANS
MISE
RIOG
UMIS
MOBL
CAZB
SANJALBE
CNBR
SPLT
SACRLERI
CHEY
ACAD
SOFL
UCOL
NROK
SANT
NECB
TRIN
ACFB
WMIC
ALMN
GRSLCONN
WILL
DELR
HDSN
UIRB
PUGT
LINJ
SOCA
COOK
OAHU
TENN
WHMI PODL
CCYK
NVBR
Base composited from National Atlas of the United States boundaries of the United States, 1:2,000,000, 2005; Hitt and Nakagaki National Water-Quality Assessment (NAWQA) study-unit investigations in the conterminous United States 1991-2001, 1:2,000,000, 2006; Hitt and Nakagaki National Water-Quality Assessment (NAWQA) study-unit investigations in the conterminous United States 2001-2012, 1:2,000,000, 2006. Continental United States in Albers Conical Equal Area Projection, referenced to North American Datum of 1983. Alaska in Alaska Albers, referenced to North American Datum of 1983. Hawaii in Hawaii State Plane zone 1 FIPS zone 5101, referenced to North American Datum of 1983.
Figure 1. Streams sampled for mercury, 1998–2005. (Regional studies are CHEY, Cheyenne–Belle Fourche River Basins, 1998–99; DELR, Delaware River Basin, 1999–2001; NECB, New England Coastal Basins, 1999–2000; and UMIS, Upper Mississippi River Basin, 2004).
Introduction 3
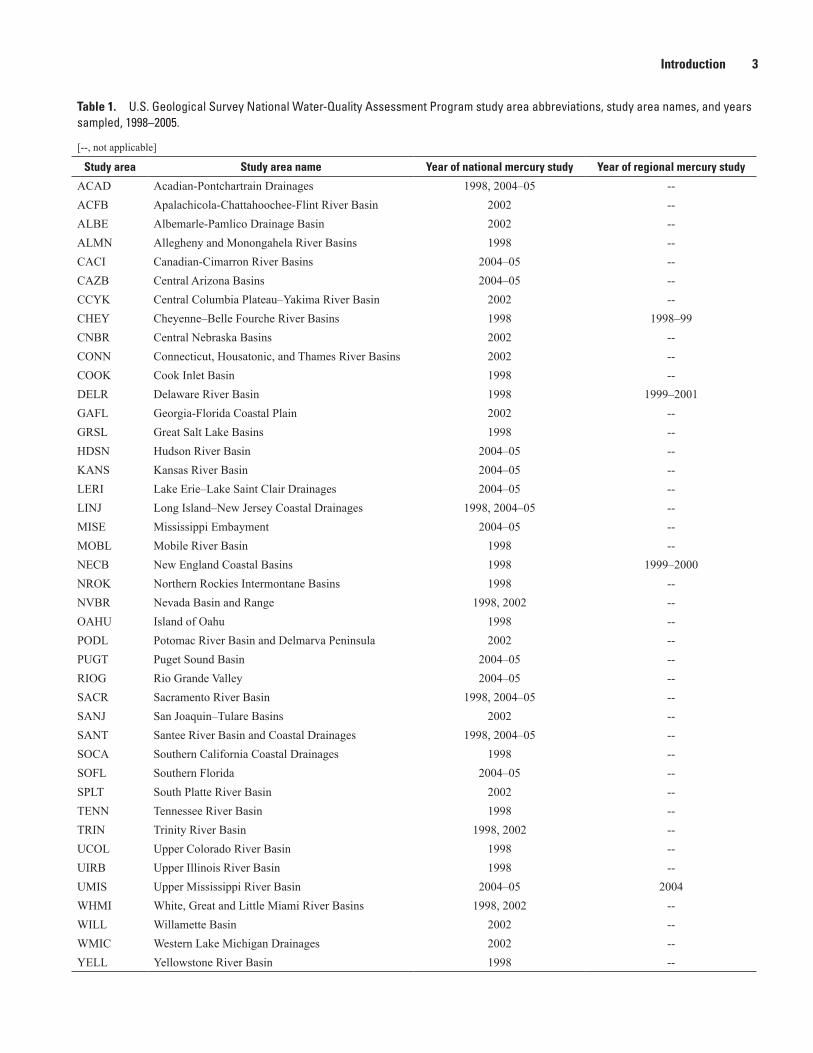
Table 1. U.S. Geological Survey National Water-Quality Assessment Program study area abbreviations, study area names, and years sampled, 1998–2005.
[--, not applicable]
Study area Study area name Year of national mercury study Year of regional mercury study
ACAD Acadian-Pontchartrain Drainages 1998, 2004–05 --ACFB Apalachicola-Chattahoochee-Flint River Basin 2002 --ALBE Albemarle-Pamlico Drainage Basin 2002 --ALMN Allegheny and Monongahela River Basins 1998 --CACI Canadian-Cimarron River Basins 2004–05 --CAZB Central Arizona Basins 2004–05 --CCYK Central Columbia Plateau–Yakima River Basin 2002 --CHEY Cheyenne–Belle Fourche River Basins 1998 1998–99CNBR Central Nebraska Basins 2002 --CONN Connecticut, Housatonic, and Thames River Basins 2002 --COOK Cook Inlet Basin 1998 --DELR Delaware River Basin 1998 1999–2001GAFL Georgia-Florida Coastal Plain 2002 --GRSL Great Salt Lake Basins 1998 --HDSN Hudson River Basin 2004–05 --KANS Kansas River Basin 2004–05 --LERI Lake Erie–Lake Saint Clair Drainages 2004–05 --LINJ Long Island–New Jersey Coastal Drainages 1998, 2004–05 --MISE Mississippi Embayment 2004–05 --MOBL Mobile River Basin 1998 --NECB New England Coastal Basins 1998 1999–2000NROK Northern Rockies Intermontane Basins 1998 --NVBR Nevada Basin and Range 1998, 2002 --OAHU Island of Oahu 1998 --PODL Potomac River Basin and Delmarva Peninsula 2002 --PUGT Puget Sound Basin 2004–05 --RIOG Rio Grande Valley 2004–05 --SACR Sacramento River Basin 1998, 2004–05 --SANJ San Joaquin–Tulare Basins 2002 --SANT Santee River Basin and Coastal Drainages 1998, 2004–05 --SOCA Southern California Coastal Drainages 1998 --SOFL Southern Florida 2004–05 --SPLT South Platte River Basin 2002 --TENN Tennessee River Basin 1998 --TRIN Trinity River Basin 1998, 2002 --UCOL Upper Colorado River Basin 1998 --UIRB Upper Illinois River Basin 1998 --UMIS Upper Mississippi River Basin 2004–05 2004WHMI White, Great and Little Miami River Basins 1998, 2002 --WILL Willamette Basin 2002 --WMIC Western Lake Michigan Drainages 2002 --YELL Yellowstone River Basin 1998 --
4 Data on Mercury in Water, Bed Sediment, and Fish from Streams Across the United States, 1998–2005
Data Collection
Site Selection
The streams included in the 1998 National Mercury Pilot Study represent a diversity of environmental settings across the Nation. Sites were chosen to represent a range of values for a number of environmental variables, including wetland density and other land-use/land-cover characteristics, pH, sulfate, total organic carbon and DOC, and Hg loading (source type, strength, and extent). Streams for the 2002 and 2004–05 studies were selected to include the same range in environ-mental variables as the 1998 National Mercury Pilot Study, as well as to extend geographic coverage, increase representation of key land-use and land-cover categories, and increase the range of DOC values (both concentration and SUVA). Addi-tional factors considered in site selection were the availability of historical water-quality and ecological data and the pres-ence of top predator fish. Because largemouth bass (Microp-terus salmoides) is a widely distributed top predator fish, this species and other black bass species (Micropterus spp.) were emphasized as a first preference for collection.
Data for Hg in water, bed sediment, and fish from 101 streams sampled during USGS regional Hg studies conducted from 1998 through 2001 and during 2004 in four NAWQA study areas are included in this report to extend the geographic coverage of data. The inclusion of these studies was based on availability of Hg data for water, bed sediment, and fish, with supporting field properties (water temperature, pH, specific conductance, dissolved oxygen concentration) and streamflow. The studies are defined as CHEY (Cheyenne–Belle Fourche River Basins) regional study (S.K. Sando, USGS, unpub. data, 2005), DELR (Delaware River Basin) regional study (Bright-bill and others, 2003), NECB (New England Coastal Basins) regional study (Chalmers and Krabbenhoft, 2001), and UMIS (Upper Mississippi River Basin) regional study (Christensen and others, 2006). For the first three regional studies, many streams were sampled more than once. Only one sample per site is included in the data tables to maintain consistency with the national studies and to avoid overweighing analysis and interpretation in favor of sites with more than one sample. For a site with multiple samples, the sample included in the data tables had the greatest number of constituents measured, was sampled during low flow in August, and(or) was sampled during the same week in August as most other samples for the regional study. Additional data for the DELR and NECB regional studies are available in Brightbill and others (2003) at http://nh.water.usgs.gov/projects/nawqa/sw_merc.htm, and on the USGS National Water Information System (NWIS) Web at http://waterdata.usgs.gov/usa/nwis/qw.
Sample Collection and Processing
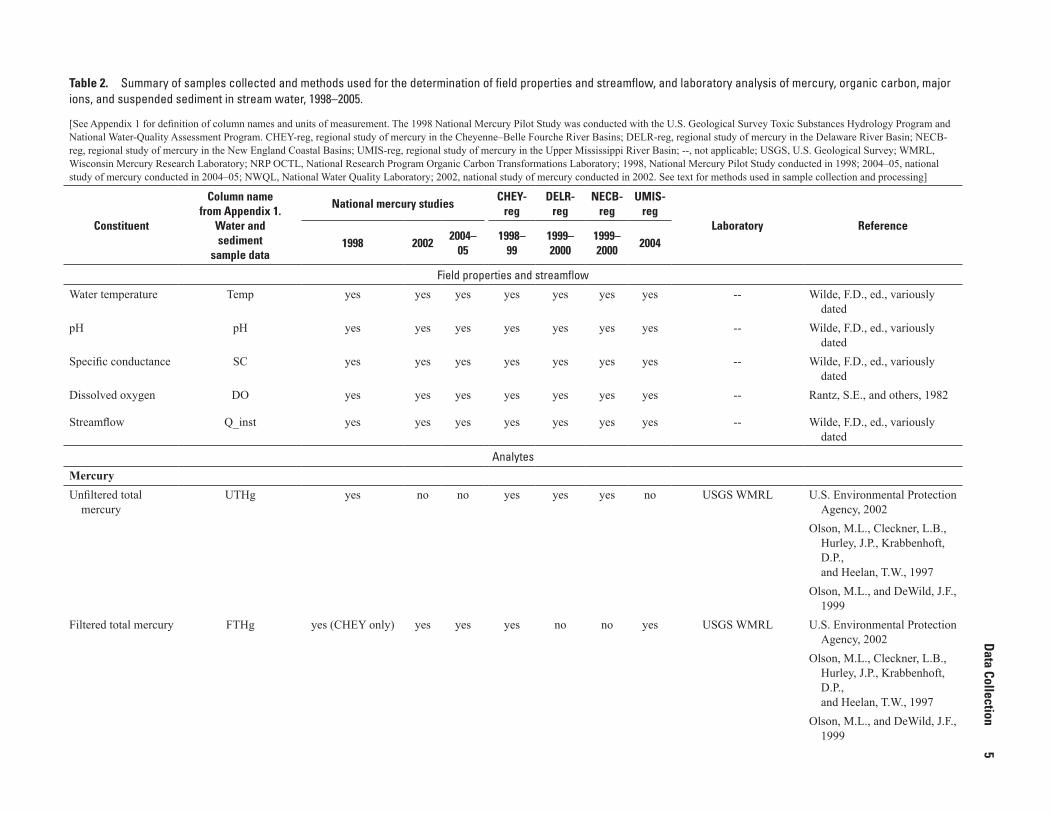
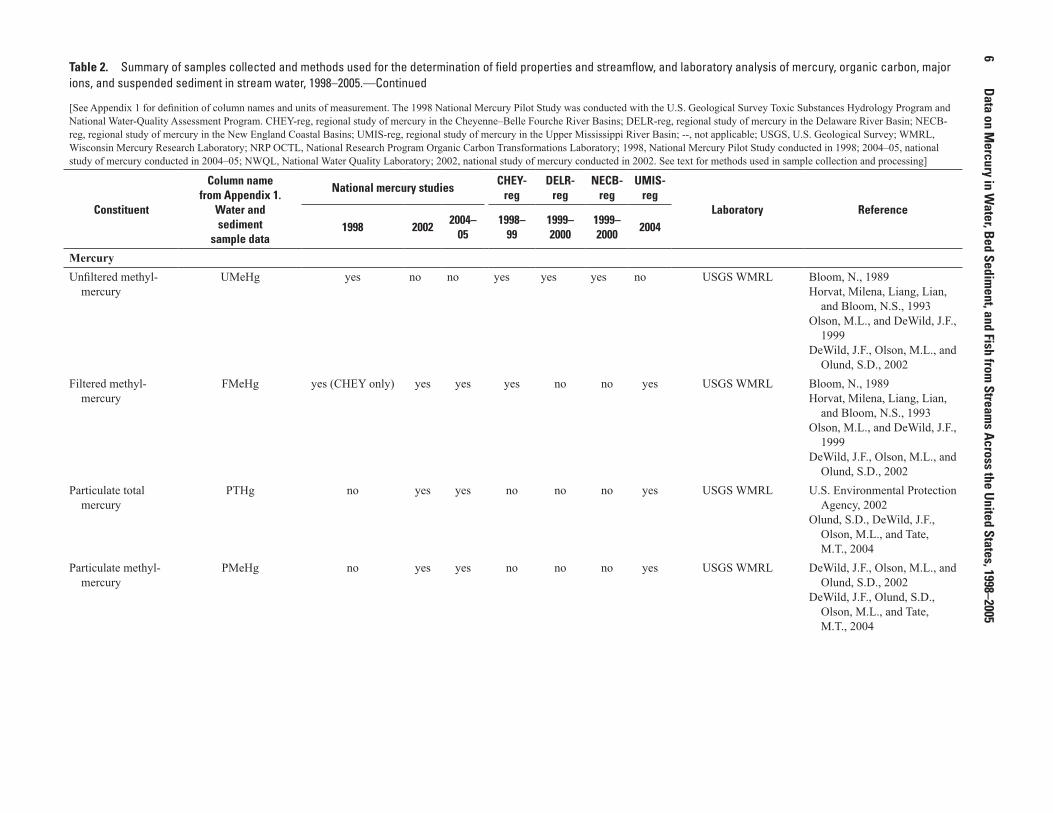
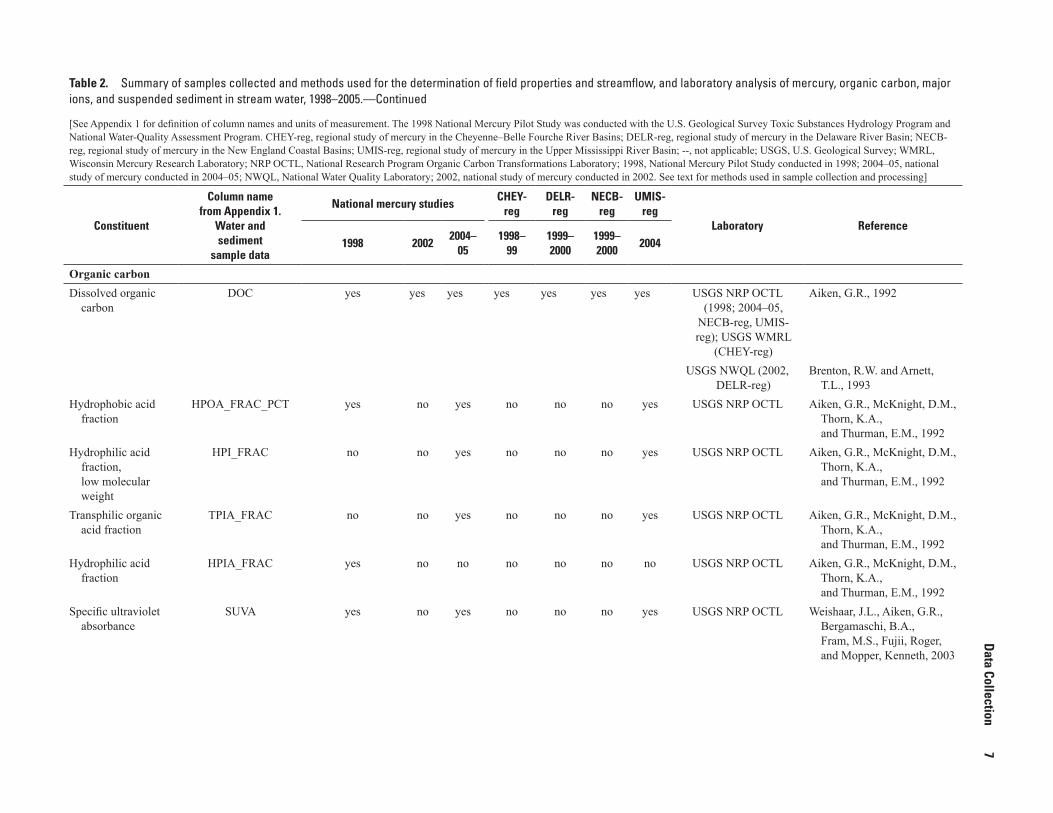
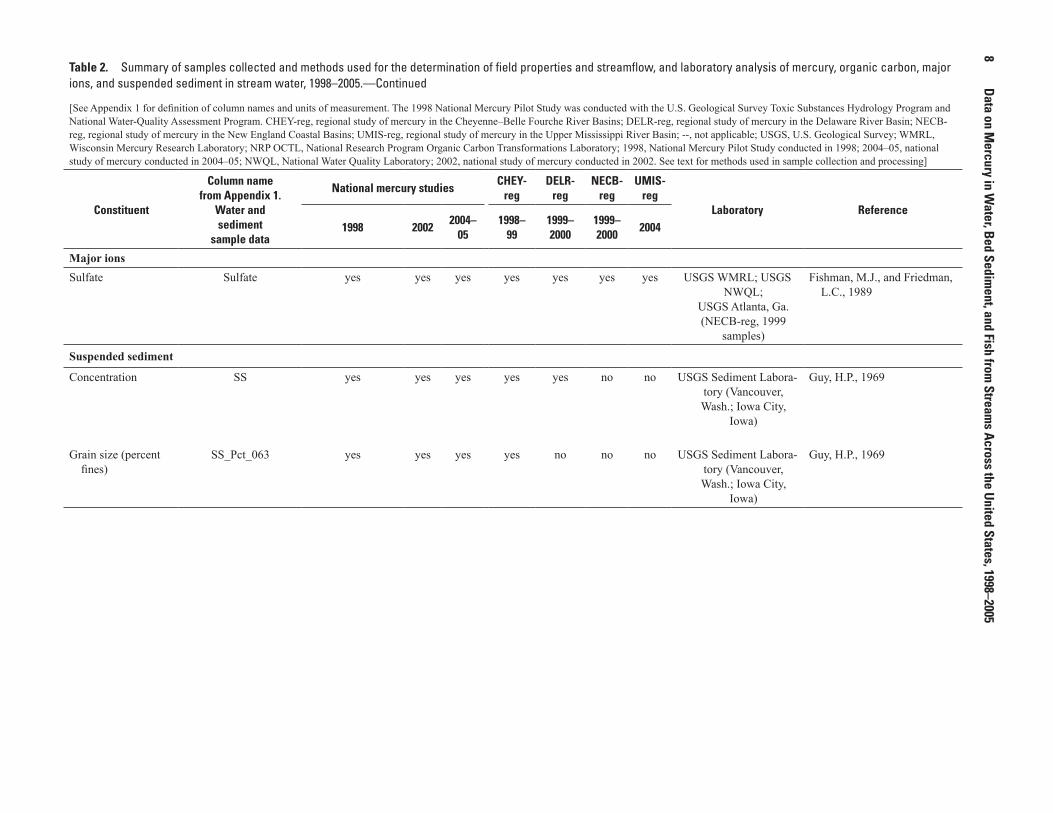
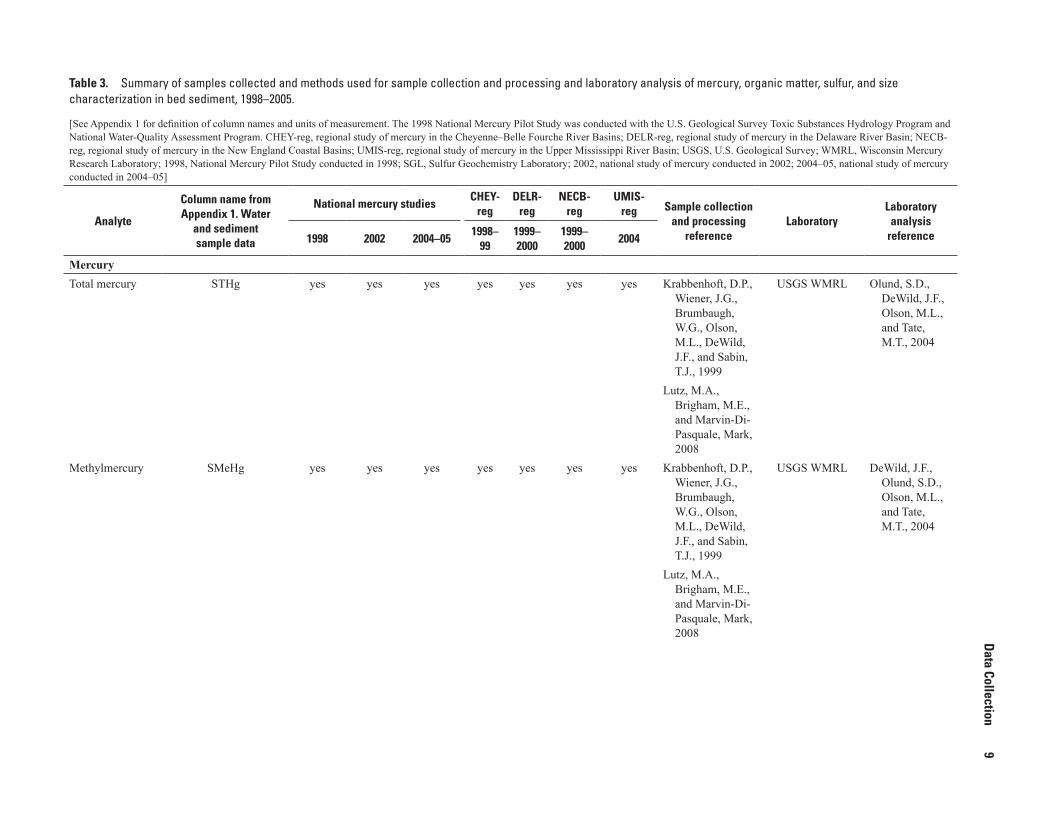
Water samples compiled for this database were collected and processed for analysis of FTHg, FMeHg, PTHg, PMeHg, DOC, sulfate, and suspended sediment (concentration and grain size). Bed-sediment samples were collected and pro-cessed for analysis of THg and MeHg, LOI, AVS, and grain size. Fish samples were collected and processed for analysis of THg only; otoliths, scales, or spines were collected from fish for age determination. The types of samples collected during each study are summarized in tables 2–4. Field proper-ties (water temperature, pH, specific conductance, dissolved oxygen concentration) were measured when water and bed-sediment samples were collected (Wilde, variously dated). At most sites, streamflow also was measured (Rantz and others, 1982).
Stream-Water Sample Collection
USGS clean-sampling procedures (sometimes called trace element part-per-billion or ppb protocols) and ultra trace-level clean techniques (for Hg) were used to collect water samples. Detailed descriptions of these procedures and techniques are provided in the USGS National Field Manual (NFM) (U.S. Geological Survey, variously dated [chapters 1–4]); Fitzgerald and Watras (1989); U.S. Environmental Protection Agency (1996a); Olson and DeWild (1999); and Lewis and Brigham (2004). USGS scientists were trained in clean sampling techniques prior to sample collection and processing. Because low-level Hg samples are susceptible to contamination from many sources, specific measures were required for collecting Hg samples to prevent contamination (Lewis and Brigham, 2004). Field personnel wore shoulder-length polyethylene gloves under powder-free, wrist-length nitrile or latex gloves. Particle-shedding clothing (for example, fleece jackets, wool sweaters, or soiled field clothing) was avoided; outerwear, if needed, was clean, nylon-shell (or comparable material) cloth-ing. Field personnel were instructed to open sample containers while holding them upwind from themselves or with the con-tainer inside a sample-processing chamber (Lane and others, 2003).
Stream-water samples were collected during low-flow conditions between late spring and early fall, depending on the general geographic location. For streams known to be well mixed, dip samples for Hg, DOC, sulfate, and suspended- sediment analyses were obtained from the approximate centroid of flow. For streams not known to be well mixed, an isokinetic, depth-integrated sample or a multiple-vertical composite sample was collected (Wilde and others, 1999; Lewis and Brigham, 2004). At wadeable sites, the in-channel collection site was approached from downstream, and sample containers were extended upstream into the current to avoid disturbance of sample water by field personnel. At nonwadeable sites, samples were collected from the bow of a boat moving upstream at low speed; sample bottles and
Data Collection
5
Table 2. Summary of samples collected and methods used for the determination of field properties and streamflow, and laboratory analysis of mercury, organic carbon, major ions, and suspended sediment in stream water, 1998–2005.
[See Appendix 1 for definition of column names and units of measurement. The 1998 National Mercury Pilot Study was conducted with the U.S. Geological Survey Toxic Substances Hydrology Program and National Water-Quality Assessment Program. CHEY-reg, regional study of mercury in the Cheyenne–Belle Fourche River Basins; DELR-reg, regional study of mercury in the Delaware River Basin; NECB-reg, regional study of mercury in the New England Coastal Basins; UMIS-reg, regional study of mercury in the Upper Mississippi River Basin; --, not applicable; USGS, U.S. Geological Survey; WMRL, Wisconsin Mercury Research Laboratory; NRP OCTL, National Research Program Organic Carbon Transformations Laboratory; 1998, National Mercury Pilot Study conducted in 1998; 2004–05, national study of mercury conducted in 2004–05; NWQL, National Water Quality Laboratory; 2002, national study of mercury conducted in 2002. See text for methods used in sample collection and processing]
Constituent
Column name from Appendix 1.
Water andsediment
sample data
National mercury studiesCHEY-
regDELR-
regNECB-
regUMIS-
regLaboratory Reference
1998 20022004–
051998–
991999–2000
1999–2000
2004
Field properties and streamflow
Water temperature Temp yes yes yes yes yes yes yes -- Wilde, F.D., ed., variously dated
pH pH yes yes yes yes yes yes yes -- Wilde, F.D., ed., variously dated
Specific conductance SC yes yes yes yes yes yes yes -- Wilde, F.D., ed., variously dated
Dissolved oxygen DO yes yes yes yes yes yes yes -- Rantz, S.E., and others, 1982
Streamflow Q_inst yes yes yes yes yes yes yes -- Wilde, F.D., ed., variously dated
Analytes
MercuryUnfiltered total
mercuryUTHg yes no no yes yes yes no USGS WMRL U.S. Environmental Protection
Agency, 2002Olson, M.L., Cleckner, L.B.,
Hurley, J.P., Krabbenhoft, D.P., and Heelan, T.W., 1997
Olson, M.L., and DeWild, J.F., 1999
Filtered total mercury FTHg yes (CHEY only) yes yes yes no no yes USGS WMRL U.S. Environmental Protection Agency, 2002
Olson, M.L., Cleckner, L.B., Hurley, J.P., Krabbenhoft, D.P., and Heelan, T.W., 1997
Olson, M.L., and DeWild, J.F., 1999
6
Data on M
ercury in Water, B
ed Sediment, and Fish from
Streams A
cross the United States, 1998–2005
Table 2. Summary of samples collected and methods used for the determination of field properties and streamflow, and laboratory analysis of mercury, organic carbon, major ions, and suspended sediment in stream water, 1998–2005.—Continued
[See Appendix 1 for definition of column names and units of measurement. The 1998 National Mercury Pilot Study was conducted with the U.S. Geological Survey Toxic Substances Hydrology Program and National Water-Quality Assessment Program. CHEY-reg, regional study of mercury in the Cheyenne–Belle Fourche River Basins; DELR-reg, regional study of mercury in the Delaware River Basin; NECB-reg, regional study of mercury in the New England Coastal Basins; UMIS-reg, regional study of mercury in the Upper Mississippi River Basin; --, not applicable; USGS, U.S. Geological Survey; WMRL, Wisconsin Mercury Research Laboratory; NRP OCTL, National Research Program Organic Carbon Transformations Laboratory; 1998, National Mercury Pilot Study conducted in 1998; 2004–05, national study of mercury conducted in 2004–05; NWQL, National Water Quality Laboratory; 2002, national study of mercury conducted in 2002. See text for methods used in sample collection and processing]
Constituent
Column name from Appendix 1.
Water andsediment
sample data
National mercury studiesCHEY-
regDELR-
regNECB-
regUMIS-
regLaboratory Reference
1998 20022004–
051998–
991999–2000
1999–2000
2004
MercuryUnfiltered methyl-
mercuryUMeHg yes no no yes yes yes no USGS WMRL Bloom, N., 1989
Horvat, Milena, Liang, Lian, and Bloom, N.S., 1993
Olson, M.L., and DeWild, J.F., 1999
DeWild, J.F., Olson, M.L., and Olund, S.D., 2002
Filtered methyl-mercury
FMeHg yes (CHEY only) yes yes yes no no yes USGS WMRL Bloom, N., 1989Horvat, Milena, Liang, Lian,
and Bloom, N.S., 1993Olson, M.L., and DeWild, J.F.,
1999DeWild, J.F., Olson, M.L., and
Olund, S.D., 2002Particulate total
mercuryPTHg no yes yes no no no yes USGS WMRL U.S. Environmental Protection
Agency, 2002Olund, S.D., DeWild, J.F.,
Olson, M.L., and Tate, M.T., 2004
Particulate methyl-mercury
PMeHg no yes yes no no no yes USGS WMRL DeWild, J.F., Olson, M.L., and Olund, S.D., 2002
DeWild, J.F., Olund, S.D., Olson, M.L., and Tate, M.T., 2004
Data Collection
7
Table 2. Summary of samples collected and methods used for the determination of field properties and streamflow, and laboratory analysis of mercury, organic carbon, major ions, and suspended sediment in stream water, 1998–2005.—Continued
[See Appendix 1 for definition of column names and units of measurement. The 1998 National Mercury Pilot Study was conducted with the U.S. Geological Survey Toxic Substances Hydrology Program and National Water-Quality Assessment Program. CHEY-reg, regional study of mercury in the Cheyenne–Belle Fourche River Basins; DELR-reg, regional study of mercury in the Delaware River Basin; NECB-reg, regional study of mercury in the New England Coastal Basins; UMIS-reg, regional study of mercury in the Upper Mississippi River Basin; --, not applicable; USGS, U.S. Geological Survey; WMRL, Wisconsin Mercury Research Laboratory; NRP OCTL, National Research Program Organic Carbon Transformations Laboratory; 1998, National Mercury Pilot Study conducted in 1998; 2004–05, national study of mercury conducted in 2004–05; NWQL, National Water Quality Laboratory; 2002, national study of mercury conducted in 2002. See text for methods used in sample collection and processing]
Constituent
Column name from Appendix 1.
Water andsediment
sample data
National mercury studiesCHEY-
regDELR-
regNECB-
regUMIS-
regLaboratory Reference
1998 20022004–
051998–
991999–2000
1999–2000
2004
Organic carbonDissolved organic
carbonDOC yes yes yes yes yes yes yes USGS NRP OCTL
(1998; 2004–05, NECB-reg, UMIS-reg); USGS WMRL
(CHEY-reg)
Aiken, G.R., 1992
USGS NWQL (2002, DELR-reg)
Brenton, R.W. and Arnett, T.L., 1993
Hydrophobic acid fraction
HPOA_FRAC_PCT yes no yes no no no yes USGS NRP OCTL Aiken, G.R., McKnight, D.M., Thorn, K.A., and Thurman, E.M., 1992
Hydrophilic acid fraction, low molecular weight
HPI_FRAC no no yes no no no yes USGS NRP OCTL Aiken, G.R., McKnight, D.M., Thorn, K.A., and Thurman, E.M., 1992
Transphilic organic acid fraction
TPIA_FRAC no no yes no no no yes USGS NRP OCTL Aiken, G.R., McKnight, D.M., Thorn, K.A., and Thurman, E.M., 1992
Hydrophilic acid fraction
HPIA_FRAC yes no no no no no no USGS NRP OCTL Aiken, G.R., McKnight, D.M., Thorn, K.A., and Thurman, E.M., 1992
Specific ultraviolet absorbance
SUVA yes no yes no no no yes USGS NRP OCTL Weishaar, J.L., Aiken, G.R., Bergamaschi, B.A., Fram, M.S., Fujii, Roger, and Mopper, Kenneth, 2003
8
Data on M
ercury in Water, B
ed Sediment, and Fish from
Streams A
cross the United States, 1998–2005
Table 2. Summary of samples collected and methods used for the determination of field properties and streamflow, and laboratory analysis of mercury, organic carbon, major ions, and suspended sediment in stream water, 1998–2005.—Continued
[See Appendix 1 for definition of column names and units of measurement. The 1998 National Mercury Pilot Study was conducted with the U.S. Geological Survey Toxic Substances Hydrology Program and National Water-Quality Assessment Program. CHEY-reg, regional study of mercury in the Cheyenne–Belle Fourche River Basins; DELR-reg, regional study of mercury in the Delaware River Basin; NECB-reg, regional study of mercury in the New England Coastal Basins; UMIS-reg, regional study of mercury in the Upper Mississippi River Basin; --, not applicable; USGS, U.S. Geological Survey; WMRL, Wisconsin Mercury Research Laboratory; NRP OCTL, National Research Program Organic Carbon Transformations Laboratory; 1998, National Mercury Pilot Study conducted in 1998; 2004–05, national study of mercury conducted in 2004–05; NWQL, National Water Quality Laboratory; 2002, national study of mercury conducted in 2002. See text for methods used in sample collection and processing]
Constituent
Column name from Appendix 1.
Water andsediment
sample data
National mercury studiesCHEY-
regDELR-
regNECB-
regUMIS-
regLaboratory Reference
1998 20022004–
051998–
991999–2000
1999–2000
2004
Major ionsSulfate Sulfate yes yes yes yes yes yes yes USGS WMRL; USGS
NWQL; USGS Atlanta, Ga. (NECB-reg, 1999
samples)
Fishman, M.J., and Friedman, L.C., 1989
Suspended sediment
Concentration SS yes yes yes yes yes no no USGS Sediment Labora-tory (Vancouver, Wash.; Iowa City,
Iowa)
Guy, H.P., 1969
Grain size (percent fines)
SS_Pct_063 yes yes yes yes no no no USGS Sediment Labora-tory (Vancouver, Wash.; Iowa City,
Iowa)
Guy, H.P., 1969
Data Collection
9
Table 3. Summary of samples collected and methods used for sample collection and processing and laboratory analysis of mercury, organic matter, sulfur, and size characterization in bed sediment, 1998–2005.
[See Appendix 1 for definition of column names and units of measurement. The 1998 National Mercury Pilot Study was conducted with the U.S. Geological Survey Toxic Substances Hydrology Program and National Water-Quality Assessment Program. CHEY-reg, regional study of mercury in the Cheyenne–Belle Fourche River Basins; DELR-reg, regional study of mercury in the Delaware River Basin; NECB-reg, regional study of mercury in the New England Coastal Basins; UMIS-reg, regional study of mercury in the Upper Mississippi River Basin; USGS, U.S. Geological Survey; WMRL, Wisconsin Mercury Research Laboratory; 1998, National Mercury Pilot Study conducted in 1998; SGL, Sulfur Geochemistry Laboratory; 2002, national study of mercury conducted in 2002; 2004–05, national study of mercury conducted in 2004–05]
Analyte
Column name from Appendix 1. Water
and sediment sample data
National mercury studiesCHEY-
regDELR-
regNECB-
regUMIS-
reg Sample collection and processing
referenceLaboratory
Laboratory analysis
reference1998 2002 2004–05 1998–
991999–2000
1999–2000
2004
MercuryTotal mercury STHg yes yes yes yes yes yes yes Krabbenhoft, D.P.,
Wiener, J.G., Brumbaugh, W.G., Olson, M.L., DeWild, J.F., and Sabin, T.J., 1999
USGS WMRL Olund, S.D., DeWild, J.F., Olson, M.L., and Tate, M.T., 2004
Lutz, M.A., Brigham, M.E., and Marvin-Di-Pasquale, Mark, 2008
Methylmercury SMeHg yes yes yes yes yes yes yes Krabbenhoft, D.P., Wiener, J.G., Brumbaugh, W.G., Olson, M.L., DeWild, J.F., and Sabin, T.J., 1999
USGS WMRL DeWild, J.F., Olund, S.D., Olson, M.L., and Tate, M.T., 2004
Lutz, M.A., Brigham, M.E., and Marvin-Di-Pasquale, Mark, 2008
10
Data on M
ercury in Water, B
ed Sediment, and Fish from
Streams A
cross the United States, 1998–2005
Table 3. Summary of samples collected and methods used for sample collection and processing and laboratory analysis of mercury, organic matter, sulfur, and size characterization in bed sediment, 1998–2005.—Continued
[See Appendix 1 for definition of column names and units of measurement. The 1998 National Mercury Pilot Study was conducted with the U.S. Geological Survey Toxic Substances Hydrology Program and National Water-Quality Assessment Program. CHEY-reg, regional study of mercury in the Cheyenne–Belle Fourche River Basins; DELR-reg, regional study of mercury in the Delaware River Basin; NECB-reg, regional study of mercury in the New England Coastal Basins; UMIS-reg, regional study of mercury in the Upper Mississippi River Basin; USGS, U.S. Geological Survey; WMRL, Wisconsin Mercury Research Laboratory; 1998, National Mercury Pilot Study conducted in 1998; SGL, Sulfur Geochemistry Laboratory, 2002; national study of mercury conducted in 2002; 2004–05, national study of mercury conducted in 2004–05]
Analyte
Column name from Appendix 1. Water
and sediment sample data
National mercury studiesCHEY-
regDELR-
regNECB-
regUMIS-
reg Sample collection and processing
referenceLaboratory
Laboratory analysis
reference1998 2002 2004–05 1998–
991999–2000
1999–2000
2004
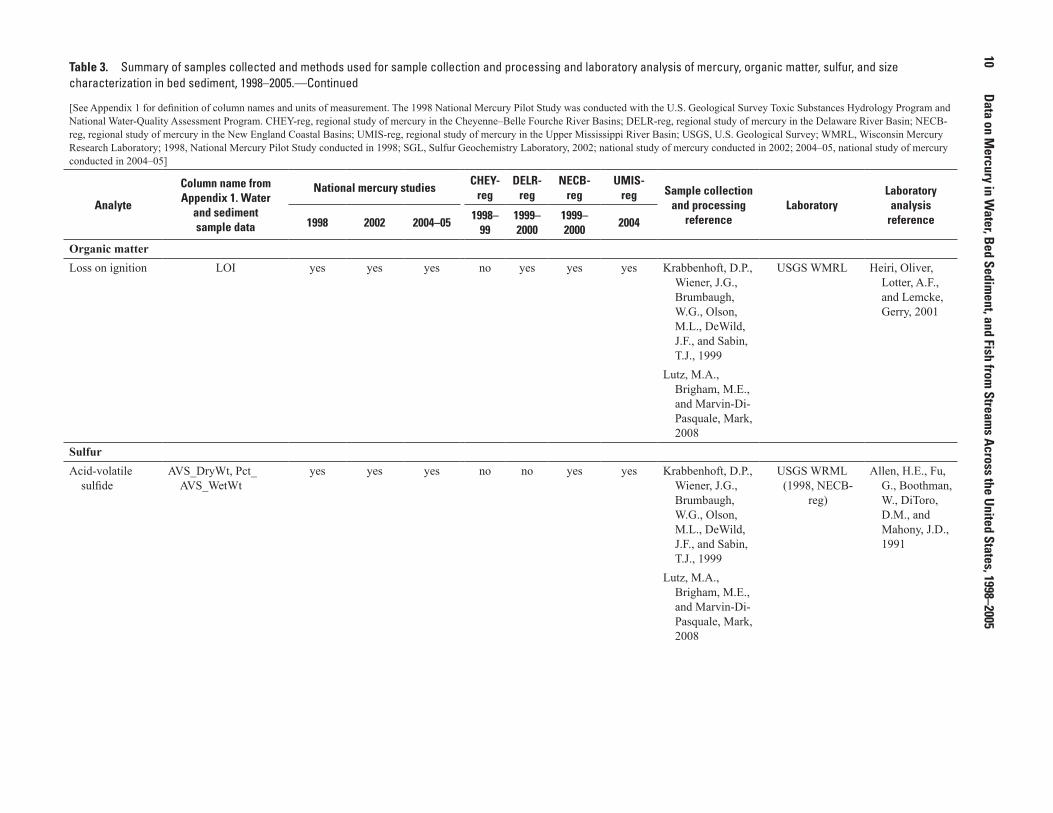
Organic matterLoss on ignition LOI yes yes yes no yes yes yes Krabbenhoft, D.P.,
Wiener, J.G., Brumbaugh, W.G., Olson, M.L., DeWild, J.F., and Sabin, T.J., 1999
USGS WMRL Heiri, Oliver, Lotter, A.F., and Lemcke, Gerry, 2001
Lutz, M.A., Brigham, M.E., and Marvin-Di-Pasquale, Mark, 2008
SulfurAcid-volatile
sulfideAVS_DryWt, Pct_
AVS_WetWtyes yes yes no no yes yes Krabbenhoft, D.P.,
Wiener, J.G., Brumbaugh, W.G., Olson, M.L., DeWild, J.F., and Sabin, T.J., 1999
USGS WRML (1998, NECB-
reg)
Allen, H.E., Fu, G., Boothman, W., DiToro, D.M., and Mahony, J.D., 1991
Lutz, M.A., Brigham, M.E., and Marvin-Di-Pasquale, Mark, 2008
Data Collection
11
Table 3. Summary of samples collected and methods used for sample collection and processing and laboratory analysis of mercury, organic matter, sulfur, and size characterization in bed sediment, 1998–2005.—Continued
[See Appendix 1 for definition of column names and units of measurement. The 1998 National Mercury Pilot Study was conducted with the U.S. Geological Survey Toxic Substances Hydrology Program and National Water-Quality Assessment Program. CHEY-reg, regional study of mercury in the Cheyenne–Belle Fourche River Basins; DELR-reg, regional study of mercury in the Delaware River Basin; NECB-reg, regional study of mercury in the New England Coastal Basins; UMIS-reg, regional study of mercury in the Upper Mississippi River Basin; USGS, U.S. Geological Survey; WMRL, Wisconsin Mercury Research Laboratory; 1998, National Mercury Pilot Study conducted in 1998; SGL, Sulfur Geochemistry Laboratory, 2002; national study of mercury conducted in 2002; 2004–05, national study of mercury conducted in 2004–05]
Analyte
Column name from Appendix 1. Water
and sediment sample data
National mercury studiesCHEY-
regDELR-
regNECB-
regUMIS-
reg Sample collection and processing
referenceLaboratory
Laboratory analysis
reference1998 2002 2004–05 1998–
991999–2000
1999–2000
2004
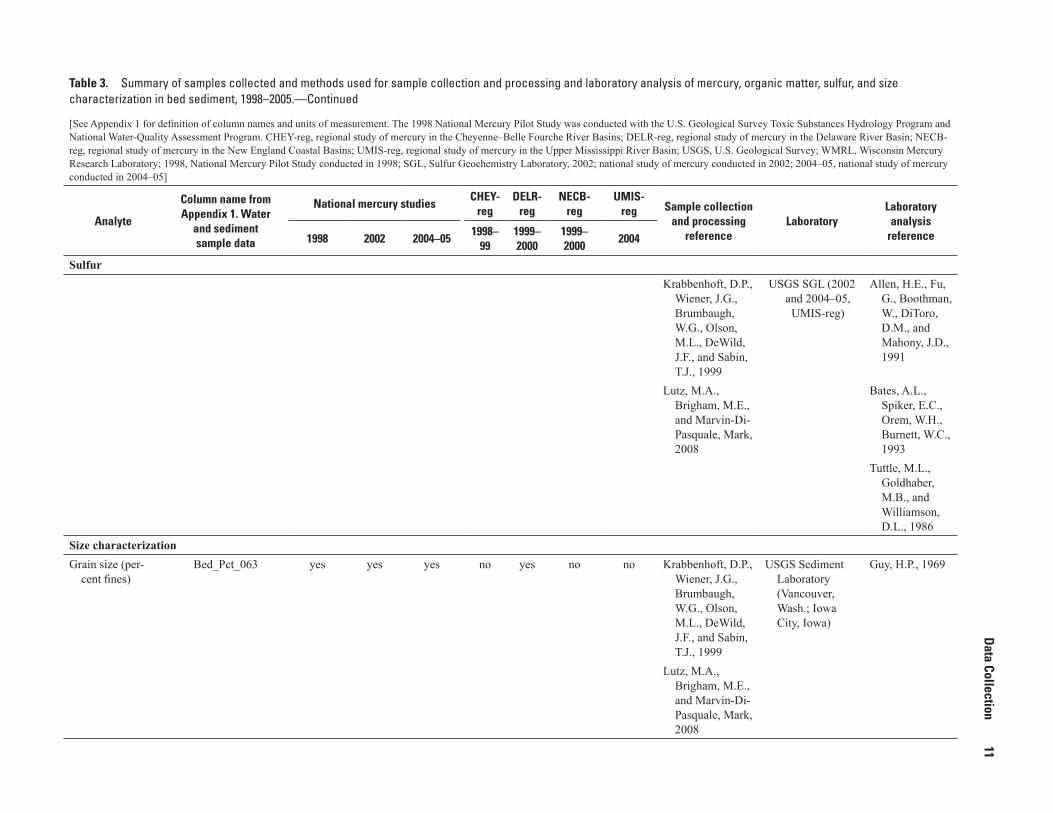
SulfurKrabbenhoft, D.P.,
Wiener, J.G., Brumbaugh, W.G., Olson, M.L., DeWild, J.F., and Sabin, T.J., 1999
USGS SGL (2002 and 2004–05, UMIS-reg)
Allen, H.E., Fu, G., Boothman, W., DiToro, D.M., and Mahony, J.D., 1991
Lutz, M.A., Brigham, M.E., and Marvin-Di-Pasquale, Mark, 2008
Bates, A.L., Spiker, E.C., Orem, W.H., Burnett, W.C., 1993
Tuttle, M.L., Goldhaber, M.B., and Williamson, D.L., 1986
Size characterizationGrain size (per-
cent fines) Bed_Pct_063 yes yes yes no yes no no Krabbenhoft, D.P.,
Wiener, J.G., Brumbaugh, W.G., Olson, M.L., DeWild, J.F., and Sabin, T.J., 1999
USGS Sediment Laboratory (Vancouver, Wash.; Iowa City, Iowa)
Guy, H.P., 1969
Lutz, M.A., Brigham, M.E., and Marvin-Di-Pasquale, Mark, 2008
12
Data on M
ercury in Water, B
ed Sediment, and Fish from
Streams A
cross the United States, 1998–2005
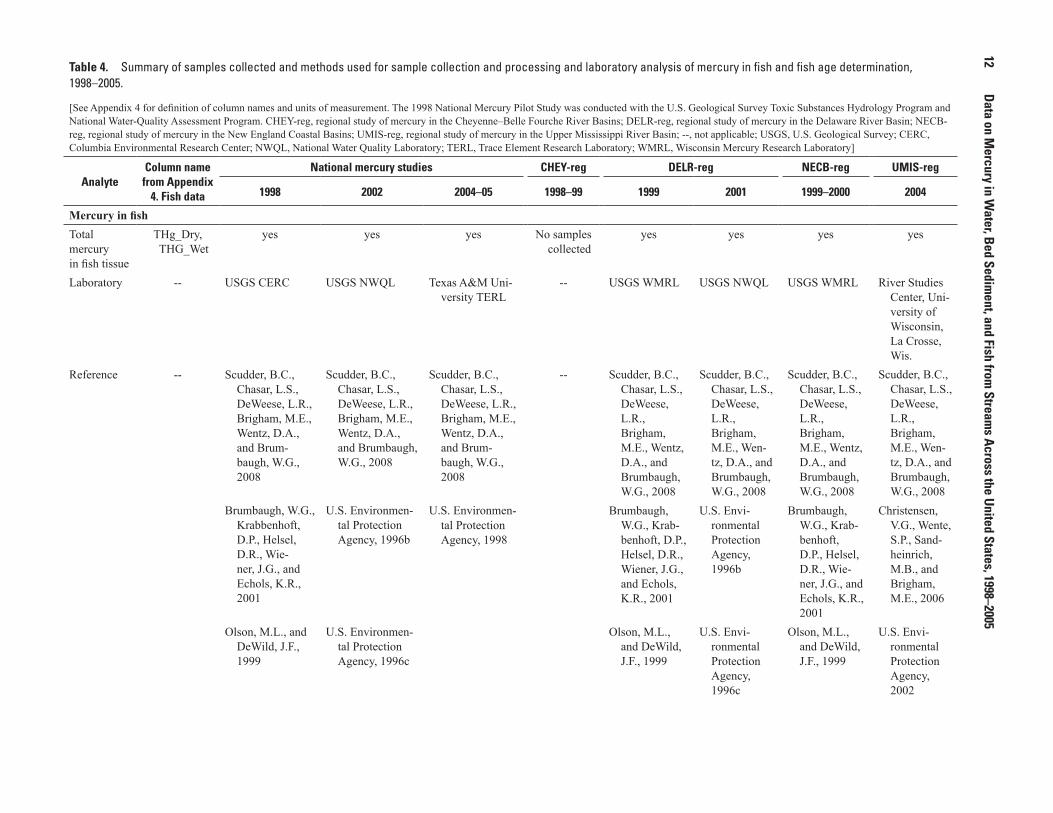
Table 4. Summary of samples collected and methods used for sample collection and processing and laboratory analysis of mercury in fish and fish age determination, 1998–2005.
[See Appendix 4 for definition of column names and units of measurement. The 1998 National Mercury Pilot Study was conducted with the U.S. Geological Survey Toxic Substances Hydrology Program and National Water-Quality Assessment Program. CHEY-reg, regional study of mercury in the Cheyenne–Belle Fourche River Basins; DELR-reg, regional study of mercury in the Delaware River Basin; NECB-reg, regional study of mercury in the New England Coastal Basins; UMIS-reg, regional study of mercury in the Upper Mississippi River Basin; --, not applicable; USGS, U.S. Geological Survey; CERC, Columbia Environmental Research Center; NWQL, National Water Quality Laboratory; TERL, Trace Element Research Laboratory; WMRL, Wisconsin Mercury Research Laboratory]
AnalyteColumn name
from Appendix 4. Fish data
National mercury studies CHEY-reg DELR-reg NECB-reg UMIS-reg
1998 2002 2004–05 1998–99 1999 2001 1999–2000 2004
Mercury in fishTotal mercury in fish tissue
THg_Dry, THG_Wet
yes yes yes No samples collected
yes yes yes yes
Laboratory -- USGS CERC USGS NWQL Texas A&M Uni-versity TERL
-- USGS WMRL USGS NWQL USGS WMRL River Studies Center, Uni-versity of Wisconsin, La Crosse, Wis.
Reference -- Scudder, B.C., Chasar, L.S., DeWeese, L.R., Brigham, M.E., Wentz, D.A., and Brum-baugh, W.G., 2008
Scudder, B.C., Chasar, L.S., DeWeese, L.R., Brigham, M.E., Wentz, D.A., and Brumbaugh, W.G., 2008
Scudder, B.C., Chasar, L.S., DeWeese, L.R., Brigham, M.E., Wentz, D.A., and Brum-baugh, W.G., 2008
-- Scudder, B.C., Chasar, L.S., DeWeese, L.R., Brigham, M.E., Wentz, D.A., and Brumbaugh, W.G., 2008
Scudder, B.C., Chasar, L.S., DeWeese, L.R., Brigham, M.E., Wen-tz, D.A., and Brumbaugh, W.G., 2008
Scudder, B.C., Chasar, L.S., DeWeese, L.R., Brigham, M.E., Wentz, D.A., and Brumbaugh, W.G., 2008
Scudder, B.C., Chasar, L.S., DeWeese, L.R., Brigham, M.E., Wen-tz, D.A., and Brumbaugh, W.G., 2008
Brumbaugh, W.G., Krabbenhoft, D.P., Helsel, D.R., Wie-ner, J.G., and Echols, K.R., 2001
U.S. Environmen-tal Protection Agency, 1996b
U.S. Environmen-tal Protection Agency, 1998
Brumbaugh, W.G., Krab-benhoft, D.P., Helsel, D.R., Wiener, J.G., and Echols, K.R., 2001
U.S. Envi-ronmental Protection Agency, 1996b
Brumbaugh, W.G., Krab-benhoft, D.P., Helsel, D.R., Wie-ner, J.G., and Echols, K.R., 2001
Christensen, V.G., Wente, S.P., Sand-heinrich, M.B., and Brigham, M.E., 2006
Olson, M.L., and DeWild, J.F., 1999
U.S. Environmen-tal Protection Agency, 1996c
Olson, M.L., and DeWild, J.F., 1999
U.S. Envi-ronmental Protection Agency, 1996c
Olson, M.L., and DeWild, J.F., 1999
U.S. Envi-ronmental Protection Agency, 2002
Data Collection
13
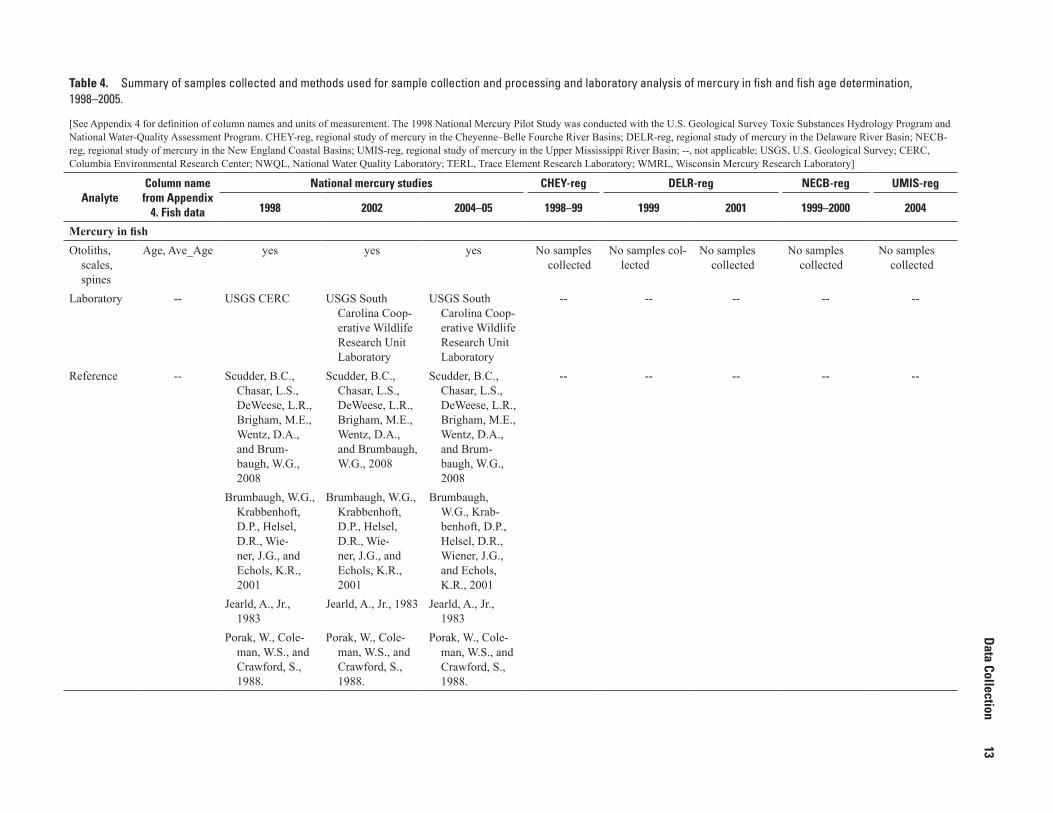
Table 4. Summary of samples collected and methods used for sample collection and processing and laboratory analysis of mercury in fish and fish age determination, 1998–2005.
[See Appendix 4 for definition of column names and units of measurement. The 1998 National Mercury Pilot Study was conducted with the U.S. Geological Survey Toxic Substances Hydrology Program and National Water-Quality Assessment Program. CHEY-reg, regional study of mercury in the Cheyenne–Belle Fourche River Basins; DELR-reg, regional study of mercury in the Delaware River Basin; NECB-reg, regional study of mercury in the New England Coastal Basins; UMIS-reg, regional study of mercury in the Upper Mississippi River Basin; --, not applicable; USGS, U.S. Geological Survey; CERC, Columbia Environmental Research Center; NWQL, National Water Quality Laboratory; TERL, Trace Element Research Laboratory; WMRL, Wisconsin Mercury Research Laboratory]
AnalyteColumn name
from Appendix 4. Fish data
National mercury studies CHEY-reg DELR-reg NECB-reg UMIS-reg
1998 2002 2004–05 1998–99 1999 2001 1999–2000 2004
Mercury in fishOtoliths,
scales, spines
Age, Ave_Age yes yes yes No samples collected
No samples col-lected
No samples collected
No samples collected
No samples collected
Laboratory -- USGS CERC USGS South Carolina Coop-erative Wildlife Research Unit Laboratory
USGS South Carolina Coop-erative Wildlife Research Unit Laboratory
-- -- -- -- --
Reference -- Scudder, B.C., Chasar, L.S., DeWeese, L.R., Brigham, M.E., Wentz, D.A., and Brum-baugh, W.G., 2008
Scudder, B.C., Chasar, L.S., DeWeese, L.R., Brigham, M.E., Wentz, D.A., and Brumbaugh, W.G., 2008
Scudder, B.C., Chasar, L.S., DeWeese, L.R., Brigham, M.E., Wentz, D.A., and Brum-baugh, W.G., 2008
-- -- -- -- --
Brumbaugh, W.G., Krabbenhoft, D.P., Helsel, D.R., Wie-ner, J.G., and Echols, K.R., 2001
Brumbaugh, W.G., Krabbenhoft, D.P., Helsel, D.R., Wie-ner, J.G., and Echols, K.R., 2001
Brumbaugh, W.G., Krab-benhoft, D.P., Helsel, D.R., Wiener, J.G., and Echols, K.R., 2001
Jearld, A., Jr., 1983
Jearld, A., Jr., 1983 Jearld, A., Jr., 1983
Porak, W., Cole-man, W.S., and Crawford, S., 1988.
Porak, W., Cole-man, W.S., and Crawford, S., 1988.
Porak, W., Cole-man, W.S., and Crawford, S., 1988.
14 Data on Mercury in Water, Bed Sediment, and Fish from Streams Across the United States, 1998–2005
containers were positioned in front of the boat and extended upstream into the current. Samples from nonwadeable sites were also collected from bridges using the reed-and-suspension method and dip or isokinetic, depth-integrated methods on the upstream side of the bridge (Wilde and others, 1999).
Dip samples were collected for THg and MeHg in fluorocarbon polymer (Teflon®) bottles supplied by the USGS Wisconsin Mercury Research Laboratory (WMRL) in Middleton, Wis., or in new polyethylene terephthalate copolyester, glycol-modified (PETG) containers; the latter were typically used in 2002 and beyond. All fluorocarbon polymer sample bottles were rigorously cleaned by the WMRL (Olson and DeWild, 1999), partially filled with 1 percent hydrochloric acid (HCl, OmniTrace™) and shipped in double zip-seal plastic bags. All PETG bottles (Nalgene®) were new (cap seals intact) and were stored in double zip-seal plastic bags until use. Dip samples for DOC and sulfate analysis were collected using a Teflon® bottle or from the PETG bottles that were used for the Hg sample. Samples for suspended-sediment concentration and grain-size analysis were collected in widemouth 1-liter plastic bottles or other appropriate suspended-sediment sampling bottle, using methods comparable to those used for the other water-quality samples (as noted above, either dip in approximate centroid of flow, or with an isokinetic sampler).
Stream-Water Sample Processing
Stream-water samples were processed for the analysis of unfiltered THg (UTHg) and unfiltered MeHg (UMeHg) or for FTHg, FMeHg, PTHg, and PMeHg. The type of analysis for each study is shown in table 2. In this report, “filtered” refers to constituents that pass through a filter, and includes dissolved and filter-passing colloidally bound constituents. “Particulate” refers to constituents retained on the filter and includes sediment and organic detritus.
Stream-water samples collected for the analysis of UTHg were preserved in the field by addition of 6 N HCl to a final concentration of approximately 1 percent by volume. Samples collected for UMeHg analysis were frozen immediately on dry ice until analysis. Samples collected for analysis of FTHg and FMeHg were vacuum filtered through combusted, 47 mil-limeter (mm), 0.7-micrometer (µm) quartz-fiber filters in the field in a sample processing chamber (Lane and others, 2003); preserved with 6 N HCl to a concentration of approximately 1 percent by volume; double bagged in zip-seal bags; and stored in a closed dark cooler until analysis (Olson and DeWild, 1999; Lewis and Brigham, 2004). The volume of water filtered through a filter was recorded for subsequent conversion of particulate amount to mass per volume. The quartz-fiber filters were transferred to Teflon® Petri dishes, double-bagged in new plastic zip-seal bags, and immediately placed on dry ice; filters were maintained frozen until analysis of PTHg and PMeHg.
Samples collected for the analysis of DOC and sulfate were processed in the field as directed by the USGS NFM (Lane and others, 2003; Wilde and others, 2004). DOC sam-ples were filtered through combusted, 0.7-µm glass fiber fil-ters, chilled, and stored at 4° Celsius (C). Sulfate samples were filtered through 0.45-µm membrane or polysulfone capsule filters, and stored until analysis. Unfiltered and unpreserved suspended-sediment samples were stored in original collection bottles until analysis.
Bed-Sediment Sample Collection
Detailed descriptions of bed-sediment sampling methods for all USGS NAWQA Hg sampling efforts and regional Hg studies are provided in Krabbenhoft and others (1999) and Lutz and others (2008). Clean sampling methods were adapted from Shelton and Capel (1994). An acid-cleaned Teflon® or plastic scoop was used to collect the top (approximately) 2 centimeter (cm) of bed sediment from 5 to 10 depositional areas; these samples were composited in acid-cleaned Teflon®, plastic, or glass containers into one sample for each stream site.
Bed-Sediment Sample Processing
Bed-sediment composites were immediately homog-enized by stirring with a Teflon spatula and subsampled in the field. Bed-sediment subsamples for analysis of total Hg (STHg) and MeHg (SMeHg) were placed in acid-cleaned polypropylene or Teflon® vials and stored frozen until analy-sis. AVS subsamples were placed in clean polypropylene jars, and samples for the 1998 and 2002 national studies and NECB regional study were preserved with 0.3 milliliter of zinc acetate. All AVS samples were stored frozen until analysis. Subsamples for the analysis of bed-sediment grain size were placed in polypropylene jars and stored until analysis. Detailed descriptions of the steps for processing bed-sediment samples are available in Krabbenhoft and others (1999) and Lutz and others (2008).
Fish Sampling and Processing
Fish sampling and sample processing methods are detailed in Scudder and others (2008). Field personnel collected up to eight largemouth bass or other black bass (Micropterus spp.), approximately 3 to 4 years old, whenever possible, at each sampling site. If bass were difficult to collect in the target age range or were not present in a study area, alternate predator fish (piscivorous or insectivorous) species were chosen from a priority list provided in Scudder and oth-ers (2008). Multiple sampling methods were used, including electrofishing, seining, and hook and line.
Fish samples collected during the 1998 National Mer-cury Pilot Study were rinsed in stream water, measured as individual samples for weight and length, placed whole in
Analytical Methods 15
double zip-seal bags, and frozen until they were analyzed (Brumbaugh and others, 2001). For the 2002 and 2004–05 national studies and the NECB regional study, fish were weighed, measured and processed in the field to obtain axial muscle (skinless fillet) tissue, as detailed by Scudder and oth-ers (2008). Fillets were rinsed with deionized water, placed in double zip-seal bags, and frozen until analysis. For the DELR regional study, fish were weighed and measured in the field and processed either in the laboratory or field to obtain fillet samples. Fish collected during the UMIS regional study were stored on wet ice in plastic bags with sample water from the collection site until transfer to refrigerators. After length and weight measurements in a laboratory setting, fish were frozen until analysis (Christensen and others, 2006). Fish samples were not collected during the CHEY regional study.
Otoliths, scales, or spines were obtained from each fish collected during the national studies for age determination. Similar materials were not obtained from fish collected during the DELR, NECB, and UMIS regional studies.
Analytical Methods
Multiple analytical laboratories were used for the national and regional Hg studies; a summary of methods and laborato-ries is provided in tables 2–4.
Stream Water
All samples for unfiltered, filtered, and particulate THg and MeHg were analyzed by the WMRL. The analytical procedures for determining THg in unfiltered and filtered water are detailed in U.S. Environmental Protection Agency (USEPA) Method 1631 (U.S. Environmental Protection Agency, 2002), as adapted by the WMRL (Olson and others, 1997; Olson and DeWild, 1999). Briefly, THg samples were oxidized with bromine monochloride (BrCl) under acidic conditions, treated with stannous chloride (SnCl2) to reduce ionic Hg to elemental Hg, and quantified with cold vapor atomic fluorescence spectroscopy (CVAFS). Samples were analyzed for MeHg by distillation, aqueous phase ethylation, purge and trap of volatile ethylmercury derivatives, gas-chromatographic separation, pyrolization, and CVAFS determination (Bloom, 1989, as modified by Horvat and others, 1993; Olson and DeWild, 1999; DeWild and others, 2002). Concentrations of PTHg and PMeHg were determined by analyzing the 0.7-µm quartz-fiber filters obtained from the stream-water filtration for FTHg and FMeHg. Filters for PTHg analysis were thawed and placed in Teflon bottles, and BrCl was added. Samples were oxidized, treated with SnCl2, and analyzed according to USEPA Method 1631 using CVAFS (U.S. Environmental Protection Agency, 2002; Olund and others, 2004). Filters for PMeHg analysis were placed in Teflon bottles for distillation and reagents were added. Samples were distilled, and the distillates were analyzed
following the procedures described for aqueous MeHg (DeWild and others, 2002; DeWild and others, 2004).
Concentrations of DOC for the 1998 and 2004–05 national studies and the NECB and UMIS regional studies were determined by the USGS National Research Program Organic Carbon Transformations Laboratory (NRP OCTL) in Boulder, Colo., using a persulfate wet oxidation method as described in Aiken (1992). DOC samples for the CHEY regional study were analyzed at the WMRL using the same wet oxidation method. Water samples for the 2002 national study and the DELR regional study were analyzed for DOC concentration at the USGS National Water Quality Laboratory (NWQL) in Denver, Colo., following a UV-promoted persul-fate oxidation and infrared spectroscopy (Brenton and Arnett, 1993). For samples analyzed by the NRP OCTL, carbon frac-tions of DOC (hydrophobic organic acids, hydrophilic acids, and transphilic acids) were measured by a modified version of the XAD-8 and XAD-4 methods (Aiken and others, 1992). SUVA was calculated by measuring the UV absorbance at 254 nanometers and dividing by the DOC concentration (Weishaar and others, 2003).
Water samples were analyzed for sulfate by the WMRL (1998 National Mercury Pilot Study), the NWQL (2002 and 2004–05 NAWQA national studies; CHEY, DELR, NECB, and UMIS regional studies), and the USGS laboratory in Atlanta, Ga. (1999 NECB regional study). All laboratories used ion chromatography for analysis (Fishman and Friedman, 1989).
Suspended-sediment samples were analyzed by the USGS sediment laboratories in Vancouver, Wash., and Iowa City, Iowa, for concentration and grain size (percent fines) (Guy, 1969).
Bed Sediment
Bed-sediment samples were analyzed by the WMRL for STHg and SMeHg concentrations using similar analytical pro-cedures as those described above for aqueous and particulate samples, with some modification (DeWild and others, 2004; Olund and others, 2004). The WMRL also determined LOI, a measure of organic carbon content of sediment, as described by Heiri and others (2001), and sediment dry weight (percent solids) by drying wet sediment at 105°C.
AVS was analyzed by the WMRL (1998 National Mer-cury Pilot Study, NECB regional study) and by the USGS Sulfur Geochemistry Laboratory (SGL) (2002 and 2004–05 national studies, UMIS regional study) in Reston, Va. The WMRL procedure required acidification of each sample with 6 N HCl, trapping released sulfide in an antioxidant buffer, and determination of sulfide by ion-specific electrode (Allen and others, 1991). At the SGL, AVS was separated using an HCl extraction and reprecipitation as silver sulfide. Percent by weight of AVS in the sediment sample was subsequently deter-mined gravimetrically (Canfield and others, 1986; Tuttle and others, 1986; Allen and others, 1991; Bates and others, 1993).
16 Data on Mercury in Water, Bed Sediment, and Fish from Streams Across the United States, 1998–2005
Bed sediment was analyzed for grain size (percent fines) by the USGS sediment laboratories in Vancouver, Wash., and Iowa City, Iowa (Guy, 1969).
Fish
Fish samples collected during the 1998 National Mer-cury Pilot Study were processed and analyzed at the USGS Columbia Environmental Research Center (CERC) in Colum-bia, Mo. Fish less than approximately 50 grams (g) in weight were analyzed whole or whole minus head; fish greater than 50 g were filleted to obtain a sample of skin-off axial muscle (Brumbaugh and others, 2001). All whole fish and fish muscle tissue were freeze-dried to a constant weight, finely ground, and stored in a dessicator until analysis. For each site, samples from the same species and of similar size were composited and analyzed as one sample. Fish samples were analyzed for THg using an acid/microwave digestion, BrCl oxidation, and CVAFS (Olson and DeWild, 1999; Brumbaugh and others, 2001). Only THg was analyzed because approximately 95 percent of Hg in fish is MeHg (Huckabee and others, 1979; Bloom, 1992; Wiener and Spry, 1996).
Fillet samples for the 2002 national study were analyzed at the NWQL. Each sample was freeze-dried to constant weight and finely ground, and fish of a single species from each site were analyzed as one composite sample. THg was determined using acid/microwave digestion, BrCl oxidation, and CVAFS in accordance with USEPA method 3052 for digestion (U.S. Environmental Protection Agency, 1996b) and USEPA method 7474 (U.S. Environmental Protection Agency, 1996c) for Hg analysis.
Fillet samples collected during the 2004–05 national study were analyzed for THg at the Texas A&M University Trace Element Research Laboratory (TERL) in College Sta-tion, Tex. Each sample was freeze-dried to constant weight, finely ground, and analyzed individually (1–13 fish per site) using USEPA method 7473 (combustion-trapping-atomic absorption; U.S. Environmental Protection Agency, 1998).
Skin-off fillet samples collected during the DELR regional study in 1999 and during the NECB regional study were analyzed at the WRML using a process similar to that used by CERC to analyze the 1998 National Mercury Pilot Study fish samples. The skin-off fillets collected during the 2001 DELR regional study were analyzed by the NWQL according to methods described for the 2002 national fish samples.
Fish collected for the UMIS regional study were analyzed as composites samples of whole fish, skin-on fillets, or skin-off fillets by the River Studies Center, University of Wisconsin, La Crosse, Wis. (Christensen and others, 2006). Subsamples from composite samples were digested using a modification of USEPA Method 1631 (U.S. Environmental Protection Agency, 2002; Christensen and others, 2006). Digested subsamples were analyzed by flow-injection CVAFS.
For the national studies and the UMIS regional study, moisture content (percent water) was determined by weight loss upon freeze-drying and is reported as the weight percent-age of the original wet sample. Moisture content was not reported for the DELR and NECB regional studies. Fish ages were estimated from sagittal otoliths, scales, or spines by the CERC (1998 National Mercury Pilot Study) or the USGS South Carolina Cooperative Fish and Wildlife Research Unit (2002 and 2004–05 national studies) (Jearld, 1983; Porak and others, 1988; Brumbaugh and others, 2001; Scudder and oth-ers, 2008).
The Integrated Taxonomic Identification System (ITIS) codes (http://www.itis.gov/) for all fish species sampled are included in Appendix 4.
Quality Assurance
The quality of stream-water, bed-sediment, and fish data was assured through a variety of quality-control (QC) samples collected in the field and laboratory. These included blank and replicate samples, spike recoveries, and certified and standard reference materials. Blank and replicate field QC samples were used to assess the bias and variability that may be introduced by sample collection, processing, and analysis. Laboratory QC samples were routinely analyzed to calibrate instruments, identify procedural problems, validate data, and provide defensible analytical data. Field QC samples will be discussed for water and bed sediment only; information on laboratory QC samples for water and bed sediment is available in references listed in tables 2–4. Field QC samples were not collected for fish because the nature of this medium does not allow collection of true field blanks or replicates. Laboratory QC samples to be discussed for fish include blanks, replicate and spiked samples, and reference materials. Summary and analysis of QC data are grouped by analyte and laboratory.
Quality of Water and Bed-Sediment Data
Field-blank samples for water were collected using inorganic- and organic-free water that contained no detectable concentrations of the analytes of interest. The blank water was processed in the field and analyzed identically to environmen-tal samples. Field-blank samples were used to determine if contamination of samples occurred during sampling, process-ing, and analysis.
Most field-replicate samples were two or more samples collected in sequence, processed, and analyzed using iden-tical methods. Two separate field samples were split into subsamples to make two replicate sets. For filtered samples, the filter was changed before the processing of each sample. Replicate sample data (environmental sample and additional QC samples) yield information on overall precision of the field and laboratory methods.
Quality Assurance 17
Blanks
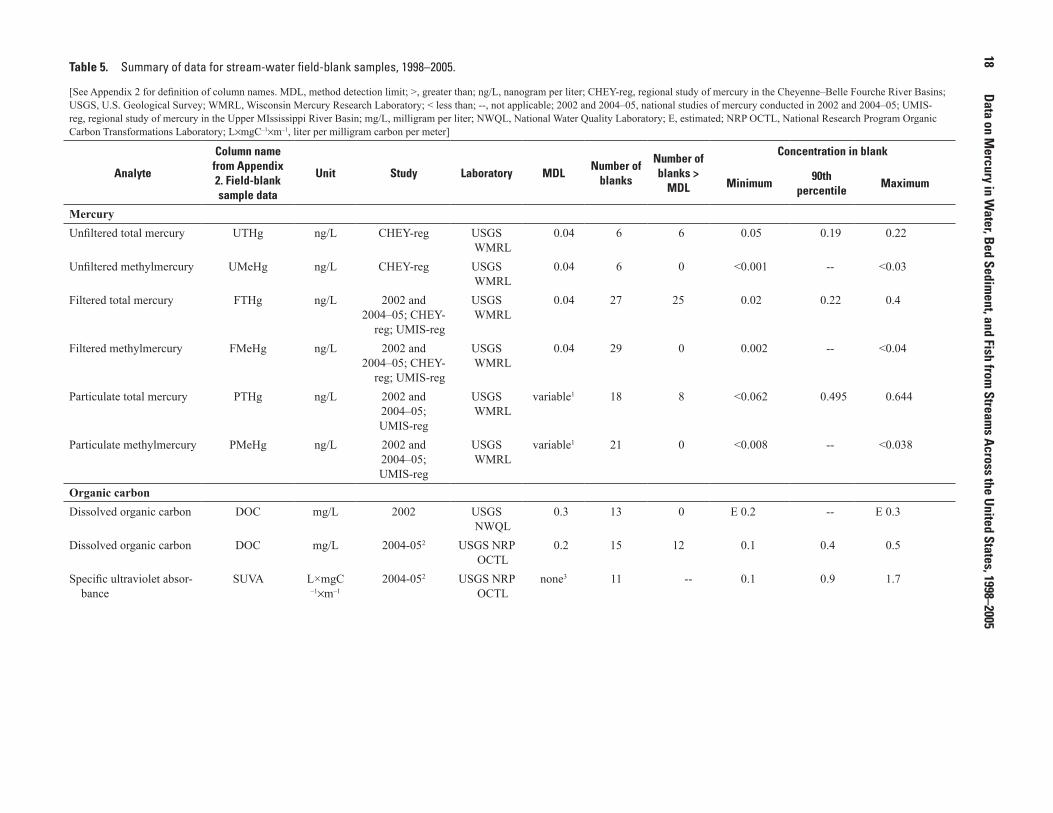
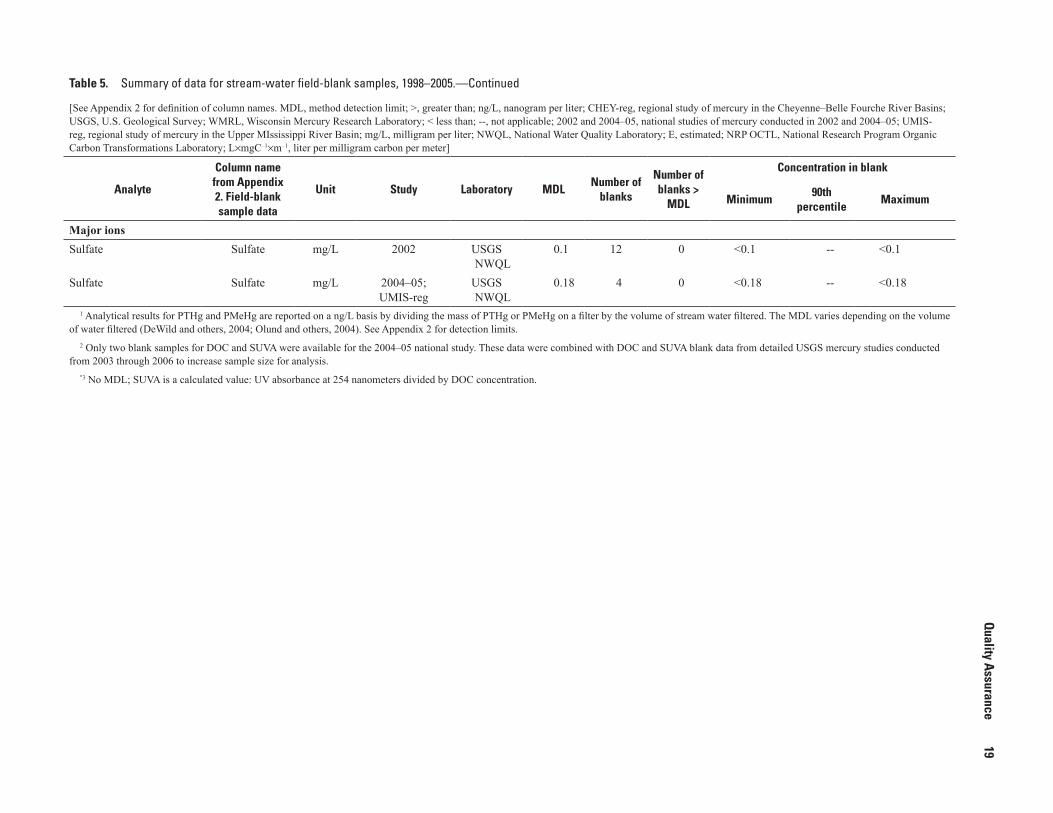
Data for field-blank samples are summarized in table 5. UMeHg, FMeHg, PMeHg, and sulfate were not detected in any blank samples. DOC concentrations in blank samples from the 2002 national study were not detected above the method detection limit (MDL); six samples had concentrations that were detected at or below the MDL.
Concentrations of UTHg, FTHg, PTHg, and DOC (2004–05 national study) were greater than the respective MDLs in multiple blank samples. All six blank samples for UTHg had concentrations greater than the MDL of 0.04 nanogram per liter (ng/L). Concentrations of UTHg in all environmental samples for the 1998 National Mercury Pilot Study and the CHEY, DELR, and NECB regional studies were greater than the maximum blank concentration of 0.22 ng/L. For these studies, UTHg concentrations were measured values for unfiltered samples. Concentrations of UTHg for the 2002 and 2004–05 national studies and UMIS regional study were calculated values (sum of FTHg and PTHg); blank values are not reported for calculated UTHg.
Most (25 of 27) blank samples for FTHg had concentra-tions detected above the MDL of 0.04 ng/L, with concentra-tions ranging from 0.02 to 0.4 ng/L. There was, however, little overlap between concentrations of FTHg in blank samples and most environmental samples (fig. 2A). Concentrations of PTHg were detected in less than 50 percent (8 of 18) of the blank samples. Overlap of some of the higher PTHg con-centrations in blanks with concentrations in environmental samples may indicate positive bias of PTHg for some environ-mental data values (fig. 2B).
For the 2004–05 national study, only two blank samples were available for DOC and SUVA analysis. To increase sample size for analysis, data for these two samples were combined with blank sample DOC data collected between 2003 and 2006 from site-specific Hg studies conducted by the NAWQA Program (Brigham and others, 2008). The site-specific studies used essentially the same collection, processing, and analytical methods as the 2002 and 2004–05 national studies. Twelve of 15 blank samples for DOC from the combined studies were detected at concentrations greater than the MDL; however, only one environmental sample for the 2004–05 national study had a DOC concentration less than the maximum blank concentration. Concentrations of DOC in all remaining environmental samples for the 2004–05 national study were at least three times greater than the maxi-mum blank concentration. Blank-sample data for SUVA are included in this report even though SUVA is a calculated value (UV absorbance at 254 nanometers divided by DOC concen-tration). Only two environmental samples from the 2004–05 national study had SUVA concentrations that were less than or equal to the maximum blank concentration of 1.7 liters per milligram carbon per meter. SUVA data can be useful in inter-pretation and analysis of Hg and DOC data.
Replicates
Replicate data for water and bed-sediment samples are summarized in tables 6–7. Variability in sample data can be estimated by analyzing the distribution of replicate data using the standard deviation (SD) or the relative standard deviation (RSD, standard deviation divided by the mean concentration). For many water-quality analytes, the SD of replicate sets gen-erally is uniform at low concentrations, but SD increases with increasing concentration. At higher concentrations, the RSD generally is uniform (Mueller and Titus, 2005). Variability of an analyte with a wide range of concentrations can be esti-mated by dividing the data into low- and high-concentration ranges based on the distribution of the SD or the RSD (Ander-son, 1987). For low-concentration ranges, the mean SD of rep-licates is used to estimate variability; for high-concentration ranges, the mean RSD is used (Mueller and Titus, 2005).
For all replicate data, only replicate pairs with detected concentrations for each sample were used to estimate vari-ability. As the first step in assessing variability of data col-lected during the national and regional studies, the SD and the RSD for each analyte were plotted (ordinate) against the mean replicate concentration (abscissa). The values at which concentrations were divided into low- and high-concentration ranges were estimated by fitting a loess [local regression nonparametric smoothing technique (S-Plus 7.0 for Windows, Insightful Corporation, Seattle, Wash.)] curve through the data and visually examining the SD or RSD plots for gaps in mean concentration and a change in the slope of the loess curve. For some analytes, there was no obvious difference in SD or RSD throughout the range of mean replicate concentration. Variabil-ity for these analytes was estimated by the RSD for the entire range of concentrations, which may overestimate the variabil-ity for a low range of concentration data.
In general, SDs for FTHg and FMeHg in the lower concentration ranges were similar to, though numerically slightly less than, the respective values for PTHg and PMeHg (table 6). In the higher concentration ranges, the RSD for FTHg was about one-third that for PTHg, whereas the RSD for FMeHg was about twice that for PMeHg (table 6). More-over, RSD values for UTHg and UMeHg were as much as 4–5 times greater than the respective values of filtered or particu-late values (tables 6, 7). These data suggest that the presence of particulate matter can have important effects on analyte variability.
SDs for DOC and sulfate in stream water in the low range of concentrations were 0.08 and 0.09 mg/L, respectively. RSD values for DOC, sulfate, and SUVA in high-concentration ranges also were low, less than or equal to 2.5 percent. RSD values for bed-sediment samples of LOI for the entire concen-tration range and AVS for the high-concentration range were 8.4 and 18.3 percent, respectively.
18
Data on M
ercury in Water, B
ed Sediment, and Fish from
Streams A
cross the United States, 1998–2005
Table 5. Summary of data for stream-water field-blank samples, 1998–2005.
[See Appendix 2 for definition of column names. MDL, method detection limit; >, greater than; ng/L, nanogram per liter; CHEY-reg, regional study of mercury in the Cheyenne–Belle Fourche River Basins; USGS, U.S. Geological Survey; WMRL, Wisconsin Mercury Research Laboratory; < less than; --, not applicable; 2002 and 2004–05, national studies of mercury conducted in 2002 and 2004–05; UMIS-reg, regional study of mercury in the Upper MIssissippi River Basin; mg/L, milligram per liter; NWQL, National Water Quality Laboratory; E, estimated; NRP OCTL, National Research Program Organic Carbon Transformations Laboratory; L×mgC–1×m–1, liter per milligram carbon per meter]
Analyte
Column name from Appendix 2. Field-blank sample data
Unit Study Laboratory MDLNumber of
blanks
Number of blanks >
MDL
Concentration in blank
Minimum90th
percentileMaximum
MercuryUnfiltered total mercury UTHg ng/L CHEY-reg USGS
WMRL0.04 6 6 0.05 0.19 0.22
Unfiltered methylmercury UMeHg ng/L CHEY-reg USGS WMRL
0.04 6 0 <0.001 -- <0.03
Filtered total mercury FTHg ng/L 2002 and 2004–05; CHEY-
reg; UMIS-reg
USGS WMRL
0.04 27 25 0.02 0.22 0.4
Filtered methylmercury FMeHg ng/L 2002 and 2004–05; CHEY-
reg; UMIS-reg
USGS WMRL
0.04 29 0 0.002 -- <0.04
Particulate total mercury PTHg ng/L 2002 and 2004–05; UMIS-reg
USGS WMRL
variable1 18 8 <0.062 0.495 0.644
Particulate methylmercury PMeHg ng/L 2002 and 2004–05; UMIS-reg
USGS WMRL
variable1 21 0 <0.008 -- <0.038
Organic carbonDissolved organic carbon DOC mg/L 2002 USGS
NWQL0.3 13 0 E 0.2 -- E 0.3
Dissolved organic carbon DOC mg/L 2004-052 USGS NRP OCTL
0.2 15 12 0.1 0.4 0.5
Specific ultraviolet absor-bance
SUVA L×mgC–1×m–1
2004-052 USGS NRP OCTL
none3 11 -- 0.1 0.9 1.7
Quality A
ssurance
19Table 5. Summary of data for stream-water field-blank samples, 1998–2005.—Continued
[See Appendix 2 for definition of column names. MDL, method detection limit; >, greater than; ng/L, nanogram per liter; CHEY-reg, regional study of mercury in the Cheyenne–Belle Fourche River Basins; USGS, U.S. Geological Survey; WMRL, Wisconsin Mercury Research Laboratory; < less than; --, not applicable; 2002 and 2004–05, national studies of mercury conducted in 2002 and 2004–05; UMIS-reg, regional study of mercury in the Upper MIssissippi River Basin; mg/L, milligram per liter; NWQL, National Water Quality Laboratory; E, estimated; NRP OCTL, National Research Program Organic Carbon Transformations Laboratory; L×mgC–1×m–1, liter per milligram carbon per meter]
Analyte
Column name from Appendix 2. Field-blank sample data
Unit Study Laboratory MDLNumber of
blanks
Number of blanks >
MDL
Concentration in blank
Minimum90th
percentileMaximum
Major ionsSulfate Sulfate mg/L 2002 USGS
NWQL0.1 12 0 <0.1 -- <0.1
Sulfate Sulfate mg/L 2004–05; UMIS-reg
USGS NWQL
0.18 4 0 <0.18 -- <0.18
1 Analytical results for PTHg and PMeHg are reported on a ng/L basis by dividing the mass of PTHg or PMeHg on a filter by the volume of stream water filtered. The MDL varies depending on the volume of water filtered (DeWild and others, 2004; Olund and others, 2004). See Appendix 2 for detection limits.
2 Only two blank samples for DOC and SUVA were available for the 2004–05 national study. These data were combined with DOC and SUVA blank data from detailed USGS mercury studies conducted from 2003 through 2006 to increase sample size for analysis.
"3 No MDL; SUVA is a calculated value: UV absorbance at 254 nanometers divided by DOC concentration.
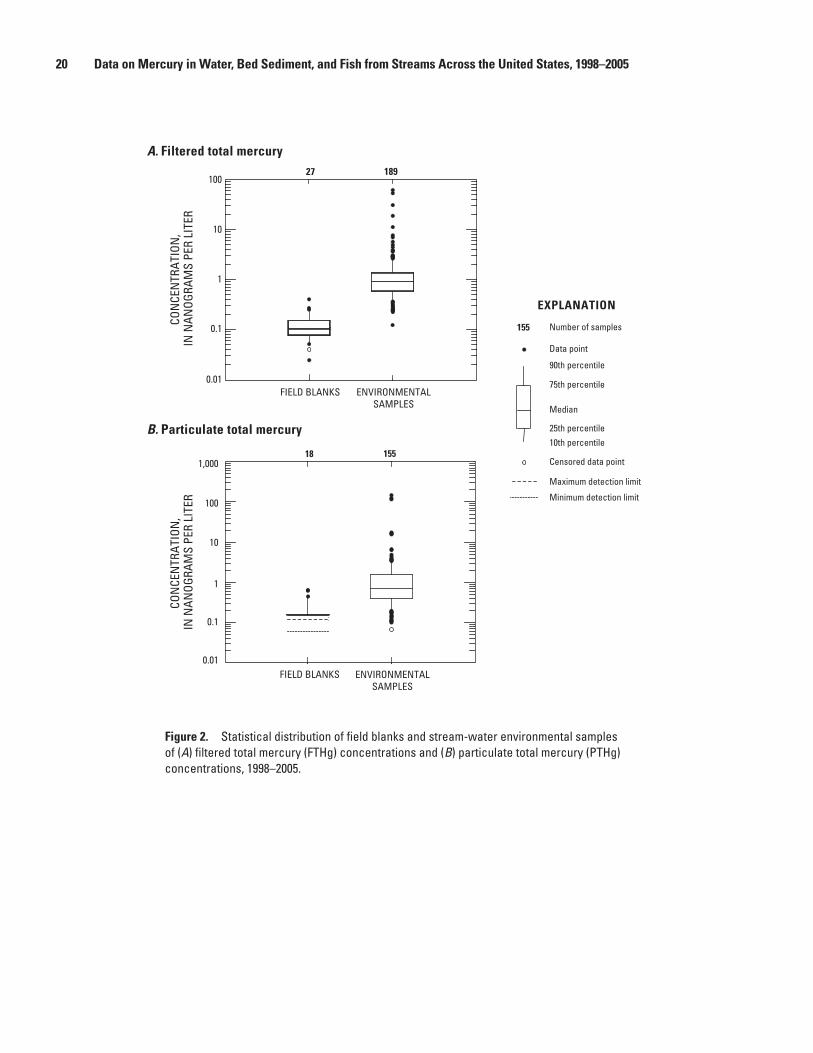
20 Data on Mercury in Water, Bed Sediment, and Fish from Streams Across the United States, 1998–2005
Figure 2. Statistical distribution of field blanks and stream-water environmental samples of (A) filtered total mercury (FTHg) concentrations and (B) particulate total mercury (PTHg) concentrations, 1998–2005.
FIELD BLANKS ENVIRONMENTALSAMPLES
CON
CEN
TRAT
ION
, IN
NAN
OGRA
MS
PER
LITE
RCO
NCE
NTR
ATIO
N,
IN N
ANOG
RAM
S PE
R LI
TER
0.01
0.1
1
10
100
10
100
1,000
0.1
0.01
1
A. Filtered total mercury
B. Particulate total mercury
27 189
18 155
FIELD BLANKS ENVIRONMENTALSAMPLES
75th percentile
Median
25th percentile10th percentile
90th percentile
Censored data point
Data point
EXPLANATION
Number of samples155
Maximum detection limit
Minimum detection limit
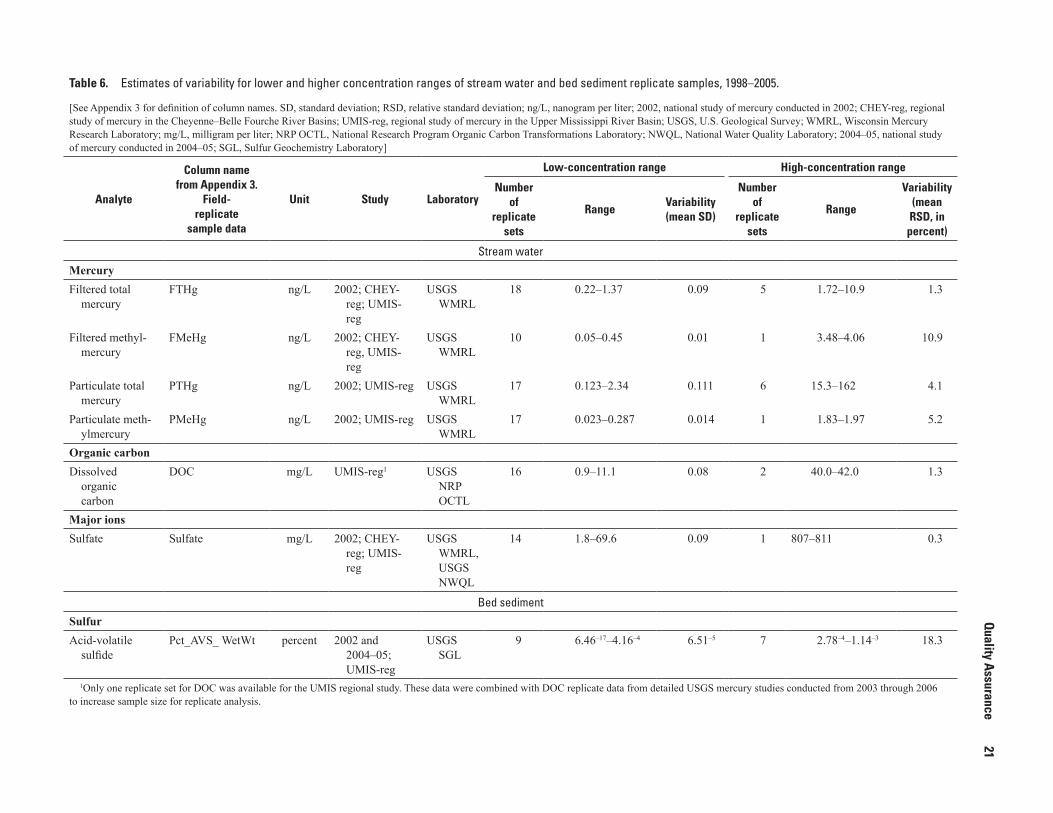
Quality A
ssurance
21Table 6. Estimates of variability for lower and higher concentration ranges of stream water and bed sediment replicate samples, 1998–2005.
[See Appendix 3 for definition of column names. SD, standard deviation; RSD, relative standard deviation; ng/L, nanogram per liter; 2002, national study of mercury conducted in 2002; CHEY-reg, regional study of mercury in the Cheyenne–Belle Fourche River Basins; UMIS-reg, regional study of mercury in the Upper Mississippi River Basin; USGS, U.S. Geological Survey; WMRL, Wisconsin Mercury Research Laboratory; mg/L, milligram per liter; NRP OCTL, National Research Program Organic Carbon Transformations Laboratory; NWQL, National Water Quality Laboratory; 2004–05, national study of mercury conducted in 2004–05; SGL, Sulfur Geochemistry Laboratory]
Analyte
Column name from Appendix 3.
Field-replicate
sample data
Unit Study Laboratory
Low-concentration range High-concentration range
Number of
replicate sets
RangeVariability(mean SD)
Number of
replicate sets
Range
Vari ability (mean RSD, in percent)
Stream water
MercuryFiltered total
mercuryFTHg ng/L 2002; CHEY-
reg; UMIS-reg
USGS WMRL
18 0.22–1.37 0.09 5 1.72–10.9 1.3
Filtered methyl-mercury
FMeHg ng/L 2002; CHEY-reg, UMIS-reg
USGS WMRL
10 0.05–0.45 0.01 1 3.48–4.06 10.9
Particulate total mercury
PTHg ng/L 2002; UMIS-reg USGS WMRL
17 0.123–2.34 0.111 6 15.3–162 4.1
Particulate meth-ylmercury
PMeHg ng/L 2002; UMIS-reg USGS WMRL
17 0.023–0.287 0.014 1 1.83–1.97 5.2
Organic carbonDissolved
organic carbon
DOC mg/L UMIS-reg1 USGS NRP OCTL
16 0.9–11.1 0.08 2 40.0–42.0 1.3
Major ionsSulfate Sulfate mg/L 2002; CHEY-
reg; UMIS-reg
USGS WMRL, USGS NWQL
14 1.8–69.6 0.09 1 807–811 0.3
Bed sediment
SulfurAcid-volatile
sulfidePct_AVS_ WetWt percent 2002 and
2004–05; UMIS-reg
USGS SGL
9 6.46–17–4.16–4 6.51–5 7 2.78–4–1.14–3 18.3
1Only one replicate set for DOC was available for the UMIS regional study. These data were combined with DOC replicate data from detailed USGS mercury studies conducted from 2003 through 2006 to increase sample size for replicate analysis.
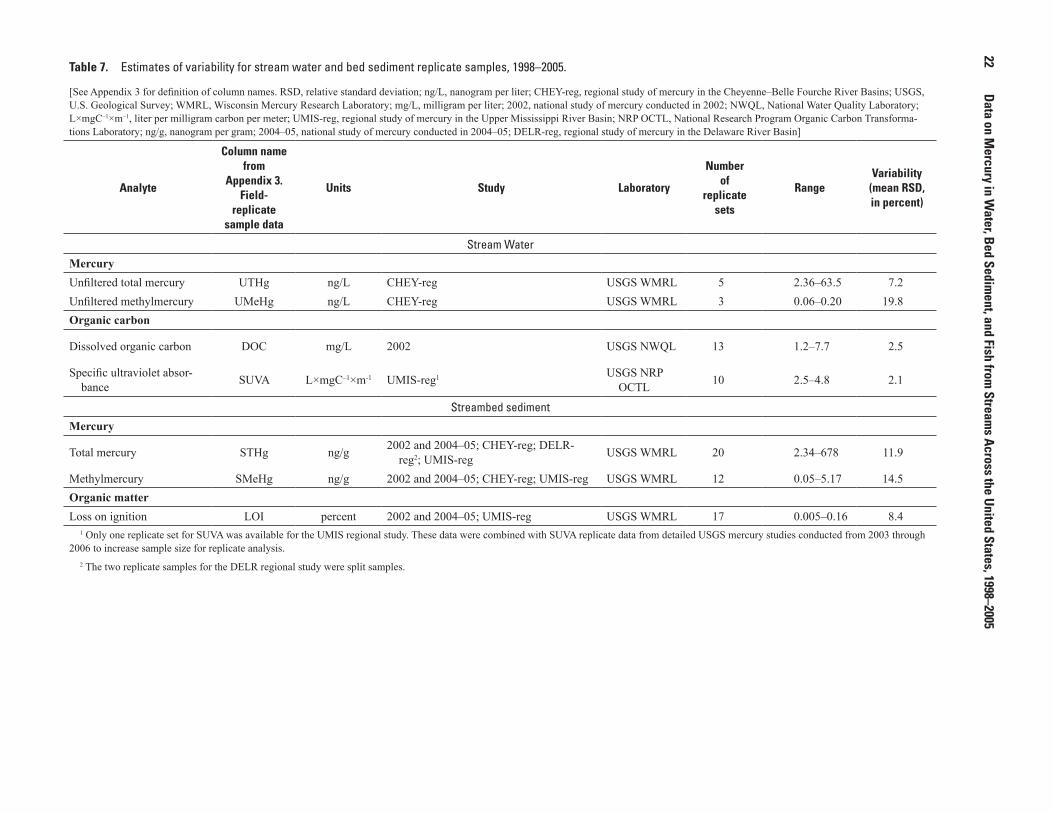
22
Data on M
ercury in Water, B
ed Sediment, and Fish from
Streams A
cross the United States, 1998–2005
Table 7. Estimates of variability for stream water and bed sediment replicate samples, 1998–2005.
[See Appendix 3 for definition of column names. RSD, relative standard deviation; ng/L, nanogram per liter; CHEY-reg, regional study of mercury in the Cheyenne–Belle Fourche River Basins; USGS, U.S. Geological Survey; WMRL, Wisconsin Mercury Research Laboratory; mg/L, milligram per liter; 2002, national study of mercury conducted in 2002; NWQL, National Water Quality Laboratory; L×mgC–1×m–1, liter per milligram carbon per meter; UMIS-reg, regional study of mercury in the Upper Mississippi River Basin; NRP OCTL, National Research Program Organic Carbon Transforma-tions Laboratory; ng/g, nanogram per gram; 2004–05, national study of mercury conducted in 2004–05; DELR-reg, regional study of mercury in the Delaware River Basin]
Analyte
Column name from
Appendix 3. Field-
replicate sample data
Units Study Laboratory
Number of
replicate sets
RangeVariability
(mean RSD, in percent)
Stream Water
MercuryUnfiltered total mercury UTHg ng/L CHEY-reg USGS WMRL 5 2.36–63.5 7.2Unfiltered methylmercury UMeHg ng/L CHEY-reg USGS WMRL 3 0.06–0.20 19.8Organic carbon
Dissolved organic carbon DOC mg/L 2002 USGS NWQL 13 1.2–7.7 2.5
Specific ultraviolet absor-bance SUVA L×mgC–1×m-1 UMIS-reg1 USGS NRP
OCTL 10 2.5–4.8 2.1
Streambed sediment
Mercury
Total mercury STHg ng/g 2002 and 2004–05; CHEY-reg; DELR-reg2; UMIS-reg USGS WMRL 20 2.34–678 11.9
Methylmercury SMeHg ng/g 2002 and 2004–05; CHEY-reg; UMIS-reg USGS WMRL 12 0.05–5.17 14.5Organic matterLoss on ignition LOI percent 2002 and 2004–05; UMIS-reg USGS WMRL 17 0.005–0.16 8.4
1 Only one replicate set for SUVA was available for the UMIS regional study. These data were combined with SUVA replicate data from detailed USGS mercury studies conducted from 2003 through 2006 to increase sample size for replicate analysis.
2 The two replicate samples for the DELR regional study were split samples.
Ancillary Data 23
Quality of Fish Data
Laboratory QC samples for fish included procedural blanks, replicate samples, spiked samples, and certified and standard reference materials. Procedural blanks measure the amount of Hg that may be introduced in a sample during sample processing in the laboratory. Replicate samples, cre-ated by taking subsamples from the original homogenized fish sample, were used to measure the variability in the analytical procedures for fish analysis. Laboratory spiked samples were used to measure the bias and precision of analytical methods by determining the amount of spike recovery in a sample. Low recovery of the spiked analyte can indicate Hg degrada-tion, analytical interference from the sample matrix, and (or) poor analytical recovery. Reference materials from the USGS CERC, the National Institute of Standards and Technology (NIST), and the National Research Council Canada (NRCC) were used to assess the accuracy of analytical methods. Refer-ence materials used were CERC whole striped bass (material I.D. STB), NIST albacore tuna fillet (SRM 50) and mussel tis-sue (SRM 2976), NRCC dogfish (Squalus acanthias) muscle (DORM-1 and DORM-2), NRCC dogfish liver (DOLT-2), and NRCC lobster hepatopancreas (TORT-2) (table 8). Laboratory QC samples were available for the national studies and the UMIS regional study.
QC results for fish sampled during the 1998 National Mercury Pilot Study and analyzed at the CERC are discussed in Brumbaugh and others (2001) and are summarized here. Concentrations in eight of nine method blank samples were near or less than the instrument detection level. The one elevated blank sample resulted in an increased MDL for samples analyzed in the digestion block, but virtually all sample concentrations were considerably greater than the blank concentration. As a result, there was no indication of systematic contamination of samples due to sample collection, processing, and analysis. The RSDs for the triplicate samples ranged from 0.6 to 7.5 percent (n=8) and averaged 2.6 percent. Percent recoveries for the predigestion spikes of MeHg averaged 102.3 percent (SD 4.2, n=16). Percent recoveries for the post digestion spikes of divalent Hg (Hg2+) averaged 98.5 percent (SD 5.1, n=25). Measured concentrations of the reference tissue samples for the CERC whole striped bass, NIST albacore tuna fillet, and NRCC DORM-1 materials were in good agreement with the certified ranges (table 8). Overall, QC results for the 1998 National Mercury Pilot Study fish samples analyzed at the CERC indicated low bias and good reproducibility.
QC data for the 2002 fish samples analyzed for Hg at the NQWL included concentrations measured in blank samples and recoveries of reference tissue samples (J.R. Garbarino, USGS, written commun., 2007). Concentrations of Hg in 11 blank samples were less than or equal to the MDL. For refer-ence samples analyzed from February 2002 through February 2003, measured concentrations of the reference tissue samples for NRCC DOLT-2 and NRCC DORM-2 were within one SD of certified ranges (table 8). For the same time period,
recoveries averaged 115.5 percent (SD 34.9 percent, n=10) for DOLT-2 and 88.5 percent (SD 17.4 percent, n=9) for DORM-2. Overall, the quality-control results associated with the 2002 fish samples analyzed at the NWQL indicated low bias and moderate variability.
For the 2004–05 fish samples analyzed at the TERL, 8 of 19 procedural blanks had Hg concentrations that were slightly greater than the MDL. These detections of Hg in blank samples with concentrations equal to or slightly greater than the MDLs do not affect the interpretation of Hg in the 243 fish samples analyzed at the TERL because the minimum sample concentration (0.056 microgram per gram ([µg/g]), dry weight) was at least 6 times greater than the highest blank equivalent concentration (0.009 µg/g, dry weight). The RSDs for the replicate samples were between 0 and 8 percent (n=23), with an average of 2 percent. Percent recoveries for the spike samples averaged 99.7 percent (SD 3.3, n=23). Measured concentrations of the reference tissue samples for the NRCC DOLT-2 and DORM-2 materials were within certified ranges (table 8). Average percent recoveries for the reference materi-als were 104.2 percent (SD=6.6 percent, n=19) for DOLT-2 and 99.7 percent (SD 2.5, n=19) for DORM-2. QC results for the 2004–05 national study fish samples analyzed at the TERL indicated low bias and good reproducibility.
QC results for fish sampled during the UMIS regional study and analyzed at River Studies Center, University of Wisconsin, La Crosse, Wis., are discussed in Christensen and others (2006) and are summarized here. The average RSD for 60 triplicate subsamples of homogenized fish was 4.5 percent, and values ranged from 0.4 to 8.3 percent. Percent recover-ies of predigestion subsamples of homogenized fish averaged 96.5 percent (n=60) and ranged from 84.1 to 112.1 percent. Measured concentrations of reference tissue samples of NIST mussel tissue, NRCC lobster hepatopancreas, and NRCC dog-fish muscle were within the certified ranges (table 8). The QC results for the UMIS regional study fish samples analyzed at the University of Wisconsin, La Crosse, River Studies Center indicated low bias and good reproducibility.
Ancillary Data
Selected ancillary data for geographic information, basin hydrologic estimates, and Hg source estimates are available for the basins upstream from most Hg study sites. Ancillary data are not included for 18 sites because specific land-cover data were not available or basin boundaries were not deter-mined. The 18 sites are listed in Appendix 5.
Geographic Information
Boundaries representing the basin upstream from study sites were delineated by USGS personnel from a variety of sources. Most basin boundaries were previously compiled for the USGS NAWQA Program from 1:24,000-scale to
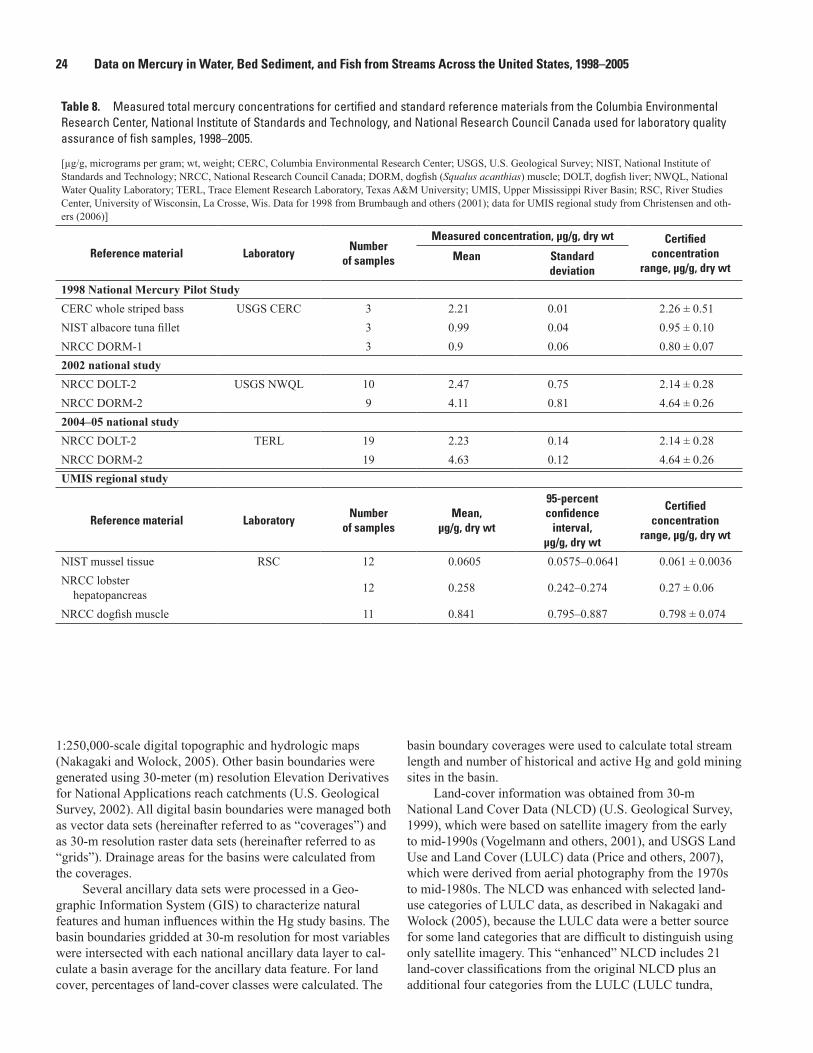
24 Data on Mercury in Water, Bed Sediment, and Fish from Streams Across the United States, 1998–2005
1:250,000-scale digital topographic and hydrologic maps (Nakagaki and Wolock, 2005). Other basin boundaries were generated using 30-meter (m) resolution Elevation Derivatives for National Applications reach catchments (U.S. Geological Survey, 2002). All digital basin boundaries were managed both as vector data sets (hereinafter referred to as “coverages”) and as 30-m resolution raster data sets (hereinafter referred to as “grids”). Drainage areas for the basins were calculated from the coverages.
Several ancillary data sets were processed in a Geo-graphic Information System (GIS) to characterize natural features and human influences within the Hg study basins. The basin boundaries gridded at 30-m resolution for most variables were intersected with each national ancillary data layer to cal-culate a basin average for the ancillary data feature. For land cover, percentages of land-cover classes were calculated. The
basin boundary coverages were used to calculate total stream length and number of historical and active Hg and gold mining sites in the basin.
Land-cover information was obtained from 30-m National Land Cover Data (NLCD) (U.S. Geological Survey, 1999), which were based on satellite imagery from the early to mid-1990s (Vogelmann and others, 2001), and USGS Land Use and Land Cover (LULC) data (Price and others, 2007), which were derived from aerial photography from the 1970s to mid-1980s. The NLCD was enhanced with selected land-use categories of LULC data, as described in Nakagaki and Wolock (2005), because the LULC data were a better source for some land categories that are difficult to distinguish using only satellite imagery. This “enhanced” NLCD includes 21 land-cover classifications from the original NLCD plus an additional four categories from the LULC (LULC tundra,
Table 8. Measured total mercury concentrations for certified and standard reference materials from the Columbia Environmental Research Center, National Institute of Standards and Technology, and National Research Council Canada used for laboratory quality assurance of fish samples, 1998–2005.
[µg/g, micrograms per gram; wt, weight; CERC, Columbia Environmental Research Center; USGS, U.S. Geological Survey; NIST, National Institute of Standards and Technology; NRCC, National Research Council Canada; DORM, dogfish (Squalus acanthias) muscle; DOLT, dogfish liver; NWQL, National Water Quality Laboratory; TERL, Trace Element Research Laboratory, Texas A&M University; UMIS, Upper Mississippi River Basin; RSC, River Studies Center, University of Wisconsin, La Crosse, Wis. Data for 1998 from Brumbaugh and others (2001); data for UMIS regional study from Christensen and oth-ers (2006)]
Reference material LaboratoryNumber
of samples
Measured concentration, µg/g, dry wt Certified concentration
range, µg/g, dry wtMean Standard
deviation
1998 National Mercury Pilot StudyCERC whole striped bass USGS CERC 3 2.21 0.01 2.26 ± 0.51NIST albacore tuna fillet 3 0.99 0.04 0.95 ± 0.10NRCC DORM-1 3 0.9 0.06 0.80 ± 0.072002 national studyNRCC DOLT-2 USGS NWQL 10 2.47 0.75 2.14 ± 0.28NRCC DORM-2 9 4.11 0.81 4.64 ± 0.262004–05 national studyNRCC DOLT-2 TERL 19 2.23 0.14 2.14 ± 0.28NRCC DORM-2 19 4.63 0.12 4.64 ± 0.26UMIS regional study
Reference material LaboratoryNumber
of samplesMean,
µg/g, dry wt
95-percent confidence
interval,µg/g, dry wt
Certified con centration
range, µg/g, dry wt
NIST mussel tissue RSC 12 0.0605 0.0575–0.0641 0.061 ± 0.0036NRCC lobster
hepatopancreas 12 0.258 0.242–0.274 0.27 ± 0.06
NRCC dogfish muscle 11 0.841 0.795–0.887 0.798 ± 0.074
Ancillary Data 25
NLCD/LULC forested residential, LULC residential, and LULC orchards/vineyards/other) (Nakagaki and Wolock, 2005).
The enhanced NLCD was used to derive percentages of land-cover classes in each basin. The enhanced NLCD also was classified into broader categories representing urban, agriculture, forest, wetland, undeveloped, and other land cover. To address the possibility that conditions observed at a sampling site were influenced more by land cover closer to the site than by land cover farther from the site, land-cover percentages weighted by the inverse distance from the site also were calculated and are included in the ancillary database.
Key soil characteristics, including percent organic matter content by weight, soil erodibility factor, percent land surface slope, depth to seasonally high water table, percent hydric soils, soil porosity, and soil drainage class, were compiled from State Soil Geographic (STATSGO) data (U.S. Department of Agriculture, 1994). Percent organic matter, soil erodibility factor, and land surface slope were obtained from the tabular data files presented in Wolock (1997) and were linked by mapping unit identification code to a 100-m resolution national grid of STATSGO geographic mapping units. Hydric soils and soil porosity were calculated for each mapping unit using methods from Wolock (1997). Soil drainage class was compiled from Schwarz and Alexander (1995), who converted the categorical classes into numeric values. Hydric soils, soil porosity, and soil drainage class also were linked to the 100-m soils mapping unit grid. For each basin, a weighted average was calculated for each soil characteristic based on the areas of the soils mapping units within the basin.
Elevation data at 30-m resolution were extracted from USGS National Elevation Data (U.S. Geological Survey, 2001). The 30-m data were resampled to 100-m resolution, and the 100-m data were used to calculate the elevation of each sampling site and the mean and maximum elevation of each basin. Stream segments from the 1:100,000-scale medium-resolution National Hydrography Dataset (U.S. Geological Survey and U.S. Environmental Protection Agency, 2003) were clipped to the study basin boundaries to calculate total stream length within each basin.
The 2000 Census block group boundaries (U.S. Census Bureau, 2001) gridded at 30-m resolution were used with 2000 block group population density calculated from the Census Summary File 1 published by GeoLytics (2001) to derive a weighted average 2000 population density by block group for each basin. The source of impervious surface area was a 1-kilometer (km) resolution grid prepared by Elvidge and others (2004).
Basin Hydrologic Estimates
Mean annual precipitation at 1-km resolution was derived from the Parameter-elevation Regressions on Independent Slopes Model (PRISM). PRISM uses point data, a digital
elevation model, and other spatial data to generate estimates of precipitation and other climatic parameters (Daly and others, 1994; Daly and others, 1997). PRISM mean annual precipita-tion (1961–1990) at 2-km resolution was obtained from the Spatial Climate Analysis Service at Oregon State University. Mean annual precipitation was estimated for each basin by using the PRISM data.
National 1-km resolution grids (D.M. Wolock, USGS, written commun., 2007) were used to calculate a mean for each basin for base-flow index, potential and actual evapo-transpiration, and topographic wetness index. Base-flow index is the ratio of base flow (component of streamflow that can be attributed to ground-water discharge into streams) to total flow, expressed as a percentage. The base-flow index grid was created by interpolating base-flow index point values estimated for USGS streamflow gages (Wolock, 2003a, 2003b). PRISM temperature data (Daly, 2006) and the Hamon equation (Hamon, 1961) were used by Wolock to generate a 1-km grid of mean annual potential evapotranspiration (D.M. Wolock, USGS, written commun., 2007). PRISM climate data also were used in a water-balance model to estimate actual evapotranspiration (Wolock and McCabe, 1999). Average topographic wetness index was developed from 1-km resolu-tion digital elevation model data (Wolock and McCabe, 2000). Mean annual runoff (1951–1980) characteristics were derived from Gebert and others (1987).
Mercury Source Estimates
Data from the National Atmospheric Deposition Program (NADP) provided information about measured Hg and sulfate wet deposition. Annual wet deposition data for 2000–2003 for sites in the Mercury Deposition Network (Roger Claybrooke, Illinois State Water Survey, written commun., 2005) were averaged for 2000–2003. The station averages were converted to a grid surface by using inverse distance weighting inter-polation for the eastern part of the United States. Data were available for only seven sites in the western part of the United States, and this was deemed insufficient for interpolation. Instead, the mean deposition of those seven sites was assigned to the western part of the country. Digital isopleths maps of annual sulfate wet deposition data for 2000–2003 were downloaded from the NADP (National Atmospheric Deposi-tion Program, 2006). One surface map representing an average sulfate wet deposition for 2000–2003 was generated using GIS software to compute the mean from the four individual sulfate maps. The average Hg and sulfate wet deposition maps for 2000–2003 were clipped to the basin boundaries to calculate basin mean wet deposition of Hg and sulfate.
Modeled wet and dry Hg deposition rates were esti-mated using results from the Trace Elements Analysis Model (TEAM) (Seigneur and others, 2004). The resolution of each TEAM grid cell was 100-km × 100-km.
Large-scale potential sources of Hg from past or cur-rent mining operations were extracted from the Mineral
26 Data on Mercury in Water, Bed Sediment, and Fish from Streams Across the United States, 1998–2005
Availability System/Mineral Industry Location System (MAS/MILS) (V.C. Stephens, USGS, written commun., 2004), which is part of the Mineral Resources Data System (MRDS) (U.S. Geological Survey, 2004). Mining sites in each basin were identified as (1) Hg mining operations, in general, (2) Hg “producers,” (3) gold mining operations, in general, and (4) gold “producers.” Producers included current or past producer mining operations.
Acknowledgments
This study was supported by the following USGS programs and disciplines: National Water-Quality Assessment, Toxic Substances Hydrology, and National Research Programs; and Water, Biology, and Geology Disciplines. We thank many USGS scientists and field staff for assistance in site selection, technical input, and careful sample collection. We especially wish to thank the following USGS employees: Rod DeWeese, for assistance in initial planning of the study; George Aiken and Kenna Butler, for DOC sample planning and analyses; William Brumbaugh, for assistance with the use of fish results from the 1998 National Hg Pilot Study; John Garbarino, for assistance with the use of fish results from the 2002 national study; Robert Taylor (Trace Element Research Laboratory, Texas A&M University), for assistance with the use of fish results from the 2004-05 national study; Kerie Hitt, Naomi Nakagaki, and Dave Wolock, for GIS data compilation and preparation; Douglas Causey, William Ferguson, and Cory Stephens, for assistance with retrieval of data from the MRDS and MAS/MILS mining databases; John DeWild, Mark Olson, and Shane Olund of the Wisconsin Mercury Research Laboratory, for their expertise and guidance in multimedia Hg sampling; and John DeWild and Norm Spahr, for their technical review of an earlier version of this manuscript.
References Cited
Aiken, G.R., 1992, Chloride interference in the analysis of dis-solved organic carbon in the wet oxidation method: Envi-ronmental Science and Technology, v. 26, p. 2435–2439.
Aiken, G.R., McKnight, D.M., Thorn, K.A., and Thurman, E.M., 1992, Isolation of hydrophilic organic acids from water using nonionic macroporous resins: Organic Geo-chemistry, v. 18, no. 4, p. 567–573.
Allen, H.E., Fu, G., Boothman, W., DiToro, D.M., and Mahony, J.D., 1991, Draft analytical method for determina-tion of acid volatile sulfide in sediment: U.S. Environmental Protection Agency, 18 p.
Anderson, R.L., 1987, Practical statistics for analytical chemists: New York, Van Nostrand Reinhold, 316 p.
Bates, A.L., Spiker, E.C., Orem, W.H., and Burnett, W.C., 1993, Speciation and isotopic composition of sulfur in sediments from Jellyfish Lake, Palau: Chemical Geology, v. 106, p. 63–76.
Bloom, N., 1989, Determination of picogram levels of methylmercury by aqueous phase ethylation, followed by cryogenic gas chromatography with cold vapour atomic fluor escence detection: Canadian Journal of Fisheries and Aquatic Sciences, v. 46, p. 1131–1140.
Bloom, N.S., 1992, On the chemical form of mercury in edible fish and marine invertebrate tissue: Canadian Journal of Fisheries and Aquatic Sciences, v. 49, p. 1010–1017.
Brenton, R.W., and Arnett, T.L., 1993, Methods of analysis by the U.S. Geological Survey National Water Quality Labora-tory—Determination of dissolved organic carbon by UV-promoted persulfate oxidation and infrared spectrometry: U.S. Geological Survey Open-File Report 92–480, 12 p.
Brigham, M.E., Duris, J.W., Wentz, D.A., Button, D.T., and Chasar, L.C., 2008, Total mercury, methylmercury, and ancillary water-quality and streamflow data for selected streams in Oregon, Wisconsin, and Florida, 2002-06: U.S. Geological Survey Data Series 341, 11 p., accessed May 22, 2009 at http://pubs.usgs.gov/ds/341/
Brightbill, R.A., Riva-Murray, Karen, Bilger, M.D., and Byrnes, J.D., 2003, Total mercury and methylmercury in fish fillets, water, and bed sediments from selected streams in the Delaware River Basin, New Jersey, New York, and Pennsylvania, 1998–2001: U.S. Geological Survey Water-Resources Investigations Report 03–4183, 30 p., accessed February 12, 2007, at http://pubs.usgs.gov/wri/wri03-4183/
Brumbaugh, W.G., Krabbenhoft, D.P., Helsel, D.R., Wiener, J.G., and Echols, K.R., 2001, A national pilot study of mer-cury contamination of aquatic ecosystems along multiple gradients—Bioaccumulation in fish: U.S. Geological Sur-vey Biological Sciences Report USGS/BRD/BSR–2001–0009, 32 p., accessed March 21, 2007, at http://www.cerc.usgs.gov/pubs/center/pdfDocs/BSR2001-0009.pdf
Canfield, D.E., Raiswell, Robert, Westrich, J.T., Reaves, C.M., and Berner, R.A., 1986, The use of chromium reduction in the analysis of reduced inorganic sulfur in sediments and shales: Chemical Geology, v. 54, p. 149–155.
Chalmers, Ann, and Krabbenhoft, D.P., 2001, Distribution of total and methyl mercury in water, sediment, and fish tissue in New England streams: American Geophysical Union (AGU), May 29–June 2, 2001, Boston, Mass, accessed Feb-ruary 12, 2007, at http://nh.water.usgs.gov/projects/nawqa/ac_agu01.htm. [Also see http://nh.water.usgs.gov/projects/nawqa/sw_merc.htm].
References Cited 27
Christensen, V.G., Wente, S.P., Sandheinrich, M.B., and Brigham, M.E., 2006, Spatial variation in fish-tissue mercury concentrations in the St. Croix River Basin, Minnesota and Wisconsin, 2004: U.S. Geological Survey Scientific Investigations Report 2006–5063, 26 p., accessed March 19, 2007, at http://pubs.usgs.gov/sir/2006/5063/pdf/SIR20065063.pdf
Daly, Christopher, 2006, Guidelines for assessing the suit-ability of spatial climate data sets: International Journal of Climatology, v. 26, p. 707–721.
Daly, Christopher, Neilson, R.P., and Phillips, D.L., 1994, A statistical-topographic model for mapping climatological precipitation over mountainous terrain: Journal of Applied Meteorology, v. 33, no. 2, p. 140–158.
Daly, Christopher, Taylor, G.H., and Gibson, W.P., 1997, The PRISM approach to mapping precipitation and tempera-ture: Proceedings, American Meteorological Society 10th Conference on Applied Climatology, Reno, Nev., October 20–23, 1997, p. 10–12.
DeWild, J.F., Olson, M.L., and Olund, S.D., 2002, Determination of methyl mercury by aqueous phase ethylation, followed by gas chromatographic separation with cold vapor atomic fluorescence detection: U.S. Geological Survey Open-File Report 01–445, 14 p., accessed March 16, 2007, at http://pubs.usgs.gov/of/2001/ofr-01-445/
DeWild, J.F., Olund, S.D., Olson, M.L., and Tate, M.T., 2004, Methods for the preparation and analysis of solids and suspended solids for methylmercury: U.S. Geological Survey Techniques of Water-Resources Investigations, book 5, chap. A7, accessed March 16, 2007, at http://pubs.usgs.gov/tm/2005/tm5A7/
Domagalski, Joseph, 1998, Occurrence and transport of total mercury and methyl mercury in the Sacramento River Basin, California: Journal of Geochemical Exploration, v. 64, nos. 1–3, p. 277–291. [Reference cited in Appendix 5]
Domagalski, Joseph, 2001, Mercury and methylmercury in water and sediment of the Sacramento River Basin, California: Applied Geochemistry, v. 16, no. 15, p. 1677–1691. [Reference cited in Appendix 5]
Elvidge, C.D., Milesi, Cristina, Dietz, J.B., Tuttle, B.T., Sutton, P.C., Nemani, Ramakrishna, and Vogelmann, J.E., 2004, U.S. constructed area approaches the size of Ohio: Eos, Transactions American Geophysical Union, v. 85, no. 24, p. 233–240.
Fishman, M.J., and Friedman, L.C., 1989, Methods for determination of inorganic substances in water and fluvial sediments: U.S. Geological Survey Techniques of Water-Resources Investigations, book 5, chap. A1, sec. 15, p. 465–498, accessed March 16, 2007, at http://pubs.usgs.gov/twri/twri5-a1/
Fitzgerald, W.F., and Watras, C.J., 1989, Mercury in surficial waters of rural Wisconsin lakes: Science of the Total Envi-ronment, v. 87/88, p. 223–232.
Gebert, W.A., Graczyk, D.J., and Krug, W.R., 1987, Average annual runoff in the United States 1951–80: U.S. Geologi-cal Survey Hydrologic Investigations Atlas HA–710, scale 1:7,500,000, 1 sheet [digital data], accessed June 13, 2002, at http://water.usgs.gov/lookup/getspatial?runoff
GeoLytics, 2001, CensusCD 2000/Short Form Blocks: East Brunswick, N.J., GeoLytics [digital data on CD–ROM].
Goddard, K.E., 1988, Gold-mill-tailings contamination of the Cheyenne River system, Western South Dakota, in Mallard, G.E., ed., U.S. Geological Survey Toxic Substances Hydrology Program—Surface-water contamination— Proceedings of the Technical Meeting, Denver, Colo., February 2–4, 1987: U.S. Geological Survey Open-File Report 87–764, p. 1–9. [Reference cited in Appendix 5]
Guy, H.P., 1969, Laboratory theory and methods for sediment analysis: U.S. Geological Survey Techniques of Water-Resources Investigations, book 5, chap. C1, accessed March 16, 2007, at http://pubs.usgs.gov/twri/twri5c1/pdf/TWRI_5-C1.pdf
Hamon, W.R., 1961, Estimating potential evapotranspiration: Journal of the Hydraulics Division, Proceedings of the American Society of Civil Engineers, v. 87, p. 107–120.
Heiri, Oliver, Lotter, A.F., and Lemcke, Gerry, 2001, Loss on ignition as a method for estimating organic and carbonate content in sediments—Reproducibility and comparability of results: Journal of Paleolimnology, v. 25, no. 1, p. 101–110.
Horvat, Milena, Liang, Lian, and Bloom, N.S., 1993, Com-parison of distillation with other current isolation methods for the determination of methyl mercury compounds in low-level environmental samples—Part II. Water: Analytica Chimica Acta, v. 282, p. 153–168.
Huckabee, J.W., Elwood, J.W., and Hildebrand, S.G., 1979, Accumulation of mercury in freshwater biota, in Nriagu, J.O., ed., Biogeochemistry of mercury in the environment: New York, Elsevier/North-Holland Biomedical Press, p. 277–302.
Jearld, A., Jr., 1983, Age determination, in Nielsen, L.A., and Johnson, D.L., eds., Fisheries techniques: Bethesda, Md., American Fisheries Society, p. 301–324.
28 Data on Mercury in Water, Bed Sediment, and Fish from Streams Across the United States, 1998–2005
Krabbenhoft, D.P., Wiener, J.G., Brumbaugh, W.G., Olson, M.L., DeWild, J.F., and Sabin, T.J., 1999, A national pilot study of mercury contamination of aquatic ecosystems along multiple gradients, in Morganwalp, D.W., and Bux-ton, H.T., eds., U.S. Geological Survey Toxic Substances Hydrology Program—Proceedings of the technical meet-ing, Charleston, S.C., March 8–12, 1999: U.S. Geological Survey Water-Resources Investigations Report 99–4018B, p. 147–160.
Lane, S.L., Flanagan, Sarah, and Wilde, F.D., 2003, Selection of equipment for water sampling (ver. 2.0): U.S. Geological Survey Techniques of Water-Resources Investigations, book 9, chap. A2, accessed March 16, 2007, at http://pubs.water.usgs.gov/twri9A2/
Lewis, M.E., and Brigham, M.E., 2004, Low level mercury: U.S. Geological Survey Techniques of Water-Resources Investigations, book 9, chap. A5, section 5.6.4.B, accessed March 16, 2007, at http://water.usgs.gov/owq/FieldManual/chapter5/pdf/5.6.4.B_v1.0.pdf
Lutz, M.A., Brigham, M.E., and Marvin-DiPasquale, Mark, 2008, Procedures for collecting and processing streambed sediment and pore water for analysis of mercury as part of the National Water-Quality Assessment Program: U.S. Geo-logical Survey U.S. Geological Survey Open-File Report 2008–1279, 68 p., accessed May 22, 2009 at http://pubs.usgs.gov/of/2008/1279/
Mueller, D.K., and Titus, C.J., 2005, Quality of nutrient data from streams and ground water sampled during water years 1992–2001: U.S. Geological Survey Scientific Investiga-tions Report 2005–5106, 32 p., accessed March 16, 2007, at http://pubs.usgs.gov/sir/2005/5106/pdf/sir2005-5106.pdf
Nakagaki, Naomi, and Wolock, D.M., 2005, Estimation of agricultural pesticide use in drainage basins using land cover maps and county pesticide data: U.S. Geological Sur-vey Open File-Report 2005–1188, 46 p., accessed Novem-ber 18, 2005, at http://pubs.usgs.gov/of/2005/1188/
National Atmospheric Deposition Program, 2006, Data access: Champaign, Ill., National Atmospheric Deposition Program, accessed August 2006, at http://nadp.sws.uiuc.edu/
Olson, M.L., Cleckner, L.B., Hurley, J.P., Krabbenhoft, D.P., and Heelan, T.W., 1997, Resolution of matrix effects on analysis of total and methyl mercury in aqueous samples from the Florida Everglades: Fresenius Journal of Analyti-cal Chemistry, v. 358, p. 392–396.
Olson, M.L., and DeWild, J.F., 1999, Techniques for the collection and species-specific analysis of low levels of mercury in water, sediment, and biota: U.S. Geological Survey Water-Resources Investigations Report 99–4018b, 11 p., accessed March 16, 2007, at http://toxics.usgs.gov/pubs/wri99-4018/Volume2/sectionB/2305_Olson/pdf/2305_Olson.pdf
Olund, S.D., DeWild, J.F., Olson, M.L., and Tate, M.T., 2004, Methods for the preparation and analysis of solids and suspended solids for total mercury: U.S. Geological Survey Techniques of Water-Resources Investigations, book 5, chap. A8, accessed March 16, 2007, at http://pubs.usgs.gov/tm/2005/tm5A8/
Porak, W., Coleman, W.S., and Crawford, S., 1988, Age, growth, and mortality of Florida largemouth bass utiliz-ing otoliths, in Proceedings of the annual conference of Southeastern Association of Fish and Wildlife Agencies 40: Tallahassee, Fla., Southeastern Association of Fish and Wildlife Agencies, p. 206–215.
Price, C.V., Nakagaki, Naomi, Hitt, K.J., and Clawges, R.M., 2007, Enhanced historical land-use and land-cover data sets of the U.S. Geological Survey: U.S. Geological Survey Data Series 240 [digital data], available at http://pubs.usgs.gov/ds/2006/240
Rantz, S.E., and others, 1982, Measurement and computation of streamflow: U.S. Geological Survey Water-Supply Paper 2175, v. 1 and 2, 631 p.
Schwarz, G.E., and Alexander, R.A., 1995, Soils data for the conterminous United States derived from the NRCS State Soil Geographic (STATSGO) data base. [Original title: State Soil Geographic (STATSGO) data base for the contermi-nous United States]: U.S. Geological Survey Open-File Report 95–449 [digital data], accessed June 19, 2002, at http://water.usgs.gov/lookup/getspatial?ussoils
Scudder, B.C., Chasar, L.S., DeWeese, L.R., Brigham, M.E., Wentz, D.A., and Brumbaugh, W.G., 2008, Procedures for collecting and processing aquatic biota for assessment of mercury in the National Water-Quality Assessment Pro-gram: U.S. Geological Survey Open-File Report 2008–1208, 34 p., accessed May 22, 2009 at http://pubs.usgs.gov/of/2008/1208/
Scudder, B.C., Chasar, L.C., Wentz, D.A., Bauch, N.J., Brigham, M.E., Moran, P.W., and Krabbenhoft, D.P., 2009, Mercury in fish, bed sediment, and water from streams across the United States, 1998–2005: U.S. Geological Survey Scientific Investigations Report 2009–5109, 74 p., available at http://pubs.usgs.gov/sir/2009/5109/
References Cited 29
Seigneur, Christian, Vijayaraghavan, Krish, Lohman, Kristen, Karamchandani, Prakash, and Scott, Courtney, 2004, Global source attribution for mercury deposition in the United States: Environmental Science and Technology, v. 38, no. 2, p. 555–569.
Shelton, L.R., and Capel, P.D., 1994 (rev. 1995), Guidelines for collecting and processing samples of stream bed sedi-ment for analysis of trace elements and organic contami-nants for the National Water-Quality Assessment Program: U.S. Geological Survey Open-File Report 94–458, 20 p., accessed August 14, 2009, at http://water.usgs.gov/nawqa/pnsp/pubs/ofr94-455/sw-t.html
Tuttle, M.L., Goldhaber, M.B., and Williamson, D.L., 1986, An analytical scheme for determining forms of sulfur in oil shales and associated rocks: Talanta, v. 33, no. 12, p. 953–961.
U.S. Census Bureau, 2001, Cartographic boundary files— Census 2000 block group [digital data], accessed August 2002, at http://www.census.gov/geo/www/cob/bg2000.html
U.S. Department of Agriculture, 1994, State Soil Geographic (STATSGO) data base, Data use information: U.S. Depart-ment of Agriculture Miscellaneous Publication Number 1492, Fort Worth, Tex., 35 p.
U.S. Environmental Protection Agency, 1996a, Method 1669—Sampling ambient water for trace metals at EPA water quality criteria levels: U.S. Environmental Protection Agency EPA 821/R–96–011, accessed March 21, 2007, at http://www.frontiergeosciences.com/cms/File/1669.pdf
U.S. Environmental Protection Agency, 1996b, Method 3052—Microwave assisted acid digestion of siliceous and organically based matrices: U.S. Environmental Protection Agency SW–846, accessed March 21, 2007, at http://epa.gov/sw-846/pdfs/3052.pdf
U.S. Environmental Protection Agency, 1996c, Method 7474—Mercury in sediment and tissue samples by atomic fluorescence spectrometry: U.S. Environmental Protection Agency SW–846, accessed March 21, 2007, at http://epa.gov/sw-846/pdfs/7474.pdf
U.S. Environmental Protection Agency, 1998, Method 7473—Mercury in solids and solutions by thermal decomposition, amalgamation, and atomic absorption spectrophotometry: U.S. Environmental Protection Agency SW–846.
U.S. Environmental Protection Agency, 2002, Analyti-cal methods, Method 1631–Guidelines establishing test procedures for the analysis of pollutants—Measurement of mercury in water; Revisions to EPA method 1631: U.S. Environmental Protection Agency EPA–821–R–02–019, accessed March 21, 2007 at http://www.epa.gov/water-science/methods/1631.html
U.S. Geological Survey, variously dated, National field man-ual for the collection of water-quality data: U.S. Geological Survey Techniques of Water-Resources Investigations, book 9, chaps. A1–A9, accessed March 16, 2007, at http://pubs.usgs.gov/twri/
U.S. Geological Survey, 1999, National Land Cover Data 1992 (NLCD 92) [digital data], accessed June 16, 2005, at http://edc.usgs.gov/products/landcover/nlcd.html
U.S. Geological Survey, 2001, National Elevation Dataset [NED] [digital data], accessed 2001, at http://ned.usgs.gov/
U.S. Geological Survey, 2002, Elevation Derivatives for National Applications (EDNA) [digital data], accessed January 2006, at http://edna.usgs.gov/
U.S. Geological Survey, 2004, Mineral Resources Data System (MRDS) [digital data], accessed March 16, 2007, at http://tin.er.usgs.gov/mrds/
U.S. Geological Survey and U.S. Environmental Protection Agency, 2003, National Hydrography Dataset [NHD] [digi-tal data], accessed 2003, at http://nhd.usgs.gov/
Vogelmann, J.E., Howard, S.M., Yang, Limin, Larson, C.R., Wylie, B.K., and VanDriel, N., 2001, Completion of the 1990s national land cover data set for the conterminous United States from Landsat Thematic Mapper data and ancillary data sources: Photogrammetric Engineering and Remote Sensing, v. 67, p. 650–662.
Weishaar, J.L., Aiken, G.R., Bergamaschi, B.A., Fram, M.S., Fujii, Roger, and Mopper, Kenneth, 2003, Evaluation of specific ultraviolet absorbance as an indicator of the chemi-cal composition and reactivity of dissolved organic carbon: Environmental Science and Technology, v. 37, no. 20, p. 4702–4708.
Wiener, J.G., and Spry, D.J., 1996, Toxicological significance of mercury in freshwater fish, in Beyer, W.N., Heinz, G.H., and Redmon-Norwood, A.W., eds., Environmental contami-nants in wildlife—Interpreting tissue concentrations: Boca Raton, Fla., Lewis Publishers, p. 297–339.
Wilde, F.D., ed., chapter sections variously dated, Field mea-surements: U.S. Geological Survey Techniques of Water-Resources Investigations, book 9, chap. A6, accessed March 16, 2007, at http://pubs.water.usgs.gov/twri9A6/
Wilde, F.D., Radtke, D.B., Gibs, Jacob, and Iwatsubo, R.T., eds., 1999, Collection of water samples: U.S. Geological Survey Techniques of Water-Resources Investigations, book 9, chap. A4, accessed March 16, 2007, at http://pubs.water.usgs.gov/twri9A4/
30 Data on Mercury in Water, Bed Sediment, and Fish from Streams Across the United States, 1998–2005
Wilde, F.D., Radtke, D.B., Gibs, Jacob, and Iwatsubo, R.T., eds., 2004, Processing of water samples: U.S. Geological Survey Techniques of Water-Resources Investigations, book 9, chap. A5, accessed March 16, 2007, at http://pubs.water.usgs.gov/twri9A5/
Wolock, D.M., 1997, STATSGO soil characteristics for the conterminous United States: U.S. Geological Survey Open-File Report 97–656 [digital data], accessed February 17, 2004, at http://water.usgs.gov/lookup/getspatial?muid
Wolock, D.M., 2003a, Base-flow index grid for the conter-minous United States: U.S. Geological Survey Open-File Report 03–263 [digital data], accessed December 6, 2006, at http://water.usgs.gov/lookup/getspatial?bfi48grd
Wolock, D.M., 2003b, Flow characteristics at U.S. Geological Survey streamgages in the conterminous United States: U.S. Geological Survey Open-File Report 03–146 [digital data], accessed December 6, 2006, at http://water.usgs.gov/lookup/getspatial?qsitesdd
Wolock, D.M., and McCabe, G.J., 1999, Explaining spatial variability in mean annual runoff in the conterminous United States: Journal of Climate Research, v. 11, p. 149–159.
Wolock, D.M., and McCabe, G.J., 2000, Differences in topographic characteristics computed from 100- and 1,000-meter resolution digital elevation model data: Hydrological Processes, v. 14, p. 987–1002.
Appendixes
Appendix Data
These data files are included as part of U.S. Geological Survey (USGS) Data Series 307 and are available for download at http://pubs.usgs.gov/ds/307/. See report text for details about the study and for information on sources and compilation of ancil-lary data. The data tables are available for download in two file formats, Microsoft© Excel (.xls) and comma-separated values (.csv) text. The Excel files are formatted to properly display the data. Users with software that reads Excel files are encouraged to download the Excel versions of the data files. If you cannot read Excel files, .csv files are provided. The first row of each data table contains USGS National Water Information System (NWIS) numeric and alpha parameter codes and parameter descrip-tions (example, P_63745_Total mercury, biota, tissue, recoverable, dry weight, nanograms per gram). The second row contains abbreviated parameter descriptions (example, THG_TIS_DW). Analytes with no parameter code listed are not entered in NWIS. Five data tables are included in this data series:
Appendix 1. Water and sediment sample data.
Mercury and methylmercury sample data for water and streambed sediment, including field parameters and additional water-quality analytes, collected during 1998–2005 at stream and river sampling sites. The Excel file can be accessed at ds307_Appendix01.xls. The .csv files can be accessed at ds307_Appendix01.notes.csv and ds307_Appendix01.data.csv.
Appendix 2. Field-blank sample data.
Feld-blank sample data for mercury and methylmercury in water, and additional water-quality analytes. The Excel file can be accessed at ds307_Appendix02.xls. The .csv files can be accessed at ds307_Appendix02.notes.csv and ds307_Appendix02.data.csv.
Appendix 3. Field-replicate sample data.
Field-replicate sample data for mercury and methylmercury in water and streambed sediment, and additional water-quality analytes. The Excel file can be accessed at ds307_Appendix03.xls. The .csv files can be accessed at ds307_Appendix03.notes.csv and ds307_Appendix03.data.csv.
Appendix 4. Fish data.
Mercury sample data, including physical characteristics and additional sample information, for fish collected during 1998–2005 at stream and river sampling sites. The Excel file can be accessed at ds307_Appendix04.xls. The .csv files can be accesssed at ds307_Appendix04.notes.csv and ds307_Appendix04.data.csv.
Appendix 5. Ancillary data.
Selected data for geographic information, basin hydrologic estimates, and mercury source estimates for basins upstream from most study sites. The Excel file can be accessed at ds307_Appendix05.xls. The .csv files can be accessed at ds307_Appendix05.notes.csv and ds307_Appendix05.data.csv.
32 Data on Mercury in Water, Bed Sediment, and Fish from Streams Across the United States, 1998–2005
Publishing support provided by: Denver Publishing Service Center
For more information concerning this publication, contact:Director, USGS Colorado Water Science CenterBox 25046, Mail Stop 415Denver, CO 80225(303) 236-4882
Or visit the Colorado Water Science Center Web site at:http://co.water.usgs.gov/
Bauch and others—
Data on M
ercury in Water, B
ed Sediment, and Fish From
Streams A
cross the United States, 1998–2005—
Data Series 307