Embed Size (px)
Citation preview

Data Page Layouts for Relational Databaseson Deep Memory Hierarchies
Anastassia Ailamaki David J. DeWitt Mark D. Hill
Abstract
Relational database systems have traditionally optimized for I/O performance and organized
records sequentially on disk pages using the N-ary Storage Model (NSM) (a.k.a., slotted pages).
Recent research, however, indicates that cache utilization and performance is becoming increas-
ingly important on modern platforms. In this paper, we first demonstrate that in-page data place-
ment is the key to high cache performance and that NSM exhibits low cache utilization on modern
platforms. Next, we propose a new data organization model called PAX (Partition Attributes
Across), that significantly improves cache performance by grouping together all values of each
attribute within each page. Because PAX only affects layout inside the pages, it incurs no storage
penalty and does not affect I/O behavior. According to our experimental results (which were
obtained without using any indices on the participating relations), when compared to NSM (a)
PAX exhibits superior cache and memory bandwidth utilization, saving at least 75% of NSM’s stall
time due to data cache accesses, (b) range selection queries and updates on memory-resident rela-
tions execute 17-25% faster, and (c) TPC-H queries involving I/O execute 11-48% faster. Finally,
we show that PAX performs well across different memory system designs.
1 Introduction
Although the major performance bottleneck in database systems has traditionally been I/O, modern
applications such as decision support systems and spatial applications are often bound by delays related to
the CPU and the memory subsystem [22][7][28]. This bottleneck shift is due to (a) the increase in main
memory sizes by three orders of magnitude in the past 20 years, (b) elaborate techniques that hide I/O
latencies such as data clustering and prefetching, and (c) complex algorithmic computation performed on
memory-resident data, that overlaps much of the I/O latency. When the processor submits a request, the
data is likely to be in main memory. Transferring the data from the memory to the caches, however, incurs
significant delays. Several workload characterization studies witness that DBMS performance suffers from
Carnegie Mellon University University of Wisconsin - [email protected] {dewitt, markhill}@cs.wisc.edu

2
cache misses more than other types of workloads, because they are memory-intensive. To address cache-
related delays, recently database researchers have become concerned with optimizing cache performance.
When running commercial database systems on a modern processor, a key memory bottleneck is data
requests that miss in the cache hierarchy, i.e., requests for data that are not found in any of the caches and
are transferred from main memory [1]. Careful analysis of basic query processing operators and data place-
ment schemes used in commercial DBMSs reveals a paradox: common workloads typically perform
sequential traversals through parts of the relation that are not referenced. The paradox occurs because (a)
the item that the query processing algorithm requests and the transfer unit between the memory and the
processor are not the same size, and (b) the data placement scheme used stores data in a different order
than the order in which they are accessed. Hence, only a fraction of the data transferred in the cache is use-
ful to the query.
The traditional page layout scheme used in database management systems is the N-ary Storage Model
(NSM, a.k.a., slotted pages). NSM stores records contiguously starting from the beginning of each disk
page, and uses an offset (slot) table at the end of the page to locate the beginning of each record [29]. Most
query operators, however, access only a small fraction of each record causing suboptimal cache behavior.
It is likely, for instance, that a sequential scan for a certain attribute will miss the cache and access main
memory once for every value accessed. Loading the cache with useless data (a) wastes bandwidth, (b) pol-
lutes the cache with useless data, and (c) possibly forces replacement of information that may be needed in
the future, incurring even more delays.
As an alternative, the decomposition storage model (DSM) (proposed in 1985 [12] in order to mini-
mize unnecessary I/O) partitions an n-attribute relation vertically into n sub-relations, each of which is
accessed only when the corresponding attribute is needed. Although DSM saves I/O and increases main
memory utilization, it is not used in today’s commercial products because in order to reconstruct a record,
the DBMS must join the participating sub-relations together. Except for Sybase-IQ [36], all of today’s
commercial database systems that we are aware of still use a variation of the traditional NSM algorithm for
general-purpose data placement [22][32][35]. The challenge is to repair NSM’s cache behavior, without
compromising its advantage over DSM.
This paper introduces and evaluates Partition Attributes Across (PAX), a new layout for data records
that combines the best of the two worlds and exhibits performance superior to both placement schemes by
eliminating unnecessary accesses to main memory. For a given relation, PAX stores the same data on each
page as NSM. Within each page, however, PAX groups all the values of a particular attribute together on a
minipage. During sequential scan (e.g., to apply a predicate on a fraction of the record), PAX fully utilizes
the cache resources, because on each miss a number of the same attribute’s values are loaded into the cache

3
together. At the same time, all parts of the record are on the same page. To reconstruct a record one needs
to perform a mini-join among minipages, which incurs minimal cost because it does not have to look
beyond the page.
We evaluated PAX against NSM and DSM using (a) predicate selection queries on numeric data and
(b) a variety of queries on TPC-H1 datasets on top of the Shore storage manager [9]. The experimentation
suite uses microbenchmarks as well as decision-support queries, as DSS applications are typically bound
by the memory-processor latency [22][7][28]. All queries perform sequential scans and joins directly on
the participating relations, without using any indices. Query parameters varied include selectivity, projec-
tivity, number of predicates, distance between the projected attribute and the attribute in the predicate, and
degree of the relation. The experimental results show that, when compared to NSM, PAX (a) incurs 50-
75% fewer second-level cache misses due to data accesses when executing a main-memory workload, (b)
executes range selection queries in 17-25% less elapsed time, and (c) executes TPC-H queries involving I/
O in 11-48% less time than NSM. When compared to DSM, PAX (a) executes queries faster because it
minimizes the reconstruction cost, and (b) exhibits stable execution time as selectivity, projectivity, and the
number of attributes in predicate vary, whereas the execution time of DSM increases linearly to these
parameters.
PAX has several additional advantages. Implementing PAX on a DBMS that uses NSM requires only
changes on the page-level data manipulation code. PAX can be used as an alternative data layout, and the
storage manager can decide to use PAX or not when storing a relation, based solely on the number of
attributes. Furthermore, research [14] has shown that compression algorithms work better with vertically
partitioned relations and on a per-page basis, and PAX has both of these characteristics. Finally, PAX can
be used orthogonally to other storage decisions such as affinity graph based partitioning [13], because it
operates at the page level.
The rest of this paper is organized as follows. Section 2 presents an overview of the related work, and
discusses the strengths and weaknesses of the traditional n-ary storage model (NSM) and decomposition
storage model (DSM). Section 3 explains the design of PAX in detail and analyzes its storage require-
ments, while Section 4 describes the implementation of basic query processing and data manipulation
algorithms. Section 5 discusses the evaluation methodology used to thoroughly understand the interaction
between data placement methods and cache performance. Sections 6, 7, and 8 analyze cache performance
of data placement schemes on a simple numeric workload, on a subset of the TPC-H decision-support
workload, and on multiple computer architecture platforms, respectively. Finally, Section 9 concludes with
a summary of the advantages of PAX and discusses possibilities for further improvement.
(1) TPC-H is the decision-support benchmark suite that replaced TPC-D in 1999.

4
2 Related work
Several recent workload characterization studies report that database systems suffer from high mem-
ory-related processor delays when running on modern platforms. All studies that we are aware of agree
that stall time due to data cache misses accounts for 50% (OLTP [20]) to 90% (DSS [1]) of the total mem-
ory-related stall time. Instruction cache miss rates2 are typically higher when executing OLTP workloads
on multi-threaded architectures [23], because multiple threads use the same set of caches and often cause
thrashing. Even on these architectures, however, 70% (OLTP) to 99% (DSS) of the total absolute number
of cache misses is due to data references [20][23].
Research in computer architecture, compilers, and database systems has focused on optimizing sec-
ondary storage data placement for cache performance. A compiler-directed approach for cache-conscious
data placement profiles a program and applies heuristic algorithms to find a placement solution that opti-
mizes cache utilization [8]. Clustering, compression, and coloring are the techniques that can be applied
manually by programmers to improve cache performance of pointer-based data structures [10]. For data-
base management systems, attribute clustering is proposed both for compression [14] and for improving
the performance of relational query processing [31].
The dominant data placement model in relational database systems is the N-ary storage model (NSM)
[29], that stores records sequentially in slotted disk pages. Alternatively, the Decomposition Storage Model
(DSM) [12] partitions each relation with n attributes in n separate relations. With the exception of ware-
housing products such as Sybase-IQ [36], all commercial database systems that we are aware of use NSM
for general-purpose data placement. This is mainly due to the high record-reconstruction cost that DSM
incurs when evaluating multi-attribute queries. A recent study demonstrates that DSM can improve cache
performance of main-memory database systems, assuming that the record reconstruction cost is low [6].
The remainder of this section describes the advantages and disadvantages of NSM and DSM, and briefly
outlines their variants.
(2) The cache miss rate is defined as the number of cache misses divided by the number of cache references.
5
2.1 The N-ary Storage Model
Traditionally, the records of a relation are stored in slotted disk pages [29] obeying an n-ary storage
model (NSM). NSM stores records sequentially on data pages. Figure 1 depicts an example relation R
(left) and the corresponding NSM page after having inserted four records (middle). Each record has a
record header (RH) that contains a null bitmap, offsets to the variable-length values, and other implementa-
tion-specific information [22][32]. Each new record is typically inserted into the first available free space
starting at the beginning of the page. Records may have variable length, therefore a pointer (offset) to the
beginning of the new record is stored in the next available slot from the end of the page. The nth record in a
page is accessed by following the nth pointer from the end of the page.
During predicate evaluation, however, NSM exhibits poor cache performance. Consider the query:
select namefrom Rwhere age < 40;
To evaluate the predicate, the query processor uses a scan operator [15] that retrieves the value of the
attribute age from each record in the relation. Assuming that the NSM page in the middle of Figure 1 is
already in main memory and that the cache block size is smaller than the record size, the scan operator will
incur one cache miss per record. If age is a 4-byte integer, it is smaller than the typical cache block size
(32-128 bytes). Therefore, along with the needed value, each cache miss will bring into the cache the other
values stored next to age (shown on the right in Figure 1), wasting useful cache space to store non-refer-
enced data, and incurring unnecessary accesses to main memory.
RID SSN Name Age
1 0962 Jane 30
2 7658 John 45
3 3859 Jim 20
4 5523 Susan 52
5 9743 Leon 43
6 0618 Dan 37
FIGURE 1: The N-ary Storage Model (NSM) and its cache behavior. Records in R (left) are stored contiguouslyinto disk pages (middle), with offsets to their starts stored in slots at the end of the page. While scanning age, NSMtypically incurs one cache miss per record and brings useless data into the cache (right).
PAGE HEADER RH1 0962
Jane 30 RH2 7658 John
45 RH3 3589 20 RH4Jim
5523 52Susan
NSM PAGE
5523 52Susan
20 RH4Jim
45 RH3 3589
Jane 30 RH block 1
block 2
block 3
block 4
CACHERELATION R

6
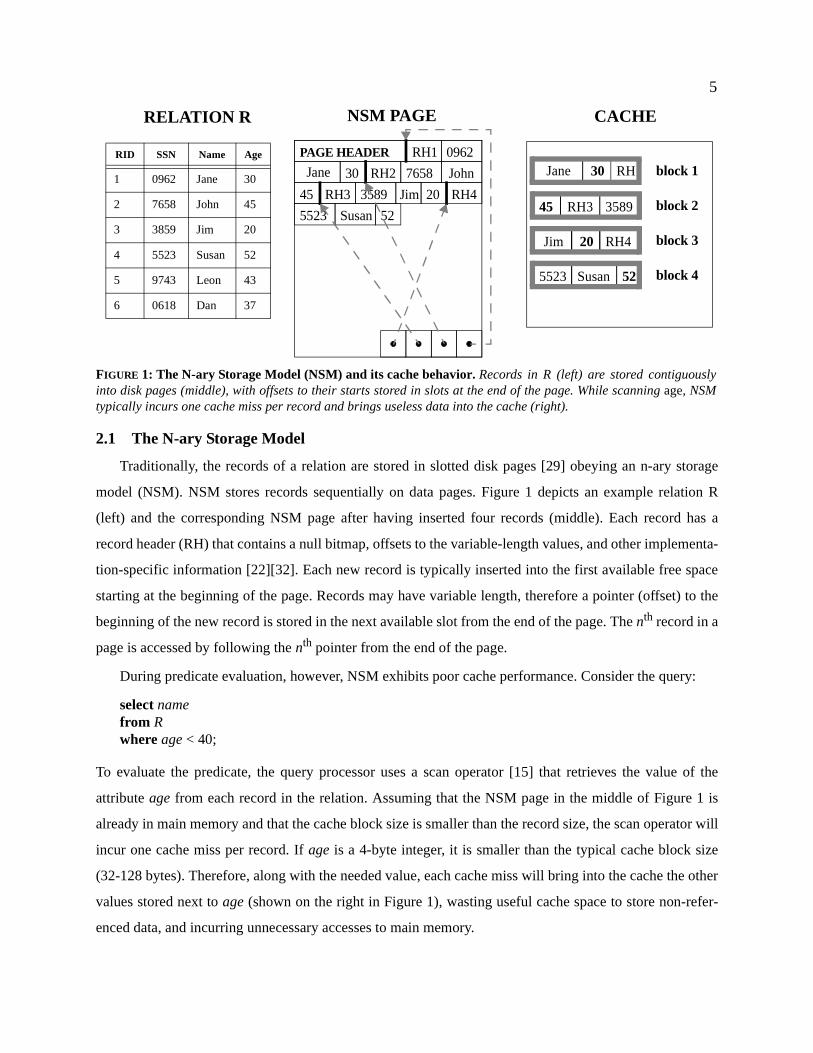
2.2 The Decomposition Storage Model
Vertical partitioning is the process of striping a relation into sub-relations, each containing the values
of a subset of the initial relation’s attributes. Vertical partitioning was initially proposed in order to reduce
I/O-related costs [26]. The fully decomposed form of vertical partitioning (one attribute per stripe) is called
the decomposition storage model (DSM) [12]. DSM partitions an n-attribute relation vertically into n sub-
relations, as shown in Figure 2. Each sub-relation contains two attributes, a logical record id (surrogate)
and an attribute value (essentially, it is a clustered index on the attribute). Sub-relations are stored as regu-
lar relations in slotted pages, enabling each attribute to be scanned independently.
DSM offers a higher degree of spatial locality when sequentially accessing the values of one attribute.
During a single-attribute scan, DSM exhibits high I/O and cache performance. DSM performance is supe-
rior to NSM when queries access fewer than 10% of the attributes in each relation. Warehousing products
such as Sybase-IQ [36] successfully use DSM-style partitioning and further optimize data access using
variant indices [27]. When evaluating a multi-attribute query, however, the database system must join the
participating sub-relations on the surrogate in order to reconstruct the partitioned records. The time spent
joining sub-relations increases with the number of attributes in the result relation. In addition, DSM incurs
a significant space overhead because the record id of each record needs be replicated.
An alternative algorithm [13] partitions each relation based on an attribute affinity graph, which con-
nects pairs of attributes based on how often they appear together in queries. The attributes are grouped in
fragments, and each fragment is stored as a separate relation to maximize I/O performance and minimize
record reconstruction cost. When the set of attributes in a query is a subset of the attributes in the fragment,
FIGURE 2: The Decomposition Storage Model (DSM). The relation is partitioned vertically into one thin relationper attribute. Each sub-relation is then stored in the traditional fashion.
R2
RID SSN
1 0962
2 7658
3 3859
4 5523
5 9743
6 0618 RID Age
1 30
2 45
3 20
4 52
5 43
6 37
PAGE HEADER 1 0962
2 7658 3 3859
. .4 5523
. .PAGE HEADER 1 Jane
2 John 3 Jim
. .4 Susan
. .PAGE HEADER 1 30 2
45 3 20
. .4 52
. .
R3
R1
RID Name
1 Jane
2 John
3 Jim
4 Susan
5 Leon
6 Dan
sub-relation R1
sub-relation R2
sub-relation R3

7
there is a significant gain in I/O performance [2]. The performance of affinity-based vertical partitioning
depends heavily on whether queries involve attributes within the same fragment.
3 PAX
In this section, we introduce a new strategy for placing records on a page called PAX (Partition
Attributes Across). PAX (a) maximizes inter-record spatial locality within each column and within each
page, thereby eliminating unnecessary requests to main memory without a space penalty, (b) incurs a min-
imal record reconstruction cost, and (c) is orthogonal to other design decisions, because it only affects the
layout of data stored on a single page (e.g., one may decide to store one relation using NSM and another
using PAX, or first use affinity-based vertical partitioning, and then use PAX for storing the ‘thick’ sub-
relations). This section presents the detailed design of PAX.
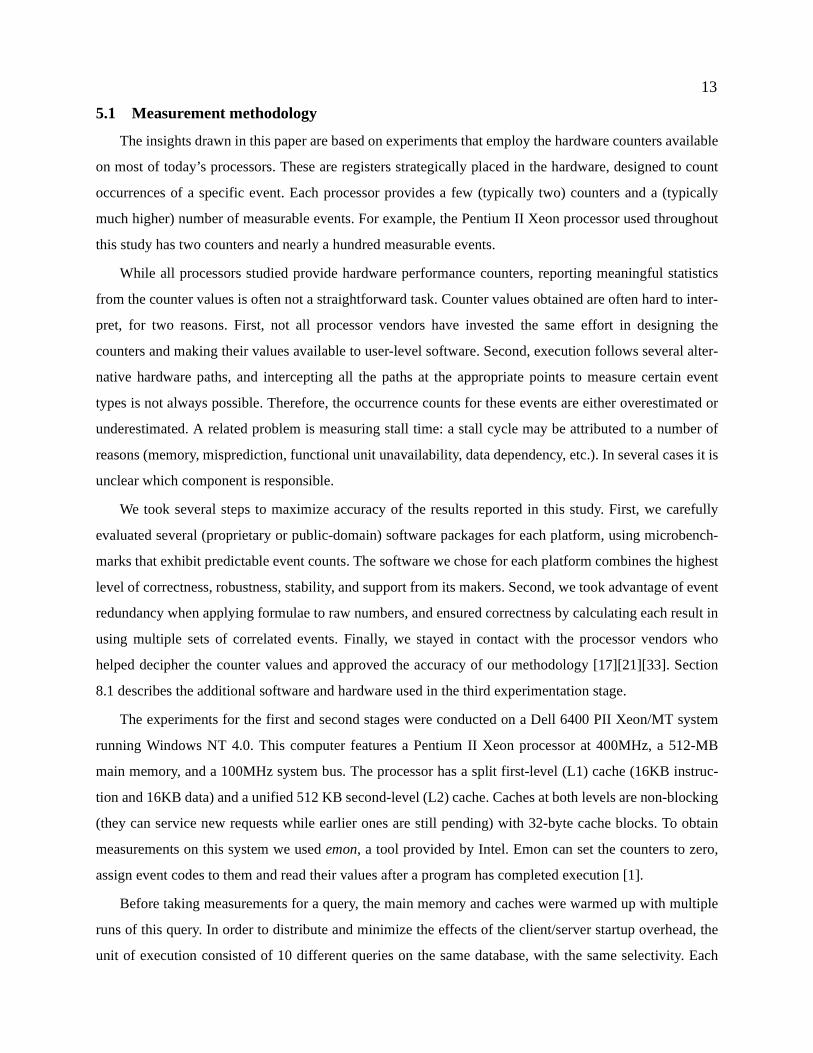
3.1 Overview
The motivation behind PAX is to keep the attribute values of each record on the same page as in NSM,
while using a cache-friendly algorithm for placing them inside the page. PAX vertically partitions the
records within each page, storing together the values of each attribute in minipages. Figure 3 depicts an
NSM page and the corresponding PAX page, with the records of the former stored in the latter in a column-
major fashion. When using PAX, each record resides on the same page as it would reside if NSM were
used; however, all SSN values, all name values, and all age values are grouped together on minipages. PAX
increases the inter-record spatial locality (because it groups values of the same attribute that belong to dif-
ferent records) with minimal impact on the intra-record spatial locality. Although PAX employs in-page
vertical partitioning, it incurs minimal record reconstruction costs, because it does not need to perform a
join to correlate the attribute values of a particular record.
FIGURE 3: Partition Attributes Across (PAX), and its cache behavior. PAX partitions records into minipageswithin each page. As we scan R to read attribute age,values are much more efficiently mapped onto cache blocks,and the cache space is now fully utilized.
block 130 52 45 20
CACHE
0962 7658
3859 5523
. .. .
Jane John Jim Susan
30 52 45 20
PAGE HEADER
PAX PAGE
PAGE HEADER RH1 0962
Jane 30 RH2 7658 John
45 RH3 3589 20 RH4Jim
5523 52Susan
0962
NSM PAGE

8
3.2 Design
In order to store a relation with degree n
(i.e., with n attributes), PAX partitions each
page into n minipages. It then stores values of
the first attribute in the first minipage, values
of the second attribute in the second minipage,
and so on. At the beginning of each page there
is a page header that contains offsets to the
beginning of each minipage. The record header
information is distributed across the
minipages. The structure of each minipage is
determined as follows:
• Fixed-length attribute values are stored in
F-minipages. At the end of each F-
minipage there is a presence bit vector
with one entry per record that denotes null values for nullable attributes.
• Variable-length attribute values are stored in V-minipages. V-minipages are slotted, with pointers to the
end of each value. Null values are denoted by null pointers.
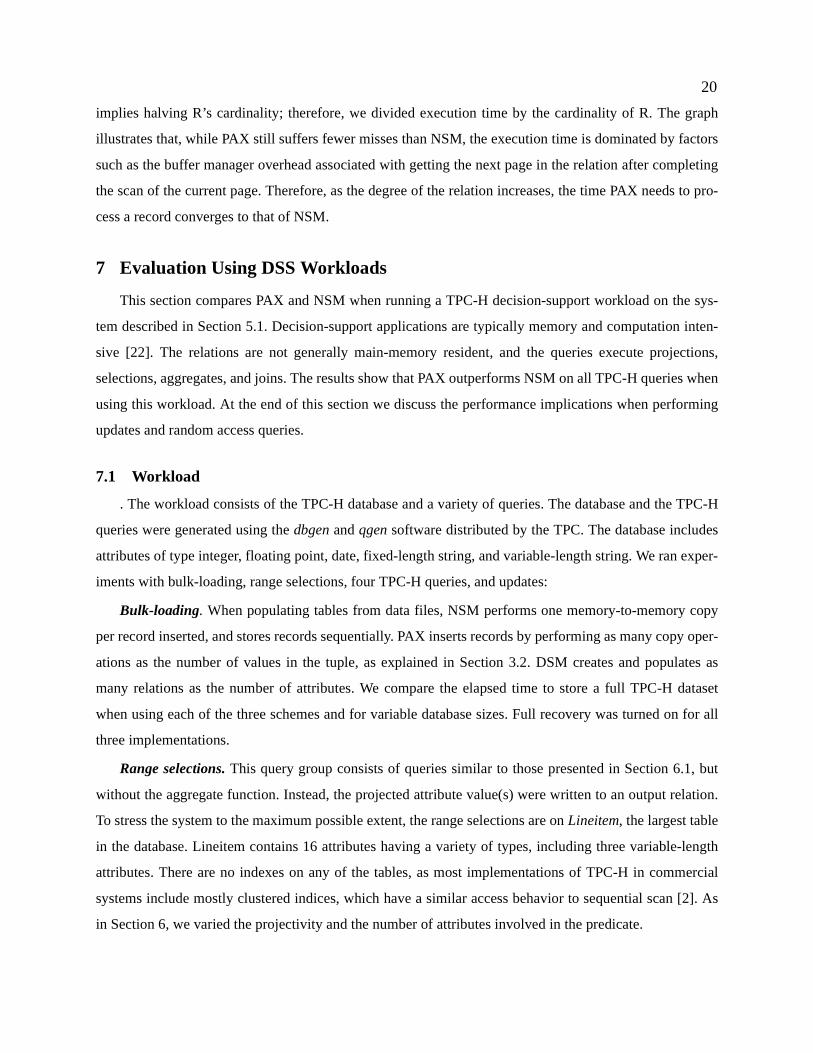
Each newly allocated page contains a page header and a number of minipages equal to the degree of
the relation. The page header contains the number of attributes, the attribute sizes (for fixed length
attributes), offsets to the beginning of the minipages, the current number of records on the page and the
total space still available. Figure 4 depicts an example PAX page in which two records have been inserted.
There are two F-minipages, one for the SSN attribute and one for the age attribute. The name attribute is a
variable-length string, therefore it is stored in a V-minipage. At the end of each V-minipage there are off-
sets to the end of each variable-length value.
Records on a page are accessed either sequentially or in random order (e.g., through a non-clustered
index). In order to sequentially access a subset of attributes, the algorithm sequentially accesses the values
in the appropriate minipages. Appendix A outlines the part of the sequential scan algorithm that reads all
values of a fixed-length attribute f or a variable-length attribute v from a newly accessed page, and the part
of the indexed scan that reads a value of an attribute a, given the record id.
To store a relation, PAX requires the same amount of space as NSM. NSM stores the attributes of each
record contiguously, therefore it requires one offset (slot) per record and one additional offset for each vari-
able-length attribute in each record. PAX, on the other hand, stores one offset for each variable-length
FIGURE 4: An example PAX page. In addition to the tradi-tional information (page id, number of records in the page,attribute sizes, free space, etc.) the page header maintains off-sets to the beginning of each minipage.
0962
Jane
30
7658
John
45
pid . . . 3 2 4 v 4 f
1
. .
1
1 1
presence bits
presence bits
v-offsets
# attributes# records
attr. sizes
free space
}
}}}
page header
F-minipage
F-minipage
V-minipage

9
value, plus one offset for each of the n minipages. Therefore, regardless of whether a relation is stored
using NSM of PAX, it will occupy the same number of pages. As explained in Section 4.1, implementa-
tion-specific details may introduce slight differences which are insignificant to the overall performance.
3.3 Evaluation
The data placement scheme determines two factors that affect performance. First, the inter-record spa-
tial locality minimizes data cache-related delays when executing iterators over a subset of fields in the
record. DSM provides inter-record spatial locality, because it stores attributes contiguously, whereas NSM
does not. Second, the record reconstruction cost minimizes the delays associated with retrieving multiple
fields of the same record.
Table 1 summarizes the characteristics of NSM, DSM, and PAX, demonstrating the trade-off between
inter-record spatial locality and record reconstruction cost. Commercial systems use NSM because DSM
requires costly joins that offset the benefit from the inter-record spatial locality. NSM, however, exhibits
suboptimal cache behavior; a better data placement scheme is needed that will offer spatial locality with
minimal record reconstruction cost. PAX offers the best of both worlds by combining the two critical char-
acteristics: inter-record spatial locality (so that the cache space is fully utilized), and minimal record recon-
struction overhead, by keeping all parts of each record in the same page. As an additional advantage,
implementing PAX on an existing DBMS requires only changes to the page-level data manipulation code.
4 System Implementation
NSM, PAX, and DSM were implemented as alternative data layouts in the Shore storage manager [9].
Normally Shore stores records as contiguous byte sequences, therefore the finest granularity for accessing
information is the record. To implement NSM, we added attribute-level functionality on top of the existing
Shore file manager (as explained later in this section). DSM was implemented on top of Shore, by decom-
posing the initial relation into n Shore files that are stored in slotted pages using NSM. Each sub-relation
includes two columns, one with a logical record id and one with the attribute value. Finally, PAX was
implemented as an alternative data page organization in Shore. All schemes use record-level locking and
the ARIES-style logging and recovery mechanism provided by Shore, with only minor modifications for
TABLE 1: Comparison of characteristics between NSM, DSM, and PAX.
Characteristic NSM DSM PAX
Inter-record spatial locality — ! !
Low record reconstruction cost ! — !

10
the recovery system to handle PAX records. In the rest of this section, we discuss record implementation
and data manipulation and retrieval algorithms.
4.1 Record Implementation
Figure 5 illustrates how NSM records were implemented. The fixed-length attribute values are stored
first, followed by an array of offsets and a mini-heap containing the variable-length attribute values. In
front of each record, Shore adds a 12-byte tag with Shore-specific information such as serial number,
record type, header length, and record length. In addition, it uses 4-byte slots at the end of the page (two
bytes for the offset and another two for the amount of space allocated for each record). This adds up to a
16-byte overhead per record.
In the current implementation, TPC-H tables stored using PAX need 8% less space than when stored
using NSM. 3-4% of this benefit is due to the fact that PAX does not need a slot table at the end of a page.
The rest is Shore-specific overhead resulting from the 12-byte Shore record tag. Commercial database
management systems store a header in front of each record, that keeps information such as the NULL bit-
map, space allocated for the record, true record size, fixed part size, and other flags. The record header’s
size varies with the number and type of columns in the table. For the TPC-H table Lineitem, the record
header would be about 8 bytes. Therefore, the Shore tag adds a space overhead of 4 bytes per record. Due
to this overhead, NSM takes 4% more storage than it would if the Shore tag were replaced by common
NSM header information.
4.2 Data Manipulation Algorithms
BULK-LOADING AND INSERTIONS. The algorithm to bulk-load records from a data file starts by allocating
each minipage on the page based on attribute value size. In the case of variable-length attributes, it uses a
hint (either from the user or the average length from the first few records) as an indication of the average
value size. PAX inserts records by copying each value into the appropriate minipage. When variable-length
values are present, minipage boundaries may need to be adjusted to accommodate records as they are
inserted in the page. If a record fits in the page but its individual attribute values do not, the algorithm
recalculates minipage sizes based on the average value sizes in the page so far and the new record size, and
FIGURE 5: An example NSM record structure in Shore. The data for fixed-length columns is stored first, fol-lowed by a 2-byte offset array and the variable-length data.
SHORE TAG FIXED-LENGTH VARIABLE-LENGTH VALUES}
2*v bytes2-byte offsets
} }}
12 bytes f*F bytes v*V bytes
VALUES

11
reorganizes the page structure by moving minipage boundaries appropriately to accommodate new records.
When the page is full, it allocates a new page with the initial minipage sizes equal to the ones in the previ-
ously populated page (so the initial hints are quickly readjusted to the true per-page average value sizes).
Shore supports insertion of a record into the first page that can accomodate it (i.e., not necessarily
appending them at the end of the relation). The NSM insertion algorithm concatenates the record values
into the byte sequence presented in Figure 5, to which Shore adds a tag and stores the record. The PAX
implementation calculates the position of each attribute value on the page, stores the value, and updates the
presence bitmaps and offset arrays accordingly.
UPDATES. NSM uses the underlying infrastructure provided by Shore, and updates attribute values within
the record. Updates on variable-length attributes may stretch or shrink the record; page reorganizations
may be needed to accomodate the change and the slot table must be updated. If the updated record grows
beyond the free space available in the page, the record is moved to another page. PAX updates an attribute
value by computing the offset of the attribute in the corresponding minipage. Variable-length attribute
updates require only V-minipage-level reorganizations, to move values of the updated attribute only. If the
new value is longer than the space available in the V-minipage, the V-minipage borrows space from a
neighboring minipage. If the neighboring minipages do not have sufficient space, the record is moved to a
different page.
DELETIONS. The NSM deletion algorithm uses the slot array to mark deleted records, and the free space
can be filled upon future insertions. PAX keeps track of deleted records using a bitmap at the beginning of
the page, and determines whether a record has been deleted using fast bitwise calculations. Upon record
deletion, PAX reorganizes minipage contents to fill the gaps to minimize fragmentation that could affect
PAX's optimal cache utilization. As discussed in Section 7.2, minipage reorganization does not affect
PAX’s performance because it incurs minimal overhead. Attribute value offsets are calculated by convert-
ing the record id to the record index within the page, which takes into account deleted records.
For deletion-intensive workloads, an alternative approach is to mark records as deleted but defer reor-
ganizations. This algorithm creates gaps in minipages, resulting in suboptimal cache utilization during file
scan because deleted record data are occasionally brought into the cache. To maintain cache performance
to acceptable levels, the system can schedule periodic file reorganizations. We plan to provide the option to
use on a per-file basis the one best suited for each application.
4.3 Query Operators
SCAN OPERATOR. A scan operator that supports sargable predicates [30] was implemented on top of
Shore. When running a query using NSM, one scan operator is invoked that reads each record and extracts

12
the attributes involved in the predicate from it. PAX invokes one scan operator for each attribute involved
in the query. Each operator sequentially reads values from the corresponding minipage. The projected
attribute values for qualifying records are retrieved from the corresponding minipages using computed off-
sets. With DSM, as many operators as there are attributes in the predicate are invoked, each on a sub-rela-
tion. The algorithm makes a list of the qualifying record ids, and retrieves the projected attribute values
from the corresponding sub-relations through a B-tree index on record id.
JOIN OPERATOR. The adaptive dynamic hash join algorithm [25], which is also used in DB2 [22], was
implemented on top of Shore. The algorithm partitions the left table into main-memory hash tables on the
join attribute. When all available main memory has been consumed, all buckets but one are stored on the
disk. Then it partitions the right table into hash tables in a similar fashion, probing dynamically the main-
memory portion of the left table with the right join attribute values. Using only those attributes required by
the query, it then builds hash tables with the resulting sub-records. The join operator receives its input from
two scan operators, each reading one relation. The output can be filtered through a function that is passed
as a parameter to the operator.
5 Evaluation Methodology
To evaluate PAX performance and compare it to NSM and DSM, it is necessary to first understand
cache behavior and its implications for all three schemes. We perform the evaluation studies in three
stages:
1. The first stage uses plain range selection queries on a memory-resident relation that consists of fixed-
length numeric attributes. This step is necessary to determine the algorithm sentitivity when varying
basic query parameters, and provide insight on the cache behavior of basic algorithms.
2. The second stage uses both range and complex decision-support queries on a TPC-H dataset to obtain
results on more complicated queries. This stage corroborates the hypothesis that, the more complex a
DSS query is, the more time the processor spends on in-memory data, and cache performance becomes
more important.
3. The third stage evaluates PAX across three fundamentally different processor and memory hierarchy
designs using the DSS workload. This stage completes the experiment cycle by ensuring that the per-
formance results do not depend on a specific processor and memory architecture.
The rest of this section describes the common experimental setup used across all three stages, and jus-
tifies the selection of Shore as our software experiment platform.
13
5.1 Measurement methodology
The insights drawn in this paper are based on experiments that employ the hardware counters available
on most of today’s processors. These are registers strategically placed in the hardware, designed to count
occurrences of a specific event. Each processor provides a few (typically two) counters and a (typically
much higher) number of measurable events. For example, the Pentium II Xeon processor used throughout
this study has two counters and nearly a hundred measurable events.
While all processors studied provide hardware performance counters, reporting meaningful statistics
from the counter values is often not a straightforward task. Counter values obtained are often hard to inter-
pret, for two reasons. First, not all processor vendors have invested the same effort in designing the
counters and making their values available to user-level software. Second, execution follows several alter-
native hardware paths, and intercepting all the paths at the appropriate points to measure certain event
types is not always possible. Therefore, the occurrence counts for these events are either overestimated or
underestimated. A related problem is measuring stall time: a stall cycle may be attributed to a number of
reasons (memory, misprediction, functional unit unavailability, data dependency, etc.). In several cases it is
unclear which component is responsible.
We took several steps to maximize accuracy of the results reported in this study. First, we carefully
evaluated several (proprietary or public-domain) software packages for each platform, using microbench-
marks that exhibit predictable event counts. The software we chose for each platform combines the highest
level of correctness, robustness, stability, and support from its makers. Second, we took advantage of event
redundancy when applying formulae to raw numbers, and ensured correctness by calculating each result in
using multiple sets of correlated events. Finally, we stayed in contact with the processor vendors who
helped decipher the counter values and approved the accuracy of our methodology [17][21][33]. Section
8.1 describes the additional software and hardware used in the third experimentation stage.
The experiments for the first and second stages were conducted on a Dell 6400 PII Xeon/MT system
running Windows NT 4.0. This computer features a Pentium II Xeon processor at 400MHz, a 512-MB
main memory, and a 100MHz system bus. The processor has a split first-level (L1) cache (16KB instruc-
tion and 16KB data) and a unified 512 KB second-level (L2) cache. Caches at both levels are non-blocking
(they can service new requests while earlier ones are still pending) with 32-byte cache blocks. To obtain
measurements on this system we used emon, a tool provided by Intel. Emon can set the counters to zero,
assign event codes to them and read their values after a program has completed execution [1].
Before taking measurements for a query, the main memory and caches were warmed up with multiple
runs of this query. In order to distribute and minimize the effects of the client/server startup overhead, the
unit of execution consisted of 10 different queries on the same database, with the same selectivity. Each

14
time emon executed one such unit, it measured a pair of events. In order to increase the confidence inter-
vals, the experiments were repeated several times and the final sets of numbers exhibit a standard deviation
of less than 5 percent. Finally, using a set of formulae, these numbers were transformed into meaningful
performance metrics.
All the experiments were conducted by running one query at a time on a dedicated computer, therefore
interference and race conditions with other queries and programs over a cache block has been factored out.
Cache placement and replacement is determined by the hardware and there is no obvious software way to
address this problem. Intuitively, interference should hurt NSM more than it hurts PAX, as PAX packs data
more efficiently into cache blocks, thereby reducing the cache data footprint. Research toward that direc-
tion is beyond the scope of this paper.
5.2 Eligibility of Shore as a Development and Evaluation Platform
The prototype software that we choose to implement the three data placement alternatives must pro-
vide state-of-the-art storage management techniques, representative of those used in commercial database
systems. In addition, its hardware behavior, especially with respect to memory hierarchy trends and bottle-
necks, must be similar to the behavior of commercial database systems, as studied in previous work [1].
The Shore storage manager [9] meets both requirements. First, it provides all the features of a modern
storage manager, namely B-trees and R-trees, ARIES-style recovery, hierarchical locking (record, page,
file), and clock-hand buffer management with hints. Second, as illustrated in Figure 6, Shore exhibits sim-
ilar behavior to commercial database systems. The leftmost graph compares the execution time breakdown
FIGURE 6: Hardware characterization of four commercial DBMSs and Shore. Comparison of elapsed time(left) and memory stall time (right) breakdowns across four commercial database systems (A, B, C, andD) and Shore when running a range selection with 10% selectivity.The diagonally striped part labeledMemory on the left is analyzed on the right into cache stalls due to data and instructions.
Execution time breakdown
0%
20%
40%
60%
80%
100%
A B C D Shore
DBMS
% e
xecu
tio
n t
ime
Computation Memory Branch Other H/W
Memory stall time breakdown
0%
20%
40%
60%
80%
100%
A B C D Shore
DBMS
% m
emo
ry s
tall
tim
e
L1 Data L2 Data L1 Instr L2 Instr

15
of four popular commercial database systems and Shore when running a range selection query on the TPC-
H dataset with 10% selectivity. The execution time is divided in computation time, memory stalls, branch
misprediction stalls, and other hardware-related stalls. The rightmost graph further divides memory stall
time into stalls due to first and second cache level data and instruction misses. Experiments with other
types of queries show comparable results. The graphs in Figure 6 illustrate that (a) there is a significant
time spent in data-related stalls in memory hierarchy, and (b) Shore exhibits similar behavior to that of
commercial database systems. Therefore, Shore is an eligible software platform to develop and evaluate
data placement schemes3.
6 The Impact of Data Placement on Cache Performance
To evaluate PAX performance and compare it to NSM and DSM, it is necessary to first understand
cache behavior and its implications for all three schemes. In this section we first describe the workload
used to analyze cache performance and execution time when running the simple queries on the system
described in Section 5.1. Then, we discuss the limitations of all three data placement schemes by contrast-
ing sensitivity analysis results when varying query parameters.
6.1 Workload
The workload consists of one relation and variations of the following range selection query:
select avg(ap)from Rwhere aq > Lo and aq < Hi (1)
where ap, aq are attributes in R. This query is sufficient to examine the net effect of each data layout when
accessing records sequentially or randomly (given their record id). Unless otherwise stated, R contains
eight 8-byte numeric attributes, and is populated with 1.2 million records. For predictability and easy cor-
rectness verification of experimental results, we chose the attribute size so that exactly four values fit in the
32-byte cache line, and record sizes so that record boundaries coincide with cache line boundaries. We var-
ied the projectivity, the number of attributes in the selection predicate, their relative position, and the num-
ber of attributes in the record. The values of the attribute(s) used in the predicate are the same as in the
l_partkey attribute of the Lineitem table in the TPC decision-support benchmarks [16], with the same data
skew and uniform distribution.
(3) To produce the graphs shown in Figure 6, we used microbenchmarks that successfully show trends and execution bottlenecksduring basic query execution loops, but are inappropriate to measure how fast DBMS are in absolute terms. The point made bythese graphs is that Shore exhibits behavior trends that are comparable to those of commercial DBMS; therefore, the percent-age-based time breakdown is more relevant than the absolute query performance.

16
PAX is intended to optimize data cache behavior, and does not affect I/O performance in any way. In
workloads where I/O latency dominates execution time, the performance of PAX eventually converges to
the performance of NSM. PAX is designed to ensure high data cache performance once the data page is
available from the disk, and is orthogonal to any additional optimizations to enhance I/O performance. In
the rest of this section, we study the effects of the data placement scheme when running queries on main-
memory resident relations.
6.2 Results and Analysis
While the performance of the NSM and PAX schemes are relatively insensitive to the changes, DSM’s per-
formance is very sensitive to the number of attributes used in the query. When the query involves less than
10% of the attributes in the relation, DSM actually performs well because the record reconstruction cost is
low. As the number of attributes involved increases, however, DSM’s performance deteriorates rapidly
because it joins more sub-relations together. Dedicated warehousing products such as Sybase-IQ [36] and
variant indexing techniques [27] improve this behavior for decision-support applications. NSM and PAX,
on the other hand, maintain stable performance as the number of attributes in the query increases, because
all the attributes of each record reside on the same page, minimizing the record reconstruction cost. As
PAX improves NSM cache performance and is orthogonal to DSM (it can be applied on vertically parti-
tioned tables) we evaluate PAX against NSM on DSS-style workloads.
The rest of this section analyzes the significance of the data placement scheme to the query execution.
The first part discusses in detail the cache behavior of NSM and PAX, while the second part presents a sen-
sitivity analysis on NSM and PAX as the query projectivity, the number of attributes in the predicate, the
selectivity, and the number of attributes in the relation are varied.
6.2.1 Impact on Cache Behavior and Execution Time Breakdown
The cache behavior of PAX is significantly better when compared to NSM. As the predicate is applied
to aq, NSM suffers one cache miss for each record. Since PAX groups attribute values together on a page,
it incurs a miss every n records, where n is the cache block size divided by the attribute size. In our experi-
ments, PAX takes a miss every four records (32 bytes per cache block divided by 8 bytes per attribute).
Consequently, PAX saves at least 75% of the data misses NSM incurs in the second-level cache.

17
Figure 7 illustrates that PAX reduces the delays related to the data cache, and therefore runs queries
faster. The graphs on the left and center show the processor stall time4 per record due to data misses at both
cache levels for NSM and PAX, respectively. Due to the higher spatial locality, PAX reduces the data-
related penalty at both cache levels. The L1 data cache penalty does not affect the overall execution time
significantly, because the penalty associated with one L1 data cache miss is small (10 processor cycles).
Each L2 cache miss, however, costs 70-80 cycles.5 PAX reduces the overall L2 cache data miss penalty by
70%. Therefore, as shown in the graph on the right of Figure 7, the overall processor stall time is 75% less
when using PAX, because it does not need to wait as long for data to arrive from main memory. The mem-
ory-related penalty contributes 22% to the execution time when using NSM, and only 10% when using
PAX.
Reducing the data cache misses at both cache levels and minimizing data stall time also reduces the
number of instruction misses on the second-level cache, and minimizes the associated delays. The second-
level cache is unified, i.e., contains both data and instructions that replace each other as needed to accomo-
date new requests. To evaluate the predicate, NSM loads the cache with non-referenced data, which are
likely to replace potentially needed instructions and incur extra instruction misses in the future. PAX only
brings useful data into the cache, occupying less space and minimizing the probability to replace an
instruction that will be needed in the future.
Although PAX and NSM have comparable instruction footprints, the rightmost graph of Figure 7
shows that PAX incurs less computation time. This is a side effect from reducing memory-related delays.
(4) Processing time is 100% during all of the experiments, therefore processor cycles are directly analogous to elapsed time.(5) Due to the increasing processor-memory speed gap, memory access costs are even higher in recent processors.
FIGURE 7: PAX impact on memory stalls. Cache miss penalty per record processed due to data misses at the sec-ond and first level cache for NSM (left) and PAX(center) as a function of the selectivity. For selectivity 1%, the graphon the right shows CPU time breakdown in clock cycles per record processed into useful computation (Comp), stalltime due to memory delays (Mem) and stall time due to other reasons (Misc).
CPU time
0
200
400
600
800
1000
1200
1400
1600
1800
NSM PAX
Page Layout
clo
ck c
ycle
s p
er r
eco
rd
MiscMemComp
NSM
0
20
40
60
80
100
120
140
160
1% 5% 10% 20% 50% 100%
selectivity
clo
ck c
ycle
s p
er r
eco
rd
L1 Data Penalty
L2 Data penalty
PAX
0
20
40
60
80
100
120
140
160
1% 5% 10% 20% 50% 100%
selectivitycl
ock
cyc
les
per
rec
ord
L1 Data Penalty
L2 Data penalty

18
Modern processors can retire6 multiple instructions per cycle; the Xeon processor can retire up to three.
When there are memory-related delays, the processor cannot operate at its maximum capacity and retires
less than three instructions per cycle. With NSM, only 30% of the total cycles retire three instructions, with
60% retiring either zero or one instruction. As reported by previous studies [1][20], database systems suf-
fer high data dependencies and the majority of their computation cycles commit significantly fewer
instructions than the actual capacity of the processor. PAX partially alleviates this problem by reducing the
stall time, and the queries execute faster because they exploit better the processor’s superscalar ability.
6.2.2 Sensitivity Analysis
As the number of attributes involved in the query increases, the elapsed execution times of NSM and
PAX converge. In the leftmost graph of Figure 8, the projectivity of the query is varied from 1 to 7
attributes, and the predicate is applied to the eighth attribute. In the experiments shown, PAX is faster even
when the result relation includes all the attributes. The reason is that the selectivity is maintained at 50%,
and PAX exploits spatial locality on the predicates as well as on the projected attributes, whereas NSM
brings into the cache useless information 50% of the time. Likewise, the rightmost graph of Figure 8 dis-
plays the elapsed time as the number of attributes in the selection predicate is varied from 1 to 7, with the
projection on the eighth attribute. PAX is again faster for locality reasons. In these experiments, DSM’s
performance is about a factor of 9 slower than NSM and PAX. As the number of attributes involved in the
query increases, DSM must join the corresponding number of sub-relations.
(6) During a given cycle, the processor pipeline is capable of simultaneously issuing (reading) i instructions, executing x instruc-tions (that were issued in previous cycles) and retiring (writing results onto registers and cache) c instructions (that were issuedand executed in previous cycles). For the Xeon processor, i = 3, x = 5, and c = 3.
FIGURE 8: Elapsed time comparison as a function of projectivity (left) and number of predicates (right).NSM and PAX elapsed times for range selections with 50% selectivity (controlled by the first predicate).
Sensitivity to # of attributes in predicate
3
3.5
4
4.5
5
5.5
1 2 3 4 5 6 7number of attributes in predicate
elap
sed
tim
e (s
eco
nd
s)
NSM
PAX
Sensitivity to projectivity
3
3.5
4
4.5
5
5.5
1 2 3 4 5 6 7
projectivity
elap
sed
tim
e (s
eco
nd
s)
NSM
PAX

19
When compared to NSM, PAX is insensitive to
changes in query selectivity. The graph in Figure 9
shows the stall time per record due to second-level
cache data misses as a function of the selectivity, when
running a range selection with one projected attribute
and one predicate. In the NSM record, the distance
between the projected attribute and the predicate is more
than a cache block (32 bytes). This means that for each
qualified record, NSM will have one additional cache
miss to fetch the projected attribute’s value. The higher
the selectivity, the more the qualifies records, hence the
increase in NSM’s data stalls. PAX must access a differ-
ent minipage for each qualified record to fetch the pro-
jected attribute; higher selectivity, however, means that the cache block from the projected attribute’s
minipage is likely to contain more projected values. Consequently, as the selectivity increases extra cache
misses will occur at a decreasing rate .
Using PAX to increase the inter-record spatial local-
ity in a page and reduce the number of data cache misses
is meaningful as long as the ratio of the record size to
the page size is low enough that a large number of
records fit on the page (which is a reasonable assump-
tion in most workloads). All of the above measurements
were taken with R consisting of eight, 8-byte attributes.
For this relation, PAX divides the page into 8 minipages,
(one per attribute), resulting in about 125 records in
each 8K page. Therefore, in a system with 32-byte cache
block, PAX incurs about four times fewer data cache
misses than NSM when scanning records to apply a
predicate to an attribute. As the number of attributes in a
record increases, fewer records fit on one page. With 64 8-byte values per record, the number of records
per page is reduced to 15.
Figure 10 shows the elapsed time PAX and NSM need to process each record, as a function of the
number of attributes in the record. To keep the relation main-memory resident, doubling the record size
FIGURE 9: PAX/NSM sensitivity to selectivity ofthe query. PAX is insensitive to selectivity; NSMincurs more data stalls as more records qualify.
Sensitivity to selectivity
0
30
60
90
120
150
1% 5% 10% 20% 50% 100%
selectivity
L2
dat
a st
all c
ycle
s/re
cord
NSM
PAX
FIGURE 10: PAX/NSM sensitivity to the numberof attributes in the relation. As fewer records fit ineach page, the elapsed times per record converge.
Sensitivity to # of attributes in relation
0
1
2
3
4
5
6
2 4 8 16 32 64
number of attributes in relation
elap
sed
tim
e (m
icro
seco
nd
s)
NSM
PAX
20
implies halving R’s cardinality; therefore, we divided execution time by the cardinality of R. The graph
illustrates that, while PAX still suffers fewer misses than NSM, the execution time is dominated by factors
such as the buffer manager overhead associated with getting the next page in the relation after completing
the scan of the current page. Therefore, as the degree of the relation increases, the time PAX needs to pro-
cess a record converges to that of NSM.
7 Evaluation Using DSS Workloads
This section compares PAX and NSM when running a TPC-H decision-support workload on the sys-
tem described in Section 5.1. Decision-support applications are typically memory and computation inten-
sive [22]. The relations are not generally main-memory resident, and the queries execute projections,
selections, aggregates, and joins. The results show that PAX outperforms NSM on all TPC-H queries when
using this workload. At the end of this section we discuss the performance implications when performing
updates and random access queries.
7.1 Workload
. The workload consists of the TPC-H database and a variety of queries. The database and the TPC-H
queries were generated using the dbgen and qgen software distributed by the TPC. The database includes
attributes of type integer, floating point, date, fixed-length string, and variable-length string. We ran exper-
iments with bulk-loading, range selections, four TPC-H queries, and updates:
Bulk-loading. When populating tables from data files, NSM performs one memory-to-memory copy
per record inserted, and stores records sequentially. PAX inserts records by performing as many copy oper-
ations as the number of values in the tuple, as explained in Section 3.2. DSM creates and populates as
many relations as the number of attributes. We compare the elapsed time to store a full TPC-H dataset
when using each of the three schemes and for variable database sizes. Full recovery was turned on for all
three implementations.
Range selections. This query group consists of queries similar to those presented in Section 6.1, but
without the aggregate function. Instead, the projected attribute value(s) were written to an output relation.
To stress the system to the maximum possible extent, the range selections are on Lineitem, the largest table
in the database. Lineitem contains 16 attributes having a variety of types, including three variable-length
attributes. There are no indexes on any of the tables, as most implementations of TPC-H in commercial
systems include mostly clustered indices, which have a similar access behavior to sequential scan [2]. As
in Section 6, we varied the projectivity and the number of attributes involved in the predicate.

21
TPC-H queries. Four TPC-H queries, Q1, Q6, Q12, and Q14, were implemented on top of Shore. The
rest of this section describes the queries and their implementation, while the SQL code is presented in
Appendix B.
Query #1 is a range selection with one predicate (98% selectivity) and computes eight aggregates on six
attributes of the Lineitem table. The implementation pushes the predicates into Shore, computes
the aggregates on the qualifying records, groups and orders the results.
Query #6 is a range selection with four predicates on three attributes (2% selectivity), and computes a sum
aggregate on Lineitem. The implementation is similar to Query #1.
Query #12 is an equijoin between Orders and Lineitem with five additional predicates on six attributes,
and computes two conditional aggregates on Lineitem.
Query #14 is an equijoin between Part and Lineitem with two additional predicates, and computes the
product of two aggregates (one conditional) on Lineitem.
Queries 12 and 14 use the adaptive dynamic hash join operator described in Section 4. The experi-
ments presented in this section use a 128-MB buffer pool and a 64-MB hash join heap. With large TPC-H
datasets the queries involve I/O, because the resulting database sizes used are larger than the memory
available and the equijoins store hash table buckets on the disk.
Updates. We implemented update transactions on Lineitem’s attributes. Each transaction implements
the following statement:
update Rset ap=ap + bwhere aq > Lo and aq < Hi (2)
where ap, aq, and b are numeric attributes in Lineitem. We varied the number of updated fields, the number
of fields in the predicate, and the selectivity. For each query, we measured the transaction execution time
(i.e., including flushing the updated pages to the disk), and the actual main-memory update times, to deter-
mine the memory-hierarchy impact of the update algorithm.
7.2 Bulk-loading
Figure 11 compares the elapsed time required to load a 100-MB, 200-MB, and 500-MB TPC-H data-
base with each of the three storage organizations. DSM load times are much higher than those of NSM and
PAX, because DSM creates one relation per attribute and stores one NSM-like record per value, along with
the value’s record id. In Section 6.2 we demonstrated that, when executing queries that involve multiple
attributes, DSM never outperforms either of the other two schemes. Therefore, the rest of Section 7 will
focus on comparing NSM and PAX.

22
Although the two schemes copy the same total amount of data to the page, NSM merely appends
records. PAX, on the other hand, may need to perform additional page reorganizations if the relation con-
tains variable-length attributes. PAX allocates V-minipage space in a new page based on average attribute
sizes, and may occasionally over- or underestimate the expected minipage size. As a consequence, a record
that would fit in an NSM page does not fit into the corresponding PAX page unless the current minipage
boundaries are moved. In similar cases, PAX needs additional page reorganizations to move minipage
boundaries and accommodate new records.
The bulk-loading algorithm for PAX estimates ini-
tial minipage sizes on a page to be equal to the average
attribute value sizes on the previously populated page.
With the TPC-H database, this technique allows PAX
to use about 80% of the page without any reorganiza-
tion. Attempting to fill the rest of the 20% of each page
results in an average of 2.5 reorganizations per page,
half of which only occur in order to accommodate one
last record on the current page before allocating the
next one. Figure 11 shows this worst case scenario:
when using the exhaustive algorithm that attempts to
fill each page to 100% of capacity, PAX incurs a maxi-
mum of 10% performance penalty when compared to
NSM.
As an alternative, we implemented a smarter algo-
rithm that reorganizes minipages only if the free space on the page is more than 5%. As was expected, the
number of reorganizations per page dropped to half the number incurred by the exhaustive algorithm. A
more conservative algorithm with a 10% “reorganization-worthy” free-space threshold dropped the aver-
age number of reorganizations to 0.8 per page. Table 2 shows that, as the average number of reorganiza-
tions falls, the performance penalty of PAX versus NSM during bulk-loading becomes minimal (and is
independent of the database size), even though PAX accesses a higher number of under-full pages.
TABLE 2: Effect of the “reorganization worthy” threshold on PAX bulk-loading performance
“Reorganization-worthy” threshold Avg. # reorganizations / page Penalty wrt. NSM
0% (if record fits, always reorganize - exhaustive) 2.25 10.1%
5% (reorganize if page less than 95% full) 1.14 4.9%
10% (reorganize if page less than 90% full) 0.85 0.8%
FIGURE 11: Elapsed bulk-loading times. Elapsedtimes to load a 100-MB, 200-MB and 500-MB TPC-Hdataset using NSM, PAX, and DSM page layouts withexhaustive page usage (i.e., pages are 100% full).
Elapsed Load Times
3350
0
100
200
300
400
500
600
700
800
900
1000
100 MB 200 MB 500 MB
database size
tim
e (s
eco
nd
s)
NSMPAX
DSM

23
7.3 Queries
In Section 6.2 we explained why the performance
improvement provided by PAX is reduced as the pro-
jectivity increases and the query accesses a larger por-
tion of the record. As shown in Figure 8 in Section 6,
PAX performance is superior to NSM when running
range selections, especially when the query uses only a
fraction of the record. The leftmost bar group (labeled
‘RS’) in Figure 12 shows the average speedup7
obtained by a variety of range selection queries on
Lineitem (described in Section 7.1). When using a 100-
MB, a 200-MB, and a 500-MB dataset the speedup is
14%, 13%, and 10%, respectively.
Figure 12 also depicts PAX/NSM speedups when
running four TPC-H queries against a 100, 200, and
500-MB TPC-H database. PAX outperforms NSM for
all these experiments. The speedups obtained, however, are not constant across the experiments due to a
combination of differing amounts of I/O and interactions between the hardware and the algorithms being
used.
Queries 1 and 6 are essentially range queries that access roughly one third of each record in Lineitem
and calculate aggregates, as shown in Appendix B. The difference between these TPC-H queries and the
plain range selections (RS) discussed in the previous paragraph is that TPC-H queries exploit further the
spatial locality, because they access projected data multiple times in order to calculate aggregate values.
Therefore, PAX speedup is higher due to the increased cache utilization and varies from 15% (in the 500-
MB database) to 42% (in the smaller databases).
Queries 12 and 14 are more complicated and involve two joined tables, as well as range predicates.
The join is performed by the adaptive dynamic hash join algorithm, as was explained in Section 4.
Although both the NSM and the PAX implementation of the hash-join algorithm only copy the useful por-
tion of the records, PAX still outperforms NSM because (a) with PAX, the useful attribute values are natu-
rally isolated, and (b) the PAX buckets are stored on disk using the PAX format, maintaining the locality
advantage as they are accessed for the second phase of the join. When running query 12, PAX speeds exe-
(7) Definition of speedup [18]:
FIGURE 12: PAX/NSM speedup. Speedup is shownfor a 100-MB, 200-MB, and 500-MB TPC-H datasetwhen running range selections (RS) and four TPC-Hqueries (Q1, Q6, Q12, and Q14).
PAX/NSM speedup (PII/NT)
0%
5%
10%
15%
20%
25%
30%
35%
40%
45%
50%
RS Q1 Q6 Q12 Q14query
PA
X/N
SM
sp
eed
up
(%
)
100 MB200 MB500 MB
SpeedupExecutionTime NSM( )ExecutionTime PAX( )---------------------------------------------------------- 1– 100×=

24
cution up by 37-48%. Since query 14 accesses fewer attributes and requires less computation than query
12, PAX outperforms NSM by only 6-32% when running this query.
7.4 Updates
The update algorithms implemented for NSM and
PAX (discussed in Section 4.2) are based on the same
philosophy: update attribute values in place, and per-
form reorganizations as needed. The difference lies in
updating variable-length attributes. When replacing a
variable-length attribute value with a larger one, PAX
only needs to shift half the data of the V-minipage on
average to accomodate the new requirements. NSM, on
average, must move half the data of the page (because it
moves records that include “innocent” non-referenced
attributes). Less frequently, variable-length updates will
result in a page reorganization for both schemes. Over-
all, massive updates on variable-length fields are rare;
TPC-C’s only update query is on the client credit history
in the Payment transaction, and only affects one record (plus, the history field has a maximum length of
500 bytes).
When executing updates PAX is always faster than NSM, providing a speedup of 10-16%. The
speedup is a function of the fraction of the record accessed as well as the selectivity. As discussed in Sec-
tion 6.2, the execution times of NSM and PAX converge as we increase the projectivity. Similarly, the
PAX/NSM speedup decreases as we increase the number of updated attributes. Figure 13 illustrates the
speedup as a function of the number of updated attributes, when running updates on fixed-length attributes
in a 100-MB database for various selectivities. For low selectivities, PAX provides a speedup of 10-16%,
and its execution is dominated by read requests. As the selectivity increases, the probability that the
updated attributes are in the cache is higher. However, increasing the selectivity also increases the proba-
bility that every data request will cause replacement of “dirty” cache blocks, which must be written back to
memory. For this reason, as the selectivity increases from 20%-100%, the speedup is dominated by the
write-back requests and becomes oblivious to the change in the number of updated attributes.
FIGURE 13: PAX/NSM speedup on updates.Speedups are shown as a function of the number ofupdated attributes, for various selectivities and a100-MB database.
Updates with Various Selectivities
0%
2%
4%
6%
8%
10%
12%
14%
16%
18%
1 2 3 4 5 6 7
number of updated attributesP
AX
/NS
M s
pee
du
p(%
)
1%10%20%50%100%

25
7.5 Random Access using Point and Low-Selectivity Queries
All of the results presented in this section were obtained using sequential scans and joins with no indi-
ces on the participating relations. PAX delivers superior performance in these queries, because the sequen-
tial access patterns take advantage of the spatial locality in the minipages. In real applications, however,
queries often access a single record or a very small number of records in the relation using a non-clustered
index. To answer such queries the query engine traverses the appropriate index nodes to find the qualifying
record id (page and location within page). Then, it fetches the appropriate page from the disk, if it is not
already in memory, and returns the projected attributes’ values to the application. When using NSM, the
algorithm looks in the record to find the projected values, whereas when using PAX it visits exactly as
many minipages as the number of the projected attributes. Consequently, one would expect that, when the
entire record is projected, NSM should outperform PAX. Indeed, in this case PAX naturally incurs as many
cache misses as the attributes in the record, whereas NSM exhibits maximum spatial locality and only
incurs as many misses as needed.
Our experiments, however, proved that PAX performs similarly to NSM when executing single-record
and low-selectivity queries. We measured the average time required for PAX and NSM to answer point
queries of varying projectivity, and found the execution times to be the same when using either scheme.
Indeed, the higher the number of attributes participating in the query, the more cache misses PAX suffers;
however, the delay incurred is insignificant when compared to the time needed to traverse the index, pin
the page in the buffer manager, read the page header, lock the record, and copy the data. In other words, the
performance bottleneck when randomly accessing records shifts towards cache misses on instructions and
private data, such as buffer pool data structures, rather than the actual record data. As the number of
records accessed per page decreases, the bottleneck shifts to buffer pool operations, causing PAX’s over-
head to disappear.
8 Impact of Memory System Design on Data Placement Performance
So far we have demonstrated the importance of choosing the right data placement scheme to achieve
high cache performance, and the superiority of PAX when executing queries on deep memory hierarchies.
Processor and memory system design, however, varies wildly across vendors, and it would be interesting
to discover whether the results depend on the architectural characteristics. This section evaluates the two
competing data placement schemes on top of three different hardware platforms, and discusses the insights
drawn from this comparison.

26
8.1 Experimental Setup and Methodology
As in the previous two experimental stages, we use Shore in order to compare database workload
behavior across three different computers. For comparability of results, all experiments in this Section run
on top of the Unix operating system. The architecture design philosophies used are:
• Intel P6: The Dell system we used to conduct the experiments features a Pentium II Xeon [19] proces-
sor, running Linux 2.2. This is an out-of-order processor with a 2-level cache hierarchy. In the rest of
this section, we refer to this processor as “the Xeon.” To access the counters from Linux, we used the
Performance Data Standard and API (PAPI) [24], a public-domain library that offers access to counters
via a common programming interface.
• Sun UltraSparc: The system features the UltraSparc-IIi (US-IIi) [34] processor running Solaris 2.7.
This is an in-order processor with a 2-level cache hierarchy. In the rest of this section, we refer to this
processor as “the UltraSparc.” To access the counters, we used a slightly modified version of the inter-
procedural instrumentation library written by Glenn Ammons and used in previous work [4].
• Alpha 21164: Although it is an in-order machine, the A21164 [11] is the only machine in this set that
features a three-level cache hierarchy. The system runs OSF1, a 64-bit Unix-based operating system.
In the rest of this section, we refer to this processor as “the Alpha.” To access the counters, we used a
sampling tool from Compaq, called “DIGITAL Continuous Profiling Infrastructure” (DCPI) [5].
8.2 Results
Use of PAX instead of NSM improves the spatial data locality during sequential scan, especially when
the query accesses a fraction of the record in order to evaluate a predicate. When accessing a value, we
bring into the cache a block containing the neighboring values as well; therefore, the larger the cache block
size, the less often an algorithm that uses PAX will incur cache misses. In other words, the data miss rate
improvement from using PAX (defined as the number of data misses divided by the number of data
accesses) is expected to increase as a function of the block size.
The systems compared here have different cache configurations, and offer an excellent testbed for
experimentation. In particular, the Xeon’s caches use 32-byte blocks, whereas the Alpha and the UltraS-
parc use 64-byte blocks in their largest caches. Therefore, we expect that PAX improvement on L2 (L3)
data miss rates on the UltraSparc (Alpha) will be higher than on the Xeon. As shown in the leftmost graph

27
of Figure 14, in all sequential scan queries cases the above conjecture is true. When running the join que-
ries (Q12 and Q14), however, we observed variations. For example, when using NSM, Q12 exhibits an
unusually low miss rate for the Xeon (9% versus 88% for Q1 and Q6 and 45% for Q14) and that is almost
completely eliminated when using PAX. The positive effect of the 64-byte block is lower when running
Q14 on the UltraSparc because its largest cache is only 512KB (vs. 4MB in the Alpha). Although the
Xeon’s largest cache is also 512KB, its cache blocks are only 32 bytes and potentially more favorable for
Q14’s non-sequential access patterns. A comparison of the memory hierarchies and the impact of the dif-
ferent cache architectures on performance is located in a detailed study [3].
The rightmost graph in Figure 14 shows the relative improvement in elapsed execution time when
using PAX across the four platforms. The improvement is low (3-15%) for the range selection that per-
forms sequential scan and hardly uses the data read from the relation. Q1 and Q6 make heavier usage of the
data extracted during the sequential scan in order to compute aggregates, group, and sort. Therefore, PAX
improvements are higher (8-40%) for these queries as well as for the more complex join queries. The
results corroborate the conclusions from the previous experimentation stages that (a) PAX is a promising
cache-conscious data placement technique that minimizes data stall time, and (b) reducing data-related
stalls significantly improves query execution time.
FIGURE 14: PAX and NSM on three platforms. PAX improvement over NSM on L2 data miss rate (left) andelapsed execution time (right) when running the range selections (RS), the TPC-H queries on three platforms.
PAX savings on L2 data miss rates
0%
20%
40%
60%
80%
100%
RS Q1 Q6 Q12 Q14query
L2D
mis
s ra
te im
pro
v. (
%)
US-IIi PII Xeon A21164
PAX / NSM speedup
0%
5%
10%
15%
20%
25%
30%
35%
40%
45%
RS Q1 Q6 Q12 Q14query
spee
du
p (
%)
US-IIi PII Xeon A21164

28
9 Summary
The performance of today’s decision-support systems is strongly affected by the increasing processor-
memory speed gap. Previous research has shown that database systems do not exploit the capabilities of
today’s microprocessors to the extent that other workloads do [20]. A major performance bottleneck for
database workloads is the memory hierarchy, and especially data accesses on the second-level cache [1].
The data cache performance is directly related to how the contents of the disk pages map to cache memo-
ries, i.e., to the disk page data layout. The traditional N-ary storage model (NSM) stores records contigu-
ously on slotted disk pages. However, NSM's poor spatial locality has a negative impact on L2 data cache
performance. Alternatively, the decomposition storage model (DSM) partitions relations vertically, creat-
ing one sub-relation per attribute. DSM exhibits better cache locality, but incurs a high record reconstruc-
tion cost. For this reason, most commercial DBMSs use NSM to store relations on the disk.
This paper introduces PAX (Partition Attributes Across), a new layout for data records on pages that
combines the advantages of NSM and DSM. For a given relation, PAX stores the same data on each page
as NSM. The difference is that within each page, PAX groups values for the same attribute together in
minipages, combining inter-record spatial locality and high data cache performance with minimal record
reconstruction cost at no extra storage overhead.
Using PAX to arrange data on disk pages is beneficial when compared to both NSM and DSM:
• When compared to NSM, PAX incurs 50-75% less L2 cache data misses and stall time, while range
selection queries and updates on main-memory tables execute in 17-25% less elapsed time. When run-
ning TPC-H queries that perform calculations on the data retrieved and require I/O, PAX incurs a 11-
48% speedup over NSM.
• When compared to DSM, PAX cache performance is better and queries execute consistently faster
because PAX does not require a join to reconstruct the records. As a consequence, the execution time
of PAX remains relatively stable as query parameters vary, whereas the execution time of DSM
increases linearly to these parameters.
PAX incurs no storage penalty when compared with either NSM or DSM. PAX reorganizes the records
within each page, therefore can be used orthogonally to other storage schemes (such as NSM or affinity-
based vertical partitioning) and transparently to the rest of the DBMS. Finally, we expect that compression
algorithms will (a) operate more efficiently on vertically partitioned data, because of type uniformity and
(b) achieve higher compression rates on a per-page basis, because the value domain is smaller. PAX com-
bines these two characteristics, and favors page-level compression schemes.

29
References
[1] A. Ailamaki, D. J. DeWitt, M. D. Hill, and D. A. Wood. DBMSs on a modern processor: Where doestime go?. In proceedings of the 25th International Conference on Very Large Data Bases (VLDB),pp. 54-65, Edinburgh, UK, September 1999.
[2] A. Ailamaki and D. Slutz. Processor Performance of Selection Queries, Microsoft Research Techni-cal Report MSR-TR-99-94, August 1999.
[3] A. Ailamaki. Architecture-Conscious Database Systems. Ph.D. thesis, University of Wisconsin-Mad-ison, December 2000.
[4] Glenn Ammons. run-pic software for access to UltraSparc counters. Computer Sciences Depart-ment, University of Wisconsin-Madison ([email protected]). Personal communication, Septem-ber 2000.
[5] J. M. Anderson, L. M. Berc, J. Dean, S. Ghemawat, M. R. Henzinger, S. A. Leung, R. L. Sites, M. T.Vandevoorde, C. A. Waldspurger, and W. E. Weihl. Continuous Profiling: Where Have All theCycles Gone? In Proceedings of the 16th ACM Symposium on Operating Systems Principles (SOSP),pp. 1-14, October 1997.
[6] P. Boncz, S. Manegold, and M. Kersten. Database Architecture Optimized for the New Bottleneck:Memory Access. In proceedings of the 25th International Conference on Very Large Data Bases(VLDB), pp. 266-277, Edinburgh, UK, September 1999.
[7] T. Brinkhoff, H.-P. Kriegel, R. Schneider, and B. Seeger. Multi-Step Processing of Spatial Joins. Inproceedings of the ACM SIGMOD International Conference on Management of Data, pp. 197--208,Minneapolis, MN, May 1994.
[8] B. Calder, C. Krintz, S. John, and T. Austin. Cache-Conscious Data-Placement. In Proceedings ofthe 8th Conference on Architectural Support for Programming Languages and Operating Systems(ASPLOS VIII), pages 139-149, October 1998.
[9] M. Carey, D. J. DeWitt, M. Franklin, N. Hall, M. McAuliffe, J. Naughton, D. Schuh, M. Solomon, C.Tan, O. Tsatalos, S. White, and M. Zwilling, Shoring Up Persistent Applications. In proceedings ofth_e ACM SIGMOD Conference on Management of Data, Minneapolis, MN, May 1994.
[10] T. M. Chilimbi, J. R. Larus and M. D. Hill. Making Pointer-Based Data Structures Cache Conscious.IEEE Computer, Vol. 33, Num. 12, pp. 67-74, December 2000.
[11] Compaq Corporation. 21164 Alpha Microprocessor Reference Manual. Online Compaq referencelibrary at http://www.support.compaq.com/alpha-tools/documentation/current/chip-docs.html. Doc.No. EC-QP99C-TE, December 1998.
[12] G. P. Copeland and S. F. Khoshafian. A Decomposition Storage Model. In proceedings of the ACMSIGMOD International Conference on Management of Data, pp. 268-279, May 1985.
[13] D. W. Cornell and P. S. Yu. An Effective Approach to Vertical Partitioning for Physical Design ofRelational Databases. In IEEE Transactions on Software engineering, 16(2), February 1990.
[14] J. Goldstein, R. Ramakrishnan, and U. Shaft. Compressing Relations and Indexes. In proceedings ofIEEE International Conference on Data Engineering, 1998.
[15] G. Graefe. Iterators, Schedulers, and Distributed-memory Parallelism. In software, Practice andExperience, 26(4), pp. 427-452, April 1996.
[16] Jim Gray. The benchmark handbook for transaction-processing systems. Morgan-KaufmannPublishers, 2nd edition, 1993.
[17] Bill Gray, Compaq Corporation. Personal Communication, September-October 2000.[18] J. L. Hennessy and D. A. Patterson. Computer Architecture: A Quantitative Approach. Morgan
Kaufmann Publishers, 2nd edition, 1996.[19] Intel Corporation. Pentium® II processor developer's manual. Intel Corporation, Order number
243502-001, October 1997.

30
[20] K. Keeton, D. A. Patterson, Y. Q. He, R. C. Raphael, and W. E. Baker. Performance characterizationof a quad Pentium pro SMP using OLTP workloads. In Proceedings of the 25th International Sympo-sium on Computer Architecture, Barcelona, Spain, June 1998.
[21] Michael Koster, Sun Microsystems. Personal Communication, September-October 2000.[22] Bruce Lindsay, IBM Almaden Research Center. Personal Communication, February / July 2000.[23] J. L. Lo, L. A. Barroso, S. J. Eggers, K. Gharachorloo, H. M. Levy, and S. S. Parekh. An analysis of
database workload performance on simultaneous multithreaded processors. In Proceedings of the25th International Symposium on Computer Architecture, June 1998.
[24] P. J. Mucci, S. Browne, C. Deane, and G. Ho. PAPI: A Portable Interface to Hardware PerformanceCounters. In Proceedings of the Department of Defense HPCMP Users Group Conference,Monterey, CA, June 7-10, 1999.
[25] M. Nakayama, M. Kitsuregawa, and M. Takagi: Hash-Partitioned Join Method Using DynamicDestaging Strategy. In Proceedings of the 14th VLDB International Conference, September 1988.
[26] S. Navathe, S. Ceri, G. Wiederhold, and J. Dou. Vertical partitioning algorithms for database design.ACM Transactions on Database Systems, 9(4), pp/ 680-710, December 1984.
[27] P. O’Neil and D. Quass. Improved Query Performance With Variant Indexes. In proceedings of theACM SIGMOD International Conference on Management of Data, Tucson, Arizona, May 1997.
[28] J. M. Patel and D. J. DeWitt. Partition Based Spatial-Merge Join. In proceedings of the ACMSIGMOD International Conference on Management of Data, pp. 259-270, Montreal, Canada, June1996.
[29] R. Ramakrishnan and J. Gehrke. Database Management Systems. WCB/McGraw-Hill, 2nd edition,2000.
[30] P. G. Selinger, M. M. Astrahan, D. D. Chamberlain, R.A. Lorie, and T. G. Price. Access Path Selec-tion In A Relational Database Management System. In Proceedings of the ACM SIGMOD Confer-ence on Management of Data, 1979.
[31] A. Shatdal, C. Kant, and J. Naughton. Cache Conscious Algorithms for Relational Query Processing.In proceedings of the 20th International Conference on Very Large Data Bases (VLDB), pp. 510-512, September 1994.
[32] R. Soukup and K. Delaney. Inside SQL Server 7.0. Microsoft Press, 1999.[33] Seckin Unlu and Andy Glew, Intel Corporation. Personal Communication, September-October 2000.[34] Sun Microelectronics. The UltraSparc-IIi Processor. Technology white paper, Online Sun reference
library at http://www.sun.com/microelectronics/whitepapers/UltraSPARC-IIi. Document numberWPR-0029-01, January 1998.
[35] http://www.ncr.com/sorters/software/teradata_or.asp[36] http://www.sybase.com/products/archivedproducts/sybaseiq
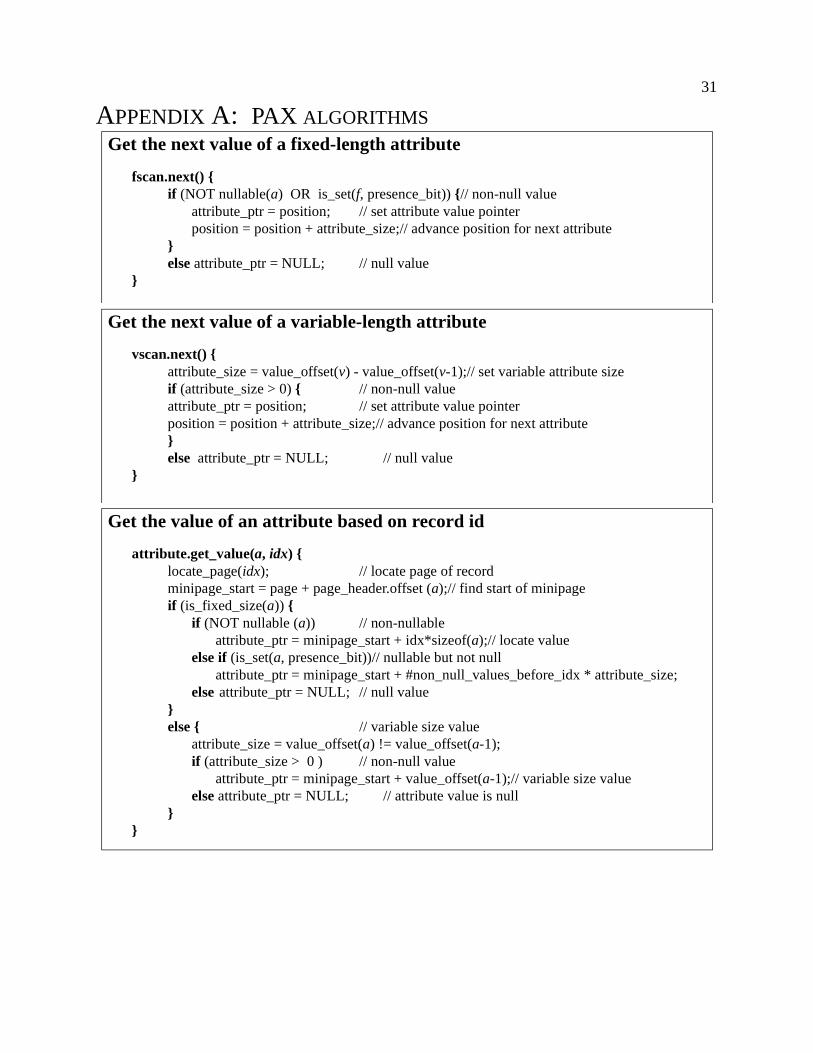
31
APPENDIX A: PAX ALGORITHMSGet the next value of a fixed-length attribute
fscan.next() {if (NOT nullable(a) OR is_set(f, presence_bit)) {// non-null value
attribute_ptr = position; // set attribute value pointerposition = position + attribute_size;// advance position for next attribute
}else attribute_ptr = NULL; // null value
}
Get the next value of a variable-length attribute
vscan.next() {attribute_size = value_offset(v) - value_offset(v-1);// set variable attribute sizeif (attribute_size > 0) { // non-null valueattribute_ptr = position; // set attribute value pointerposition = position + attribute_size;// advance position for next attribute}else attribute_ptr = NULL; // null value
}
Get the value of an attribute based on record id
attribute.get_value(a, idx) {locate_page(idx); // locate page of recordminipage_start = page + page_header.offset (a);// find start of minipageif (is_fixed_size(a)) {
if (NOT nullable (a)) // non-nullableattribute_ptr = minipage_start + idx*sizeof(a);// locate value
else if (is_set(a, presence_bit))// nullable but not nullattribute_ptr = minipage_start + #non_null_values_before_idx * attribute_size;
else attribute_ptr = NULL; // null value}else { // variable size value
attribute_size = value_offset(a) != value_offset(a-1);if (attribute_size > 0 ) // non-null value
attribute_ptr = minipage_start + value_offset(a-1);// variable size valueelse attribute_ptr = NULL; // attribute value is null
}}

32
APPENDIX B: SQL CODE OF TPC-H QUERIES
TPC-H Query #1:
select l_returnflag, l_linestatus, sum(l_quantity) as sum_qty, sum(l_extendedprice) as sum_base_price, sum(l_extendedprice * (1 - l_discount)) as sum_disc_price,sum(l_extendedprice * (1 - l_discount) * (1 + l_tax)) as sum_charge,avg(l_quantity) as avg_qty, avg(l_extendedprice) as avg_price,avg(l_discount) as avg_disc, count(*) as count_order
from lineitemwhere l_shipdate <= “1998-12-01” - 116 daygroup by l_returnflag, l_linestatusorder by l_returnflag, l_linestatus
TPC-H Query #6:
select sum(l_extendedprice * l_discount) as revenuefrom lineitemwhere l_shipdate >= “1997-01-01”
and l_shipdate < “1997-01-01” + 1 yearand l_discount between 0.05 - 0.01 and 0.05 + 0.01and l_quantity < 24
TPC-H Query #12:
select l_shipmode,sum (case when o_orderpriority = “1-URGENT” or o_orderpriority = “2-HIGH”
then 1 else 0 end) as high_line_count,sum (case when o_orderpriority <> “1-URGENT” and o_orderpriority <> “2-HIGH”
then 1 else 0 end) as low_line_countfrom orders, lineitemwhere o_orderkey = l_orderkey
and l_shipmode in (“SHIP”, “RAIL”)and l_commitdate < l_receiptdateand l_shipdate < l_commitdateand l_receiptdate >= “1994-01-01” and l_receiptdate < “1994-01-01” + 1 year
group by l_shipmodeorder by l_shipmode
TPC-H Query #14:
select 100.00 * sum (case when p_type like “PROMO%”then l_extendedprice * (1 - l_discount)else 0 end) / sum(l_extendedprice * (1 - l_discount))
as promo_revenuefrom lineitem, partwhere l_partkey = p_partkey
and l_shipdate >= “1997-09-01”and l_shipdate < “1997-09-01” + 1 month


![Data Page Layouts for Relational Databases on Deep Memory ...the performance of relational query processing [31]. The dominant data placement model in relational database systems is](https://img.pdfslide.net/doc/110x75/5e8e72131a326c73e614772a/data-page-layouts-for-relational-databases-on-deep-memory-the-performance-of.jpg)