Embed Size (px)
DESCRIPTION
Data Presentation. Above State & Region. Above State & Region. Above State. Updated pg 1 Handout. Met Target. Pg 5. Met Target. Pg 6. Handout. Reference pg 8. Pg 15. Pg 16. Pg 17. 10.4% Discrepancy. Pg 18 & 22. 10.7% Discrepancy. Pg 19 & 22. 4.8% Discrepancy. Pg 20 & 23. - PowerPoint PPT Presentation
Citation preview

Data Presentation
58.7
80.2
57.1
76.0
49.7
77.9
51.0
82.5
55.3
83.2
52.6
83.6
48.2
78.5
51.1
79.5
49.3
79.7
0
10
20
30
40
50
60
70
80
90
100
Black White Black White Black White
Grade 3 Grade 5 Grade 8
Pe
rce
nt
Pro
fic
ien
t in
Re
ad
ing
& M
ath
Achievement of Students in Cleveland County Schools2011-2012
CCS
Region
NC
Updated pg 1Handout
Above State & Region
Above State & Region
Above State
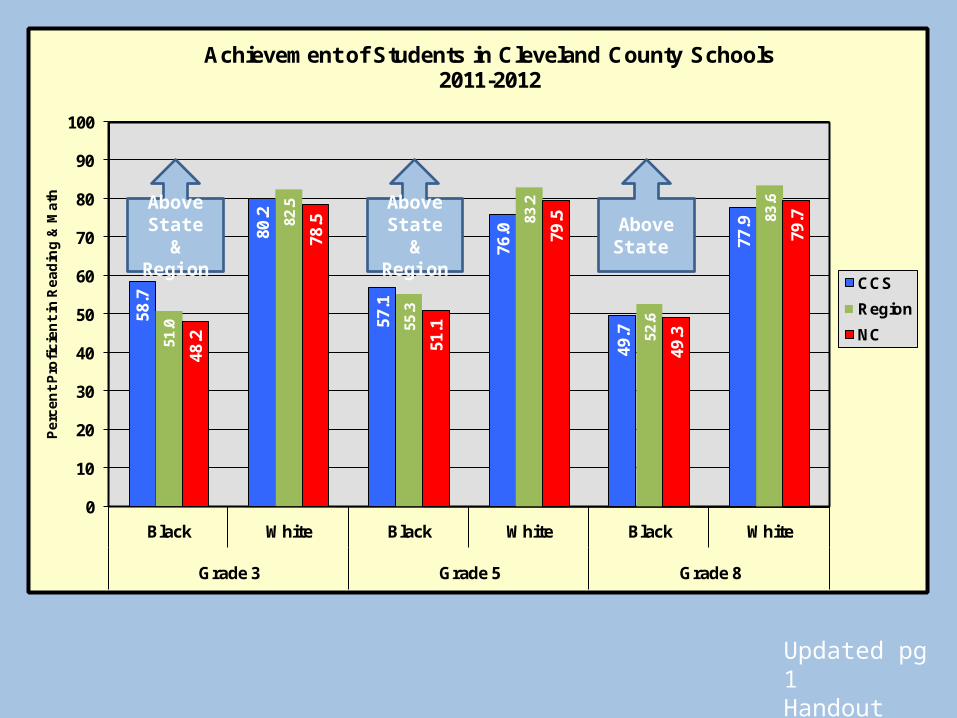
TotalAmin. Indian
Asian Black Hispanic2 or
MoreWhite EDS LEP SWD
Performance 74.8 72.7 87.0 62.9 62.8 72.6 80.2 67.0 40.3 41.8
11-12 Target 73.0 61.8 80.8 57.8 61.1 75.5 83.2 61.4 42.4 44.5
0
10
20
30
40
50
60
70
80
90
100
Pe
rce
nt P
rofi
cie
nt
Cleveland County Schools Reading Performance 2011-2012
NC Annual Measurable Objectives (AMOs) 2012 Grades 3-8
7320 10221344562473730333318676911No. of Students
Pg 5
Met Target
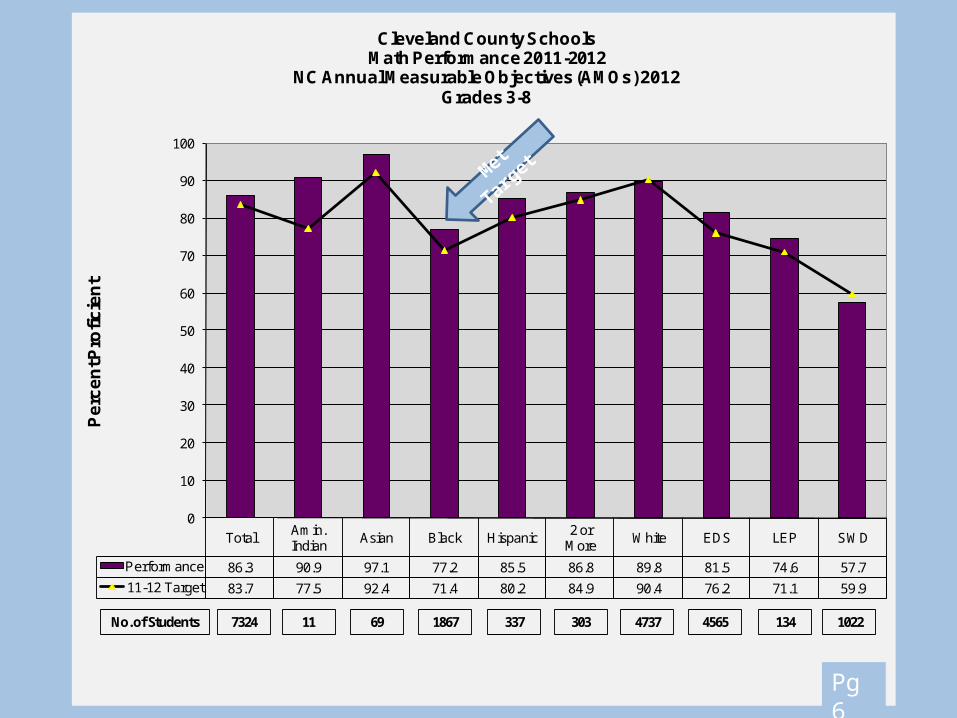
TotalAmin. Indian
Asian Black Hispanic2 or
MoreWhite EDS LEP SWD
Performance 86.3 90.9 97.1 77.2 85.5 86.8 89.8 81.5 74.6 57.7
11-12 Target 83.7 77.5 92.4 71.4 80.2 84.9 90.4 76.2 71.1 59.9
0
10
20
30
40
50
60
70
80
90
100
Pe
rce
nt P
rofi
cie
nt
Cleveland County Schools Math Performance 2011-2012
NC Annual Measurable Objectives (AMOs) 2012 Grades 3-8
7324 10221344565473730333718676911No. of Students
Pg 6
Met Target
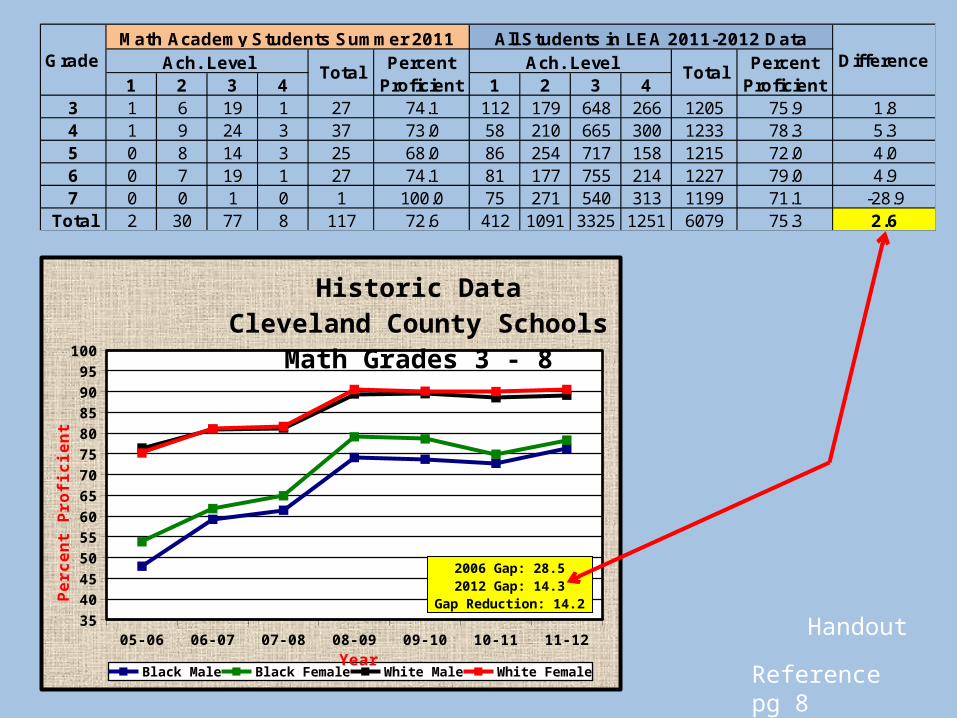
1 2 3 4 1 2 3 43 1 6 19 1 27 74.1 112 179 648 266 1205 75.9 1.84 1 9 24 3 37 73.0 58 210 665 300 1233 78.3 5.35 0 8 14 3 25 68.0 86 254 717 158 1215 72.0 4.06 0 7 19 1 27 74.1 81 177 755 214 1227 79.0 4.97 0 0 1 0 1 100.0 75 271 540 313 1199 71.1 -28.9
Total 2 30 77 8 117 72.6 412 1091 3325 1251 6079 75.3 2.6
Grade Ach. Level DifferenceMath Academy Students Summer 2011 All Students in LEA 2011-2012 Data
Percent Proficient
Percent Proficient
Total TotalAch. Level
Handout
Reference pg 8
05-06 06-07 07-08 08-09 09-10 10-11 11-1235
40
45
50
55
60
65
70
75
80
85
90
95
100
Historic DataCleveland County Schools
Math Grades 3 - 8
Black Male Black Female White Male White FemaleYear
Pe
rce
nt
Pro
fic
ien
t
2006 Gap: 28.52012 Gap: 14.3
Gap Reduction: 14.2
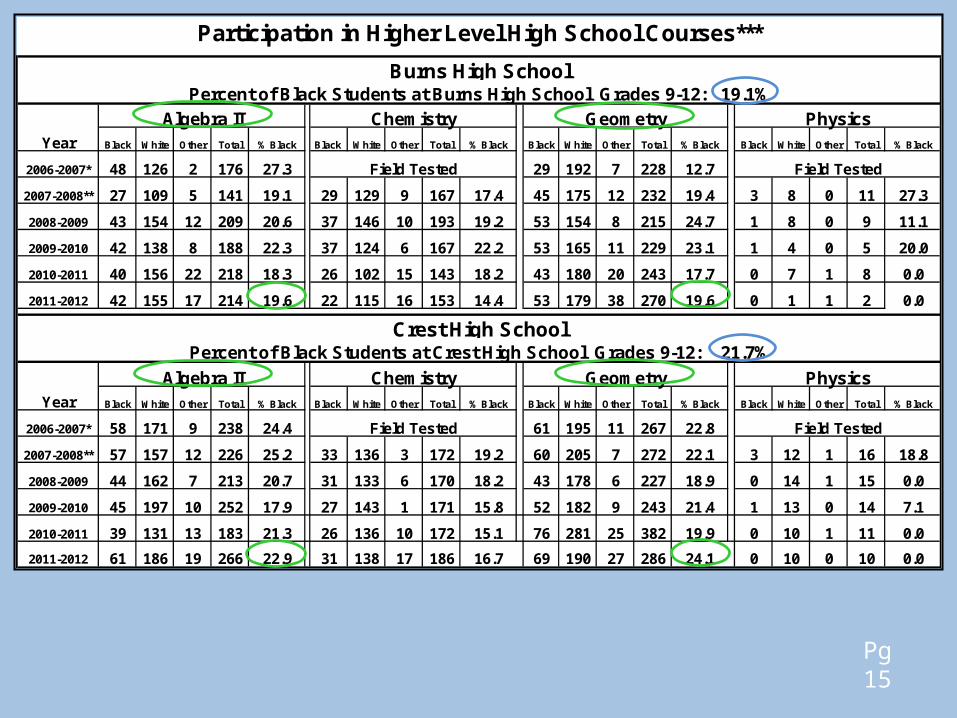
Participation in Higher Level High School Courses***
Burns High School
Algebra II Chemistry Geometry Physics
Black White Other Total % Black Black White Other Total % Black Black White Other Total % Black Black White Other Total % Black
2006-2007* 48 126 2 176 27.3 29 192 7 228 12.7
2007-2008** 27 109 5 141 19.1 29 129 9 167 17.4 45 175 12 232 19.4 3 8 0 11 27.3
2008-2009 43 154 12 209 20.6 37 146 10 193 19.2 53 154 8 215 24.7 1 8 0 9 11.1
2009-2010 42 138 8 188 22.3 37 124 6 167 22.2 53 165 11 229 23.1 1 4 0 5 20.0
2010-2011 40 156 22 218 18.3 26 102 15 143 18.2 43 180 20 243 17.7 0 7 1 8 0.0
2011-2012 42 155 17 214 19.6 22 115 16 153 14.4 53 179 38 270 19.6 0 1 1 2 0.0
Crest High School
Algebra II Chemistry Geometry Physics
Black White Other Total % Black Black White Other Total % Black Black White Other Total % Black Black White Other Total % Black
2006-2007* 58 171 9 238 24.4 61 195 11 267 22.8
2007-2008** 57 157 12 226 25.2 33 136 3 172 19.2 60 205 7 272 22.1 3 12 1 16 18.8
2008-2009 44 162 7 213 20.7 31 133 6 170 18.2 43 178 6 227 18.9 0 14 1 15 0.0
2009-2010 45 197 10 252 17.9 27 143 1 171 15.8 52 182 9 243 21.4 1 13 0 14 7.1
2010-2011 39 131 13 183 21.3 26 136 10 172 15.1 76 281 25 382 19.9 0 10 1 11 0.0
2011-2012 61 186 19 266 22.9 31 138 17 186 16.7 69 190 27 286 24.1 0 10 0 10 0.0
Field Tested
Field TestedField Tested
Percent of Black Students at Burns High School Grades 9-12: 19.1%
Year
Percent of Black Students at Crest High School Grades 9-12: 21.7%
Year
Field Tested
Pg 15
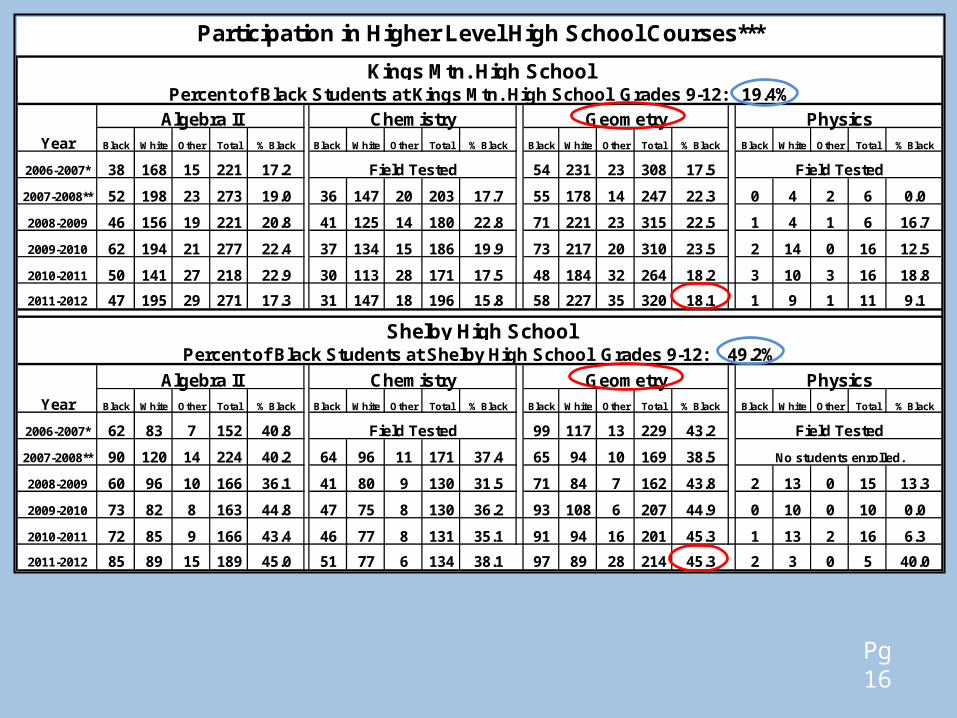
Participation in Higher Level High School Courses***
Kings Mtn. High School
Algebra II Chemistry Geometry PhysicsBlack White Other Total % Black Black White Other Total % Black Black White Other Total % Black Black White Other Total % Black
2006-2007* 38 168 15 221 17.2 54 231 23 308 17.5
2007-2008** 52 198 23 273 19.0 36 147 20 203 17.7 55 178 14 247 22.3 0 4 2 6 0.0
2008-2009 46 156 19 221 20.8 41 125 14 180 22.8 71 221 23 315 22.5 1 4 1 6 16.7
2009-2010 62 194 21 277 22.4 37 134 15 186 19.9 73 217 20 310 23.5 2 14 0 16 12.5
2010-2011 50 141 27 218 22.9 30 113 28 171 17.5 48 184 32 264 18.2 3 10 3 16 18.8
2011-2012 47 195 29 271 17.3 31 147 18 196 15.8 58 227 35 320 18.1 1 9 1 11 9.1
Shelby High School
Algebra II Chemistry Geometry PhysicsBlack White Other Total % Black Black White Other Total % Black Black White Other Total % Black Black White Other Total % Black
2006-2007* 62 83 7 152 40.8 99 117 13 229 43.2
2007-2008** 90 120 14 224 40.2 64 96 11 171 37.4 65 94 10 169 38.5
2008-2009 60 96 10 166 36.1 41 80 9 130 31.5 71 84 7 162 43.8 2 13 0 15 13.3
2009-2010 73 82 8 163 44.8 47 75 8 130 36.2 93 108 6 207 44.9 0 10 0 10 0.0
2010-2011 72 85 9 166 43.4 46 77 8 131 35.1 91 94 16 201 45.3 1 13 2 16 6.3
2011-2012 85 89 15 189 45.0 51 77 6 134 38.1 97 89 28 214 45.3 2 3 0 5 40.0
Field Tested
No students enrolled.
Field Tested
Field TestedField Tested
Percent of Black Students at Kings Mtn. High School Grades 9-12: 19.4%
Year
Percent of Black Students at Shelby High School Grades 9-12: 49.2%
Year
Pg 16
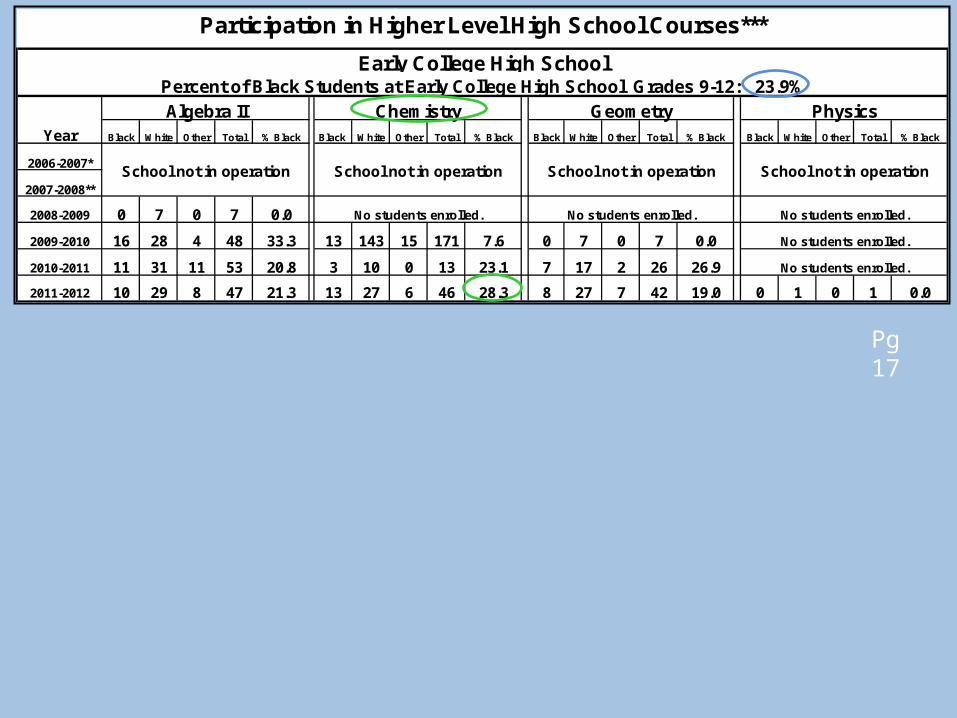
Participation in Higher Level High School Courses***
Early College High School
Algebra II Chemistry Geometry PhysicsBlack White Other Total % Black Black White Other Total % Black Black White Other Total % Black Black White Other Total % Black
2006-2007*
2007-2008**
2008-2009 0 7 0 7 0.0
2009-2010 16 28 4 48 33.3 13 143 15 171 7.6 0 7 0 7 0.0
2010-2011 11 31 11 53 20.8 3 10 0 13 23.1 7 17 2 26 26.9
2011-2012 10 29 8 47 21.3 13 27 6 46 28.3 8 27 7 42 19.0 0 1 0 1 0.0
No students enrolled.No students enrolled.No students enrolled.
School not in operationSchool not in operationSchool not in operation
Percent of Black Students at Early College High School Grades 9-12: 23.9%
Year
No students enrolled.
No students enrolled.
School not in operation
Pg 17
2007-08 2008-09 2009-10 2010-11 2011-12
0
5
10
15
20
25
30
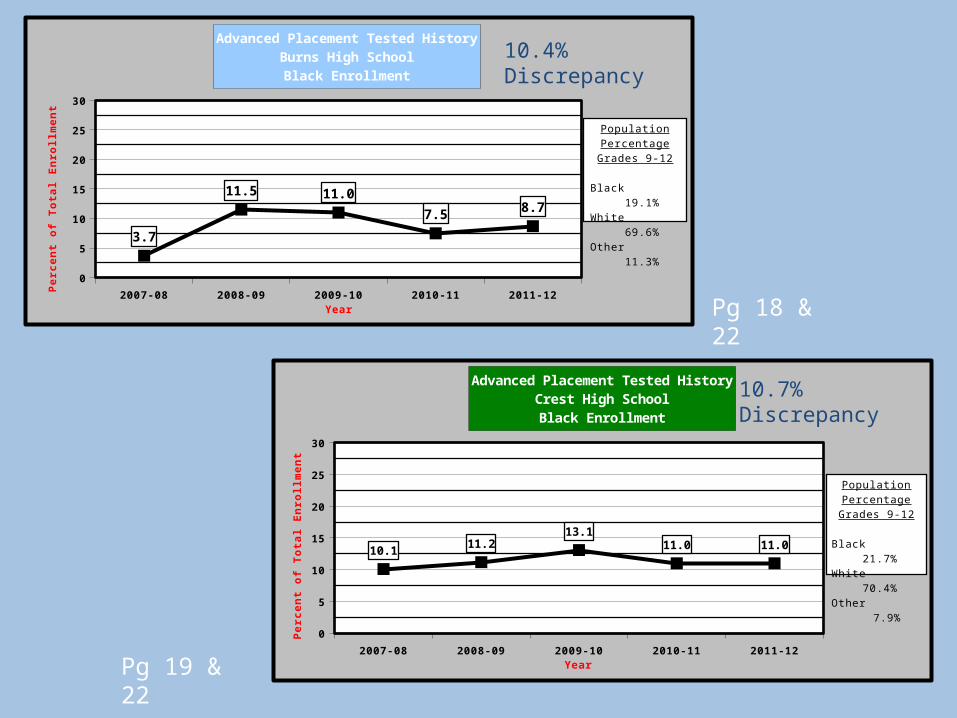
3.7
11.5 11.0
7.5 8.7
Advanced Placement Tested HistoryBurns High SchoolBlack Enrollment
Year
Pe
rce
nt
of
To
tal
En
roll
me
nt
Population Percent-age
Grades 9-12
Black 19.1%White 69.6%Other 11.3%
2007-08 2008-09 2009-10 2010-11 2011-12
0
5
10
15
20
25
30
10.111.2
13.111.0 11.0
Advanced Placement Tested HistoryCrest High SchoolBlack Enrollment
Year
Pe
rce
nt
of
To
tal
En
roll
me
nt
Population Per-centage
Grades 9-12
Black 21.7%White 70.4%Other 7.9%
Pg 18 & 22
Pg 19 & 22
10.4% Discrepancy
10.7% Discrepancy
2007-08 2008-09 2009-10 2010-11 2011-12
0
5
10
15
20
25
30
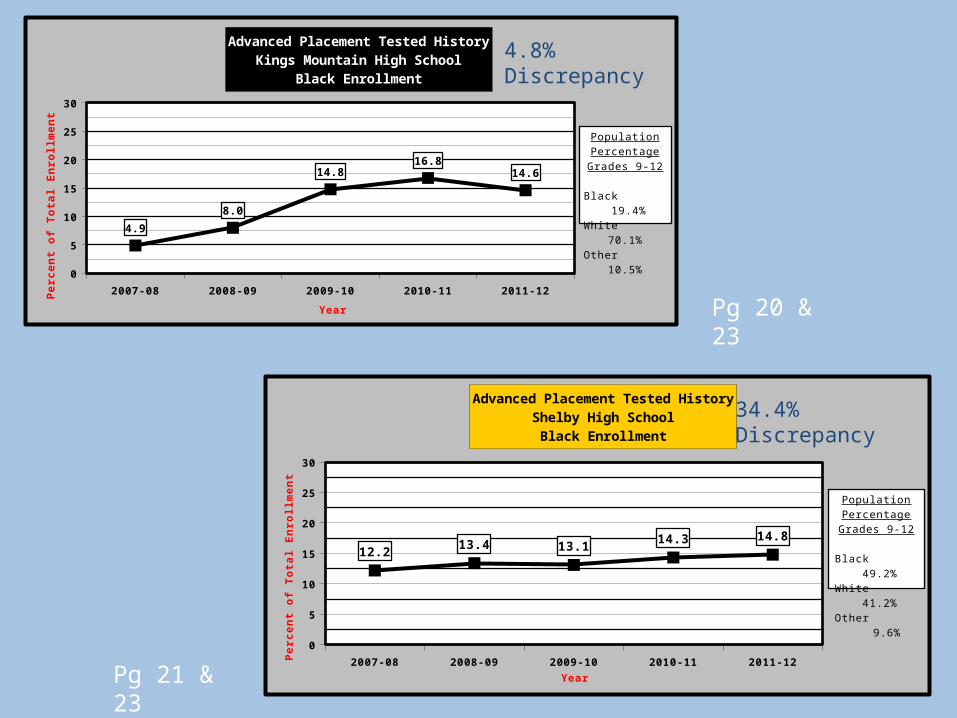
4.9
8.0
14.816.8
14.6
Advanced Placement Tested HistoryKings Mountain High School
Black Enrollment
Year
Per
cen
t o
f T
ota
l En
rollm
ent
Population Per-centage
Grades 9-12
Black 19.4%White 70.1%Other 10.5%
2007-08 2008-09 2009-10 2010-11 2011-12
0
5
10
15
20
25
30
12.213.4 13.1
14.3 14.8
Advanced Placement Tested HistoryShelby High School
Black Enrollment
Year
Pe
rce
nt
of
To
tal
En
roll
me
nt
Population Per-centage
Grades 9-12
Black 49.2%White 41.2%Other 9.6%
Pg 20 & 23
Pg 21 & 23
4.8% Discrepancy
34.4% Discrepancy
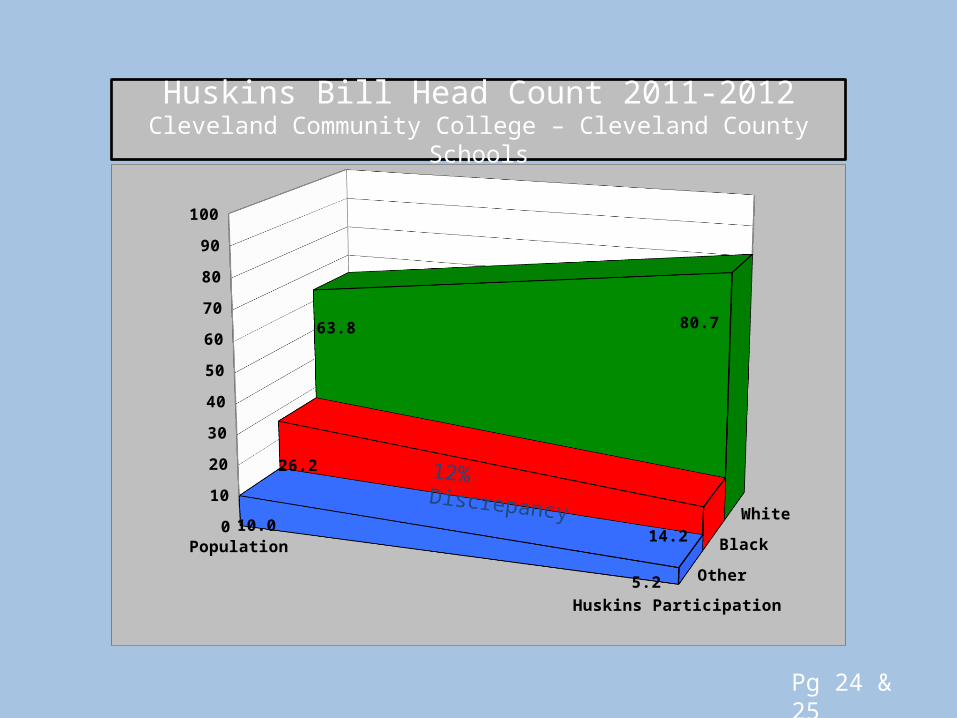
Population
Huskins Participation
0
10
20
30
40
50
60
70
80
90
100
Other
Black
White10.0
5.2
26.2
14.2
63.8 80.7
Huskins Bill Head Count 2011-2012Cleveland Community College – Cleveland County Schools
Pg 24 & 25
12% Discrepancy
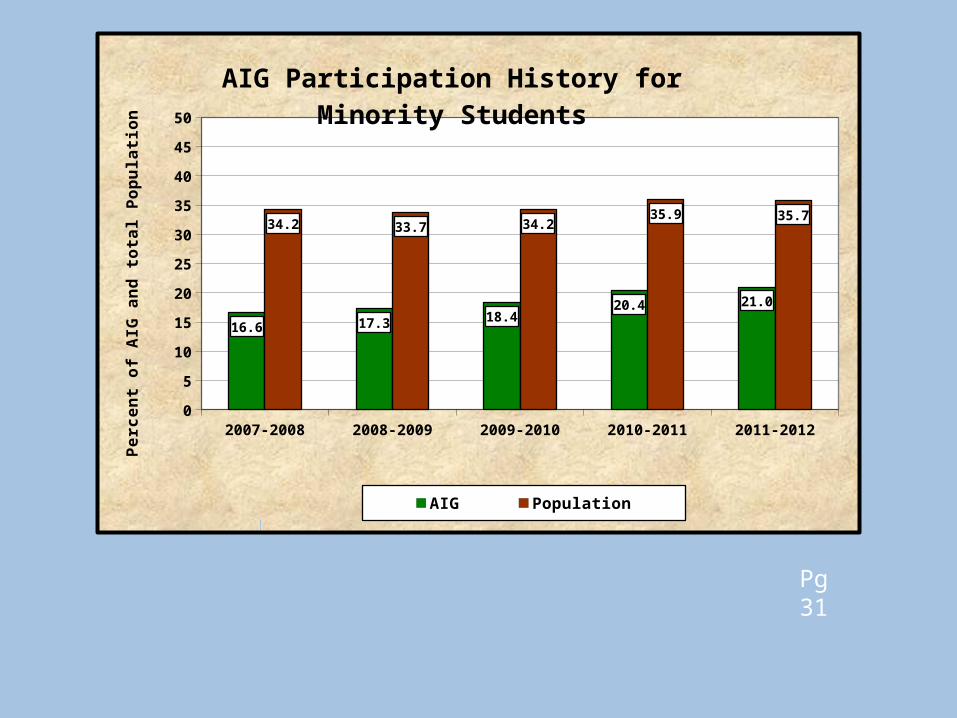
2007-2008 2008-2009 2009-2010 2010-2011 2011-20120
5
10
15
20
25
30
35
40
45
50
16.6 17.3 18.420.4 21.0
34.2 33.7 34.235.9 35.7
AIG Participation History for Minority Students
AIG Population
Pe
rce
nt
of
AIG
an
d t
ota
l Po
pu
lati
on
Pg 31
![[MS-PWVPDP]: PowerPoint Web Viewer Presentation Data Protocol · PowerPoint Web Viewer Presentation Data Protocol presentation](https://img.pdfslide.net/doc/110x75/5ecd14f0381ce046273d8f44/ms-pwvpdp-powerpoint-web-viewer-presentation-data-protocol-powerpoint-web-viewer.jpg)