Embed Size (px)
Citation preview

CATDS LEVEL 3
DATA PRODUCT DESCRIPTION
_____________________________________________
- Soil Moisture and Brightness Temperature - _____________________________________________
Project code SO-TN-CB-CA-0001
Version 3.a
Date 12/09/2014
Prepared by the SM-ESL team*, with the participation of
Lucie Berthon, Arnaud Mialon, François Cabot, Ahmad Al
Bitar, Philippe Richaume, Yann Kerr, Delphine Leroux,
Simone Bircher, Heather Lawrence, Arnaud Quesney and
Elsa Jacquette
* Contact: [email protected] (or [email protected])
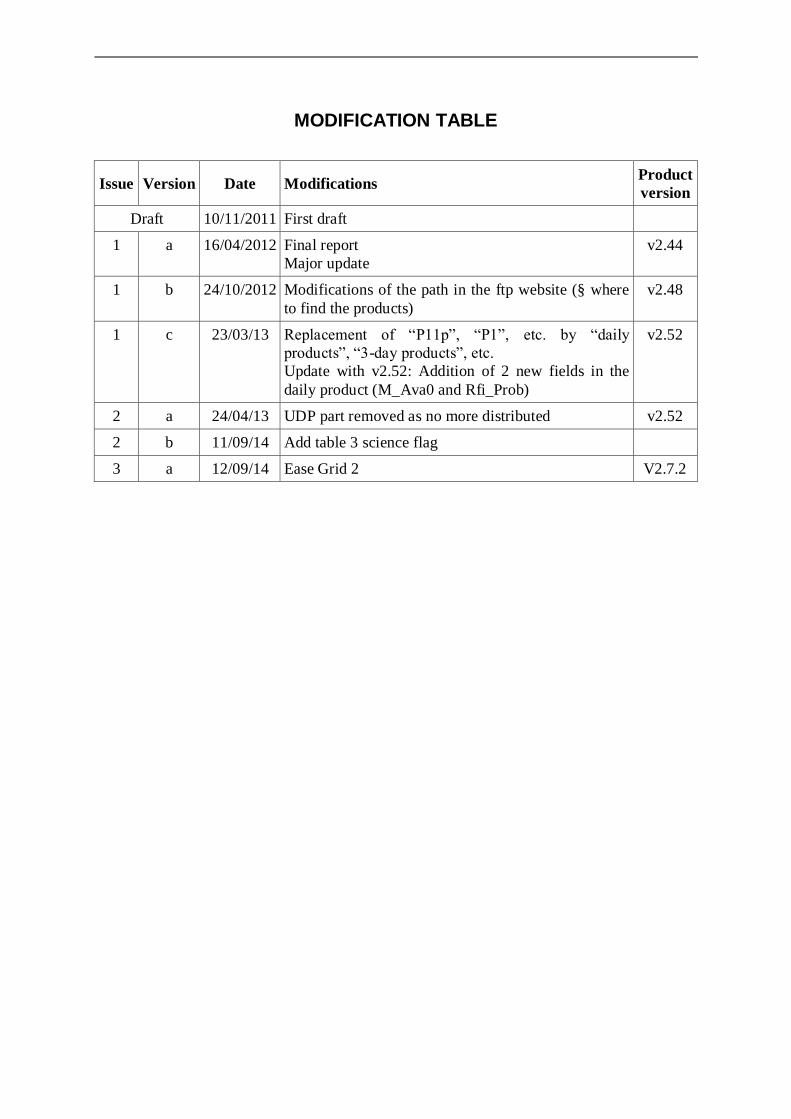
MODIFICATION TABLE
Issue Version Date Modifications Product
version
Draft 10/11/2011 First draft
1 a 16/04/2012 Final report
Major update
v2.44
1 b 24/10/2012 Modifications of the path in the ftp website (§ where
to find the products)
v2.48
1 c 23/03/13 Replacement of “P11p”, “P1”, etc. by “daily
products”, “3-day products”, etc.
Update with v2.52: Addition of 2 new fields in the
daily product (M_Ava0 and Rfi_Prob)
v2.52
2 a 24/04/13 UDP part removed as no more distributed v2.52
2 b 11/09/14 Add table 3 science flag
3 a 12/09/14 Ease Grid 2 V2.7.2

ACRONYMS
Term Definition
ADF Auxiliary Data File
ATBD Algorithm Theoretical Baseline Document
CATDS Centre Aval de Traitement des Données SMOS
CESBIO Centre d’Etudes Spatiales de la Biosphère
CCFSMF Processor Configuration parameters for L2 Soil Moisture, full polarisation
DPM Data Processing Model
DQX Data Quality Index
EASE Equal-Area Scalable Earth Grid
ECMWF European Centre for Medium-range Weather Forecasting
FL Flag
LSB / MSB Lowest / Most Significant Bit*
MD Cardioid Model
RFI Radiometric Frequency Interference
SM Soil Moisture
SMOS Soil Moisture and Ocean Salinity
Tau Vegetation Optical thickness
TB/BT Brightness Temperature
TEC Total Electron Content
* They are the bit position in a binary number having the lowest and greatest value respectively.

TABLE OF CONTENTS
1. Introduction ................................................................................................................................7
1.1. About the products ...........................................................................................................8
1.2. Where to find the products ..............................................................................................8
1.3. Version of the products ....................................................................................................8
2. Level 3 Brightness Temperature Product (L3TB) ........................................................................9
2.1. Product description ..........................................................................................................9
2.2. Naming convention...........................................................................................................9
2.3. Where to find these products ...........................................................................................9
2.4. Product content ..............................................................................................................10
3. Level 3 Soil Moisture Daily Product .........................................................................................12
3.1. Product description ........................................................................................................12
3.2. Naming convention.........................................................................................................12
3.3. Where to find these products .........................................................................................12
3.4. Product content ..............................................................................................................13
4. 3-day Product for Surface Soil Moisture ...................................................................................17
4.1. Product description ........................................................................................................20
4.2. Naming convention.........................................................................................................20
4.3. Where to find these products .........................................................................................20
4.4. Product content ..............................................................................................................21
5. 3-day Product for Dielectric Constant .......................................................................................23
5.1. Product description ........................................................................................................23
5.2. Naming convention.........................................................................................................23
5.3. Where to find these products .........................................................................................23
5.4. Product content ..............................................................................................................24
6. 10-day Product .........................................................................................................................26
6.1. Product description ........................................................................................................26
6.2. Naming convention.........................................................................................................26
6.3. Where to find these products .........................................................................................26
6.4. Product content ..............................................................................................................27
7. Monthly Product.......................................................................................................................29
7.1. Product description ........................................................................................................29
7.2. Naming convention.........................................................................................................29
7.3. Where to find these products .........................................................................................29
7.4. Product content ..............................................................................................................30


TABLES
Table 1: Naming description of the Level 3 Brightness Temperature Product ........................... 9
Table 2: Naming description of the Level 3 Soil Moisture Daily Product ................................ 12 Table 3: Science Flag description; is an integer that has to be converted to 32-bit sequence . 17 Table 4: Naming description of the 3-day product for Surface Soil Moisture .......................... 20 Table 5: Naming description of the 3-day product for Dielectric Constant .............................. 23
Table 6: Naming description of the 10-day product ................................................................... 26 Table 7: Naming description of the monthly product ................................................................. 29
ILLUSTRATIONS
Figure 1: Daily Soil Moisture product: 22nd
July 2010 (ascending orbits) ................................. 7
Figure 2: Organisation of the Level 3 Brightness Temperature Products ................................. 10 Figure 3: Organisation of the Level 3 Soil Moisture Daily Products ........................................ 13 Figure 4: Organisation of the 3-day products for Surface Soil Moisture .................................. 21
Figure 5: Organisation of the 3-day products for Dielectric Constant ...................................... 24 Figure 6: Organisation of the 10-day products............................................................................ 27 Figure 7: Organisation of the monthly products ......................................................................... 30
REFERENCES
RD 1 Algorithm Theoretical Baseline Document L3 SM: ATBD CATDS SM L3 SO-TN-CBSA-GS-0029 RD 2 Algorithm Theoretical Baseline Document L2 SM: SM ATBD SO-TN-ESL-SM-GS-0001(3.h) RD 3 Data Processing Model SM PC2: CAT-DPM-CTSM-00013-CG_13 RD 4 Data Processing Model SM L3TB: CAT-DPM-CTL3TB-00061-CG RD 5 Spécification Logicielle : CAT-SL-CT-00009-CG_10
RD 6 SMOS Level 1 and Auxiliary Data Products Specifications: SO-TN-IDR-GS-0005

INTRODUCTION
The ESA's (European Space Agency) SMOS (Soil Moisture and Ocean Salinity) mission,
operating since November 2009, is the first satellite dedicated to measuring surface soil
moisture and ocean salinity. The CNES (Centre National d'Etudes Spatiales) has developed a
ground segment for the SMOS data, known as the CATDS (Centre Aval de Traitement des
Données SMOS).
Operational since June 2011, it provides data referred to as level 3 products at different
temporal resolutions: daily products (see Figure 1), 3 day global products insuring a complete
coverage of the Earth surface, 10-day composite products, and monthly averaged products.
For each day, there are at most 15 ascending (respectively descending) half-orbits. It always
corresponds to the local equator crossing solar time 6:00 am (resp. 6:00 pm).
Like the AMSR-E L3 data, these products are presented in the NetCDF format on the EASE
(Equal Area Scalable Earth) grid version 2 with a ~25 km cylindrical projection.
On equal-area maps, the grid is changing with latitude: a circle placed anywhere on the map
always covers the same area on the globe (here 625 km2), and the product of the scale h along
a meridian and the scale k along a parallel is always equal to one. Its dimension, i.e. the aspect
ratio k/h measures the distortion of the shape. The global EASE grid is characterized by h=k
at a latitude of +/-30°. It insures a minimum mean angular distortion over continents.
For more information on the EASE grid see the ATBD L3SM [1]
.
An inversion algorithm is applied to the set of the brightness temperatures from global daily
L1C product. This processing is an iterative scheme performed in order to minimize a
quadratic cost function. It is exactly derived from the L2 SM algorithm in the principles. The
major enhancement at CATDS concerns the use of multi-orbit retrieval: several revisits are
taken into account simultaneously, one chosen in the three days before the reference day and
another in the three days after.
Figure 1: Daily Soil Moisture product: 22nd
July 2010 (ascending orbits)

ABOUT THE PRODUCTS
There are seven different types of Level 3 products distributed:
the Brightness Temperature product (named L3TB),
the one day global map of soil moisture values (named daily products),
the global soil moisture products, 3-day global map (named 3-day products for
Surface Soil Moisture),
the dielectric constant products, 3-day global map (named 3-day products for
Dielectric Constant),
the global soil moisture products, 10-day global map (named 10-day products),
and the global soil moisture products, monthly global map (named monthly products).
WHERE TO FIND THE PRODUCTS
All the products can be found on the CATDS website (http://catds.fr), in an organisation
depending on the type of product. The Level 3 Brightness Temperature, the daily products
and all the aggregated products (3-day, 10-day and monthly products) are stored following the
organisation shown on figures 2 to 8.
VERSION OF THE PRODUCTS
There are several changes in the products for each update of the version, some have minor
impacts, some have more important ones. This document will be updated accordingly.
This document is written for the V2.7.2.
We strongly recommend to use the last set of reprocessed data which
are in the folder “RE02” on the CATDS website.
e.g: SM_OPER_MIR_CLF3MD_220130201T000000_20130228T235959_272_001_7 in this
product, the version of the processor is V2.7.2.

LEVEL 3 BRIGHTNESS TEMPERATURE PRODUCT (L3TB)
PRODUCT DESCRIPTION
The Level 3 Brightness Temperature product is a daily global polarised brightness
temperature product, arranged by incidence angle values, in full polarisation. It includes
all brightness temperatures acquired that day, transformed to ground polarisation reference
frame (H and V polarisation), binned and averaged into fixed angle classes. Ascending and
descending orbits are processed separately and only in full polarisation.
NAMING CONVENTION
All the files are named as follows:
“SM_OPER_MIR_CDF3Tx_yyyymmddThhmmss_YYYYMMDDTHHMMSS_vvv_ccc_n”,
where the conventions are very close to those of SMOS Level 2.
Table 1: Naming description of the Level 3 Brightness Temperature Product
Naming Description
SM in this specific case, it stands for the SMOS mission
OPER
REPR
file class: indicates whether the data is produced in a nominal or a
reprocessing mode
MIR file category: MIRAS, as the name of the instrument
CDF3Tx C = CATDS
D = for daily nominal product
F = for full polarisation
3T = Level 3 Brightness Temperature Products
x = “A” for ascending orbit and “D” for descending orbit
yyyymmddThhmmss sensing start time for the data contained in the product. With yyyy,
year, mm month, dd day of the month, hh hour, mm minutes and ss
seconds, respectively
vvv version number of the processor generating the product
ccc file counter, used to make distinction among products having all other
filename identifiers identical: the higher the file counter, the more
recent the product
n processing site (C-PDC=7, C-EC SM=8, C-EC OS=9)
WHERE TO FIND THESE PRODUCTS
These products can be found on the CATDS website (http://catds.fr), organised as follows:
SM/GRIDDED/L3/OPER/{product type}/{year}/{day of the year}, where {product type} can
be MIR_CDF3TA or MIR_CDF3TD depending on orbits type, and {day of the year} is
between 001 (1st
January) and 365/366 (31st
December).

Figure 2: Organisation of the Level 3 Brightness Temperature Products
PRODUCT CONTENT
lat and lon Geographic coordinates: Vectors of latitudes and
longitudes (in degree) of the grid point.
The dimensions of « lat » and « lon » are 584×1 and
1388×1 respectively, corresponding to the
584×1388 nodes of the EASE version 2, 25km
cylindrical grid.
inc and dinc Centre (inc) and width (dinc) of each class of angle
(in degree), respectively.
Their dimensions are 15×1.
The 2 following parameters are presented as a 584×1388 matrix.
X_Swath Abscissa of the dwell line (in km): The sign of the
value is relative to the direction of the satellite. It is
positive if it is to the right and negative if it is to the
left of the satellite subtrack.
Grid_Point_Mask Flag indicating land/sea USGS content, coastline
distance, and Ice content.
All the following parameters have 3 dimensions: 15×584×1388.
BT_H, BT_V, BT_3 and BT_4 Averaged brightness temperature (in Kelvin) by
angle class in H-pol, V-pol, 3rd Stokes parameter
and 4th Stokes parameter respectively, over current

Earth fixed grid point, obtained by rotating the L1c
data.
Pixel_Radiometric_Accuracy_H,
Pixel_Radiometric_Accuracy_V,
Pixel_Radiometric_Accuracy_3 and
Pixel_Radiometric_Accuracy_4
Error accuracy measurement (in Kelvin) associated
to the averaged brightness temperature by class of
angle presented in the previous field, extracted in
the direction of the pixel.
Pixel_BT_Standard_Deviation_H,
Pixel_BT_Standard_Deviation_V,
Pixel_BT_Standard_Deviation_3 and
Pixel_BT_Standard_Deviation_4
Brightness temperature standard deviation (in
Kelvin) by class of angle.
Incidence_Angle Incidence angle value (in degree) by class of angle
corresponding to the measured brightness
temperature value over current Earth fixed grid
point.
Azimuth_Angle Azimuth angle value (in degree) by class of angle
corresponding to the measured brightness
temperature value over current Earth fixed grid
point.
Footprint_Axis1 and Footprint_Axis2 Elliptical averaged footprint major (and minor
respectively) semi-axis value by class of angle.
Xi and Eta Averaged direction cosine for Xi and Eta,
respectively, by angle class. Xi and Eta referred to
the antenna frame.
Nviews Number of brightness temperature views used to
compute angle class averages.
Days, UTC_Seconds and
UTC_Microseconds
Measurement acquisition time: UTC Time at which
the averaged brightness temperature was taken, in
EE CFI transport time format in days, seconds and
microseconds, respectively.

LEVEL 3 SOIL MOISTURE DAILY PRODUCT
PRODUCT DESCRIPTION
This product is the one day product, and contains filtered data. The best estimation of soil
moisture and dielectric constant are selected (based on the minimisation of the DQX) for each
node when several multi-orbit retrievals are available for a given day. A detection of
particular events is also performed in order to flag the data aggregation of SMOS orbits.
Ascending and descending orbits are still processed separately.
All the aggregated products (3-day, 10-day and monthly products) are based on these daily
maps.
NAMING CONVENTION
All the files are named as follows:
“SM_OPER_MIR_CLF31x_yyyymmddThhmmss_YYYYMMDDTHHMMSS_vvv_ccc_n”,
where the conventions are very close to those of SMOS Level 2.
Table 2: Naming description of the Level 3 Soil Moisture Daily Product
Naming Description
SM in this specific case, it stands for the SMOS mission
OPER
REPR
file class: indicates whether the data is produced in a nominal or a
reprocessing mode
MIR file category: MIRAS, as the name of the instrument
CLF31x C = CATDS
L = “land data”
F = for full polarisation
31: “3” for L3 product and “1” for 1 day coverage. For the Soil
Moisture, it means 1 day global map (L3 daily product)
x = “A” for ascending orbit and “D” for descending orbit
yyyymmddThhmmss sensing start time for the data contained in the product. With yyyy,
year, mm month, dd day of the month, hh hour, mm minutes and ss
seconds, respectively
vvv version number of the processor generating the product
ccc file counter, used to make distinction among products having all other
filename identifiers identical: the higher the file counter, the more
recent the product
n processing site (C-PDC=7, C-EC SM=8, C-EC OS=9)
WHERE TO FIND THESE PRODUCTS
These products can be found on the CATDS website (http://catds.fr), organised as follows:
SM/GRIDDED/L3SM/OPER/{product type}/{year}/{day of the year}, where {product type}
can be MIR_CLF31A or MIR_CLF31D depending on orbits type, and {day of the year} is
between 001 (1st
January) and 365/366 (31st
December).

Figure 3: Organisation of the Level 3 Soil Moisture Daily Products
PRODUCT CONTENT
lat and lon Geographic coordinates: Vectors of latitudes and
longitudes (in degree) of the grid point.
The dimensions of « lat » and « lon » are 584×1 and
1388×1 respectively, corresponding to the 584×1388
nodes of the EASE version 2, 25km cylindrical grid.
Almost all following parameters are presented as a 584×1388 matrix.
Mean_Acq_Time_Days and
Mean_Acq_Time_Seconds
Time of measurement: Day and second of mean
acquisition time, per DGG node, corresponding to
the selected soil moisture value. Day count begins
on the 1st of January 2000 AD, seconds and
microseconds are relative to the current day in
UTC.
Mean_Acq_Time_Days2 and
Mean_Acq_Time_Seconds2
Time of measurement: Day and the second of
mean acquisition time, per DGG node,
corresponding to the selected dielectric constant
value. The time follows EE CFI time format:
Days count begins on the 1st of January 2000 AD,
seconds are relative to time for current day in
UTC.
Soil_Moisture and
Soil_Moisture_Dqx
This is the retrieved soil moisture value (in m³.m-
³), and its associated data quality index.
Optical_Thickness_Nad and
Optical_Thickness_Nad_Dqx
Vegetation opacity: the nadir optical thickness
estimate for vegetation layer (in neper), and its

associated data quality index, corresponding to the
selected soil moisture values.
Optical_Thickness_Nad2 and
Optical_Thickness_Nad2_Dqx
Vegetation opacity: the nadir optical thickness
estimate for vegetation layer (in neper), and its
associated quality index, corresponding to the
selected dielectric constant values.
Dielectric_Const and
Dielectric_Const_Dqx
Dielectric constant: Real and imaginary parts of
the dielectric constant retrieved from the cardioid
model (MD) in Fm-¹, and their associated data
quality index.
The dimensions of this parameter are
584×1388×2 (for real and imaginary parts).
Hr and Hr_Dqx Roughness: the retrieved roughness parameter and
its associated data quality index.
Scattering_Albedo_H,
Diff_Albedos & Dqx
Spare, not retrieved at the moment.
Surface_Temperature and
Surface_Temperature_Dqx
Surface temperature: the retrieved surface
temperature (in Kelvin), and its associated quality
index corresponding to the selected soil moisture
values.
Temp_STL1 and Temp_SKT ECMWF temperatures for the 0-7 cm soil layer
and the soil surface, respectively, corresponding to
the selected soil moisture values.
S_Tree_1 Permanent surface category: This represents the
considered retrieval cases of the decision tree, i.e.
the main surface cover type (see ATBD L2SM)*:
1. all open water
2. heterogeneous open water
3. strong topography pollution
4. soft topography pollution
5. all wet snow
6. all mixed snow
7. wet snow pollution
8. mixed snow pollution
9. all frost
10. frost pollution
11. forest cover
12. soil cover
13. all wetlands
14. all barren
15. all ice
*
Only 11 and 12 are of interest for soil moisture retrieval.

16. all urban
17. heterogeneous
Tb_Asl_Theta_B_H,
Tb_Asl_Theta_B_H_Dqx,
Tb_Asl_Theta_B_V and
Tb_Asl_Theta_B_V_Dqx
Brightness temperature At Surface Level: This is
the brightness temperature in Kelvin (corrected
for sky/atmosphere contribution and provided at
the Earth reference frame) computed using the
forward model at the specific incidence angle
theta_B of 42.5°, for H and V polarisations,
respectively, and their associated data quality
index. They correspond to the selected soil
moisture values.
Tb_Toa_Theta_B_X,
Tb_Toa_Theta_B_X_Dqx,
Tb_Toa_Theta_B_Y and
Tb_Toa_Theta_B_Y_Dqx
Brightness temperature at the Top Of the
Atmosphere: This is the brightness temperature in
Kelvin (corrected for sky/atmosphere contribution
and transferred to antenna reference frame using
the Faraday and geometric rotation) computed
from the forward models At the Top Of the
Atmosphere level at the specific incidence angle
theta_B of 42.5°, for X and Y polarisation (at the
antenna frame), respectively, and their associated
data quality index. They correspond to the
selected soil moisture values.*
Science_Flags Flags: They are the flags associated with the soil
moisture value (see table after for more details).
This parameter is coded in 32 bits: the reported
value has to be converted to a binary number
Fno and Ffo Fractions: the nominal (i.e. low vegetation and
sand) and the forest radiometric fractions,
respectively, for each node corresponding to the
selected soil moisture values.
M_Ava0
Total number of brightness temperature
measurements acquired for each nodes,
corresponding to the selected soil moisture values.
M_Ava Total number of useful measurements: Number of
brightness temperature measurements actually
considered for retrieval after initial filtering,
corresponding to the selected soil moisture values.
N_Rfi_X and N_Rfi_Y Number of discarded views due to RFI: Number
of discarded brightness temperatures due to
suspected RFI in the X and Y polarisations
* Note, that in some products (especially products processed with a version lower than vvv=240) the X/Y have been replaced with H/V in
the Tb_Toa field name by error. In either case Tb_Toa is always given in the antenna reference frame (X/Y).

respectively, corresponding to the selected soil
moisture values.
Min_Soil_Moisture,
Max_Soil_Moisture,
Min_Soil_Moisture_Dqx and
Max_Soil_Moisture_Dqx
As several soil moisture data (and thus data
quality indexes) are available per node and per
day, the minimum and the maximum values are
reported here.
Soil_Moisture_Init_Val and
Soil_Moisture_Init_Std
Initial value and the standard deviation for free
parameter soil moisture, corresponding to the
selected soil moisture values.
Gqx and Gqx2 Global quality indexes associated with the soil
moisture values and the dielectric constant values,
respectively.
Event_Flags Flag about event detection: This parameter is
coded in 16 bits, using the following convention:
00 Not verified
01 Possible
10 Sure
11 Not processed
The first two ones (FL_EV_Frost_Soil) are raised
to show the possible existence of ground frozen,
and the 14 other ones are spare bits padded with 0.
e.g.: “0000000000000010” (=2 in a decimal
system) means that frost has been clearly detected
on the ground.
Rfi_Prob
RFI probability: total number of RFI detected on a
large period divided by the total number of
brightness temperature measurements acquired on
the same period.

Table 3: Science Flag description; is an integer that has to be converted to 32-bit sequence
Bit Tag name Type
1 (LS
B)
FL_Non_Nom This flag is set to 1 if any of the flags in Bits 3 to 10
and 12 to 20 in this table is raised.
2 FL_Scene_T This flag is set to 1 when either FL_Non_Nom or
FL_Nominal is raised.
3 FL_Barren This flag is set to 1 when the radiometric fraction of
Barren surface is above the threshold
TH_SCENE_FEB (=5.00%).
4 FL_Topo_S This flag is set to 1 if the radiometric fraction of
Strong Topography surface type is above the
threshold TH_SCENE_FTS (=5.00%).
5 FL_Topo_M This flag is set to 1 if the radiometric fraction of
Moderate Topography is above the threshold
TH_SCENE_FTM (=10.00%).
6 FL_OW This flag is set to 1 if the radiometric fraction of
Open Water surface type is above the threshold
TH_SCENE_FOW (=5.00%).
7 FL_Snow_Mix This flag is set to 1 if the radiometric fraction of
Mixed Snow surface type is above the threshold
TH_SCENE_FSN (=5.00%).
8 FL_Snow_Wet This flag is set to 1 if the radiometric fraction of
Wet Snow surface type is above the threshold
TH_SCENE_FSW (=5.00%).
9 FL_Snow_Dry This flag is set to 1 if the radiometric fraction of
Dry Snow surface type is above the threshold
TH_SCENE_FSD (=5.00%).
10 FL_Forest This flag is set to 1 if the radiometric fraction of
Forest surface type is above the threshold
TH_SCENE_FFO (=10.00%).
11 FL_Nominal This flag is set to 1 if the radiometric fraction of
Nominal (vegetated soil + sand) surface type is
above the threshold TH_SCENE_FNO (=10.00%).
12 FL_Frost This flag is set to 1 if the radiometric fraction of
Frost surface type is above the threshold
TH_SCENE_FRZ (=5.00%).
13 FL_Ice This flag is set to 1 if the radiometric fraction of
Total Ice surface type is above the threshold
TH_SCENE_FTI (=5.00%).
14 FL_Wetlands This flag is set to 1 if the radiometric fraction of
Wetlands surface type is above the threshold
TH_SCENE_FWL (=5.00%).
15 FL_Flood_Prob This flag is set to 1 if the sum of the ECMWF value
for Large_Scale_Precipitation and
Convective_Precipitation (in AUX_ECMWF_) is
above the threshold TH_FLOOD (=20mm/h).
16 FL_Urban_Low This flag is set to 1 if the radiometric fraction of

Urban surface type is above the threshold
TH_SCENE_FUL (=10.00%).
17 FL_Urban_High This flag is set to 1 when the radiometric fraction of
Urban surface type is above the threshold
TH_SCENE_FUH (=30.00%).
18 FL_Sand This flag is set to 1 if the mean sand fraction is
above the threshold TH_Sand (=95.00%). The mean
sand fraction is computed as the non-weighted
average of the sand percentage from the Soil
Properties product.
19 FL_Sea_Ice This flag is set to 1 if the radiometric fraction of Sea
Ice surface type, which is determined by the sea ice
cover of the ECMWF database, is above the
threshold TH_Sea_Ice (=20.00%).
20 FL_Coast This flag is set to 1 when the Wetlands fraction in at
least one DFFG cell in the working area is above
zero and the Land Cover Class reports an intertidal
area.
21 FL_Occur_T This flag is set to 1 if any of the FL_Litter, FL_PR,
or FL_Intercep is raised, indicating the occurrence
of a special event during the retrieval.
22 FL_Litter This flag is set to 1 if the mean litter opacity is
above the threshold TH_TAU_Litter (=0.10 neper).
23 FL_PR This flag is set to 1 if the interception index is
below the threshold TH_PR (=0.026).
24 FL_Intercep This flag is set to 1 if the ECMWF parameter
Skin_Reservoir_Content (SCR) is above the
threshold TH_Intercep (=0.02m).
25 FL_External This flag is set to 1 if one of the flags FL_Rain,
FL_TEC is raised or N_Sky > 0.
26 FL_Rain This flag is set to 1 if the sum of the ECMWF
parameters Large_Scale_Precipitation and
Convective_Precipitation (LSP and CP) is above the
threshold TH_RAIN (=10.00mm/h).
27 FL_TEC This flag is raised if the TEC (Total Electric
Constant) content of the first snapshot contributing
to the brightness temperature measurements to the
last retrieval is above the the threshold TH_TEC
(=95.00*10^16 electrons/m²). If no retrieval has
been attempted, then the brightness temperatures are
those used to compute MVAL0.
28 FL_TAU_FO This flag is set to 1 if the mean forest opacity is
above the threshold TH_SCENE_TAU_FO (=1,0
neper).
29 FL_WINTER_FOREST Flag indicating that the forest case has been selected
by the decision tree despite the fact that the mean
fraction is mainly in the FNO case.
30 FL_DUAL_RETR_FNO_FFO Flag indicating the dual retrieval is performed on
the FNO and FFO fractions.

31 Spare bit
32 Spare bit

3-DAY PRODUCT FOR SURFACE SOIL MOISTURE
PRODUCT DESCRIPTION
The 3-day global product of soil moisture is an aggregation of daily global maps of soil
moisture and its associated parameters over a 3 day moving window. The whole Earth's
surface is covered in this 3-day product. This product is based on the best soil moisture
retrievals (minimisation of the DQX). The distinction between ascending and descending
orbits is kept.
NAMING CONVENTION
All the files are named as follows:
“SM_OPER_MIR_CLF33x_yyyymmddThhmmss_YYYYMMDDTHHMMSS_vvv_ccc_n”,
where the conventions are very close to those of SMOS Level 2.
Table 4: Naming description of the 3-day product for Surface Soil Moisture
Naming Description
SM in this specific case, it stands for the SMOS mission
OPER
REPR
file class: indicates whether the data is produced in a nominal or a
reprocessing mode
MIR file category: MIRAS, as the name of the instrument
CLF33x C = CATDS
L = “land data”
F = for full polarisation
33: for SM, it means 3 days global map (3-day product for Surface
Soil Moisture)
x = “A” for ascending orbit and “D” for descending orbit
yyyymmddThhmmss sensing start time for the data contained in the product. With yyyy,
year, mm month, dd day of the month, hh hour, mm minutes and ss
seconds, respectively
vvv version number of the processor generating the product
ccc file counter, used to make distinction among products having all other
filename identifiers identical: the higher the file counter, the more
recent the product
n processing site (C-PDC=7, C-EC SM=8, C-EC OS=9)
WHERE TO FIND THESE PRODUCTS
These products can be found on the CATDS website (http://catds.fr), organised as follows:
SM/GRIDDED/L3SM/OPER/{product type}/{year}/{month}, where {product type} can be
MIR_CLF33A or MIR_CLF33D depending on orbits type.

Figure 4: Organisation of the 3-day products for Surface Soil Moisture
PRODUCT CONTENT
lat and lon Geographic coordinates: Vectors of latitudes and longitudes
(in degree) of the grid point.
The dimensions of « lat » and « lon » are 584×1 and 1388×1
respectively, corresponding to the 584×1388 nodes of the
EASE version 2, 25km cylindrical grid.
Almost all following parameters are presented as a 584×1388 matrix.
Nb_Sm Number of available soil moisture estimates obtained over
the 3 day period: It could vary from 0 to 3 if the point is
successfully retrieved over the 3 days.
Soil_Moisture and
Soil_Moisture_Dqx
Selected soil moisture value for the period: The selected soil
moisture value (in m³.m-³) with the smallest Dqx is kept
between all the values (maximum 3) available during the
period for one DGG, and its associated data quality index.
Nominal_Fraction It is the nominal fraction associated with the selected soil
moisture values.
Optical_Thickness_Nad and
Optical_Thickness_Nad_Dqx
Vegetation opacity: Once the soil moisture value has been
chosen between the available retrievals, the associated nadir
optical thickness estimated for the vegetation layer (in
neper), and its associated quality index are used to fill up
these fields.
Science_Flags Flags: They are the flags associated with the selected soil

moisture values (see 0for more details).
Event_Flags Flag about event detection: This parameter is coded in 16
bits, using the following convention:
00 Not verified
01 Possible
10 Sure
11 Not processed
The first two ones (FL_EV_Frost_Soil) are raised to show
the possible existence of ground frozen, and the 14 other
ones are spare bits padded with 0.
e.g.: “0000000000000010” (=2 in a decimal system) means
that frost has been clearly detected on the ground.
Gqx Global quality index associated with the selected soil
moisture value.
Mean_Acq_Time_Days and
Mean_Acq_Time_Seconds
Time of measurement: Day and second of mean acquisition
time, per DGG node, corresponding to the selected soil
moisture value. Day count begins on the 1st of January 2000
AD, seconds and microseconds are relative to the current
day in UTC.
Dielectric_Const and
Dielectric_Const_Dqx
Dielectric constant: Real and imaginary parts of the
dielectric constant retrieved from the cardioid model (MD)
in Fm-¹, and their associated data quality index.
The dimensions of this parameter are 584×1388×2 (for real
and imaginary parts).
list_of_data_set This is the list of the daily products used in the processing.

3-DAY PRODUCT FOR DIELECTRIC CONSTANT
PRODUCT DESCRIPTION
The 3-day global product of the dielectric constant is an aggregation of daily maps of
dielectric constant and its associated parameters over 3 days moving window. The whole
Earth's surface is covered in this 3-day product. This product is based on the best dielectric
constant retrievals (minimisation of the DQX). The distinction between ascending and
descending orbits is kept.
NAMING CONVENTION
All the files are named as follows:
“SM_OPER_MIR_CLF3Ex_yyyymmddThhmmss_YYYYMMDDTHHMMSS_vvv_ccc_n”,
where the conventions are very close to those of SMOS Level 2.
Table 5: Naming description of the 3-day product for Dielectric Constant
Naming Description
SM in this specific case, it stands for the SMOS mission
OPER
REPR
file class: indicates whether the data is produced in a nominal or a
reprocessing mode
MIR file category: MIRAS, as the name of the instrument
CLF3Ex C = CATDS
L = “land data”
F = for full polarisation
3E: it means dielectric constant map (3-day product for Dielectric
Constant)
x = “A” for ascending orbit and “D” for descending orbit
yyyymmddThhmmss sensing start time for the data contained in the product. With yyyy,
year, mm month, dd day of the month, hh hour, mm minutes and ss
seconds, respectively
vvv version number of the processor generating the product
ccc file counter, used to make distinction among products having all other
filename identifiers identical: the higher the file counter, the more
recent the product
n processing site (C-PDC=7, C-EC SM=8, C-EC OS=9)
WHERE TO FIND THESE PRODUCTS
These products can be found on the CATDS website (http://catds.fr), organised as follows:
SM/GRIDDED/L3SM/OPER/{product type}/{year}/{month}, where {product type} can be
MIR_CLF3EA or MIR_CLF3ED depending on orbits type.

Figure 5: Organisation of the 3-day products for Dielectric Constant
PRODUCT CONTENT
lat and lon Geographic coordinates: Vectors of latitudes and longitudes
(in degree) of the grid point.
The dimensions of « lat » and « lon » are 584×1 and 1388×1
respectively, corresponding to the 584×1388 nodes of the
EASE version 2, 25km cylindrical grid.
Almost all following parameters are presented as a 584×1388 matrix.
Dielectric_Const and
Dielectric_Const_Dqx
Dielectric constant: Real and imaginary parts of the
dielectric constant retrieved from the cardioid model (MD)
and respectively a non cardioid model (Non MD) in Fm-¹,
and their associated data quality index. The dimensions of
this parameter are 584×1388×2 (for real and imaginary
parts).
Between all the values (maximum 3) available for one DGG,
the value with the smallest Dqx is kept in the 3-day product
for Dielectric Constant with its associated Dqx.
Dielect_Const_Module and
Dielect_Const_Module_Dqx
This is the module of dielectric constant and the module of
Dqx of dielectric constant.
Optical_Thickness_Nad and
Optical_Thickness_Nad_Dqx
Vegetation opacity: Once the dielectric constant value has
been selected between the available retrievals, the associated
optical thickness estimated for vegetation layer (in neper),
and its associated quality index are reported (namely
Optical_Thickness_Nad2 and

Optical_Thickness_Nad_Dqx2 from the daily product).
Mean_Acq_Time_Days and
Mean_Acq_Time_Seconds
Time of measurement: Day and second of mean acquisition
time, per DGG node, corresponding to the selected dielectric
constant values. Day count begins on the 1st of January
2000 AD, seconds and microseconds are relative to the
current day in UTC. (Mean_Acq_Time_Days2 and
Mean_Acq_Time_Seconds2 in the daily product).
Event_Flags Flag about event detection: This parameter is coded in 16
bits, using the following convention:
00 Not verified
01 Possible
10 Sure
11 Not processed
The first two ones (FL_EV_Frost_Soil) are raised to show
the possible existence of ground frozen, and the 14 other
ones are spare bits padded with 0.
e.g.: “0000000000000010” (=2 in a decimal system) means
that frost has been clearly detected on the ground.
Gqx This is the global quality index associated with the selected
dielectric constant value (Gqx2 in the daily product).
list_of_data_set This is the list of the daily products used in the processing.

10-DAY PRODUCT
PRODUCT DESCRIPTION
The 10-day global product is a 10-days aggregation of daily global maps. Three products are
obtained per month whereof the last one has a duration of 8 to 11 days. Each product contains
the median, minimum and maximum values of soil moisture and its associated parameters
over the 10 days. The distinction between ascending and descending orbits is kept.
NAMING CONVENTION
All the files are named as follows:
“SM_OPER_MIR_CLF3Dx_yyyymmddThhmmss_YYYYMMDDTHHMMSS_vvv_ccc_n”,
where the conventions are very close to those of SMOS Level 2.
Table 6: Naming description of the 10-day product
Naming Description
SM in this specific case, it stands for the SMOS mission
OPER
REPR
file class: indicates whether the data is produced in a nominal or a
reprocessing mode
MIR file category: MIRAS, as the name of the instrument
CLF3Dx C = CATDS
L = “land data”
F = for full polarisation
3D: for SM, it means 10-days global map (10-day product)
x = “A” for ascending orbit and “D” for descending orbit
yyyymmddThhmmss sensing start time for the data contained in the product. With yyyy,
year, mm month, dd day of the month, hh hour, mm minutes and ss
seconds, respectively
vvv version number of the processor generating the product
ccc file counter, used to make distinction among products having all other
filename identifiers identical: the higher the file counter, the more
recent the product
n processing site (C-PDC=7, C-EC SM=8, C-EC OS=9)
WHERE TO FIND THESE PRODUCTS
These products can be found on the CATDS website (http://catds.fr), organised as follows:
SM/GRIDDED/L3SM/OPER/{product type}/{year}/{month}, where {product type} can be
MIR_CLF3DA or MIR_CLF3DD depending on orbits type.

Figure 6: Organisation of the 10-day products
PRODUCT CONTENT
lat and lon Geographic coordinates: Vectors of latitudes and longitudes
(in degree) of the grid point.
The dimensions of « lat » and « lon » are 584×1 and 1388×1
respectively, corresponding to the 584×1388 nodes of the
EASE version 2, 25km cylindrical grid.
The following parameters are presented as a 584×1388 matrix.
Nb_Sm Number of available soil moisture estimates obtained over
the 10-day period: It could vary from 0 to 11 (last 10 days
can be 8 to 11 days) if the point is successfully retrieved for
the 10 days.
Gqx This is the global quality index.
For this product, in addition of the two dimensions (lat×lon), there is a third one
(med_min_max = 3) corresponding to the median, the minimum, and the maximum soil moisture values obtained over the 10-day period.
Soil_Moisture and
Soil_Moisture_Dqx
This is the medain, minimum and maximum value of soil
moisture (in m³.m-³) retrieved over the 10 days, and its
associated data quality index.
Mean_Acq_Time_Days and
Mean_Acq_Time_Seconds
Time of measurement: Day and second of mean acquisition
time, per DGG node. Day count begins on the 1st of January
2000 AD, seconds and microseconds are relative to the

current day in UTC.
Optical_Thickness_Nad and
Optical_Thickness_Nad_Dqx
Vegetation opacity: It is the nadir optical thickness estimate
for vegetation layer (in neper), and its associated data
quality index.
Hr and Hr_Dqx Roughness: It is the retrieved roughness and its associated
quality index.
Scattering_Albedo_H,
Diff_Albedos & Dqx
Spare, not retrieved at the moment.
Nominal_Fraction Nominal fraction.
Science_Flags They are the flags associated with the median, the minimum
and the maximum values of soil moisture (Table 3, see § 0
for more details).
list_of_data_set This is the list of the daily products used in the processing.

MONTHLY PRODUCT
PRODUCT DESCRIPTION
The monthly global product of soil moisture is a monthly average of daily global maps. It
provides a mean retrieved soil moisture weighted by their accuracy (DQX), vegetation optical
thickness (separated for lower vegetation and forest), RFI statistics over a month, without
taking into account estimations affected by detected event (only frost for the moment) in the
daily product. It can be useful for climate monitoring. The distinction between ascending and
descending orbits is kept.
NAMING CONVENTION
All the files are named as follows:
“SM_OPER_MIR_CLF3Mx_yyyymmddThhmmss_YYYYMMDDTHHMMSS_vvv_ccc_n”,
where the conventions are very close to those of SMOS Level 2.
Table 7: Naming description of the monthly product
Naming Description
SM in this specific case, it stands for the SMOS mission
OPER
REPR
file class: indicates whether the data is produced in a nominal or a
reprocessing mode
MIR file category: MIRAS, as the name of the instrument
CLF3Mx C = CATDS
L = “land data”
F = for full polarisation
3M: for SM, it means monthly global map (L3 monthly product)
x = “A” for ascending orbit and “D” for descending orbit
yyyymmddThhmmss sensing start time for the data contained in the product. With yyyy,
year, mm month, dd day of the month, hh hour, mm minutes and ss
seconds, respectively
vvv version number of the processor generating the product
ccc file counter, used to make distinction among products having all other
filename identifiers identical: the higher the file counter, the more
recent the product
n processing site (C-PDC=7, C-EC SM=8, C-EC OS=9)
WHERE TO FIND THESE PRODUCTS
These products can be found on the CATDS website (http://catds.fr), organised as follows:
SM/GRIDDED/L3SM/OPER/{product type}/{year}/{month}, where {product type} can be
MIR_CLF3MA or MIR_CLF3MD depending on orbits type.

Figure 7: Organisation of the monthly products
PRODUCT CONTENT
lat and lon Geographic coordinates: Vectors of latitudes and longitudes
(in degree) of the grid point.
The dimensions of « lat » and « lon » are 584×1 and 1388×1
respectively, corresponding to the 584×1388 nodes of the
EASE version 2, 25km cylindrical grid.
Almost all following parameters are presented as a 584×1388 matrix.
Nb_Sm Number of available soil moisture estimates obtained over
the month: It could vary from 0 to the number of days in the
considered month if the point is successfully retrieved over
the month.
Soil_Moisture,
Soil_Moisture_Dqx, and
Var_Soil_Moisture
This is a mean monthly soil moisture value (in m³.m-³)
weighted by DQX, which does not take into account the
estimations affected by an event in the daily product (it
corresponds only to data whose Event_Flags is equal to
zero), and its associated quadratic mean quality index and
variance.
Optical_Thickness_Lv,
Optical_Thickness_Lv_Dqx,
and
Var_Optical_Thickness_Lv
This is a mean monthly nadir optical thickness value
weighted by DQX, for lower vegetation (in neper) which
does not take into account the estimations affected by an
event in the daily product, and its associated quadratic mean
quality index and variance.
Optical_Thickness_Fo, This is a mean monthly nadir optical thickness value

Optical_Thickness_Fo_Dqx,
and
Var_Optical_Thickness_Fo
weighted by DQX, for forest (in neper) which does not take
into account the estimations affected by an event in the daily
product, and its associated quadratic mean quality index and
variance.
Nominal_Fraction and
Forest_Fraction
The mean nominal and forest fractions when the model is
nominal or forest, respectively. The mean is weighted by the
soil moisture dqx value.
Gqx This is the mean global quality index where soil moisture is
available.
Rfi_X_Frac and Rfi_Y_Frac They are the fractions of SMOS TB measurements
contaminated by RFI in X and Y polarisations.
list_of_data_set This is the list of the daily products used in the processing.