Embed Size (px)
Citation preview

DATA QUALITY ASSESSMENT IN CREDIT RISK MANAGEMENT BY A
CUSTOMIZED TOTAL DATA QUALITY MANAGEMENT APPROACH
A THESIS SUBMITTED TO
THE GRADUATE SCHOOL OF INFORMATICS
OF
THE MIDDLE EAST TECHNICAL UNIVERSITY
BY
MUHAMMED ĠLYAS GÜNEġ
IN PARTIAL FULFILLMENT OF THE REQUIREMENTS FOR THE DEGREE
OF MASTER OF SCIENCE
IN
THE DEPARTMENT OF INFORMATION SYSTEMS
FEBRUARY 2016


DATA QUALITY ASSESSMENT IN CREDIT RISK MANAGEMENT BY A
CUSTOMIZED TOTAL DATA QUALITY MANAGEMENT APPROACH
Submitted by Muhammed Ġlyas GÜNEġ in partial fulfillment of the requirements for
the degree of Master of Science in Information Systems, Middle East Technical
University by,
Prof. Dr. Nazife BAYKAL __________________
Dean, Graduate School of Informatics
Prof. Dr. Yasemin YARDIMCI ÇETĠN __________________
Head of Department, Information Systems
Prof. Dr. Yasemin YARDIMCI ÇETĠN __________________
Supervisor, Information Systems, METU
Prof. Dr. Semih BĠLGEN __________________
Co-advisor, Computer Engineering, Yeditepe University
Examining Committee Members:
Assoc. Prof. Dr. Aysu Betin CAN __________________
Information Systems, METU
Prof. Dr. Yasemin YARDIMCI ÇETĠN __________________
Information Systems, METU
Assist. Prof. Dr. Ersin KARAMAN __________________
Management Information Systems, Atatürk University
Assoc. Prof. Dr. Engin KÜÇÜKKAYA __________________
Business Administration, METU
Assist. Prof. Dr. Tuğba TAġKAYA TEMĠZEL __________________
Information Systems, METU
Date: __________________


v
I hereby declare that all information in this document has been obtained and
presented in accordance with academic rules and ethical conduct. I also declare
that, as required by these rules and conduct, I have fully cited and referenced
all material and results that are not original to this work.
Name and Surname: Muhammed Ġlyas GÜNEġ
Signature…………:
vi
ABSTRACT
DATA QUALITY ASSESSMENT IN CREDIT RISK MANAGEMENT BY
CUSTOMIZED TOTAL DATA QUALITY MANAGEMENT APPROACH
GÜNEġ, MUHAMMED ĠLYAS
M.S., Department of Information Systems
Supervisor: Prof. Dr. Yasemin YARDIMCI ÇETĠN
Co-Advisor: Prof. Dr. Semih BĠLGEN
February 2016, 132 pages
As the size and complexity of financial institutions, more specifically banks, grow,
the amount of data that information systems (IS) of such institutions need to handle
also increases. This leads to the emergence of a variety of data quality (DQ)
problems. Due to the possible economic losses due to such DQ issues, banks need to
assure quality of their data via data quality assessment (DQA) techniques. As DQ
related problems diversify and get complicated, the requirement for contemporary
data quality assessment methods becomes more and more evident. Total Data
Quality Management (TDQM) program is one of the approaches where data quality
assessment of banking data is performed since the phases of the program, i.e.
definition, measurement, analysis and improvement are well suited for identification
of DQ issues. This study presents a customized approach to TDQM for data quality
assessment in credit risk management. The study grounds the selection of DQ
dimensions for credit risk on identification of data taxonomies for credit risk in
accordance with the Basel Accords. Identification of data taxonomies from an IS
viewpoint results in determination of data entities and attributes, which enabled the
development of DQ metrics based on the DQ dimension selected in the definition
phase. DQ metrics are transformed into quality performance indicators in order to
assess quality of credit risk data by means of DQA methods in the measurement
phase. Analysis of the results of DQA reveals the underlying causes of poor DQ

vii
performance in the analysis phase of TDQM. Identification of DQ problems and their
major causes is followed by suggestion of appropriate improvement techniques based
on the size, complexity and criticality of the problems in the context of credit risk
management. TDQM approach customized for credit risk context in this study is
implemented for a real bank case. Results of the implementation indicate the
significance of and requirement for implementation of such methods sector-wide in
order to manage the risks related to poor DQ. Moreover, a survey addressing banks
to evaluate validity, applicability and acceptance of the approach as well as their own
ongoing data governance activities has been carried out with the participation of
senior risk managers. Findings of the survey reveal that the banks surveyed have
found the approach to be considerably satisfactory in addressing data quality issues
in credit risk management.
Keywords: Data Quality Assessment, Total Data Quality Management, Information
Systems, Credit Risk Management, Banking

viii
ÖZ
KREDĠ RĠSKĠ YÖNETĠMĠNDE ÖZELLEġTĠRĠLMĠġ TOPLAM VERĠ KALĠTESĠ
YÖNETĠMĠ YAKLAġIMI ĠLE VERĠ KALĠTESĠNĠN DEĞERLENDĠRĠLMESĠ
GÜNEġ, MUHAMMED ĠLYAS
Yüksek Lisans, BiliĢim Sistemleri
Tez Yöneticisi: Prof. Dr. Yasemin YARDIMCI ÇETĠN
Yardımcı DanıĢman: Prof. Dr. Semih BĠLGEN
ġubat 2016, 132 sayfa
Finansal kuruluĢların, daha özelde bankaların, büyüklüğü ve karmaĢıklığı arttıkça, bu
kuruluĢların bilgi sistemlerinin (BS) üstesinden gelmesi gereken veri miktarı da
artmaktadır. Bu durum çeĢitli veri kalitesi (VK) problemlerinin ortaya çıkmasına
neden olmaktadır. Bu gibi VK problemlerinden kaynaklanan olası ekonomik
kayıplarından dolayı; bankların verilerinin kalitelerini, veri kalitesi değerlendirme
(VKD) teknikleriyle sağlaması gerekmektedir. VK ile ilgili problemler farklılaĢtıkça
ve karmaĢıklaĢtıkça güncel veri kalitesi yöntemlerine olan ihtiyaç gittikçe daha
belirgin hale gelmektedir. Toplam Veri Kalitesi Yönetimi (TVKY) programı, bu
programın tanımlama, ölçme, analiz ve iyileĢtirme aĢamalarının VK problemlerini
tespit etmeye elveriĢli olmasından ötürü bankacılık verilerinin kalitesinin
değerlendirilmesinde kullanılan yaklaĢımlardan biridir. Bu çalıĢma kredi riski
yönetiminde veri kalitesinin değerlendirilmesi için TVKY‟ye iliĢkin özelleĢtirilmiĢ
bir yaklaĢım sunmaktadır. Söz konusu çalıĢma kredi riskine iliĢkin VK boyutlarının
seçimini, Basel sermaye uzlaĢısına uygun bir Ģekilde, kredi riskine iliĢkin veri
sınıflarının tanımlanmasına dayandırmaktadır. Veri sınıflarının BS bakıĢ açısıyla
tanımlanması, tanımlama aĢamasında seçilen VK boyutlarına dayanan VK
ölçütlerinin geliĢtirilmesini sağlayan veri varlıklarının ve bu varlıklarının
belirlenmesiyle sonuçlanmaktadır. VK ölçütleri, ölçme aĢamasında, VKD
yöntemleriyle kredi riski verilerinin kalitesini değerlendirmek amacıyla kalite
performans göstergelerine dönüĢtürülmektedir. TVKY‟nin analiz aĢamasında VKD

ix
sonuçlarının analizi yetersiz VK performansının temel sebeplerini göstermektedir.
VK problemlerinin ve bunların temel sebeplerinin tespit edilmesi, kredi riski
yönetimi çerçevesinde bu problemlerin büyüklüğü, karmaĢıklığı ve kritikliğine göre
iyileĢtirme tekniklerinin önerilmesine öncülük etmektedir. Bu çalıĢmada kredi riski
çerçevesine uygun olarak özelleĢtirilen TVKY yaklaĢımı, gerçek bir banka örneği
üzerinde uygulanmaktadır. Uygulama sonuçları, bu tür yöntemlerin yetersiz VK‟ya
iliĢkin riskleri yönetmek amacıyla sektör genelinde uygulanmasının önemini ve
gerekliliğini göstermektedir. Ayrıca, bankaların kıdemli risk yöneticilerinin
katılımıyla; bankaların hem önerilen yaklaĢımın geçerliliğini, uygulanabilirliğini ve
kabulünü hem de kendi veri yönetiĢim faaliyetlerinin değerlendirmesini ele alan bir
anket uygulanmıĢtır. Anket sonuçları, ankete katılan bankaların söz konusu yaklaĢımı
bankalar bünyesinde kredi risk yönetimindeki veri kalitesine iliĢkin meseleleri ele
almakta önemli ölçüde yeterli bulduğunu göstermektedir.
Anahtar Kelimeler: Veri Kalitesi Değerlendirmesi, Toplam Veri Kalitesi Yönetimi,
Bilgi Sistemleri, Kredi Riski Yönetimi, Bankacılık

x
To my wonderful parents

xi
ACKNOWLEDGEMENTS
I would never have been able to conclude my dissertation without the guidance of
my advisors, and support of my family and my friends.
I am deeply grateful to my advisors Prof. Dr. Yasemin YARDIMCI ÇETĠN and Prof.
Dr. Semih BĠLGEN for their excellent guidance, invaluable support and patience in
finalizing this study during my difficult times. They have provided all flexibility
during the study which motivated me to maintain my study. I also specially thank to
Prof. Dr. BĠLGEN for his unique contribution to the achievement of the purpose of
this study with his critical feedbacks and persistence in reminding me to follow right
steps on the pursuit of providing significant contribution to the field.
I am also grateful to my family, especially my dad, for the motivation they provide
during the study.
I owe dear Serkan GÜNGÖR, the former Head of the Risk Management Department
at BRSA (BDDK) a debt of gratitude due to his invaluable support and opportunities
he provided during my study.
My sincere friends Selin Deniz UZUNOSMANOĞLU and Yakup TURGUT deserve
special thanks in supporting and helping me to finalize the study. I am also thankful
to my sincere friend Taha GÖKÖREN for the motivational support he provided
during the study.

xii
TABLE OF CONTENTS
ABSTRACT ................................................................................................................ vi
ÖZ .............................................................................................................................. viii
ACKNOWLEDGEMENTS ........................................................................................ xi
LIST OF TABLES .................................................................................................... xiv
LIST OF FIGURES ................................................................................................... xvi
CHAPTERS
1. INTRODUCTION .................................................................................................... 1
1.1 Problem Statement and Motivation ............................................................... 2
1.2 Scope of Study ............................................................................................... 2
1.3 Thesis Outline ................................................................................................ 3
2. LITERATURE REVĠEW ......................................................................................... 5
2.1 Data Quality and Data Quality Dimensions .................................................. 5
2.1.1 Data Quality ........................................................................................... 5
2.1.2 Data Quality Dimensions ....................................................................... 5
2.2 Data Quality Assessment ............................................................................... 8
2.3 Total Data Quality Management (TDQM) Program ................................... 10
2.4 Overview of Banking Risks and Credit Risk Management ......................... 10
2.5 DQA in Credit Risk Management ............................................................... 15
2.6 Basel Document Related to Data Quality of Risk Data ............................... 17
3. METHODOLOGY ................................................................................................. 21
3.1 Reasoning, Objectives and Requirements of the Proposed Approach ........ 21
3.1.1 Reasoning ............................................................................................. 21
3.1.2 Objectives ............................................................................................. 22
3.1.3 Assumptions and Requirements ........................................................... 22
3.2 Phases .......................................................................................................... 22
3.2.1 Phase 1: Definition of data quality ....................................................... 26
3.2.2 Phase 2: Measurement of Data Quality ................................................ 35
3.2.3 Phase 3: Analysis of data quality ......................................................... 45
3.2.4 Phase 4: Improvement of data quality .................................................. 47

xiii
4. IMPLEMENTATION AND RESULTS ................................................................ 49
4.1 Evaluation Credit Risk Data Forms ............................................................. 49
4.1.1 Content of Data Forms ......................................................................... 49
4.1.2 Evaluation of Data Forms .................................................................... 51
4.2 Data Quality Assessment: A Bank Case ..................................................... 58
4.2.1 DQ dimensions for credit risk data of ABC Bank ............................... 59
4.2.2 DQ metrics for ABC Bank ................................................................... 62
4.2.3 Analysis of results of DQA for ABC Bank .......................................... 72
4.2.4 DQ improvement actions for credit risk data of ABC Bank ................ 74
5. VALIDATION OF THE DQA APPROACH ........................................................ 77
5.1 General information about the participants of the questionnaire ................ 77
5.2 Findings of the Questionnaire ..................................................................... 78
5.2.1 Data Quality Assessment Activities within the Banks ......................... 78
5.2.2 Evaluation of the Banks regarding the Proposed Approach ................ 88
5.3 Evaluation of the Survey Findings .............................................................. 97
6. DISCUSSION AND CONCLUSION .................................................................... 99
6.1 Discussion ................................................................................................... 99
6.2 Conclusion ................................................................................................. 102
6.3 Contribution of the Study .......................................................................... 103
6.4 Limitations of the Study and Future Research .......................................... 103
REFERENCES ......................................................................................................... 105
APPENDICES ......................................................................................................... 109
APPENDIX A: DQ Dimensions Studied In the Literature .................................. 109
APPENDIX B: SQL Query Examples for DQ Dimensions ................................. 112
APPENDIX C: Current Process for Credit Risk Data Production and Reporting in
ABC Bank ............................................................................................................ 117
APPENDIX D: Planned Process for Credit Risk Data Production and Reporting in
ABC Bank ............................................................................................................ 118
APPENDIX E: Questionnaire for Data Quality Assessment of Banks‟ Credit Risk119
APPENDIX F: Curriculum Vitae ......................................................................... 132
xiv
LIST OF TABLES
Table 1 Risk calculation approaches according to Basel II (BCBS, 2006) ................ 13
Table 2 Comparison of SA and IRB approach ........................................................... 14
Table 3 Principles for risk data aggregation and risk reporting stated by BCBS
(2013). ........................................................................................................................ 18
Table 4 Outline of the customized TDQM approach for banking credit risk data ..... 23
Table 5 DQ dimensions for obligors .......................................................................... 31
Table 6 DQ dimensions for transactions .................................................................... 32
Table 7 DQ dimensions for credit protections ........................................................... 33
Table 8 DQ dimensions for relations among the entities ........................................... 34
Table 9 General forms of the DQ metrics developed for the DQ dimensions ........... 36
Table 10 DQ assessment methods (Borek et al., 2011). ............................................ 42
Table 11 Clustering data fields of credit risk tables according to their significance for
credit risk calculation ................................................................................................. 44
Table 12 Clients table and its fields ........................................................................... 50
Table 13 Credits table and its fields ........................................................................... 50
Table 14 Collaterals table and its fields ..................................................................... 51
Table 15 Redundant fields that can be removed conveniently ................................... 54
Table 16 Statistics for change in data field numbers of data tables ........................... 55
Table 17 Statistics for credit risk data tables of ABC Bank ....................................... 58
Table 18 DQ dimensions for clients table of ABC Bank ........................................... 59
Table 19 DQ dimensions for credits table of ABC Bank ........................................... 60
Table 20 DQ dimensions for collaterals table of ABC Bank ..................................... 61
Table 21 Results of SQL queries for uniqueness dimension ..................................... 65
Table 22 Results of SQL queries for completeness dimension .................................. 65
Table 23 Results of SQL queries for accuracy dimension ......................................... 66
Table 24 Results of SQL queries for consistency dimension ..................................... 67
Table 25 Clustering data fields of credit risk tables according to their significance for
credit risk calculation ................................................................................................. 68
Table 26 KQPIs and CQPIs for uniqueness dimension ............................................. 69
Table 27 KQPIs and CQPIs for completeness dimension .......................................... 69
Table 28 KQPIs and CQPIs for accuracy dimension ................................................. 70
Table 29 KQPIs and CQPIs for consistency dimension ............................................ 70
Table 30: CQPI results of DQ dimensions for different cases of KQPI weights ....... 71
Table 31 General information about the participants of the questionnaire ................ 78
Table 32 Classification of credit risk data by the banks ............................................ 81
Table 33 Average of scores assigned by the banks to the importance of the proposed
attributes of credit risk data entities by the banks ...................................................... 89

xv
Table 34 Banks' comment on deficiencies and possible improvement areas of the
approach proposed ..................................................................................................... 96
Table 35 Banks' comment on potential difficulties in practical application of the
approach ..................................................................................................................... 97
Table 36 Risk management system and the supplementary systems proposed for risk
management systems and possible domains that can be provided via those systems
.................................................................................................................................. 100
Table 37 Number of DQ metrics, KQPIs, and CQPIs developed for each DQ
dimension and entity ................................................................................................ 101

xvi
LIST OF FIGURES
Figure 1 The structure of Basel II framework (BCBS, 2006) .................................... 11
Figure 2 Aggregate share of risk types in terms of their amount in the Turkish
banking sector (November, 2015) .............................................................................. 12
Figure 3 Risk components appearing in risk function ................................................ 14
Figure 4 Outline of the phases of TDQM adapted for credit risk context ................. 25
Figure 5 Basic characteristics of an obligor, transaction, credit protection and credit
risk function ................................................................................................................ 26
Figure 6 System context diagram proposal for risk management system .................. 29
Figure 7 Example cases for data duplication due to credit and collateral matching .. 53
Figure 8 Decomposition of existing data tables to form a new data table (Credit Risk)
.................................................................................................................................... 55
Figure 9 Comparison of total number of data values between the existing and the
new schemas (all k-factors=1).................................................................................... 57
Figure 10 Comparison of total number of data values between the existing and the
new schemas (all k-factors=1,5)................................................................................. 57
Figure 11 Comparison of total number of data values between the existing and the
new schemas (all k-factors=2).................................................................................... 58
Figure 12 Performance of CQPIs of DQ dimensions for different cases of KQPI
weights ....................................................................................................................... 72
Figure 13 Banks' view on necessity for a specific approach for credit risk DQA ..... 79
Figure 14 Banks performing DQA activities in credit risk management ................... 79
Figure 15 Data quality assessment activities performed by the banks ....................... 80
Figure 16 Quantitativeness versus Qualitativeness of DQA methods used by the
banks ........................................................................................................................... 81
Figure 17 Data source systems used by the banks ..................................................... 82
Figure 18 Use of data quality dimensions across the banks ....................................... 83
Figure 19 DQA methods that are used by the banks .................................................. 84
Figure 20 Precedence of purposes of data quality assessment across the banks ........ 85
Figure 21 Data quality problems experienced by the banks ...................................... 85
Figure 22 The causes of data quality problems experienced by the banks ................ 86
Figure 23 Solutions for improvement of data quality performed by the banks ......... 87
Figure 24 Selection criteria for methods of data quality improvement ...................... 87
Figure 25 Self-evaluation of the banks on their DQA activities ................................ 88
Figure 26 Significance of attributes of credit risk data entities (obligors, transactions,
credit protections and credit risk function) assigned by the banks ............................ 90
Figure 27 Evaluation of the banks on appropriateness (comprehensiveness and
modularity) of the systems defined for credit risk management ................................ 91

xvii
Figure 28 Evaluation of the banks on relevancy of the DQ dimensions suggested by
the approach ............................................................................................................... 92
Figure 29 Evaluation of the banks on prioritization of individual indicator, i.e.
determination of their weights ................................................................................... 93
Figure 30 Expectations of the banks on detection of DQ issues by the approach
proposed ..................................................................................................................... 94
Figure 31 Banks' use tendency of the approach proposed ......................................... 95
Figure 32: Evaluation of the banks on satisfactoriness of the approach proposed .... 95
Figure 33 Comparison of evaluation of the banks on the approach and their own
DQA activities .......................................................................................................... 102
xviii
ABBREVIATIONS AND ACRONYMS
BCBS Basel Committee on Banking Supervision
BB Banking Book
BIS Bank for International Settlements
BPMN Business Process Modelling Notation
BRSA Banking Regulation and Supervision Authority (BDDK in Turkish)
CAR Capital Adequacy Ratio
CCF Credit Conversion Factor
CQPI Composite Quality Performance Indicator
CRA Credit Rating Agency
CRM Credit Risk Mitigation
CRMB Credit Risk Management for Banking
DBMS Database Management System
DQ Data Quality
DQA Data Quality Assessment
ETL Extract, Transform and Load
FK Foreign Key
ID Identity
IRB Internal Rating Based
IS Information Systems
ISIN International Securities Identification Number
IT Information Technology
KQPI Key Quality Performance Indicator
LGD Loss Given Default
MIS Management Information Systems
PD Probability of Default

xix
PK Primary Key
RWA Risk-Weighted Asset
SA Standard Approach
SME Small and Medium sized Enterprises
SQL Structured Query Language
TB Trading Book
TDQM Total Data Quality Management

xx

1
CHAPTER 1
INTRODUCTION
Acquisition, processing and use of data play an essential role for all business
organizations in maintaining their business activities during their life cycle. As
regards the financial systems and their stakeholders such as financial institutions,
investors, customers, related government bodies and regulators; the criticality and
significance of data and its quality which can be measured in different dimensions is
indispensably high in terms of maintaining a safe and sound financial system. Banks
or credit institutions constitute a significant portion of any macro-level financial
system. Information systems (IS) of those institutions are expected to meet
requirements related to quality of data. As size and complexity of financial data
processed in databases of those institutions increase, the need for assessment of data
quality (DQ) becomes more crucial. Data quality assessment (DQA) techniques and
methods increase and diversify as the complexity and size of data flowing through
information systems of banks reach the point where quality assurance becomes
difficult and hardly controllable. Moges et al. (2013) highlight that the risk of poor
DQ increases as a result of collection and maintenance of larger and more complex
information resources. Yin et al. (2014) put emphasis on the implications of DQ
related problems on banks in terms of direct economic impact, and influence on
strategic decisions of the banks.
International standards on regulatory capital measurement of banks set and imposed
by the Basel Committee on Banking Supervision1 (BCBS) is evolving since the first
framework referred as Basel I. Implementation of next frameworks, Basel II and
Basel III, requires producing and dealing with a huge amount of data related to
banks‟ exposures. For sound risk management, banks should manage their credit risk
data properly and ensure their quality. Therefore, data quality management and data
governance under appropriate and well-established management information systems
(MIS) have become crucial aspects of risk management practices. Data quality
management and assessment play an important role for a sound and safe financial
system in which financial risks are controlled and mitigated.
Emphasizing the significance of data quality management and assessment for risk
management activities of banks, Basel Committee on Banking Supervision (BCBS)
has published a document that introduces “principles for effective risk data
1BCBS is the primary global standard-setter for the prudential regulation of banks and provides a
forum for cooperation on banking supervisory matters. Its mandate is to strengthen the regulation,
supervision and practices of banks worldwide with the purpose of enhancing financial stability.
Turkey is a member of the Committee. (https://www.bis.org/bcbs/).

2
aggregation and risk reporting”. The document suggests numerous principles to
improve risk data aggregation capabilities of banks and their risk reporting practices.
The principles cover four main issues. These are data governance and infrastructure,
data aggregation and reporting and review of first three issues by the supervisory
authority.
1.1 Problem Statement and Motivation
Accurate calculation and allocation of regulatory and economic capital require banks
to accumulate and utilize high quality of risk data. Low quality data may cause
uncertainties in accurate quantification and measurement of banking risks involved.
Low quality data may stem from numerous reasons. It may be due to unhealthy
process of data accumulation as well as structural problems in data aggregation
capabilities of the bank. Such problems may cause missing or incorrect data values
and inconsistencies among different datasets. Considering the amount and type of
data accumulated, utilized and stored in databases of banks, such data related
anomalies can lead to ambiguity in materialization of banking risks, thus,
underestimation or overestimation of these risks and capital to be held. Therefore,
banks must define clear data taxonomies consistently with the general regulation
schemas of the Basel Accords and in accordance with overall information technology
(IT) requirements. In addition to structural requirements of data itself, referential
integrity among data tables and datasets is critical to sound risk management
practices. Definition and measurement of quality of risk data depend on the content
of data taxonomies. Data quality requirements which are expressed by quality
dimensions or attributes may differ from one data type to another. Therefore, DQ
dimensions of each data type in concern for DQ assessment should be defined
accordingly. Each dimension implies development of its own DQ metrics. DQ
metrics are key to assess DQ of risk data. Assessment of performance of DQ metrics
paves the way to detect underlying causes of low data quality. Detection of problems
related to data quality may lead to correction in the existing information system or
employment of a new one instead of the outdated one.
There are valuable studies attempting to assess DQ of financial risk data. These
studies are outlined in Sections 2.2 and 2.5. However, these studies do not go beyond
the definition of data quality dimensions for financial data. This reveals the clear
need for thorough assessment of data quality of financial data. Increasing
sophistication in measurement and evaluation of banking risk data, if not controlled,
gives rise to challenges threatening ensuring data quality such as discrepancies
among multiple data sources that are used for common operations and increasing
manual workarounds. Application of suitable DQA methods is important for
maintaining sound risk management system as its findings or inferences are critical
for improvement activities. Thus, they ultimately contribute to building integrated IT
systems containing well-defined data taxonomies and centralized data repositories in
which reconciliation of different data sources is ensured.
1.2 Scope of Study
Financial data owned and used by financial institutions consist of various data types.
The scope of the present study only covers credit risk data used by credit institutions,
i.e. banks. The present study will focus on data quality assessment of credit risk data
3
from an IS viewpoint since it constitutes a major portion of the overall risk exposure.
A Total Data Quality Management (TDQM) approach is adopted since its phases are
suitable for credit risk context. Phases of TDQM are followed in the study to define
DQ dimensions and metrics to be used in DQ assessment. TDQM consists of
definition, measurement, analysis and improvement phases. The study covers all four
phases to adapt credit risk data to TDQM. The definition and the measurement
phases of the proposed approach are deeply elaborated in the present study. The
analysis and the improvement phases are also paid considerable effort in the study.
1.3 Thesis Outline
The study will first consider the data quality concept and its dimensions by reviewing
the literature and data quality assessment methods studied in the literature. Then, the
subjects of what DQ assessment means to banking risk data and how it can serve the
assessment of the DQ of risk data will be explored. Chapter 3 will examine the
taxonomy of overall risk data by focusing on credit risk, define DQ dimensions for
credit risk data by benefiting from previous studies, and develop metrics for each DQ
dimension defined. In fact, definition of these metrics constitutes the fundamental
contribution of the present study. Chapter 4 discusses the implementation of the IS
components that will support TDQM in the specific case of the Turkish supervisory
authority, Banking Regulation and Supervision Agency (BRSA, BDDK in Turkish).
Chapter 5 presents the findings of a survey carried out on a number of banks in order
to get feedback on validity, applicability and acceptance of the proposed approach.
Chapter 6 discusses on the findings of the study, contribution of the study to the field
of DQA in the context of credit risk management, conclusion of the study, limitations
for the study, and suggestions for future research.

4

5
CHAPTER 2
LITERATURE REVİEW
This chapter reviews the literature review on the data quality concept, data quality
dimensions and data quality assessment. It also refers to the studies addressing the
necessity for DQ assessment of banking risk data from an IS viewpoint in addition to
justification and motivation of such assessment by the banking regulations and
frameworks, i.e. Basel frameworks.
2.1 Data Quality and Data Quality Dimensions
2.1.1 Data Quality
It is hard to define data quality since data itself may be quantitative or qualitative,
and its value may be derived according to different fields or disciplines. Data quality
can be defined and understood differently in terms of specific task or context.
Therefore, there is no clear-cut definition of data quality. Due to dependence on
context or its use, data quality is often referred as „fitness for use‟ in the quality
literature. Wang and Strong (1996) giving reference to this general definition, define
data quality as “data that are fit for use by data consumers”. Juran (1999), an
authority in the field of quality management, suggests that data are of high quality if
they are fit for their intended uses in operations, decision making and planning.
Alternatively, the data can be regarded as of high quality if it correctly represents the
real world construct to which they refer. Kahn and Strong (1998), and Huang et al.
(1998) also refer to the satisfaction of users‟ needs or expectations while defining
data quality. Based on those views, high or poor quality of data can be interpreted
differently according to purpose of use of data. That would imply that data may be
viewed as having poor quality by a party while it can have high quality for another
party based on their intended use.
As data quality concept can be interpreted differently in different disciplines, its
definition, measurement and assessment can be based on different dimensions. Such
multi-dimensional nature of data quality is emphasized by Pipino et al. (2002),
Redman (1996), Wand and Wang (1996), and Wang and Strong (1996).
2.1.2 Data Quality Dimensions
Quality of data should be measured along with various dimensions and attributes of
data. Determination of these dimensions is key for defining metrics for data quality
and measuring it accordingly. Data quality can be perceived differently in different
contexts. In Section 2.1.1 it is pointed out that perception data quality depends on the

6
purpose of users of data within certain context. Data users or “data customers” are
those who need data to process according to a specific purpose. Implying the nature
of data quality of dependence on the context, Wang and Strong (1996) define data
quality dimension as set of attributes that represent a single aspect or construct of
data quality.
Determination of data quality dimensions depends on the purpose of use of the data.
Therefore, there is no definite set of dimensions. Accordingly, it should be
determined on task basis and the nature of data quality problem. Due to that nature,
there are considerable differences in the definition of data quality dimensions. These
differences are revealed in various data quality related studies. Different data quality
assessment methods use different sets of data quality dimensions. There are also
discrepancies in the exact meaning of same dimensions. Overwhelming DQ
dimensions explored or mentioned in numerous studies are accuracy, completeness,
consistency and timeliness.
Wang and Strong (1996) define accuracy as “the extent to which data are correct,
reliable and certified free of error”. Redman (1996) instantiates the definition of
accuracy as the measure of proximity of data value x to another value x‟ whose
correctness is assumed. Dejaeger et al. (2010) give definition of accuracy similar to
that of Redman as the degree of correct representation of real-life values in terms of
not only syntactic accuracy but also semantic accuracy. Syntactic accuracy is much
more related to organization and order of data while semantic accuracy is much more
related to what data means or refers. Batini et al. (2009) emphasizes that only
syntactic accuracy is considered in data quality assessment methods. Ballou and
Pazer (1985) also view accuracy as correspondence of data to real-world values.
Dejaeger et al. (2010) refer to consistency as fulfillment of constraints for each
observation. The study highlights two aspects of this dimension which are intra-
relational consistency and inter-relational consistency. The first aspect is related to
consistency of all records within a data set while the latter one is related to
consistency of rules applied to records in one data set with another data set. Batini et
al. (2009) refer the consistency as the no violation of semantic rules defined over
some data set. Integrity constraints in relational databases are given as examples of
such semantic rules. Like Dejaeger et al. (2010), Batini et al. (2009) also mentions
two categories of integrity constraints which are intra-relation constraints and inter-
relation constraints.
In the study of Dejaeger et al. (2010), completeness is referred to the extent of
missing and duplicate values. Here, completeness implicitly inherits uniqueness
dimension. Sometimes, those two dimensions are evaluated simultaneously in the
literature. Batini et al. (2009) define completeness as the degree of inclusion of data
describing real-world objects in a given data collection. Redman (1996) similarly
defines it as the degree of inclusion of values in the data collection. Definition of
completeness in Wand and Wang (1996) somewhat differ as they define it in terms
of information systems. They refer it as the ability of information systems to
represent every meaningful state of real systems. Definition of Wang and Strong
(1996) is based on tasks concerned in terms of sufficiency in breadth, depth and
scope. Jarke et al. (1995) define completeness according to data warehouse
requirements as the rate of real information captured in data warehouse. Bovee et al.
(2001) are interested in completeness of entity data as such information for entity

7
description should include all necessary aspects of the entity. Liu and Chi (2002)
refer completeness to all values supposed to be collected as per “collection theory”.
Naumann (2002) has completeness definition similar to that is referred in Dejaeger et
al. (2010) as the ratio of number of non-null values in data source to the size of
universal relation. Completeness is usually related to not having null or missing
values in relational databases. However, missing data can be attributed to different
reasons. Existence or missing of data could be either certain or ambiguous.
Time-related dimensions are considered differently in the literature. Time-related
aspects of data quality outspoken in the literature are currency, volatility and
timeliness. Dejaeger et al. (2010) refer to currency as immediate update of data,
volatility as frequency of updates of date and timeliness as retrieval of recent data
upon specific request. Wand and Wang (1996) refer to timeliness aspect to delay
between change in real world state and corresponding modification in information
system state. Redman (1996) focuses on the currency aspect and defines it as the
degree of being update of data considering the fact that it takes some time to retrieve
the correct and updated value. Redman‟s definition of currency resembles to Wand
and Wang‟s definition of timeliness in terms of attribution to delay in update in
contrast to Dejaeger et al. who consider two terms as different concepts. Wang and
Strong (1996) maintain the focus on task in defining time-related dimensions. They
define timeliness as the extent of appropriateness of data age for a given task. That
definition is consistent to that referred in Dejaeger et al. Liu and Chi (2002) also
define timeliness aspect in accordance with Wang and Strong and Dejaeger et al. as
the extent of sufficiency of data in being up-to-date for a specific task. Bovee et al.
(2001) suggest timeliness has two components that are currency and volatility.
Currency is considered measure of information age which corresponds to timeliness
definition of Wang and Strong, Liu and Chi and Dejaeger while volatility is
considered measure of information instability, that is, the frequency of the change of
a value. Jarke et al. (2005) suggest two time-related dimensions which are currency
referring to entrance date of information to data warehouse and volatility referring to
time period for validity of data in real world. Volatility definition of Jarke et al.
implies frequency mentioned in Bovee et al. and Dejaeger et al. Nauman‟s (2002)
definition of timelines which is the average age of data in a source resembles to that
of Jarke et al. except for average calculation involvement.
DQ dimensions are not limited to accuracy, consistency, completeness and time-
related dimensions. Dejaeger et al. (2010) count comprehensibility and security as
other frequently mentioned dimensions in addition to those dimensions. Wang and
Strong (1996) group fifteen DQ dimensions under four DQ categories as important
data quality dimensions as a result of statistical analysis of interviews. These DQ
categories are intrinsic DQ, accessibility DQ, contextual DQ and representational
DQ. Intrinsic DQ refers to the extent to which data values are in conformance with
the actual values. Contextual DQ refers to the extent to which data are applicable to
the task of the data user. Representational DQ refers to the extent to which data are
presented in clear manner. Accessibility DQ refers to the extent to which data are
available. Moges et al. (2011) added three more dimensions (alignment, actionability
and traceability) to those selected by Wang and Strong while exploring DQ
dimensions relevant to credit risk assessment. Batini et al. (2009) gathered and
grouped DQ dimensions used by various methodologies while comparing these

8
methodologies. DQ dimensions that are mostly cited in the literature are compiled
and presented in APPENDIX A.
2.2 Data Quality Assessment
The significance of DQ varies among different organizations based on the role and
the significance of IS within their organizations. Gozman and Currie (2015) identify
data aggregation and management as one of the IS capabilities that an organization
should achieve. Maturity level of the organization in that IS capability also reflects
the attitude of the organization towards DQA. As the maturity level of the
organization in the IS capability of data aggregation and management increases,
advanced controls over the quality of data mount up. The significance of DQA grows
as organizations put more emphasis on the achievement of IS capabilities.
Data quality dimensions are identified and defined keeping in mind the goal of the
task or context in an organization. Yin et al. (2014) remark that the selection of
various DQ dimensions plays substantial role in the process of DQA, and emphasize
on establishing multi-dimensional DQA system avoiding focusing on an individual
dimension. Woodall and Parlikad (2010) define DQA as the process of “obtaining
measurements of DQ and using these measurements to determine the level of DQ
improvement required”. Thus, identifying data quality metrics is crucial in the
assessment of data quality and taking necessary actions for improvement of data
quality. Besides DQ metrics, questionnaires can also be used for DQA. Lee et al.
(2002) developed a methodology for information quality management to assess
quality of data using questionnaires. The study is focused on assessing information
quality independent from the domain via subsequent questionnaires in order to
identify relevant quality dimensions for benchmarking and to obtain information
quality measures which are to be compared to benchmarks. Use of either DQ metrics
or questionnaires implies that DQA can be based on objective measurement or
subjective judgment. Pipino et al. (2002) described objective and subjective
assessment of data quality and presented how to combine them. They proposed three
prevalent functional forms for objective assessment of DQ which can be used to
develop DQ metrics to be used in practice. The functional forms addressed in the
study are simple ratio, min or max operation, and weighted average. These
functional forms are stated to be crucial in developing metrics for DQA in the study.
Simple ratio is used to measure the ratio of desired outcomes to total outcomes.
Accuracy, consistency and completeness dimensions take this form according to the
study. We also use the simple ratio form in the measurement phase of the present
study while developing DQ metrics for credit risk data but we measure “undesired
outcomes rather than desired outcomes.
Increasing diversity and complexity in these techniques due to evolving nature of
information system lead to development of different assessment methods in order to
systematically perform data quality assessment. Batini et al. (2009) attribute such
differentiation and specialization in DQA methods and techniques to the evolution of
information and communication technologies from monolithic structure to network-
based structure which leads to growth in complexity of DQ. Therefore, studies on
DQA focus on subset of DQ issues rather than all DQ issues.

9
Besides DQA methods specialized according to various subjects, hybrid approaches
are also studied in order to span more than one field in DQA. Woodall and Parlikad
(2010), and Woodall et al. (2013) proposed such a hybrid approach in order to assess
and improve data quality of not only in a specific context but within various contexts.
Since some of the existing assessment techniques cover only some specific area and
some of them are more general to address specific requirements, the hybrid approach
is presented to generate usable assessment techniques for specific requirements using
the activities of assessment techniques. These activities are identified via DQA
techniques existing in the literature.
Borek et al. (2011) present classification of data quality assessment methods and map
them according to taxonomy of DQ problems which are gathered from previous
studies in terms of context dependence and data and user perspectives. Their study
focuses on the existing methods such as data profiling, schema matching, lexical
analysis and semantic profiling. These methods are mapped to the most common DQ
problems. Mapping tables are constructed separately for context dependent and
context independent problems.
Implementation of DQA approaches is spread over different areas. Wang (1998)
proposed a DQA approach named “Total Data Quality Management” treating
information flowing through a certain organization as an information product as
inspired from manufacturing process (See Section 2.3). The approach is not specific
to any context although there are many references to TDQM by studies from various
fields from health to finance (Moges et al. (2013) and Kerr (2006)). Jeusfeld et al.
(1998) present an approach that studies design and analysis of quality information for
data warehouses by building a quality metadata model for warehouses that can be
used for design of quality and analysis of quality measurements. English (1999) also
proposes an approach called “Total Information Quality Management” to assess
information quality of data warehouses taking economic feasibility into account in
consolidating data sources. Loshin (2004) also considers economic feasibility aspects
in evaluating the cost-effect of poor quality data based on data quality scorecards.
Long and Seko (2005) propose a cyclic-hierarchical approach for assessment of the
quality of health data with a data quality framework and analysis of frequency of
data access. Falorsi et al. (2003) developed an approach to be used in databases of
local public administrations in order to collect high quality statistical data on citizens
by providing quality of data integrated from different local databases. Su and Jin
(2004) proposed a method to assess product information quality based on activities in
manufacturing companies. The assessment and improvement of product information
quality are performed in accordance with the organizational goals of the company.
Scannapieco et al. (2004) studied DQA in cooperative information systems and DQ
challenges faced in such systems. Batini and Scannapieco (2006) proposed a
complete data quality methodology that helps to select optimal data quality
improvement process with maximum benefits within the given budget limits. Eppler
and Münzenmaier (2002) provided a framework for the assessment of web data. De
Amicis and Batini (2004) studied the assessment of data quality in finance field and
define quality metrics specifically for financial data using both quantitative objective
and qualitative subjective assessments to identify quality issues and select suitable
activities for data quality improvement. Bai et al. (2012) present an approach
involving Markov decision process in order to manage the risks related to the quality
of data in accounting management systems.

10
2.3 Total Data Quality Management (TDQM) Program
Total Data Quality Management (TDQM) can be regarded as the first well-founded
approach related to data quality assessment proposed by Wang (1998). Wang derived
TDQM from Total Quality Management (TQM) which is used for product quality.
This approach consists of four phases which are definition, measurement, analysis
and improvement. Implementation of the TDQM cycle aims to improve quality of
information product (IP) continuously. Definition phase involves identifying
information quality (IQ) dimensions and IQ requirements. Measurement phase is
related to production of IQ metrics. Analysis phase is concerned with identifying
fundamental causes of IQ problems and measuring the impact of poor quality of
information. The last phase of the cycle, improvement phase, is devoted to develop
techniques for IQ improvement. Wang inspired by the terminology of TQM, defines
IP as the output produced by information manufacturing system (IMS). Such
description leads Wang to identify four roles relevant to IP and IMS. These roles are
information suppliers who create or collect data for the IP, information
manufacturers who design, develop or maintain the data and system infrastructure
for the IP, information consumers who use the information for their business and IP
managers who are responsible for managing whole information production process
throughout the information life cycle. TDQM is performed iteratively through the
cycle implying that fitness of data for the use of IP customers should be checked at
each definition phase according to changing requirements.
Use of TDQM is adopted in different fields due to its adaptability to the requirements
of those fields. Finance or banking is one of those fields. More specifically, TDQM
can be used in credit risk management. Studies of Moges et al. (2011) and (2013),
and Moges (2014) can be given as the examples of such use.
Thus, in order to specify data quality requirements, outline of the credit risk context
should be pictured. Determination of boundaries for credit risk will contribute to
identify data taxonomies and DQ dimensions relevant to such taxonomy.
2.4 Overview of Banking Risks and Credit Risk Management
Identification and classification of risks under capital requirement phenomenon is
based on Basel Accords. Viable framework for quantitative aspects of capital
standards is Basel II (BCBS, 2006). The framework presents standardized
terminology and taxonomy for calculation of risk exposure to determine capital
holding level for banks. This standard for identification and classification of risk
allows banks, the most important component of the financial sector, to design their
IT infrastructure in accordance with international standards for risk management
system. Although the core function of banks is not risk management but rather
allocation of credits and financial transaction in various financial markets, it is hard
to survive in the system and maintain their functions in a sustainable manner without
involvement of a sound risk management system. Therefore, they have to incorporate
risk management system into their information system and provide reconciliation of
risks with accounting information. This reconciliation contributes to achievement of
building risk management system with controllable and measurable size within the
standards predefined by the framework.

11
The Basel framework is a widely accepted international standard; therefore, stands at
the backbone of risk management activities and IT requirements relevant to such
activities. The framework consists of three pillars as shown in Figure 1. The very
first pillar handles quantitative aspects of risk management, namely minimum capital
requirements. The second pillar is regarding key principles of supervisory review,
risk management guidance and supervisory transparency and accountability
produced by the Basel Committee with respect to banking risks. The third pillar is
related to market discipline which involves guidance of public disclosure
requirements for banks in order to provide transparency of bank information to
market participants.
Figure 1 The structure of Basel II framework (BCBS, 2006)
Quantification and calculation of the risks are ultimately aggregated and represented
as capital adequacy ratio (CAR). CAR is defined as the regulatory equity divided by
overall sum of credit risk exposure amount, market risk exposure amount and
operational risk exposure amount (BRSA, 2014). CAR is the most important overall
quantitative indication of how much capital is hold against the calculated risks of the
bank. CAR must be above specific threshold, i.e. minimum regulatory ratio, which is

12
imposed by the supervisory authority over the banks in accordance with the Basel
Accords (the framework).
As the definition of Capital Adequacy Ratio implies there are three constituents of
capital adequacy other than regulatory equity. These are credit risk, market risk and
operational risk. Those risk types addressing exposures of banks are the subject of
capital requirement calculation.
The Basel framework refers to credit risk as the risk of loss on an obligation due to
default of the obligor and thus failing to make payments of that obligation. In
calculation of credit risk exposure amount; credit type, risk weight associated with
that credit type or the credibility of the obligor, collateral types if exist are important
parameters. The framework refers to market risk as the risk of loss of positions in
banks‟ assets due to fluctuations in market prices. Equity risk, commodity risk,
interest rate risk and currency risk are under this category. It refers to operational risk
as the risk of loss resulting from inadequate or failed internal processes, people and
systems or from external events (BCBS, 2006). Credit risk is the biggest constituent
of overall risk-weighted exposure amount (about %90) compared to market risk and
operational risk in terms of their amount (see Figure 2). Each risk type requires the
creation or collection of its own data set based on data entities identified under the
risk type. This study will focus on data sets created or collected for measurement of
credit risk.
Figure 2 Aggregate share of risk types in terms of their amount in the Turkish
banking sector (November, 2015)2
Thus, CAR has four components: regulatory equity in the numerator and sum of risk-
weighted amounts of credit risk, market risk and operational risk in the denominator.
2 BRSA, Interactive monthly bulletin for Turkish Banking Sector,
http://ebulten.bddk.org.tr/ABMVC/tr/Gosterim/Gelismis
89,99%
7,27% 2,75%
Distribution of Risk Exposure Amount (November, 2015)
Credit Risk Exposure
Operational Risk Exposure
Market Risk Exposure

13
Regulatory equity is obtained by adding/subtracting specific accounting items
to/from accounting equity (BRSA, 2014). On the other hand, risk-weighted amounts
related to credit risk, market risk and operational risk are calculated via different
approaches and methods according to risk type and calculation complexity in Basel
II (See Table 1).
Calculation approaches for each risk type shown in Table 1 demonstrate an evolution
from the basic approach to the advanced approach for each risk type. Basic and
standard approaches are deterministic implying that parameter values are predefined
based on risk nature and mandated by regulations. That is, standard risk weights
which are derived from the external ratings given by credit rating agencies (CRAs)
are employed. Advanced approach is usually driven by statistical models. It has a
stochastic nature implying that it requires data gathering and statistical estimation
methods applied on that data set. Ratings are generated internally by this stochastic
approach. This approach sometimes involves overrides, i.e. expert judgment that can
manipulate results generated statistically. Each approach requires different data
taxonomies and requirements. In terms of data quality assessment, criticality of data
quality and type of DQ dimensions may change due to changing complexity of data
requirement while certain quality requirements still remain effective.
Table 1 Risk calculation approaches according to Basel II (BCBS, 2006)
Complexity
Level
Credit Risk Market Risk Operational Risk
Simple Simplified Standard
Approach
N/A Basic Indicator
Approach
Medium
Standard Approach
Standard
Method
Standardized
Approach
Alternative
Standardized
Approach
Advanced Foundation Internal Rating
Based Approach
Value at Risk
Models
Advanced
Measurement
Approaches Advanced Internal Rating
Based Approach
Risk Function
Capital requirement of a bank for credit risk exposures can be calculated via two
basic approaches according to the Basel framework. These are standard approach
(SA) and internal rating based (IRB) approach. The basic difference between them is
the determination of risk weights of an exposure. While only external ratings given
by CRAs are used in the risk function under SA, internal ratings are used in the risk
function under IRB approach. IRB approach has specific risk functions including
statistical parameters and correlation terms. Comparison of SA and IRB approach in
terms of their approach to risk quantification is given in Table 2. Fundamental

14
factors that somewhat affect the credit risk function are worked out and compiled
from the rules enforced in the Basel framework, and outlined in Figure 3.
Figure 3 reveals that there are three main components characteristics of which
constitute the drivers of credit risk function. These components can be candidates for
root data tables which support credit risk management practices. Those candidates
should be taken into consideration in design and development of data architecture
and IT infrastructure of banks for data governance, data quality management and
credit risk management purposes. The present study will consider those candidates in
identification of data taxonomy for credit risk data in the definition phase of the
approach proposed below in Section 3.2.1.1.
Table 2 Comparison of SA and IRB approach
Comparison item Standard Approach IRB Approach
Regulatory capital
requirement for credit
risk
8% × ∑ Risk-weighted
assets (RWA)
8% × ∑ Risk-weighted
assets (RWA)
Risk weights based on External ratings Internal ratings (function of
PD* and LGD**)
Risk function Deterministic Stochastic *PD: Probability of Default (statistically obtained from dataset)
**LGD: Loss Given Default (statistically obtained from dataset or provided by the regulation)
Figure 3 Risk components appearing in risk function
Credit Risk Function
Transaction • Credit Conversion
Factor (CCF)
• Exposure Amount
• Adjustments (Price & Maturity)
Obligor • Internal Ratings
(PD) / External Ratings Credit
Protection
• Amount (Value)
• Allocation Amount
• Provider Ratings
• Adjustments (Price, FX & maturity)

15
2.5 DQA in Credit Risk Management
One of the business sectors most closely involved with DQA is the financial sector
due to strong dependence of banking business to processing of huge chunks of data
belonging to investors and customers. Yin et al. (2014) assert that DQA has become
an indispensable part of data quality management in the banking sector.
Basel II and Basel III frameworks also address importance of data quality
management and data governance under appropriate and well-established MIS as
they become crucial aspects of risk management practices due to requirement for
producing and dealing with huge amount of data related to banks‟ risk exposures
(BCBS, 2006). For sound risk management, banks should ensure the quality of those
data and manage the bulk of the data properly.
Data quality management and assessment play an important role for sound and safe
financial system in which financial risks are controlled and mitigated. Gozman and
Currie (2015) count data aggregation and management as one of the IS capabilities
that a financial organization should achieve in order to manage and support
governance, risk and compliance. Capability of data aggregation and management is
the key for ensuring DQ of a financial organization.
According to the BCBS, a sound risk management system should have appropriate
MIS at the banking sector and bank-wide level.
Financial institutions, particularly banks, have to identify and control risks to which
they are exposed due to their operations in order to maintain their functions in a safe
and sound manner. Therefore, they need to identify and quantify these risks clearly.
Risk types relevant to the financial sector are identified in the Basel II framework
issued by the Basel Committee (BCBS, 2006). The framework consists of three
pillars which are minimum capital requirements (Pillar 1), supervisory review
process (Pillar 2) and market discipline (Pillar 3). Quantifiable risks that affect
calculation of regulatory capital requirement lie under Pillar 1. These risks are credit
risk, market risk and operational risk. These risks have been defined above in Section
2.4. Banks hold capital in order to manage these risks. There are also other risk types
referred in Pillar 2 such as systemic risk, concentration risk, liquidity risk,
reputational risk, strategic risk, legal risk and residual risk; however, these risks are
not considered in calculation of the capital requirement since they are hard to
quantify.
There are a handful of studies focusing on DQA in credit risk management in the
literature. Studies performed by Moges et al. (2011) and (2013), Moges (2014),
Bonollo and Neri (2011), Dejaeger et al. (2010), and Yin et al. (2014) emerge as the
prevailing ones in this subject.
Moges et al. (2011) identified important data quality dimensions for credit risk
assessment using surveys conducted with credit risk managers of 150 financial
institutions sampled out from 500 financial institutions across the world. Findings
and statistical analysis of the survey revealed most important DQ dimensions from
the perspective of credit managers. The study also identified major DQ challenges
and their causes in financial institutions. Multiplicity of data sources and
inconsistencies in data value and format are found to be the most repeated problems
within those institutions. In addition, manual data entry operations emerged as the

16
major cause of those problems. Although the study suggests the implementation of
TDQM methodology proposed by Wang (1998) and consisting of the DQ definition,
measurement, analysis and improvement phases, it only focuses on DQ definition
phase in which DQ dimensions are determined via statistical analysis of the results of
interviews. It does not go beyond exploring DQ dimensions important for credit risk
assessment and identifying DQ challenges and their causes. Moges et al. (2013) and
Moges (2014) took the study forward by further exploring subsequent phases of
TDQM. They identified the most important DQ dimensions by conducting
questionnaires to the financial institutions, and then they assessed DQ level of credit
risk databases using these dimensions. After assessment of DQ of credit risk data,
DQ challenges revealed by the DQA are analyzed and possible improvement actions
are suggested. DQA of credit risk context is performed by a scorecard index
developed. Definition, measurement and analysis phases of TDQM are performed
using questionnaires rather than development of metrics. Statistical tests are used to
identify the most important DQ dimensions. DQ levels of credit risk databases are
evaluated by a weighted average model in which the distributions of the weighted
averages of DQ categories are compared to each other based on a scale ranging from
very good to worst. The scorecard index is used to assess DQ level and to identify
problematic areas. In our study, we used DQ metrics identified by analyzing data
taxonomy of credit risk data in accordance with Basel rather than questionnaires
which constitutes the backbone of the studies of Moges et al. (2013) and Moges
(2014).
Dejaeger et al. (2010) select the mostly explored six DQ dimensions in the literature
instead of statistical analysis for the selection of DQ dimensions in order to analyze
data quality of credit rating process in financial sector. Their study focuses on
business processes in order to detect the critical errors likely to occur in these
processes. The methodology of the study involves designing and using a
questionnaire based on ETL (Extract Transfer Load) approach in which data
creation, extraction, load and manipulation are performed in different processes
through the data source and the destination database. The questionnaire consists of
several questions that address various parts of ETL approach. Those parts are
collection, analysis and warehousing aspects. Collection aspect involves
comprehensibility dimension which deals with to what extent data format of source
data is standardized, and consistency dimension deals with standardization of
inconsistent data. Analysis aspect is related to data analysis and data transformation,
and it involves comprehensibility and time dimensions. Warehousing aspect is
related to conveying data transformed and analyzed to the following phases of the
process. This aspect involves inconsistency and comprehensibility dimensions.
Business Process Modelling Notation (BPMN) in combination with the questionnaire
is used to visualize the process of credit rating in order to identify flow of data
through the process. The DQ dimensions defined in the definition phase of our study
analogous to those selected in the study of Dejaeger et al. (2010).
There are also approaches to DQA which combine both qualitative and quantitative
aspects. Yin et al. (2014) present an approach based on analytic hierarchy process for
the assessment of quality of banking data. The study proposes an evaluation index
system in which weights of the coefficients of the indexes are determined by the
method based on analytic hierarchy process. The indexes are used to evaluate the
quality of banking data.

17
Bonollo and Neri (2011) examined issues related to data quality in banking based on
regulatory requirements of the Basel framework and proposed best practice analysis
to tackle these issues. The study proposes four-step analysis consisting of
examination of silo organization of risk data, review of existing data quality
regulations in the financial sector, best practice proposal regarding a centralized
approach to risk data and the centralized data approach combined with a sensitivity
technique for effective data quality strategies and indicators. The best practices for
the governance of data quality proposed by the study focuses on two main
approaches which are a centralized approach to data quality and the integration
between risk and finance. The study also distinctively makes a proposal that can
improve data quality metrics. The proposal involves definition of a data quality
assessment process based on DQ dimensions in four macro steps. These steps are
outlined as follows:
1. Definition of variables
2. Definition of DQ dimensions for each variable
3. Assignment of weights to data performing poor quality on certain dimension
4. Development of key quality indicators which can be derived from weighted
averages of the results of quality examinations
One of the significant contributions of the study to the measurement of data quality is
proposing key quality indicators which are generated from a bottom-up process. The
aim is to perform data quality controls starting from bottom level and attain high
level key quality indicators which should be weighted or rescaled with respect to
their criticality in risk measurement. The present study also elaborates on that notion
while developing quality performance indicators in Chapter 3.
2.6 Basel Document Related to Data Quality of Risk Data
As the 2007-2008 global financial crisis revealed the inadequacy of IS of financial
institutions in managing their financial risks, the need for new regulatory obligations
has emerged. Basel Committee on Banking Supervision (BCBS) which is responsible
for preparation of international capital standards, i.e. the Basel framework, has been
forced to revise the framework following the detrimental effects of the crisis.
Supplementary rules to the framework have also highlighted the need for sound MIS
of banks. Furthermore, the Committee has published a document titled “Principles
for effective risk data aggregation and risk reporting” (2013). The paper suggests
fourteen principles eleven of which are regarding banks and the rest are regarding
supervision authority to strengthen risk data aggregation capabilities of banks and
their risk reporting practices. The principles are accumulated in four sections. The
framework of these principles and their aspects are given in Table 3.
.

18
Table 3 Principles for risk data aggregation and risk reporting stated by BCBS
(2013).
Section Principle
No
Principle Aspect
Overarching governance
and infrastructure
P1 Governance
P2 Data architecture and IT infrastructure
Risk data aggregation
capabilities
P3 Accuracy and Integrity
P4 Completeness
P5 Timeliness
P6 Adaptability
Risk reporting practices
P7 Accuracy
P8 Comprehensiveness
P9 Clarity
P10 Frequency
P11 Distribution
Supervisory review, tools
and cooperation
P12 Review
P13 Remedial action and supervisory measures
P14 Home/host cooperation
The principles are specifically designed for risk data aggregation purposes and risk
reporting practices. Although principles are addressed under four separate sections,
they are strongly interlinked; i.e. improvement in a section will greatly and positively
affect the others. Strong risk data aggregation capabilities lead to production of high
quality of risk management reports. Governance and infrastructure encompass these
functions and operations implying that strength and development at governance and
infrastructure will significantly contribute to enhancement in the risk aggregation and
risk reporting capabilities.
Principle dimensions under risk data aggregation capabilities and risk reporting
practices categories strongly align with DQ dimensions explored in DQ assessment
methods. Accuracy and integrity of risk data can be provided by automation of
aggregation of such data which will minimize risk of making errors during
aggregation. Completeness of risk data requires proper aggregation of risk data
obtained from all units or groups of the bank. Timeliness of risk data requires risk
data being up-to-date which can be significant for some risk data.
Comprehensiveness related to coverage of all material risk data.
Governance requires definition of the hierarchy of roles within the bank. Data
architecture and IT infrastructure require modeling of risk management system
regarding the roles and responsibilities of the stakeholders of the system. Thus, the
first two principles require detailed requirement analysis which is outside the scope
of the present study. Our focus will be on the fulfillment of the principles belonging
to risk data aggregation capabilities and risk reporting practices. Supervision aspect
is related to monitoring other principles. Therefore, our approach will encompass the
principles which can directly be monitored using quantitative data and techniques
related to banking risks. Appropriate data quality dimensions which will be selected
in the definition phase of our approach will be aligned with the principles regarding
risk data aggregation and risk reporting.

19
Implementation of those principles requires certain maturity level in IS capabilities
of banks. Gozman and Currie (2015) have identified nine IS capabilities
underpinning activities for managing governance, risk and compliance in accordance
with regulatory obligations. The IS capabilities derived from the studies conducted
on several financial organizations and IS vendors involve administering automated
controls, underpinning ethical practice, monitoring and reporting governance, risk
and compliance outcomes, data aggregation and management, sourcing governance,
risk and compliance functionality, managing service providers, determining best
practices, IS leadership, and prioritization of activities for achieving higher maturity
levels and transitioning abilities of organizations to higher maturity levels.

20

21
CHAPTER 3
METHODOLOGY
This chapter is devoted to study of how to adapt and apply TDQM approach to credit
risk management context from IS viewpoint and to build content of phase of the
approach. Each phase of TDQM is specialized and enriched for the purposes of DQA
of credit risk data. Reasoning, objectives, assumptions and requirements for
application of TDQM are also discussed in this chapter.
3.1 Reasoning, Objectives and Requirements of the Proposed
Approach
3.1.1 Reasoning
Data quality of banking risks must be ensured in order to accurately quantify and
measure the risks for which banks require to hold capital, and to calculate regulatory
capital requirement as a result of those risks. The largest portion of exposures of
banks belongs to credit risk. Due to those reasons, there is a need for a special and
comprehensive DQA method that can be used to assess quality of credit risk data.
Although there are efforts focusing on DQA of credit risk data in the literature as
outlined in 2.5, there is still need for an alternative approach in order to thoroughly
assess data quality of the credit risk data. There are various approaches proposed to
assess DQ of different contexts which are explored in 2.2. TDQM is independent
from the context, i.e. they can be adjusted for different contexts in order to assess DQ
of this context (Woodall & Parlikad, 2010). There are also various approaches
specifically designed for certain fields such as data regarding health sector,
demography or web services. There are also valuable studies attempting to assess DQ
of credit risk context. These studies have been outlined above in Section 2.5. Some
of these studies (Moges et al., 2011 & 2013, and Moges, 2014) adopt TDQM in
assessment of DQ of financial risk data, specifically credit risk. These studies
involve empirical studies using questionnaires rather than developing objective DQ
metrics. One study addresses the use of key quality indicators based on data quality
measurements. However, there is no detailed procedure for how to obtain such
indicators. This reveals a clear need for a thorough assessment of data quality of
credit risk data via data quality metrics. The structure of TDQM allows development
of such DQ metrics. Another reason for adoption of TDQM is that it is a context-
independent approach which provides flexibility for adaptation of credit risk context.
Its phases are suitable for comprehension and analysis of data quality aspects.
Definition phase of the approach is based on the DQ dimensions studied by Wang
and Strong (1996) which identify the dimensions relevant to credit risk. Moreover,

22
the continuous improvement cycle of TDQM enables alignment of the approach with
the increasing sophistication of credit risk data.
3.1.2 Objectives
DQA to be applied aims to assess data quality of credit risk data by identifying risk
data content and data taxonomy in terms of IT infrastructure first, then determining
relevant DQ dimensions relevant to the risk data, building metrics for the dimensions
identified so that underlying problems related to data quality be revealed and
explored. Iterative analysis of data quality problems will contribute to enhance
standardization of risk data structure, reduce inconsistencies stemming from
discrepancies among multiple data sources used and provide accuracy of data.
Proficiency of data processing tools for credit risk management will be evaluated
from an IS perspective.
3.1.3 Assumptions and Requirements
It is crucial to trace the source of the risk data in order to control quality of it. Risk
data is generated from different sources. For instance, information regarding
exposure amount is obtained from the accounts retrieved from accounting sheets and
other necessary information relevant to risk measurement such as ratings, client
information (real person or an entity) of which signed documents or official papers
are usually obtained by branches and other information obtained by various entities.
Therefore, IT infrastructure of the bank organization is supposed to provide reliable
access to necessary information. Moreover, Roles, responsibilities and authorizations
within the bank organization should clearly be identified and assigned. These aspects
are addressed in the BCBS document discussed in Section 2.5. The approach
assumes that the IT infrastructure and the roles contributing the generation and
retrieval of risk data are identified in accordance with the principles related to
governance and infrastructure as elaborated in Section 2.5.
3.2 Phases
In this section, we build our DQA methods on the phases of TDQM in order to assess
quality of credit risk data in terms of DQ dimensions to be specified. As cited in
Section 2.3, TDQM consists of four phases: Definition, measurement, analysis and
improvement. Definition phase of TDQM involves definition of DQ dimensions.
Measurement phase is devoted to development of DQ metrics in order to assess DQ
of based on the dimensions defined in Phase 1. Analysis phase involves analysis of
DQA results and investigate underlying causes of poor DQ. Improvement phase
contains suggestions for improvement of DQ of poor quality data based on the causes
identified and analyzed (Wang, 1998).
Below, we are going to elaborate on the content of each phase according to credit
risk context. The content of each phase is outlined in Table 4.
Brief explanation for each phase is provided below.

23
Phase 1: Definition of data quality
The first phase of the approach defines the scope of the approach, classifies the
relevant credit risk data context based on the description of the context in Section 2.4
and then defines the relevant data quality dimensions. The data taxonomy is
described in accordance with Basel Accords regarding credit risk outlined in Section
2.4. Alignment of the data taxonomy with IT requirements is also addressed in this
phase. Moreover, viable data sources that feed data required for credit risk
management are identified in this phase.
Once critical objects and attributes are determined, data quality dimensions relevant
to these attributes of credit risk data should be determined. DQ dimensions explored
in Section 2.1.2 and principle set of BCBS outlined in Section 2.5 will guide us to
determine these DQ dimensions with focus to the findings of impact analysis.
Phase 2: Measurement of data quality
Using the DQ quality dimensions specified in the first phase, performance metrics
are constructed in this phase. These metrics refer to the rates of violation of data
quality requirements.
Since banking credit risk data consists of quantitative data and can be presented in
referential database tables, data quality assessment methods used in databases can
easily be implemented. Such methods can include column analysis, cross-domain
analysis, data validation, domain analysis, lexical analysis, matching algorithms,
primary key and foreign key analysis, schema matching, and semantic profiling
(Borek et al., 2011). Implementation of such methods will be used to calculate
performance metrics specified in this phase. DQA will be based on individual and
composite quality performance indicators constructed by transforming metrics in this
phase.
Table 4 Outline of the customized TDQM approach for banking credit risk data
Phase Name Content
Definition of DQ
Identification of data taxonomy and data sources for
credit risk management
o Identification of entities and its attributes
o Identification of data sources of the attributes
Definition of data quality dimensions for credit risk data
context
Measurement of DQ Development of performance metrics for DQ
dimensions
Identification of measurement methods/techniques for
performance metrics
Development of KQPIs and CQPIs
Analysis of DQ Analysis of DQA results obtained from KQPIs and
CQPIs
Identification and analysis of DQ problems
Improvement of DQ Development of improvement techniques to
propose solution for the problems

24
Phase 3: Analysis of data quality
According to the performance results of the DQ assessment obtained from quality
performance metrics utilized in the second phase, DQ problems, if exist, and their
underlying causes are identified and classified in order to develop strategies for
improvement in such problematic areas.
Phase 4: Improvement of data quality
The last phase concentrates on proposals for solution strategies and techniques for
the improvement areas decided. Performance metrics developed in the second phase
are binding for selecting improvement techniques.
Relationship and flows among the phases constructed in the present study and
proposed for DQA of credit risk management context are outlined in Figure 4.
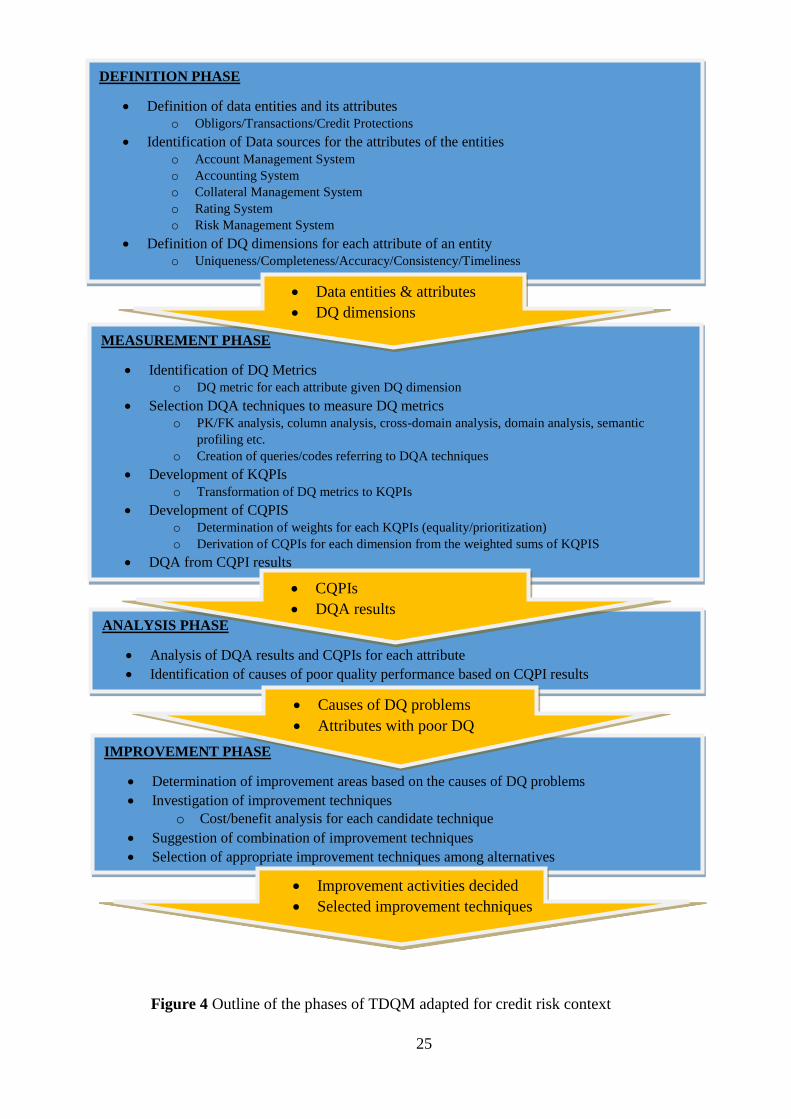
25
Figure 4 Outline of the phases of TDQM adapted for credit risk context
DEFINITION PHASE
Definition of data entities and its attributes
o Obligors/Transactions/Credit Protections
Identification of Data sources for the attributes of the entities
o Account Management System
o Accounting System
o Collateral Management System
o Rating System
o Risk Management System
Definition of DQ dimensions for each attribute of an entity
o Uniqueness/Completeness/Accuracy/Consistency/Timeliness
MEASUREMENT PHASE
Identification of DQ Metrics
o DQ metric for each attribute given DQ dimension
Selection DQA techniques to measure DQ metrics
o PK/FK analysis, column analysis, cross-domain analysis, domain analysis, semantic
profiling etc.
o Creation of queries/codes referring to DQA techniques
Development of KQPIs
o Transformation of DQ metrics to KQPIs
Development of CQPIS
o Determination of weights for each KQPIs (equality/prioritization)
o Derivation of CQPIs for each dimension from the weighted sums of KQPIS
DQA from CQPI results
Data entities & attributes
DQ dimensions
ANALYSIS PHASE
Analysis of DQA results and CQPIs for each attribute
Identification of causes of poor quality performance based on CQPI results
CQPIs
DQA results
IMPROVEMENT PHASE
Determination of improvement areas based on the causes of DQ problems
Investigation of improvement techniques
o Cost/benefit analysis for each candidate technique
Suggestion of combination of improvement techniques
Selection of appropriate improvement techniques among alternatives
Causes of DQ problems
Attributes with poor DQ
Improvement activities decided
Selected improvement techniques

26
3.2.1 Phase 1: Definition of data quality
3.2.1.1 Identification of Data Taxonomy for Credit Risk Data
Data taxonomy of credit risk can be designated based on the outline of the
information regarding credit risk context derived from the Basel framework in
Section 2.4. Three fundamental entities emerge as the drivers of credit risk function
are analyzed. These are the obligor, the transaction and the credit protection.
Obligors are the clients of the bank who make transaction with the bank. The
transaction itself is the very basic element of the exposure. Credit protection is used
to reduce exposure amount. It can be either funded or unfunded. Funded credit
protection is usually provided via several assets which can be turned into cash in case
of default of the obligor. Unfunded protection is, on the other hand, guarantee
provided by third parties. Therefore, exposure amount of a transaction can be
determined by three entities. To quantify an exposure, the bank has to accumulate
relevant information specific to the obligor, the transaction and credit protection if
exists. Banks must conveniently access this kind of information in order to quantify
and calculate their exposures in robust manner. Each entity has its own effect on
overall risk-weighted exposure amount depending on its characteristics. Basic
characteristics of these entities are outlined in Figure 5. Well-establishment of the
content of these entities contributes to create beneficial relationship tables which can
effectively be used in credit risk management. Such a relationship requirement is
implied in Figure 3 as the risk function is composed of components provided by
information regarding obligors, transactions and credit protections.
Figure 5 Basic characteristics of an obligor, transaction, credit protection and credit
risk function
Obligor
•Obligor Identity
•Type
•Financial Statement
•Staff Size
•Credibility
•Risk Group
Transaction
•Credit Identity
•Transaction Record
•Type
•Credit Conversion Factor
•Amount
•Return
•Provision/Loss
•Period
•Currency Type
Credit Protection
•Protection Identity
•Protection Type
•Amount
•Period
•Provider Credibility
•Currency Type
Credit Risk Function
Obligor Identity
Transaction Identity
Protection Identity
Final Risk Weight
Exposure Amount Before CRM
Risk-weighted Exposure Amount After CRM

27
Obligor characteristics
Characteristics of an obligor are identity, type, financial statement and credibility.
Identity of an obligor can be determined by its account number, tax ID and country.
Type of the obligor specifies the legal nature of the obligor. The type can be a central
bank, a central government, a regional government, a public entity, a bank, a
corporate, a SME or an individual real person at all. Financial statement of the
obligor specifies its revenue or asset size. Staff size attribute is only applicable to
non-real persons. Credibility of the obligor can be determined via internal and/or
external ratings. Credibility can be expressed as risk weight of the obligor in data
tables. If SA is used, determination of risk weights from the external ratings and
regulations is straightforward. However; if IRB approach is used, determination of
risk weights is a bit tricky. PD and LGD parameters should be used in the risk
function. Risk group of the obligor is required to specify the parent or subsidiary
entities of the obligor since financially and legally dependent entities may be subject
to same risks.
The type of the obligor strongly affects financial statement and credibility of the
obligor. For example, if the obligor is of corporate type, it will have a different
financial statement (e.g. asset size) than that of another obligor of type SME.
Likewise, a central government could have different credibility than that of a private
bank.
Transaction characteristics
Characteristics of a transaction are its identity, accounting record, type, nominal
amount, return on it, loss from it and its period. Transaction type can be cash credit
or non-cash credit. Nominal amount can be written on the transaction contract. Its
return can be the interest income accumulated so far over a credit allocation. Period
can be the maturity of a credit or a security.
Credit protection characteristics
Characteristics of a credit protection are its identity, funding type, protection type,
protection amount, and protection period. Various protection types are possible: cash
deposit, real estate, credit derivative, guarantee etc. Protection period is the period
over which the protection is valid. Provider specifies the third party providing some
guarantee for the exposure of the obligor in case of default. It is only applicable for
unfunded protections.
Characteristics of the obligor, the transaction and the credit protection can be
presented as attributes of data tables to be created for these entities. Each attribute
could address some data quality requirements although data quality requirements are
not limited to attributes but cover data tables themselves and relationships among
those tables.
Relationship entity for credit risk function
Credit risk function depends of the attributes of obligors, transactions and credit
protections as outlined in Section 3.2.1.1. Therefore, a relationship among those
entities should be created in order to quantify credit risk of each transaction
belonging to some obligor. Such a relationship entity should consider following
aspects:

28
Correct matching of the three entities in the resulting table; i.e. pairing
transactions of an obligor with its collaterals
Correct slicing of transactions and credit protections of the obligor during in
matching, i.e. multiplication of records for each slice of transaction and credit
protection pairs
Determination of appropriate final risk weight of each slice based on the
ratings or risk weights of transaction and credit protection pairs
Thus, the relationship entity for credit risk should contain following attributes:
Identifiers of obligors, transactions and credit protections
Final risk weight of the transaction slice
Exposure amount of the transaction slice before application of credit risk
mitigation (CRM) techniques (before the effect of credit protection)
Risk-weighted exposure amount of the transaction slice after application of
CRM techniques (after the effect of credit protection.
3.2.1.2 Identification of Data Sources for Credit Risk Data
Management of the risks that banks are exposed is maintained by risk management
departments of banks. Risk management department requires all data relevant to any
transaction that bears risk for the bank. Finance and accounting department is
primary data source for these transactions since it collects and records data regarding
all transactions of various departments such as corporate loans department, personal
loans department, treasury department. Information on ratings and collaterals are also
critical for risk management functions. IT department provides IT infrastructure for
risk management practices. Risk management system is fed by accounting system,
rating system, collateral management system, market information system and
account management system. IT department provides the infrastructure for the
functioning of these systems. Based on this evaluation of data flow to risk
management system, viable systems that provide data to risk management system
can be identified in a system context diagram given in Figure 6. Information
regarding clients are obtained from account management system of the bank.
Account information of clients are obtained by account management system.
Accounting records regarding transactions or loans of the clients along with accrued
interest and commission payments are obtained by accounting system. Accounting
properties of transactions such as location in the balance sheet and trial balance are
retrieved from accounting systems. Rating system provides credit ratings of obligors
(clients) and bailers of the collaterals. Sophistication of the rating system depends on
the risk calculation approach used. For example, if the bank uses standard approach
for credit risk, rating system generally consists of external ratings given by credit
rating agencies. On the other hand, if internal rating is used, then, the system can
involve ratings and risk parameters which are derived from statistical models
employed within the risk management practices. Collateral management system
contains all credit protections provided on behalf of the clients to the bank. The bank
uses credit protections both to secure transactions performed with the clients and to
mitigate its exposure to risks. The system matches transactions with collaterals
provided that their maturities match within some period. Addition or drop of
collaterals in matching operations is performed as credit period rolls accordingly.
Market information system provides current values of parameters belonging to

29
various markets. For example; exchange rates of currencies, discount rates of
securities etc. are fed by this system to the risk management system. The information
system lies at the backbone of the systems mentioned. It should provide an IT
infrastructure that provides healthy communication, and an interface that enables the
roles responsible for risk management to retrieve and aggregate the data in order to
use for risk management purposes.
Figure 6 System context diagram proposal for risk management system
3.2.1.3 Identification of Data Quality Dimensions for Credit Risk Data
In this section, we will investigate which DQ dimensions are relevant and applicable
to the characteristics of obligors, transactions and credit protections. DQ dimensions
regarding the business rules due to regulations should be determined in addition
those for the attributes of the basic entities themselves. Business rules can be related
to the relations among certain attributes of the entities as wells as the relations among
entities that enforces referential integrity.
In Section 2.1.2 above we have explored the DQ dimensions that are most frequently
referred in the DQA literature. Although credit risk context can cover plenty of DQ
dimensions, we will focus on those dimensions which can be quantitatively defined
and measured without inference of subjective judgment. These DQ dimensions are
uniqueness, completeness, accuracy, consistency and timeliness. Section 2.1.2 also
points out that definition of same DQ dimensions may vary from one study to
another. Below, we present the particular definitions of DQ dimensions that we adopt
in the present study:
Uniqueness refers to having non-duplicate record within a given domain. This
dimension can be controlled by inquiring exactly same records within the domain.
Completeness refers to not having null (empty) records within a given domain. This
definition is consistent with that presented in Dejaeger et al. (2010) which refers to
Risk Management
System
Accounting System
Rating System
Collateral Management
System
Market Information
System
Account Management
System

30
completeness as the extent of missing and duplicate values. This dimension can be
controlled by inquiring null records within the domain.
Accuracy refers to correctness of values within a given domain subject to certain
domain constraints. If the values violate those constraints (they could be some range
or interval), then accuracy of the domain will be degraded. We refer to the definition
of Redman (1996) which is the measure of proximity of data value x to another value
x‟ whose correctness is assumed. Note that we only refer to syntactic accuracy but
not semantic accuracy in this context (refer to Section 2.1.2).
Consistency refers to conformance to business rules defined over different domains
as well as to referential integrity constraints. Therefore, we are interested in both
intra-relational consistency and inter-relational consistency which are referred in
Dejaeger et al. (2010) and Batini et al. (2009) (see Section 2.1.2).
Timeliness refers to the definition presented in Dejaeger et al. (2010) as retrieval of
recent data upon specific request.
DQ dimensions for obligors
Identifiers of an obligor such as account number and tax ID do not directly affect risk
calculation. However, uniqueness of the obligor is required. An obligor could have
different accounts but it should have unique tax ID and client ID. Therefore,
uniqueness of tax ID or client ID and existence, thus completeness, of tax ID, client
ID and account number should be ascertained from source data tables. Home country
of an entity can be critical for credit rating of the obligor if it is a legal entity rather
than a real person. Therefore, accuracy and completeness of the country should be
checked.
Type of the obligor is one of the critical attributes that affect credibility or risk
weight. Type set that can be defined for the obligor entity can be created in
accordance with the Basel framework which classifies obligors according to their
entity type. It can be a central bank, a central government, a bank, a corporate or a
SME etc. Their type and their home country play critical role for the credit ratings
given by the CRIs. Therefore, accuracy and completeness dimension of the type of
the obligor is crucial for risk management practices.
Financial statement and number of staff of the obligor becomes crucial in
determining whether the entity is a corporate or a SME. SMEs are small and medium
sized entities whose revenue turnover or balance sheet amount and staff size is under
a specified threshold level according to the legislation of the country that bank
operates. Therefore, SMEs are subject to different risk weight than corporations.
Therefore, completeness of those attributes depends on obligor type. It should be
controlled accordingly.
Credibility of the obligor is perhaps the most critical attribute for risk calculation. It
can be expressed as ratings attributed to the obligor or as risk weights which directly
appear in the risk function. If SA is used, then it can be a risk weight. On the other
hand, if bank uses IRB approach, then it can demonstrate PD of the obligor.
Completeness of this attribute depends on the definition of the attribute. It is
expressed as risk weight of the obligor or PD of the obligor that is expected to be
filled. However, if it is defined as ratings attributed to the obligor; then it may not be
forced to be filled since obligors might not be graded by a CRA at all. Accuracy and

31
completeness dimensions for credibility attribute of the obligor should be controlled
accordingly.
Risk group of the obligor is necessary to identify legally connected obligors (e.g.
parents or subsidiaries) which may be exposed to the same risks. If an obligor has no
parent or subsidiary entity, then risk group of the obligor is just itself. Therefore,
accuracy and completeness of risk group specification is necessary.
There is relation between obligor type and financial statement and staff size of the
obligor. If an obligor is a real person, a central bank or a central government then
financial statement and staff size attributes would be irrelevant for that obligor. On
the other hand, if the obligor is a corporate or a SME then those attributes should be
specified. Moreover, there must be distinction between a corporate and a SME since
there are upper threshold values for turnover, asset size and staff size of SMEs. As a
result, consistency dimension should be considered for the obligor type, turnover,
asset size and staff size information for the obligor. Table 5 summarizes DQ
dimensions for the attributes of entity of obligors.
Table 5 DQ dimensions for obligors
OBLIGOR
Characteristics Attribute Relevant DQ
dimensions
Original source
Identity Account number Completeness Account Management System
Identity Client ID Uniqueness,
completeness
Account Management System
Identity Tax ID Uniqueness,
completeness
Account Management System
Identity Country Accuracy,
completeness
Account Management System
Type Obligor Type Accuracy,
completeness
Account Management System
Financial
Statement
Turnover Consistency Account Management System
Financial
Statement
Active size Consistency Account Management System
Staff Size Staff Size Consistency Account Management System
Credibility Rating/PD Accuracy,
completeness
Rating System
Risk Group Risk Group
Code
Accuracy,
completeness
Risk Management System
DQ dimensions for transactions
An obligor identifier is required to match relevant transaction. Accuracy and
completeness of this attribute must be satisfied.
A transaction must be recorded in accounting sheets. Accounting record specifies the
nature of the transaction. Accuracy and completeness dimensions are needed for the
record.

32
Transaction type can be a cash credit or non-cash credit such as letter of guaranty. It
can determine what credit conversion factor (CCF) should be applied. CCF is only
applied to non-cash credits. For cash credits, it is applied as 100% by default. CCF
changes according to risk level of transaction type for non-cash credits. For SA, CCF
values domain set according to the risk level of the transaction are determined in the
Basel framework. For IRB approach, CCF values can be calculated internally.
Accuracy and completeness dimensions are required to be used for data quality
assessment of transaction type and credit conversion factor.
Table 6 DQ dimensions for transactions
TRANSACTION
Characteristics Attribute Relevant DQ
dimensions
Original source
Credit identity Transaction ID Uniqueness,
completeness
Accounting System
Obligor identity Account
Number
Completeness Account Management System
Transaction record Accounting
record
Accuracy,
completeness
Accounting System
Type Transaction type Accuracy,
completeness,
consistency
Accounting System
Rate CCF Accuracy,
completeness,
consistency
Risk Management System
Amount (+) Principal Completeness,
timeliness
Accounting System
Amount (+) Return Completeness,
timeliness
Accounting System
Amount (–) Provision/Loss Completeness,
timeliness
Accounting System
Period Maturity Completeness,
timeliness
Accounting System
Currency Type Currency Code Accuracy,
completeness
Accounting System
Amount of the transaction is the direct input in the risk function. Net amount of a
transaction consists of principal, return and loss. Depending on the nature of the
transaction, there can be return or gain on the transaction such as accrued interest
income on a credit provided to an obligor. On the other hand, some provisions might
be allocated due to losses or write-offs on a transaction. Therefore, amount, return
and loss information for the transaction should satisfy accuracy and completeness
requirements. Depending on reporting frequency, timeliness dimension can also be
critical for principal, return or loss on the transaction since it can change or
accumulate as the period rolls.
Transaction period can be understood as the maturity of the transaction in which the
obligation of the obligor proceeds and it poses risk for the bank. A transaction period
can be expressed via an opening date and a closing date. The remaining period or
maturity is under consideration along with the amount of the transaction and accrued

33
return on the transaction from the point of risk calculation. Therefore; completeness
and timeliness dimensions are significant for the period of transaction.
Accounting record of a transaction is determiner of the type of the transaction. Since
two attributes are correlated, consistency rules must be enforced. Similarly,
transaction type specifies what CCF should be applied. Therefore, consistency
dimension should be included in DQ assessment for those two attributes either.
Currency type of the transaction should satisfy accuracy and completeness
dimensions. Table 6 summarizes DQ dimensions for the attributes of entity of
transactions.
DQ dimensions for credit protections
Type of credit protection determines the effect of the protection on the transaction.
Protection type can be cash deposit, security, real estate, guarantee etc. Therefore,
accuracy and completeness of the protection is important. If credit protection is by a
guarantee then its provider and the credibility or risk weight of the provider should
be demonstrated. If credit protection is by some type other than a guarantee then risk
weight of the protecting asset should be demonstrated.
Table 7 DQ dimensions for credit protections
CREDIT
PROTECTION
Characteristics Attribute Relevant DQ
dimensions
Original source
Protection
Identity
C. Protection ID Uniqueness,
completeness
Collateral Management System
Type Protection Type Accuracy,
completeness
Collateral Management System
Credibility Provider
Rating/PD
Accuracy,
completeness
Rating System
Amount Value Completeness,
timeliness
Collateral Management System
Period Maturity Completeness,
timeliness
Collateral Management System
Currency Type Currency Code Accuracy,
completeness
Collateral Management System
Protection amount is important for risk function since it will reduce exposure of the
transaction protected. Therefore, completeness and timeliness dimensions should be
in concern.
Protection period should be known for certain in order to use the protection in the
risk mitigation practices. Similar to the period of transaction, the remaining maturity
is of concern. Mismatch between remaining maturities of the transaction and the
credit protection, i.e. if maturity of the protection is earlier than that of the
transaction, this poses certain risk and changes the nature of calculation. Due to such
reasons, completeness and timeliness of this attribute should be satisfied.

34
Provider credibility is subject to risk calculation if the protection is by a guarantee. In
that case, risk weight or PD of the protection provider (depending on calculation
approach) appears in the risk function. Therefore, accuracy and completeness
dimensions are required for this attribute.
Currency type of the protection should satisfy accuracy and completeness
dimensions. Table 7 summarizes DQ dimensions for the attributes of entity of credit
protections.
DQ dimensions for credit risk function
Since credit risk entity results from the relationship among the three root entities, the
attributes of credit are borrowed or derived from the other three entities. Borrowed
attributes are identifiers of the other entities while derived attributes are the resulting
attributes of relationship among the entities. Therefore, this entity should meet the
requirements for referential integrity as well as consistency conditions.
Table 8 DQ dimensions for relations among the entities
CREDIT RISK
FUNCTION
Characteristics Attribute Relevant DQ
dimensions
Original source
Obligor Entity Client ID Completeness,
consistency
Account Management System
Credit identity Credit Number Completeness,
consistency
Accounting System
Protection
Identity
C. Protection ID Completeness,
consistency
Collateral Management System
Credibility Final Rating (or
Final Risk Weight)
Accuracy,
completeness,
consistency
Risk Management System
Amount Exposure Before
CRM (slice)
Completeness,
consistency
Risk Management System
Amount Credit Protection
Allocation (slice)
Completeness,
consistency
Risk Management System
Amount RWA After CRM
(slice)
Completeness,
consistency
Risk Management System
Obligor identity, transaction identity and credit protection identity for a certain event
in credit risk entity should be consistent with those in the other entities. Therefore,
consistency dimension is required for these attributes.
Due to possible slicing of transaction amount for the purposes of application CRM, a
transaction can be divided to several records. Therefore, total amount of slices
existing in credit risk entity should consistently match to the amount belonging to
that transaction existing root transaction entity.
A protection may not be completely used in risk mitigation. In fact, a credit
protection can be used for more than one transaction if it suffices. In other cases, a
protection may not be wholly used for a transaction due to legal restrictions.
Therefore, use amount of a credit protection for a transaction slice should be

35
specified for risk mitigation purposes. Coverage amount of the protection should not
exceed the limits set due to reasons mentioned above. Therefore, consistency
dimension should be in consideration for the attribute referring to allocation amount
of protection.
Final risk weight of a transaction slice is determined by the results of matching the
transaction slice to a corresponding credit protection slice. Risk weights of either
transaction or credit protection will be the final risk weight depending on whether the
protection slice covers the transaction slice or not. Therefore, final risk weight of a
slice should be consistent with the risk weights of the transaction slice and the
protection slice.
Risk weighted exposure amount after the effect of CRM techniques should be
consistent with final risk weight, exposure before CRM and amount of protection
allocation since it is resulting attribute of those attributes. Table 8 shows DQ
dimensions for the attributes of credit risk entity.
3.2.2 Phase 2: Measurement of Data Quality
Data quality dimensions that are relevant to credit risk context are defined in Section
3.2.1.3. These DQ dimensions are determined to be uniqueness, accuracy,
completeness, timeliness and consistency. Measurement of data quality of credit risk
requires that DQ metrics be developed. These metrics should be based on DQ
dimension defined in the definition phase. In this section, we are going to develop
DQ metrics based on DQ dimensions defined in order to assess data quality of credit
risk.
3.2.2.1 Metrics for DQ dimensions
Metrics are used to present the results of undesired outcomes for a given DQ
dimension. After calculating the metrics for each attribute for a given DQ dimension,
the results will be transformed to data quality performance scores in order to perform
DQA. DQ metrics defined in the present study are actually ratios. That is, they refer
to ratio of the number of undesired outcomes to the number of total outcomes.
Therefore, observation of non-zero values as a result of measurement of the metrics
points out existence of a DQ issue.
General forms of the DQ metrics developed for the DQ dimensions used in the
present study are provided in Table 9. Also, detailed descriptions of the DQ metrics
for each attribute of the entities for the given DQ dimensions are given in this
section.

36
Table 9 General forms of the DQ metrics developed for the DQ dimensions
DQ Dimension General Metric Form
Uniqueness Total number of records in a table that has duplicate records for certain
FIELD that must be unique to total number of all records in the table
Accuracy Total number of records in a table whose certain FIELD violates
domain constraints of that field to total number of all records in the
table
Completeness Total number of records in a table whose certain FIELD that must be
non-null is null to total number of all records in the table
Consistency Total number of records in a table whose certain FIELD value
contradicts with the value(s) of other dependent fields(s) to total
number of all records in the table
Timeliness Total number of records in a table whose certain FIELD was updated
before date DD.MM.YYYY to total number of all records in the table
Metrics for uniqueness
Uniqueness of an entity can be provided by the identifier of that entity. Obligor
identification can be ensured via tax ID, social security number (SSN) or citizenship
number. In addition, client ID which is defined by the bank can be used to identify
the obligor. A bank may use any of these identifiers to trace the obligor. Similarly,
uniqueness of transactions and credit protections in their root tables can be provided
by assignment of IDs to those entities by the corresponding original data source.
Performance metrics for uniqueness of the attributes of obligors are defined as
follows:
Total number of records in obligors table that have duplicate records for tax
ID to total number of all records in the table.
Total number of records in obligors table that have duplicate records for
client ID to total number of all records in the table.
Performance metrics for uniqueness of the attributes of transactions can be defined as
follows:
Total number of records in transactions table that have duplicate records for
transaction ID to total number of all records in the table.
Performance metrics for uniqueness of the attributes of credit protections can be
defined as follows:
Total number of records in credit protections table that have duplicate records
for credit protection ID to total number of all records in the table.
If any one of these metrics has a non-zero value, this issue must be handled in
database application via definition of unique fields which are primary keys.

37
Metrics for accuracy
Accuracy can be interpreted in different manners according to its definition as
discussed in Section 2.1.2. Originality of each attribute value in terms of its original
source and its proximity to its original value should be assessed for data quality
assessment purposes. This can lead to the definition of various metrics for this
dimension. However, we are going to focus solely on the attributes whose values
should lie within a domain.
Performance metrics for accuracy of the attributes of obligors are defined as follows:
Total number of records in obligors table whose country is not in the country
domain set, Dcountry (domain set can be expressed as country codes, e.g. TR,
US etc.) to total number of all records in the table.
Total number of records in obligors table whose type is not in the obligor
type domain set, Dotype (domain set contains entity types according to the
Basel framework, e.g. central bank, central government, corporate, SME,
individual person etc.) to total number of all records in the table.
Total number of records in obligors table whose rating does not exist in the
rating domain set, Dorating (domain set can be expressed as credit quality level,
e.g. 1, 2, 3 etc. or as grades AAA+, AA-, BBB+ etc. or as PD rates) to total
number of all records in the table.
Performance metrics for accuracy of the attributes of transactions are defined as
follows:
Total number of records in transactions table whose accounting record
violates the constraints imposed on accounting sheets by regulations to total
number of all records in the table (for example; entry number of a transaction
may not belong to accounting record set at all due to operational errors).
Total number of records in transactions table whose type is not in the
transaction type domain set, Dttype (domain set contains transaction types
according to the Basel framework, e.g. cash credits, cash credits from
participation funds, non-cash credits with lowest risks, non-cash credits with
highest risks etc.) to total number of all records in the table.
Total number of records in transactions table whose CCF is not in the CCF
interval (this is the case when IRB approach is used, e.g. [%0, %100]) or
domain set, DCCF (this is the case when SA is used, e.g. %0, % 20, %50 or
%100 are used according to level of riskiness of the credit) to total number of
all records in the table.
Total number of records in transactions table whose currency type is not in
the currency type domain set, Dcurrency (domain set can be expressed as
currency codes, e.g. TRY, USD etc.) to total number of all records in the
table.
Performance metrics for accuracy of the attributes of credit protections are defined as
follows:
Total number of records in credit protections table whose type is not in the
protection type domain set, Dptype (domain set contains protection types
according to the Basel framework, e.g. cash deposits, security, real estate,
guarantee etc.) to total number of all credit records in the table.

38
Total number of records in credit protections table whose rating does not
exist in the rating domain set, Dprating (domain set can be expressed as credit
quality level, e.g. 1, 2, 3 etc. or as grades AAA+, AA-, BBB+ etc. or as PD
rates) to total number of all records in the table.
Total number of all records in credit protections table whose currency type is
not in the currency type domain set, Dcurrency (domain set can be expressed as
currency codes, e.g. TRY, USD etc.) to total number of all records in the
table.
Performance metrics for accuracy of the attributes of credit risk entity are defined as
follows:
Total number of records in credit risk table whose final rating (or risk weight)
does not exist in the rating domain set, DCRrating (domain set can be expressed
as credit quality level, e.g. 1, 2, 3 etc. or as grades AAA+, AA-, BBB+ etc. or
as PD rates) to total number of all records in the table.
Metrics for completeness
Attributes that require to be filled are addressed by completeness dimension. It refers
to inspection of null values for a given attribute. An attribute value can be null due to
two reasons. One is that it is not required for all cases of the attribute. The other is
due to missing values which should be filled somehow. Completeness dimension
addresses missing values which are required to be filled. The other aspect is
addressed by the consistency dimension, i.e. determination of whether an attribute is
to be null or not under certain conditions.
Performance metrics for completeness of the attributes of obligors are defined as
follows:
Total number of records in obligors table whose account number is null to
total number of all records in the table.
Total number of records in obligors table whose tax ID is null to total number
of all records in the table.
Total number of records in obligors table whose country is null to total
number of all records in the table.
Total number of records in obligors table whose obligor type is null to total
number of all records in the table.
Total number of records in obligors table whose rating/PD/risk weight is null
to total number of all records in the table.
Performance metrics for completeness of the attributes of transactions are defined as
follows:
Total number of records in transactions table whose transaction number is
null to total number of all records in the table.
Total number of records in transactions table whose account number is null to
total number of all records in the table.
Total number of records in transactions table whose accounting record is null
to total number of all records in the table.
Total number of records in transactions table whose CCF is null to total
number of all records in the table.

39
Total number of records in transactions table whose principal amount is null
to total number of all records in the table.
Total number of records in transactions table whose return amount is null to
total number of all records in the table.
Total number of records in transactions table whose provision/loss amount is
null to total number of all records in the table.
Total number of records in transactions table whose maturity is null to total
number of all records in the table.
Total number of records in transactions table whose currency code is null to
total number of all records in the table.
Performance metrics for completeness of the attributes of credit protections are
defined as follows:
Total number of records in credit protections table whose credit protection ID
is null to total number of all records in the table.
Total number of records in credit protections table whose protection type is
null to total number of all records in the table.
Total number of records in credit protections table whose provider is null to
total number of all records in the table.
Total number of records in credit protections table whose rating/PD is null to
total number of all records in the table.
Total number of records in credit protections table whose value is null to total
number of all records in the table.
Total number of records in credit protections table whose maturity is null to
total number of all records in the table.
Total number of records in credit protections table whose currency code is
null to total number of all records in the table.
Performance metrics for completeness of the attributes of credit risk are defined as
follows:
Total number of records in credit risk table whose obligor ID is null to total
number of all records in the table.
Total number of records in credit risk table whose transaction ID is null to
total number of all records in the table.
Total number of records in credit risk table whose credit protection ID is null
to total number of all records in the table.
Total number of records in credit risk table whose final rating is null to total
number of all records in the table.
Total number of records in credit risk table whose exposure before CRM is
null to total number of all records in the table.
Total number of records in credit risk table whose amount of credit protection
allocation is null to total number of all records in the table.
Total number of records in credit risk table whose risk-weighted exposure
after CRM is null to total number of all records in the table.
Metrics for consistency
Consistency dimension is required in order to control validity of business rules
among certain attributes. It can also be used to check referential integrity among the
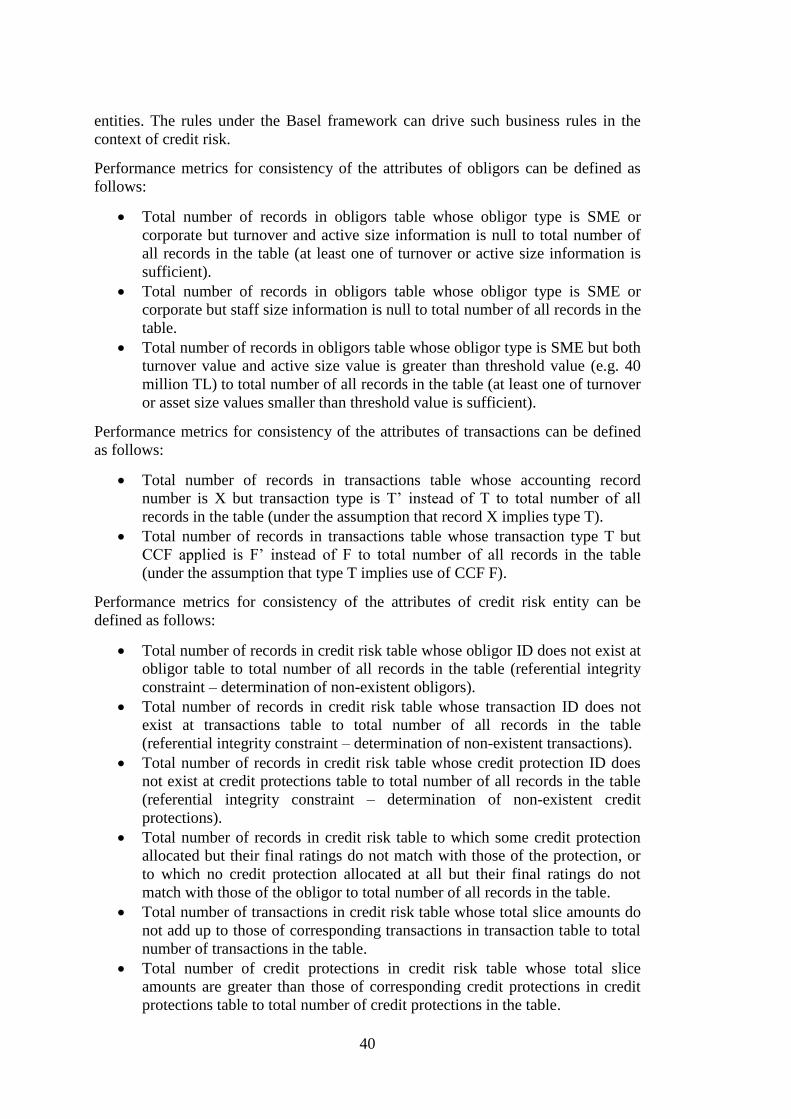
40
entities. The rules under the Basel framework can drive such business rules in the
context of credit risk.
Performance metrics for consistency of the attributes of obligors can be defined as
follows:
Total number of records in obligors table whose obligor type is SME or
corporate but turnover and active size information is null to total number of
all records in the table (at least one of turnover or active size information is
sufficient).
Total number of records in obligors table whose obligor type is SME or
corporate but staff size information is null to total number of all records in the
table.
Total number of records in obligors table whose obligor type is SME but both
turnover value and active size value is greater than threshold value (e.g. 40
million TL) to total number of all records in the table (at least one of turnover
or asset size values smaller than threshold value is sufficient).
Performance metrics for consistency of the attributes of transactions can be defined
as follows:
Total number of records in transactions table whose accounting record
number is X but transaction type is T‟ instead of T to total number of all
records in the table (under the assumption that record X implies type T).
Total number of records in transactions table whose transaction type T but
CCF applied is F‟ instead of F to total number of all records in the table
(under the assumption that type T implies use of CCF F).
Performance metrics for consistency of the attributes of credit risk entity can be
defined as follows:
Total number of records in credit risk table whose obligor ID does not exist at
obligor table to total number of all records in the table (referential integrity
constraint – determination of non-existent obligors).
Total number of records in credit risk table whose transaction ID does not
exist at transactions table to total number of all records in the table
(referential integrity constraint – determination of non-existent transactions).
Total number of records in credit risk table whose credit protection ID does
not exist at credit protections table to total number of all records in the table
(referential integrity constraint – determination of non-existent credit
protections).
Total number of records in credit risk table to which some credit protection
allocated but their final ratings do not match with those of the protection, or
to which no credit protection allocated at all but their final ratings do not
match with those of the obligor to total number of all records in the table.
Total number of transactions in credit risk table whose total slice amounts do
not add up to those of corresponding transactions in transaction table to total
number of transactions in the table.
Total number of credit protections in credit risk table whose total slice
amounts are greater than those of corresponding credit protections in credit
protections table to total number of credit protections in the table.

41
Total number of records in credit risk table whose risk-weighted exposure
amounts after CRM for transaction slices do not equal to the multiplication of
exposure amount before CRM by final risk weight of the slices to total
number of all records in the table.
Metrics for timeliness
How recent a value of an attribute is required in the context of credit risk reporting
determines the significance of timeliness dimension of the attribute. Risk reporting
frequency may change depending on the nature and type of the transaction. However,
monthly reporting period is commonly used for credit risk reporting. Therefore,
certain attribute values are required to be updated at least monthly. Especially,
attributes related to amount may change due to change of exchange rates or due to
accumulation on return or loss.
Performance metrics for timeliness of the attributes of transactions can be defined as
follows:
Total number of records whose principal amount value was updated before
date DD.MM.YYYY to total number of all records in the table.
Total number of records whose return amount value was updated before date
DD.MM.YYYY to total number of all records in the table.
Total number of records whose loss amount value was updated before date
DD.MM.YYYY to total number of all records in the table.
Total number of records whose maturity information was updated before date
DD.MM.YYYY to total number of all records in the table.
Performance metrics for timeliness of the attributes of collaterals can be defined as
follows:
Total number of records whose fair value was updated before date
DD.MM.YYYY to total number of all records in the table.
Total number of records whose maturity information was updated before date
DD.MM.YYYY to total number of all records in the table.
3.2.2.2 DQA methods for DQ metrics
There are various DQA methods described in the literature. Borek et al. (2011) has
classified such methods that are used to assess data quality in certain contexts. These
methods can be applied to various DQ problems. DQ methods presented in that study
are summarized in Table 10.
Column analysis, cross-domain analysis, data validation, domain analysis, matching
algorithms, PK/FK analysis, schema matching and semantic profiling can be used in
order to measure performance metrics defined in Section 3.2.2.1. Lexical analysis
which is used to map unstructured data to structured set of attributes is, on the other
hand, hardly used in DQA since credit risk data usually are of structured type.

42
Table 10 DQ assessment methods (Borek et al., 2011).
DQA Method Description
Column Analysis Computation related to uniqueness, null values, min and max
value, totals, standard deviations, inferred types etc. in a column
Cross-domain
Analysis
a.k.a. functional dependency analysis, identification of redundant
data across columns in the same or different tables
Data Validation Verification of values against a reference data set via algorithms
Domain Analysis Checking if a data value within certain domain of values
Lexical Analysis Mapping unstructured content to structured set of attributes,
usually applied to STRING columns, use of rule-based &
supervised-model based techniques
Matching Algorithms a.k.a. record-linkage algorithms, identification of duplicates,
“Sorted Neighborhood Method (SNM)” used to reduce runtime of
matching
Primary Key /
Foreign Key
Analysis
Analysis applied to columns from different tables to detect good
candidates for Primary Key /Foreign Key relation
Schema Matching Detection of semantically equivalent attributes via algorithms
(schema-based matchers, instance-level matchers, hybrid
approaches)
Semantic Profiling Business rules on data (in columns or tables) and measurement of
the compliance of data to the rules
Column analysis is usually applied in order to produce outcomes related to total,
max, min etc. operations. Statistical operations such as standard deviation can also be
applied via column analysis. It can be used to extract basic simple outcomes
concerning the column or attribute itself. Therefore, column analysis can be used to
assess uniqueness and/or completeness of the relevant attributes determined in
Section 3.2.1.3.
Although it is not directly referred in this study, identification of redundant data is
significant for effective data quality assessment for credit risk context. While
discussing data taxonomies in Section 3.2.1.1 and relevant data sources in Section
3.2.1.2, we point out separation of various systems which provide different data
types for risk management system. Building data taxonomy in accordance with the
business rules implied and compelled by the Basel framework and extracting various
data content from different data sources brings the issue of redundant data along with
the issue of consistency due to concern for referential integrity. Therefore, cross-
domain analysis can be used to detect such redundant data. Banks may face
problems in normalization of various data types in their database applications which
may cause redundancy and referential integrity problems. Therefore, cross-domain
analysis could be beneficial and good starting point to detect and solve such issues.
Data validation method can also be used in comparison of original data sources with
the final data used for risk measurement purposes. Determination and traceability of
reference data set is critical for data validation. Identification of data sources as
mentioned in Section 3.2.1.2 is key step in data validation.
Domain analysis can be used to check violation of domain set constraints. Accuracy
dimension relevant to certain attributes points out detection of such violations.

43
Domain analysis can be realized against pre-defined set of values or some range of
values.
Matching algorithms can be used to detect duplicate records relevant to an entity
that should contain unique records. Uniqueness dimension of an attribute is relevant
for matching algorithms.
Primary Key / Foreign Key (PK/FK) analysis can be used to analyze certain
attributes belonging to the entities of credit risk data that might be good candidates to
be primary key or foreign key. Considering the entities of obligors, transactions and
credit protections, identifier attributes can be analyzed for PK/FK relationship. This
analysis can have substantial effect on creating relationship tables from the three
entities in order to quantify and measure individual and overall risks of transactions.
Schema matching can be beneficial for certain attributes of the credit risk entities.
For example, rating grades given by different CRIs can be semantically matched (e.g.
BBB+ grade given by S&P is equivalent to Baa1 grade given by Moody‟s).
Semantic profiling can be used to check consistency among attributes or entities
required by the business rules. Consistency dimension of certain attributes explored
and defined in Section 3.2.1.3 can be controlled and assessed via semantic profiling.
3.2.2.3 Key Quality Performance Indicators (KQPIs) and Composite Quality
Performance Indicators (CQPIs)
We have developed metrics for data quality assessment of credit risk above in
Section 3.2.2.1. These metrics are based on the attributes and relations of three
entities, i.e. obligors, transactions and credit protections. In order to create healthy
and effective relationship tables that can be used for risk quantification and
aggregation, these metrics should provide acceptable results in terms of data quality
aspects of the attributes defined. Metrics developed in Section 3.2.2.1 are limited to
assessment of several DQ dimensions which are accuracy, completeness, uniqueness
and consistency. The metrics evaluate total occurrences or violations confronted out
of total outcomes or records relevant to a certain entity table. One should expect
those ratios to be close to zero or null to ensure satisfaction of data quality
requirements of relevant attributes and entities. DQ metrics developed to calculate
violation rate of each attribute relevant to a given DQ dimension can be transformed
to quality performance indicators in order to standardize the results of DQA. Two
types of quality performance indicators can be defined: individual indicators and
composite indicators. We have developed such indicators in the present study for the
purposes of the assessment of the results of DQ metrics more meaningfully.
Individual quality performance indicators are developed in the present study by
transforming DQ metrics to certain value. Each individual indicator corresponds to a
DQ metric developed. Since observation of higher amount of violations means
higher DQ metric value, transformation function will consider non-violations in
order to state that higher indicator value means better performance. Hence, the
transformation function for an individual indicator can be defined as follows:
( )

44
where key quality performance indicator i (KQPIi,d) denotes individual indicator i for
metric i for given dimension d, DQMi,d denotes observed value of DQ metric i for
given dimension d, T(.) denotes transformation function, and N denotes upper bound
for KQPIi,d scale ranging from 0 to N (N > 0). Value of N corresponds to upper
bound (the best performance value) while value of zero corresponds to lower bound
(the worst performance value) in the indicator scale. Thus, the KQPI result will be
“n” such that n will be between 0 and N (0 ≤ n ≤ N).
Weights for each KQPI can be determined according to the significance of the field
for credit risk measurement and calculation. CQPI for each dimension can be
constructed by summing up weighted KQPIs where sum of weights add up to one.
Weights of KQPI to form CQPI are determined based on various cases. One case
could be treating all fields in concern equally. Another case could be giving higher
significance, so higher weights, to the fields directly affecting calculation of credit
risk exposure than the other remaining fields. Furthermore, data fields can be
clustered according to their significance in a way that fields existing in same clusters
have same weights.
Table 11 illustrates how data fields can be grouped. Another alternative case for
determination of risk weights could be based on changes in the functions of credit
risk management. In other words, the weight could be dynamic.
Table 11 Clustering data fields of credit risk tables according to their significance for
credit risk calculation
Cluster Description Data fields in the cluster Weight for
the cluster Cluster A: Fields directly
represented as parameters in
credit risk function
Field(a1), Field(a2), … , Field(aN) Wa
Cluster B: Fields affecting
parameters in credit risk
function
Field(b1), Field(b2), … , Field(bM) Wb
Cluster C: Fields not having
significant effect on credit
risk calculation
Field(c1), Field(c2), … , Field(cK) Wc
Wa > Wb > Wc
We know that each KQPI developed by standardization of a DQ metric value
represents the performance of a relevant attribute for a given DQ dimension.
Composite indicators can be constituted by combination of weighted KQPIs for each
DQ dimension. Weights of each KQPI to form a composite indicator can be
determined either equally for each KQPI or according to criticality of the attribute for
risk quantification and calculation, i.e. its factor effect in risk function. If we denote
KQPIi,d as key quality performance indicator for metric i given DQ dimension d and
further denote CQPId a composite quality performance indicator for DQ dimension
d, then CQPId can be defined as follows:
∑

45
Wi is the weight of each KQPI satisfying ∑ for each d.
Threshold values for CQPIs can be defined in order to make overall assessment.
They can be specified for each CQPI according to acceptable occurrence rates. Data
quality of and attribute for a specific DQ dimension can be evaluated by these
thresholds. Data quality can be classified as of very high quality, high quality,
medium quality, low quality and very low quality. Quality range can be more
diversified according to the criticality of the assessment. Data quality assessment for
a certain DQ dimension can be performed as follows:
{
DQAd denotes data quality assessment results for a given DQ dimension while T1, T2,
T3 and T4 denote threshold values based on desirable data quality levels for a bank.
Different threshold levels can be determined for different DQ dimensions depending
on criticality attributed to type of DQ dimension.
3.2.3 Phase 3: Analysis of data quality
Based on data quality assessment results obtained from evaluation of metrics,
analysis of data quality can be performed in order to investigate underlying causes of
data quality issues. DQ issues may arise in local areas or it can be structural ones
(e.g. issues related to IT infrastructure, issues related to data architecture etc.)
Generally speaking, data quality problems are the result of lack of effective data
management. As the complexity of data collected increases, data management
capabilities of banks could face difficulties leading to increase in risk of poor data
quality. There could be various reasons of poor data quality. Lee et al. (2006) states
common DQ challenges as multiple data sources, subjective assessment in data
production, security/accessibility trade-off and changing data requirements. Moges et
al. (2011 and 2013) and Moges (2014) revealed that inconsistency and diversity of
data sources are the overwhelming recurring challenges of data quality of credit risk
as a result of number of surveys conducted to financial institutions. Problems related
to data collection process which involves manual data entry processes are also found
to be one of the significant reason for poor DQ by the study. Borek et al. (2011)
classified DQ related problems in a systematic way. The study classifies fundamental
DQ problems in a two by two matrix. While one dimension groups the problems in
terms of context dependency, the other dimension groups them in terms of either data
or user perspectives.
Results and evaluation of quality performance metrics defined in Phase 2 on credit
risk data could imply underlying DQ challenges. We are going to explore possible
DQ challenges for those metrics defined based on DQ dimensions of accuracy,
completeness, uniqueness, consistency and timeliness. Poor quality performance in
each DQ dimension implies existence of certain DQ problems.

46
Problems related to uniqueness dimension
Duplicate records observed in a field which should be unique are regarded as
violation of uniqueness. Uniqueness of an attribute or a record can be violated due to
various reasons. Manual entry of records, uncontrolled consolidation of tables, and
use of multiple data sources carrying same data could be reasons of such violations.
If tables used in risk management system are created and filled manually then errors
made by data operators during manual entry process might be cause of duplicates. If
obligor identifiers such as tax ID or client ID in obligors table is duplicated then
there are problems in identification of primary keys. If PK/FK analysis for data
tables of credit risk is not properly performed, such problematic issues could easily
arise, lead to violation of uniqueness and produce duplicates. On the other hand, if
data tables used in risk management system are fed automatically by other systems
mentioned in Section 3.2.1.3, then, one may suspect from reproduction of a record
from different tables. If records are replicated from fragmented data tables located in
other systems, due to poor management on data consolidation could trigger such
problems. When violation of uniqueness condition for a certain attribute such as tax
ID of an obligor is detected, the record should be traced to its original source. For
example the process of obtaining tax ID from account management system should be
monitored until the final obligors table is used by risk management system. Column
analysis can be beneficial in initial detection of such anomalies.
Problems related to completeness dimension
Undesired null values in fields which should be full are regarded as violation of
completeness. Inability to satisfy completeness requirements of certain attributes
could also be caused by similar reasons that can be faced due to the difficulty of
guaranteeing uniqueness of an attribute. Manual entry of records, ETL problems
during automatic filling and communication problems among systems may cause
violation of completeness for certain fields. If data is inserted manually in the final
tables used by risk management system, errors during manual entry by data operators
could cause incompleteness of certain fields. Also, even if the process is automated,
some systematic error in extracting the data from another data source could still
prevent filling some fields. Results of performance metrics for different attributes
can contribute to detect underlying causes of the problem. Use of multiple data
sources which have incompatibilities among them may cause mismatch of data
values ultimately distorting completeness of information.
Problems related to accuracy dimension
Fields containing inaccurate values, i.e. violation of domain constraints can be
regarded as violation of accuracy of data. Accuracy of an attribute, a field or a record
can be distorted by several reasons. Manual entry of records, lack of controls on
domain constraints (data validation analysis), use of unstructured data sources, ETL
problems during transformation of original data may cause such violations. In
addition, use of multiple data sources for extraction same data can cause
inconsistencies. Moges et al. (2011 and 2013) and Moges (2014) stress that the
diversity of data sources may cause mismatches since they may not be updated or
changed simultaneously. This can cause inconsistency of final data with original data
sources. Data validation algorithms can be used to inspect authenticity of data against
the reference data set. Determination of reference data set is critical in this regard.

47
Accuracy problems due to violation of domain constraints can be traced via domain
analysis.
Problems related to consistency dimension
Inconsistencies observed among dependent fields can be regarded as violation of
consistency of data. DQ problems stated for accuracy dimension are also valid for
consistency dimension. Manual entry of records, use of multiple data sources
carrying same data, uncontrolled consolidation of tables, erroneous definition of
business rules, incapability of effective and adequate definition of data table
schemas, and failure to relate dependent fields to each other can be causes of such
violations. Inconsistencies among different data sources can distort consistency
dimension of an attribute. Consistency among different attributes could stem from
poor consolidation of original or temporary data tables which have different schema.
Lack in enforcement of business rules among various attributes consolidated from
different data tables could yield such anomalies. Application of schema matching
and semantic profiling can contribute to explore DQ issues concerning consistency
dimension.
Problems related to timeliness dimension
Problems revealed by the metrics defined for timeliness dimension can be caused by
manual update or change of data whose timeliness is critical for credit risk
management. If periodic update or change of final tables is not automatized, the risk
for miscalculation of risk items may increase. Other problems could be systematic
problems in automatized processes preventing timely update of data from other data
sources.
3.2.4 Phase 4: Improvement of data quality
Improvement of data quality of credit risk can be motivated by DQ problems
analyzed at phase 3. The criticality and severity of the underlying DQ problems will
determine the extent and urgency of improvement phase. Proposal for improvement
action can range from utilization of several improvement techniques on existing data
management system or information system to development of a totally new system
consisting of new infrastructure and data taxonomies. There is limited concern on
detailed exploration of improvement techniques and practical application of them for
data quality assessment in the literature. TDQM approach stresses the need for
identification of key areas for improvement such as alignment of information flow
and work flow with the corresponding information manufacturing system, and
realignment of the key characteristics of the information product with business
needs. Bonollo and Neri (2011) propose best practice methods based on centralized
approach to risk data with silo organizations involving integration of financial data
and risk data.
Improvement of data quality of credit risk data should cover both context-dependent
and context-independent requirements for data quality. Context-independent
requirements for data quality refer to the capability of banking system providing a
sound infrastructure and data governance for risk management system no matter the
content of data. Disintegration of systems according to their specific functions along
with convenient consolidation of data extracted from these systems for risk

48
management purposes is key for satisfaction of context-independent requirements for
data quality. Context-dependent requirements for data quality refers to developing
well-established data taxonomies in accordance with business rules, i.e. rules
enforced by the Basel framework, and data tables which are convenient for building
efficient relationships among them in order to quantify credit risk accurately and
effectively. DQ problems revealed at Phase 3 are key to investigate possible
improvement areas. That is, comprehensive analysis of the causes of DQ issues
contributes to identification of areas which should be improved.
If DQ problems stem from multiple data sources, linkages to these data sources and
existence of control points should be inspected. The possibility of consolidation of
different data sources providing same data should be investigated. This investigation
should include handling data inconsistencies and analysis of loss of data due to
consolidation.
DQ problems caused by manual errors should be analyzed by investigation of roles
and responsibilities of data operators. Identification of user roles/domains prone-to-
error is critical to reduce those errors. Such errors can be eliminated by reduction of
manual workarounds and increase of automatized operations. In addition, data
operations procedures might be updated.
DQ problems stem from the process of ETL should be inquired by analyzing the
steps of the process. Examination of those steps which are data collection
(extraction), transformation of original data to credit risk data, and transferring data
transformed to credit risk management system (load) will reveal weak areas of the
process that need to be improved.
DQ problems originated from inconsistencies among fields correlated to each other
due to erroneous definition of business rules can be worked out by redesigning data
tables with their attributes and relationships among these tables.
Analysis of those DQ issues will contribute to develop alternative set of solutions for
the areas in which DQ level should be improved. The solution set may range from
short-term and cost-effective solutions to long-term and expensive solutions. Short-
term solutions for improvement of DQ level can involve rapid changes or
modifications to the system while long-term solutions may require IT investment
involving development of a new IT infrastructure and data architecture. Selection
among several alternatives depends on the criticality and urgency of DQ issues and
strategic and economic impact of them on the bank‟s business. Cost-benefit analysis
of each viable alternative will contribute to selection of feasible and effective
solutions to resolve DQ issues confronted and to improve DQ level in those areas
where such issues emerge.
49
CHAPTER 4
IMPLEMENTATION AND RESULTS
Chapter 3 elaborated on the method for applying TDQM for bank credit risk data
from an IS perspective. The present chapter is devoted to the implementation of
TDQM phases identified in Chapter 3 for the specific case of the Turkish banking
sector. First, templates prepared for credit risk data by Turkish banking supervision
authority, BRSA, are discussed in terms of their eligibility for DQ and IT
requirements. Since these templates are used by banks to consolidate and present
their credit risk data, their conformance to database normalization rules are critical
for DQA. Then, credit risk data of a specific bank (ABC Bank, see Section 4.2)
belonging to a specific period (month) which is consolidated using the templates
provided by BRSA is assessed in terms of its DQ. Assessment is based on the
TDQM phases identified in Chapter 3. Then, results of DQA are presented. Since the
author of the present study has been a member of the team of auditors for ABC Bank,
the proposed method has been applied in the audit process applied during the period
April 2015 – May 2015 in order to identify major DQ problems causing deficiencies
in credit risk management. An action plan (see Section 4.2.4) based on the ensuing
audit report dated May 2015 has been prepared by ABC officers in order to resolve
the findings in the report.
4.1 Evaluation Credit Risk Data Forms
4.1.1 Content of Data Forms
BRSA has prepared four database tables in late 2013 so that banks report their credit
risk data on individual obligor and transaction basis. These tables are only used for
reporting credit risk under SA since no bank has been authorized to adopt and use
IRB approach due to the fact that the preparation of concerning regulation was not
completed yet by the end of July 2015. The aim for preparation and enforcement of
these data tables for SA was to standardize data format so as to minimize reporting
errors. The data forms are used during both on-site and off-site audits. Data tables are
titled as clients, credits, collateral, and repo and reverse repo transactions. The
critical data tables are clients, credits and collaterals. Repo and reverse repo
transactions are reported in a different table due to their specific nature although they
are certain type of credits or transactions. The scope of this study will cover clients,
credits and collaterals. Fields of these tables are given in Table 12, Table 13 and
Table 14.
Clients table contains information belonging to clients of the bank who have
transactions with the bank. Information regarding legal identity and location of the

50
client, financial statement if it is a firm, and risk category and risk weight of the
client are provided in this table.
Table 12 Clients table and its fields
CLIENTS
Field Name Data Type Description
Client ID Number Client ID given by the bank
Tax ID Number Tax ID or citizenship ID of the client
Client Name Text Name of the client (real person or legal entity)
Risk Category Code Text Risk category code of the client
Risk Category Name Text Risk category name of the client
Country Code Text Country code where the client resides
Client Risk Class Text Risk class of the client according to the regulation
Firm Turnover Currency Revenue amount if the client is a company
Firm Staff Size Number Staff size if the client is a company
Firm Asset Size Currency Active size amount if the client is a company
Firm Segment Text Segment (SME or corporate) if the client is a company
Table 13 Credits table and its fields
CREDITS
Field Name Data Type Description
Client ID Number Client ID given by the bank
Tax ID Number Tax ID or citizenship ID of the client
Trial Balance Code Text Trial balance record number of the credit
Credit Account No Text Credit account number allocated to the client
ISIN Code Text Unique ISIN codes of the securities
Credit Type Text Credit type codes according to credit characteristics
(such as being cash or non-cash)
Credit Open Date Date Date of credit issuance to the client
Credit Period Date Date of credit closing
Credit Conversion
Factor
Number Conversion factor for cash/non-cash credits
Credit Risk Class Text Credit risk class according to the regulation (8)
Currency Code Text Currency code of the credit issued
Credit Price Volatility Number Volatility adjustment
Credit Principal Currency Principal amount of the credit
Credit Interest Currency Accumulated interest amount of the credit
Provision/Loss Currency Provision/amortization/impairment amount if exits
Rating Grade Text Rating grade of the client
Credit Quality Level Number Credit quality level that rating grade matches
Credit Risk Weight Number Risk weight of the credit before CRM by collateral
Exposure Before CRM Currency Credit exposure value before using CRM technique
RWA After CRM Currency Risk-weighted credit exposure value after using CRM
technique
Balance Sheet Class Number Balance sheet number of the credit
TB or BB Text If the credit is recorded under “trading book” or
“banking book”
Foreign Exchange
Indexed
Text If the credit indexed to any foreign currency
CRA Rating1 Text Rating grade given by credit rating agency 1
CRA Rating2 Text Rating grade given by credit rating agency 2
CRA Rating3 Text Rating grade given by credit rating agency 3
CRA Rating4 Text Rating grade given by credit rating agency 4
OECD Rating Text OECD grade

51
Credits table contains information regarding transactions or credits of clients. This
table contains information belonging to obligors and transactions. It also includes
information regarding calculation of risk-weighted exposure amount for each
transaction record.
Collaterals table includes information regarding collaterals of clients. Information
regarding both benefiter and warrantor of the collateral is provided as well as
detailed information belonging to the collateral itself and its use on a specific credit
of the client.
Table 14 Collaterals table and its fields
COLLATERALS
Field Name Data Type Description
Client ID Number Client ID given by the bank
Client Tax ID Number Tax ID or citizenship ID of the client
Trial Balance Code Text Trial balance record number of the credit
Warrantor Tax ID Number Tax ID or citizenship ID of the warrantor
Collateral ID Text Collateral ID number
Collateral Type Text Collateral type
Currency Code Text Currency code of the collateral
Warrantor Risk Class Text Risk class of the warrantor
Collateral Fair Value Currency Fair value of the collateral
Mortgage Value Currency Mortgage value of the collateral
Collateral Value Allocated Currency Collateral value considered for the relevant credit
Collateral Currency
Volatility
Number Currency volatility value for the collateral
Collateral Price Volatility Number Price volatility value for the collateral
Maturity Adjustment Number Maturity adjustment value for the collateral
Collateral Value After
Adjustment
Currency Collateral value calculated after the adjustments
Rating Grade Text Rating grade of the collateral
Collateral Risk Weight Number Risk weight of the collateral
Collateral Country Code Text Country code of the collateral
Collateral Period Date Last date collateral is valid
Warrantor Client ID Text Client ID of the warrantor if exists
Appraisal Firm
Name/Code
Text Name/code of the real estate appraisal firm
Last Appraisal Date Date Last appraisal date of the collateral
Mortgage No Text Mortgage number of the collateral
Mortgage Degree Text Degree of the mortgage
Appraisal Report Code Text Code number of the appraisal report
CRA Rating1 Text Rating grade given by credit rating agency 1
CRA Rating2 Text Rating grade given by credit rating agency 2
CRA Rating3 Text Rating grade given by credit rating agency 3
CRA Rating4 Text Rating grade given by credit rating agency 4
OECD Rating Text OECD grade
4.1.2 Evaluation of Data Forms
In section 3.2.1.1, we categorized credit risk data under three main entities in
accordance with the Basel framework. These are obligors, transactions and credit
providers. Such categorization is formed in order to provide general schema of the

52
credit risk components. Data template constructed by BRSA has a similar
categorization. It consists of clients, credits, collaterals and repo and reverse repo
transactions. However, fields and contents of these tables need to be discussed in
terms of their effectiveness and efficiency. That is to say, data normalization is
required for eliminating redundancies and ensuring dependency of dependent fields.
Such normalization which leads to removal of transitive dependency contributes to
reduction of data amount duplicated and achievement of data integrity.
Data tables presented by BRSA can be criticized in several aspects bearing the
requirements of relational database in mind. One problem is the existence of
redundant fields which can be removed as their presence is not necessary for credit
risk management purposes or as they address similar information provided by other
fields. Another problem is aggregation of various fields in one table which causes
duplication of the same fields for each record. Decomposition of certain tables to sub
tables is necessary to eliminate such duplication and provide integrity among
records. Complexity of data structure can be minimized with decomposing and
reorganizing data table schemas that also foster comprehensibility of tables in terms
of data users in risk management.
Decomposition of credit risk data to viable data tables is prerequisite condition for
ensuring DQ of credit risk. Avoiding continuous repetition of certain data fields is
desired to achieve decrease in data amount to be stored and eliminate potential
database errors such as incompatibilities among records due to duplication.
Performing PK/FK analysis cited in Section 3.2.2.2 is crucial for normalization of
data tables, i.e. systematic decomposition of them. The analysis involves detection of
the best candidate fields for PKs and FKs.
Data table schema of clients proposed by BRSA does not require further
decomposition since it has sufficient information for client characteristics and there
is no repetition of any record upon involvement of a new transaction. However, data
table schemas of credits and collaterals require further decomposition due to
duplication of records when collaterals are attempted to be matched to collaterals for
credit risk mitigation and calculation. In fact, a new relationship table is required to
be formed for new instances of such matching process. To exemplify, a credit entity
can be covered by a collateral entity or more than one collateral entity, or it cannot be
covered by a collateral entity at all. Similarly, collateral may cover one or more
credit entities, or it may not cover any credit entity. In brief, they have a many-to-
many relationship. The problem arises due to the application of different risk weights
to the covered and uncovered portions of a credit. Furthermore, credit risk class of
the covered portion of a credit may even change in certain cases such as mortgage
credits. Therefore, a credit or a collateral entity might be divided into more than one
record. If not decomposed, that would cause duplication of all characteristics of a
credit or collateral, which increases the size of data. In addition, such a scheme
would increase complexity of risk calculation leading it to be prone to error.
Example cases for matching collaterals to credits and resulting entry numbers for
each case are provided in Figure 7. Thus, a new relationship table that can be formed
by decomposing certain data fields existing in credits and collateral tables is
required.

53
Figure 7 Example cases for data duplication due to credit and collateral matching
Decomposition of data tables of credit and collaterals proposed by BRSA to form a
new data table should be performed by considering following criteria:
Credits table should contain a sufficient number of data fields to represent all
relevant characteristics of a credit entity.
Uniqueness of credits in the credits table should be ensured (PK detection).
Collaterals table should contain a sufficient number of data fields to represent
all relevant characteristics of a collateral entity.
Uniqueness of collaterals in the collaterals table should be ensured (PK
detection).
Data fields belonging to either credits table or collaterals table that can be
derived from the relationship of collaterals and credits should be transferred
to the new data table schema.
Key identifiers of the new data table should be determined. That is, identifiers
and characteristics of clients, credits and collaterals should consistently be
represented in the new data table (FK detection).
Considering these criteria, a new data table named “Credit Risk” is created by
transferring certain fields from the existing data tables as well as adding new ones.
The schemas of existing tables are also modified accordingly.

54
Credit Risk table contains information belonging to clients, credits and collaterals.
Identifiers of these three entities are represented in the new table. Since there was no
unique identifier for credits table, a new data field uniquely identifying a credit entity
named “Credit ID” is created which is also represented in the new table. Due to
creation of new table, certain data fields become redundant. Identification of
redundant data can be performed via cross-domain analysis cited in Section 3.2.2.2.
One application area of cross-domain analysis involves detection of identification of
redundant data across columns in the same or different data tables. Redundancy of a
field can be uncovered by analyzing its relation to another field existing in the same
table or different data table. Elimination of redundant data is key to the process of
normalization of data tables. Redundant fields that can be removed without concern
of data loss in terms of credit risk management and causes for their redundancy are
provided in Table 15.
Table 15 Redundant fields that can be removed conveniently
Field Name Table Name Cause for redundancy
Tax ID Credits Credits table contains information only for credits, it is not
required in this table
Client ID Credits A new identifier field (Credit ID) is created for credits,
client ID is not required anymore since it is represented in
clients and credit risk table
Client ID Collaterals Collaterals table contains only information for collaterals,
relationships are transferred to credit risk table via “Client
ID” field.
Client Tax ID Collaterals Collaterals table contains information only for collaterals,
it is not required in this table
Trial Balance Code Collaterals Collaterals table contains information only for collaterals,
it is not required in this table
Warrantor Client ID Collaterals Warrantor tax ID is sufficient for identification of the
warrantor, warrantor client is irrelevant
Only fields required are transferred or copied to credit risk table to prevent duplicate
records. Transferred fields correspond to the fields removed from the original table
and added to the new table while copied fields correspond to the fields which are
both presented in the original table and the new table. In other words, they form
foreign keys of credit risk table which are used to establish relationship the tables of
obligors, credits and collaterals. These are the primary keys of these tables as well as
identifiers of them.
In addition to creation of “Credit ID” field as a primary key in credits table, a new
field also created in credit risk table named “Final Risk Weight”. This new field is
required to assign resulting risk weight to be applied to the credit portion of the
exposure which is either covered or uncovered (see Figure 7). Final risk weight is
determined by comparison between “credit risk weight” field from credits table and
“collateral risk weight” in collaterals table. Figure 8 summarizes the process of
decomposition of existing tables to form a relational data table. Fields removed,
added, transferred and copied are provided in the figure. Statistics for such
modification in the tables and the fields are also provided in Table 16. Although total
number of data fields slightly change, the effect on data amount stored can
significantly vary depending on the relationship among the entities of clients, credits
and collaterals.

55
Figure 8 Decomposition of existing data tables to form a new data table (Credit
Risk)
Table 16 Statistics for change in data field numbers of data tables
Table Name Existing field
number
Added field
number
Removed/transferred
field number
New field
number
Clients 11 - - 11
Credits 29 1 4 26
Collaterals 30 - 7 23
Credit Risk - 9 - 9
Total 70 10 11 69
The effect of the new schema on data amount to be stored can be illustrated as
follows: Let us say a bank has X number of clients, and Y number of credits and Z
number of collaterals belonging to those clients. Considering existing schemas of
data tables; 11 data fields for clients would have X records for clients table. Due to
multiplication of records for certain credits and collaterals in the tables of credits and
collaterals, lower record limits would be Y for credits table and Z for collaterals
table. On the other hand, upper limit for both tables would be Y times Z.
Client record number = X (11 fields)
Y ≤ Credit record number ≤ Y × Z (29 fields)
CREDITS CLIENTS COLLATERALS
Client ID Client ID Client ID
Credit ID Tax ID Client Tax ID
Tax ID Client Name Trial Balance Code
Trial Balance Code Risk Category Code Warrantor Tax ID
Credit Account No Risk Category Name Collateral ID
ISIN Code Country Code Collateral Type
Credit Type Client Risk Class Currency Code
Credit Open Date Firm Turnover Warrantor Risk Class
Credit Period Firm Personnel Number Collateral Fair Value
Credit Conversion Factor Firm Asset Size Mortgage Value
Credit Risk Class Firm Segment Collateral Value Allocated
Currency Code Collateral Currency Volatility
Credit Price Volatility Collateral Price Volatility
Credit Principal Maturity Adjustment
Credit Interest CREDIT RISK Collateral Value After Adjustment
Provision Loss Client ID Rating Grade
Rating Grade Credit ID Collateral Risk Weight
Credit Quality Level Collateral ID Collateral Country Code
Credit Risk Weight Final Risk Weight Collateral Period
Exposure Before CRM Exposure Before CRM Warrantor Client ID
RWA After CRM Collateral Value Allocated Appraisal Firm Name/Code
Balance Sheet Class Maturity Adjustment Last Appraisal Date
TB or BB Collateral Value After Adjustment Mortgage No
Foreign Exchange RWA After CRM Mortgage Degree
CRA Rating1 Appraisal Report Code
CRA Rating2 CRA Rating1
CRA Rating3 New field added CRA Rating2
CRA Rating4 Field moved to new table CRA Rating3
OECD Rating ABC Field removed CRA Rating4
ABC Field copied to the new table OECD Rating

56
Z ≤ Collateral record number ≤ Y × Z (30 fields)
However, after formation of the new schemas, the boundaries for record numbers for
the respective tables in addition to the new data table will change. While record
numbers of clients, credits and collaterals will be exactly X, Y and Z, respectively;
the relationship table, i.e. credit risk table, will change from zero (no instance due to
no allocation of collaterals to any credit) to Y times Z (not practical though).
Client record number = X (11 fields)
Credit record number = Y (26 fields)
Collateral record number = Z (23 fields)
0 ≤ Credit risk record number ≤ Y × Z (9 fields)
An interesting conclusion can be inferred from these constraints. As the relationship
among credits and collaterals gets complicated, i.e. higher number of instances where
a credit is covered by multiple collaterals of the client or collateral covers multiple
credits; record numbers get closer to the upper limit of the boundaries. In such cases,
data amount that has to be stored in existing schema would exceed that in the new
schema. The reason for this is trivial. (29 – 9) fields for credits and (30 – 9) fields for
collaterals would not be duplicated in the new situation.
The amount of data to be stored under the existing and the new schemas has been
compared on dummy values for number of clients (X), number of credits (Y) and
number of collaterals (Z). Assumptions for the inputs of the comparison are as
follows:
A client has 3 credits on average (Y = 3 × X).
A client has 1,5 collaterals on average (Z = 1,5 × X).
The number of records in the Credits Table is Y times kcredit factor for the
existing schema. For example, if kcredit = 2 then each credit occupy two
records on average.
The number of records in the Credits Table is Y times kcollateral factor for the
existing schema. For example, if kcollateral = 2 then each credit will occupy two
records on average.
The number of records in the Credit Risk Table is krelation times maximum of
Y and Z for the new schema. For example, if krelation = 2 then the number of
records in the Credit Risk Table will be 2 × max(Y, Z) on average.
Increase in X, Y and Z is proportional to each other as data size increases.
Total number of data values in all tables is considered as basis of comparison
for data amount in the existing and new schemas.
Total number of data values (number of data cells) of a table is calculated by
multiplying the number of fields in a table by the number of records in it.
Based on the assumptions listed, various k-factor values are used to plot total number
of data values for the existing and the new schemas. K-factor values of 1, 1,5 and 2,5
are used for kcredit, kcollateral and krelation. Results of the analysis are presented in Figure
9, Figure 10 and Figure 11.

57
Figure 9 Comparison of total number of data values between the existing and the
new schemas (all k-factors=1)
Figure 10 Comparison of total number of data values between the existing and the
new schemas (all k-factors=1,5)

58
Figure 11 Comparison of total number of data values between the existing and the
new schemas (all k-factors=2)
When exact match of credits with collaterals are observed, i.e. one-to-one relation
exits and no uncovered portion remains when a credit is covered, which is not a
practical case, data amount that needs to be maintained for the two schemas are fairly
close to each other; though new schema has slightly higher amount of data provided
in Figure 9. As the interaction between credits and collaterals table gets
sophisticated, more data storage area is required for the existing schema than that of
the new schema as observed in Figure 10 and Figure 11.
4.2 Data Quality Assessment: A Bank Case
In this section, we are going to assess DQ of credit risk data of an actual bank
operating in Turkey using TDQM phases tailored for credit risk in Chapter 3. The
name of the bank will be kept confidential due to privacy reasons. We denote this
bank as “ABC Bank”. Credit risk data dates to February of 2015. It consists of data
belonging to clients, credits and collaterals of ABC Bank which is submitted in the
form of the existing schema of data tables prepared by BRSA. Statistics for these
tables are provided in Table 17.
Table 17 Statistics for credit risk data tables of ABC Bank
Data table name Data field number Average number of record per
client/credit/collateral
Clients 11 1
Credits 29 1,18
Collaterals 30 1,99
DQ dimensions for the fields of the existing tables will be explored in Section 4.2.1.
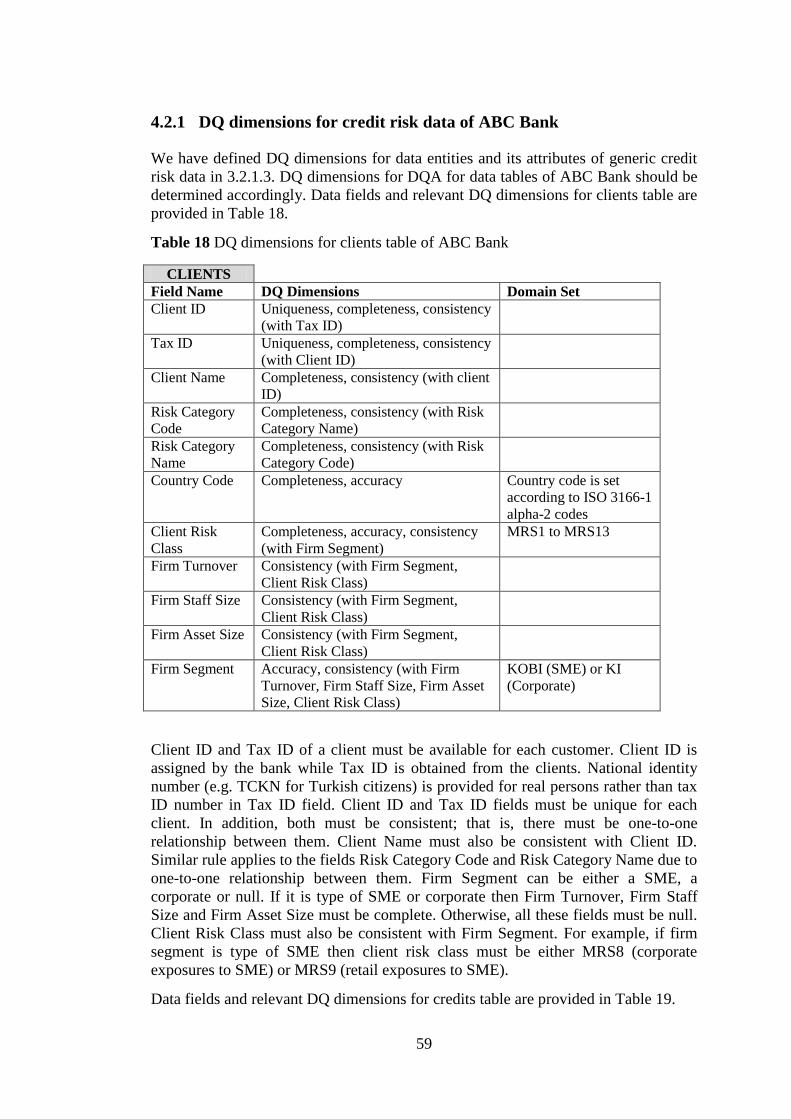
59
4.2.1 DQ dimensions for credit risk data of ABC Bank
We have defined DQ dimensions for data entities and its attributes of generic credit
risk data in 3.2.1.3. DQ dimensions for DQA for data tables of ABC Bank should be
determined accordingly. Data fields and relevant DQ dimensions for clients table are
provided in Table 18.
Table 18 DQ dimensions for clients table of ABC Bank
CLIENTS
Field Name DQ Dimensions Domain Set
Client ID Uniqueness, completeness, consistency
(with Tax ID)
Tax ID Uniqueness, completeness, consistency
(with Client ID)
Client Name Completeness, consistency (with client
ID)
Risk Category
Code
Completeness, consistency (with Risk
Category Name)
Risk Category
Name
Completeness, consistency (with Risk
Category Code)
Country Code Completeness, accuracy Country code is set
according to ISO 3166-1
alpha-2 codes
Client Risk
Class
Completeness, accuracy, consistency
(with Firm Segment)
MRS1 to MRS13
Firm Turnover Consistency (with Firm Segment,
Client Risk Class)
Firm Staff Size Consistency (with Firm Segment,
Client Risk Class)
Firm Asset Size Consistency (with Firm Segment,
Client Risk Class)
Firm Segment Accuracy, consistency (with Firm
Turnover, Firm Staff Size, Firm Asset
Size, Client Risk Class)
KOBI (SME) or KI
(Corporate)
Client ID and Tax ID of a client must be available for each customer. Client ID is
assigned by the bank while Tax ID is obtained from the clients. National identity
number (e.g. TCKN for Turkish citizens) is provided for real persons rather than tax
ID number in Tax ID field. Client ID and Tax ID fields must be unique for each
client. In addition, both must be consistent; that is, there must be one-to-one
relationship between them. Client Name must also be consistent with Client ID.
Similar rule applies to the fields Risk Category Code and Risk Category Name due to
one-to-one relationship between them. Firm Segment can be either a SME, a
corporate or null. If it is type of SME or corporate then Firm Turnover, Firm Staff
Size and Firm Asset Size must be complete. Otherwise, all these fields must be null.
Client Risk Class must also be consistent with Firm Segment. For example, if firm
segment is type of SME then client risk class must be either MRS8 (corporate
exposures to SME) or MRS9 (retail exposures to SME).
Data fields and relevant DQ dimensions for credits table are provided in Table 19.

60
Table 19 DQ dimensions for credits table of ABC Bank
CREDITS
Field Name DQ Dimensions Domain Set
Client ID Completeness,
consistency (with Tax
ID)
Tax ID Completeness,
consistency (with Client
ID)
Trial Balance Code Completeness, accuracy In accordance with Turkish
Accounting Standards (TAS – TMS
in Turkish)
Credit Account No Completeness
ISIN Code Accuracy Structure is according to ISO 6166,
12-character alpha numerical code
Credit Type Completeness, accuracy NK or NKKF (for cash credits),
GNAxx, GNBxx, GNCxx or GNDxx
(for non-cash credits), KTRxxx (for
counterparty risk), DA (for other
credits)
Credit Open Date Completeness, timeliness
Credit Period Completeness, timeliness
Credit Conversion Factor Completeness, accuracy,
consistency (with Credit
Type)
0%, 20%, 50% or 100%
Credit Risk Class Completeness, accuracy ARS01 to ARS19
Currency Code Completeness, accuracy Currency code is set according to
ISO 4217 standards
Credit Price Volatility -
Credit Principal Completeness
Credit Interest -
Provision Loss -
Rating Grade Accuracy Depends on the rating scale of CRA
used
Credit Quality Level Accuracy 1 to 6
Credit Risk Weight Completeness, accuracy 0%, 20%, 50%, 75%, 100%, 150%,
200%, 250%
Exposure Before CRM Completeness
RWA After CRM Completeness
Balance Sheet Class Completeness, accuracy 1 to 20, or 27, 48, 50 or 51
TB or BB Completeness, accuracy TB or BB
Foreign Exchange Indexed Accuracy Y (Yes) or null
CRA Rating1 Accuracy Depends on the rating scale of CRA
CRA Rating2 Accuracy Depends on the rating scale of CRA
CRA Rating3 Accuracy Depends on the rating scale of CRA
CRA Rating4 Accuracy Depends on the rating scale of CRA
OECD Rating Accuracy The rating scale of OECD
Data fields and relevant DQ dimensions for collaterals table are provided in Table
20.

61
Table 20 DQ dimensions for collaterals table of ABC Bank
COLLATERALS
Field Name DQ Dimensions Domain Set
Client ID Completeness, consistency
(with Tax ID)
Client Tax ID Completeness, consistency
(with Client ID)
Trial Balance Code Completeness
Warrantor Tax ID Completeness, consistency
(with Warrantor Client ID)
Collateral ID Completeness
Collateral Type Completeness, accuracy T1-T12
Currency Code Completeness, accuracy Currency code is set according to
ISO 4217 standards
Warrantor Risk Class Completeness, accuracy TRS01-TRS16
Collateral Fair Value Completeness, consistency
(with Collateral Type)
Mortgage Value Consistency (with Collateral
Type)
Collateral Value Allocated Completeness
Collateral Currency
Volatility
Consistency (with Collateral
Value After Adjustment)
Collateral Price Volatility Consistency (with Collateral
Value After Adjustment)
Maturity Adjustment Consistency (with Collateral
Value After Adjustment)
Collateral Value After
Adjustment
Consistency (with Collateral
Price Volatility)
Rating Grade Accuracy
Collateral Risk Weight Accuracy 0%, 20%, 50%, 75%, 100%, 150%,
200%, 250%
Collateral Country Code Completeness, Accuracy Country code is set according to
ISO 3166-1 alpha-2 codes
Collateral Period Completeness
Warrantor Client ID -
Appraisal Firm
Name/Code
Consistency (with Collateral
Type)
Last Appraisal Date Consistency (with Collateral
Type)
Mortgage No Consistency (with Collateral
Type)
Mortgage Degree Accuracy, consistency (with
Collateral Type)
1 to 3
Appraisal Report Code Consistency (with Collateral
Type)
CRA Rating1 Accuracy Depends on the rating scale of CRA
CRA Rating2 Accuracy Depends on the rating scale of CRA
CRA Rating3 Accuracy Depends on the rating scale of CRA
CRA Rating4 Accuracy Depends on the rating scale of CRA
OECD Rating Accuracy The rating scale of OECD

62
4.2.2 DQ metrics for ABC Bank
DQ metrics for generic credit risk data were defined in Section 3.2.2.1 in accordance
with DQ dimensions identified in Section 3.2.1.3. Now we are going to define DQ
metrics for DQA of credit risk data of ABC Bank accordingly. The metrics defined
below are expressed in more general terms since they have similar structure for a
given DQ dimension regardless of the field in concern. However, there can be
differences in details of the metric for accuracy and consistency dimension since DQ
metrics related to these dimensions depend on specific business rules, i.e. they are
context dependent. This section contains identification of DQ metrics for credit risk
data of ABC Bank, Structured Query Language (SQL) queries for measurement of
the metrics identified and results of these queries.
4.2.2.1 Identification of DQ metrics
DQ metrics for DQ dimensions necessary for DQA of credit risk data of ABC Bank
are identified in this section.
Uniqueness
The following metric applies to all fields that requires fulfillment of uniqueness
dimension indicated in Table 18.
Total number of records in clients table that have duplicate records for certain
FIELD that must be unique to total number of all records in the table
Accuracy
The following metric applies to all fields that requires fulfillment of accuracy
dimension indicated in Table 18, Table 19 and Table 20.
Total number of records in clients/credits/collaterals table whose certain
FIELD violates domain constraints of that field to total number of all records
in the table (clients/credits/collaterals)
Completeness
The following metric applies to all fields that requires fulfillment of completeness
dimension indicated in Table 18, Table 19 and Table 20.
Total number of records in clients/credits/collaterals table whose certain
FIELD that must be non-null is null to total number of all records in the table
(clients/credits/collaterals)
Consistency
The following metric applies to all fields that requires fulfillment of completeness
dimension indicated in Table 18, Table 19 and Table 20.
Total number of records in clients/credits/collaterals table whose certain
FIELD value contradicts with the value(s) of other dependent fields(s) to total
number of all records in the table (clients/credits/collaterals)

63
Timeliness
The following metric applies to all fields that requires fulfillment of timeliness
dimension indicated in Table 19 and Table 20.
Total number of records in credits/collaterals table whose certain FIELD was
updated before date DD.MM.YYYY to total number of all records in the
table (credits/collaterals)
4.2.2.2 SQL queries for measurement of DQ metrics
SQL queries are extensively used in data profiling which is referred as the process of
examining the data available in an existing data source and collecting statistics and
information about that data3. SQL queries are required for data profiling since it
involves dealing with complex algorithms (Naumann, 2013). Data profiling
addresses quantitative aspect of DQA. Therefore, SQL queries can be useful in
applying the DQA methods described in Section 3.2.2.2. Credit risk data of ABC
Bank available in hand can allow to carry out PK/FK analysis, column analysis,
cross-domain analysis, domain analysis and semantic profiling. DQ metrics defined
for credit risk data of ABC bank can be expressed via SQL queries. Results of SQL
queries can be used to evaluate performance of DQ metrics. Structures of SQL
queries for the DQ dimensions identified are provided as follows:
SQL query for identifying violations of uniqueness:
Violation of uniqueness for a unique field can be detected by finding duplicate
records in that field. Column analysis can be performed to detect such duplicates.
Use of the following SQL query is one way to perform column analysis for detection
of duplicate records. The query will bring out the records having duplicates along
with the number of duplication times.
"SELECT Field_Name, COUNT(Field_Name) FROM Table_Name GROUP BY
Field_Name HAVING COUNT(Field_Name) > 1"
The result of the query is not enough. Summing duplication times less one of all the
records displayed and comparing it to the total number of all records in the table will
produce a DQ metric for assessment uniqueness dimension of the field. Specific SQL
queries used for assessing uniqueness dimension are provided in APPENDIX B.
SQL query for identifying violations of completeness:
Violation of completeness requirement of a field can be detected by finding null
values in that field. Column analysis can be performed to detect such null values.
Use of the following SQL query is one way to perform column analysis for detection
null values. The query will bring out the number of null values in that field.
"SELECT COUNT(*) FROM Table_Name WHERE Field_Name Is Null"
Comparing the result of the query to the total number of records in the table will
produce a DQ metric for assessment of completeness dimension of the field. Specific
3 https://en.wikipedia.org/wiki/Data_profiling

64
SQL queries used for assessing completeness dimension are provided in APPENDIX
B.
SQL queries for identifying violations of accuracy:
Detection of violation of accuracy for a field can be tricky due to its dependence on
the domain constraints of the field. Domain constraints are usually mandated by
business rules. Domain analysis can be performed to detect violation of the domain
constraints. Use of the following SQL query is one way to perform domain analysis
to the fields of tables of credit risk data. The query is a more general form for
detection of violation of domain constraints. Conditions are imposed on the relevant
field to check whether the record value for the field satisfy the range of the domain
specified.
"SELECT COUNT(*) FROM Table_Name WHERE Field_Name1 [Operator1]
Value1 AND/OR Field_Name1 [Operator2] Value2 AND/OR … AND/OR
Field_Name1 [OperatorN] ValueN"
Value1 to ValueN denote values for domain constraints while Operator1 to
OperatorN denote operators that prevent to meet domain constraints. Comparing the
result of such a query to the total number of records in concerning table will produce
a DQ metric for assessment of accuracy dimension of the field. Specific SQL queries
used for assessing accuracy dimension are provided in APPENDIX B.
SQL queries for identifying violations of consistency:
Detection of violation of consistency for a field can be tricky due to its dependence
on the business rules imposed and relationships among the fields. Cross-domain
analysis and semantic profiling can be performed to detect inconsistencies among
several fields. The following SQL query is a more general form for detection of
violation of business rules among different fields. The query involves monitoring
more than one field.
"SELECT COUNT(*) FROM Table_Name WHERE Field_Name1 [Operator1]
Value1 AND/OR Field_Name2 [Operator2] Value2 AND/OR … AND/OR
Field_NameN [OperatorN] ValueN"
Value1 to ValueN denote values for domain constraints while Operator1 to
OperatorN denote operators that prevent to meet business rules. The query can be
used as an example of performing cross-domain analysis and semantic profiling.
Comparing the result of such a query to the total number of records in concerning
table will produce a DQ metric for assessment of consistency dimension of the field.
Specific SQL queries used for assessing consistency dimension are provided in
APPENDIX B.
SQL queries for identifying violations of timeliness:
Since there is no specific information on when credit risk data values of ABC Bank
are updated, no SQL query is built for the timeliness dimension.
4.2.2.3 Results of calculation of DQ metrics for credit risk data of ABC Bank
Calculation of DQ metrics for credit risk data of ABC Bank identified in Section
4.2.2.1 via SQL queries created in Section 4.2.2.2 will be performed in this section.

65
Specific SQL queries created for credit risk data tables of ABC Bank are provided in
APPENDIX B.
DQ metrics for each dimension are calculated and provided in Table 21, Table 22,
Table 23 and Table 24. The metrics refer to violation rates which are calculated by
proportioning number of observed violations in a table to total number of records in
that table.
Table 21 Results of SQL queries for uniqueness dimension
DQ Metric
Code
Relevant Field(s) Reference Table Violation Rate Reference SQL Query
(APPENDIX B)
UNQ1 Client ID Clients 0% Query1
UNQ2 Tax ID Clients 0,01% Query2
Table 22 Results of SQL queries for completeness dimension
DQ Metric
Code
Relevant Field(s) Reference Table Violation Rate Reference SQL Query
(APPENDIX B)
CMP1 Client ID Clients 0% Query3
CMP2 Tax ID Clients 54,92% Query4
CMP3 Client Name Clients 0% Query5
CMP4 Risk Cat. Code Clients 89,75% Query6
CMP5 Risk Cat. Name Clients 89,75% Query7
CMP6 Country Code Clients 0% Query8
CMP7 Cl. Risk Class Clients 0% Query9
CMP8 Client ID Credits 0% Query10
CMP9 Tax ID Credits 42,21% Query11
CMP10 Credit Acc. No Credits 0% Query12
CMP11 Trial Bal. Code Credits 0% Query13
CMP12 Credit Type Credits 0% Query14
CMP13 Cr. Open Date Credits 0% Query15
CMP14 Credit Period Credits 0% Query16
CMP15 Cr. Conv. Fac. Credits 0% Query17
CMP16 Cr. Risk Class Credits 0% Query18
CMP17 Currency Code Credits 0% Query19
CMP18 Credit Principal Credits 0% Query20
CMP19 Cr. Risk Weight Credits 0% Query21
CMP20 Exp. Before CRM Credits 0% Query22
CMP21 RWA After CRM Credits 0% Query23
CMP22 Bal. Sheet Class Credits 0% Query24
CMP23 TB or BB Credits 0% Query25
CMP24 Client ID Collaterals 0% Query26
CMP25 Client Tax ID Collaterals 34,18% Query27
CMP26 Trial Bal. Code Collaterals 0% Query28
CMP27 Warrantor Tax ID Collaterals 33,45% Query29
CMP28 Collateral ID Collaterals 0% Query30
CMP29 Collateral Type Collaterals 0% Query31
CMP30 Currency Code Collaterals 0% Query32
CMP31 War. Risk Class Collaterals 0% Query33
CMP32 Coll. Fair Value Collaterals 0% Query34
CMP33 Coll. Value Alloc. Collaterals 0% Query35
CMP34 Coll. Coun. Code Collaterals 0% Query36
CMP35 Coll. Period Collaterals 0% Query37

66
Number of violation of uniqueness is quite low. Tax ID of several clients has been
duplicated in clients table cause of which should be investigated. Uniqueness
dimension is not relevant to credits and collaterals tables of ABC Bank.
Certain fields from tables of clients, credits and collaterals contain significant rates of
violations of completeness. More than half of records in clients table do not have tax
IDs. Similar issues related to availability of tax IDs belonging to either clients or
warrantors also exist in credits and collaterals table. Availability of risk category
names and codes of the clients is quite low, as much as 10%.
Table 23 Results of SQL queries for accuracy dimension
DQ Metric
Code
Relevant Field(s) Reference Table Violation Rate Reference SQL Query
(APPENDIX B)
ACC1 Client Risk Class Clients 0% Query38
ACC2 Firm Segment Clients 0% Query39
ACC3 Trial Bal. Code Credits 0% Query40
ACC4 Credit Type Credits 0% Query41
ACC5 Cr. Conv. Factor Credits 0% Query42
ACC6 Credit Risk Class Credits 0% Query43
ACC7 Cr. Quality Level Credits 0% Query44
ACC8 Cr. Risk Weight Credits 0% Query45
ACC9 Bal. Sheet Class Credits 0% Query46
ACC10 TB or BB Credits 0% Query47
ACC11 For. Exc. Indexed Credits 0% Query48
ACC12 Collateral Type Collaterals 0% Query49
ACC13 War. Risk Class Collaterals 0% Query50
ACC14 Coll. Risk Weight Collaterals 0% Query51
ACC15 Mortgage Degree Collaterals 0% Query52
There is no violation observed in accuracy of the fields as their domain constraints
are not violated.
Inconsistencies due to violation of business rules are observed in three areas in
general. These are the violation of the rules imposed on firm segment (SME or
corporate), risk category of and real estate collaterals of clients. Turnover, active size
and staff size information of certain firms who are type of SME or corporate are not
specified in clients table. Most of the real estate collaterals does not contain
information about mortgage degree, mortgage number, mortgage value, and appraisal
of the real estate (appraisal firm, appraisal report, last appraisal date).
There are total of 67 metrics have been identified for DQA of credit risk data of ABC
Bank. Of these, 2 metrics belong to uniqueness dimension; 35 metrics belong to
completeness dimension; 15 metrics belong to accuracy dimension and 15 metrics
belong to consistency dimension.

67
Table 24 Results of SQL queries for consistency dimension
DQ
Metric
Code
Relevant Field(s) Reference
Table
Violation
Rate
Reference SQL
Query
(APPENDIX B)
CNS1 Client ID, Tax ID Clients 0% Query53
CNS2 Tax ID, Client ID Clients 0,01% Query54
CNS3 Risk Cat. Code, Risk Cat. Name Clients 3,61% Query55
CNS4 Risk Cat. Name, Risk Cat. Code Clients 3,61% Query56
CNS5 Client Risk Class, Firm Segment Clients 0% Query57
CNS6 Firm Segment, Firm Turnover Clients 43,84% Query58
CNS7 Firm Segment, Staff Size Clients 6,28% Query59
CNS8 Firm Segment, Firm Asset Size Clients 38,31% Query60
CNS9 Credit Type, Credit Conv. Factor Credits 0% Query61
CNS10 Collateral Type, Mortgage Value Collaterals 87,68% Query62
CNS11 Collateral Type Mortgage Degree Collaterals 87,68% Query63
CNS12 Collateral Type, Mortgage No Collaterals 87,68% Query64
CNS13 Collateral Type, Appr. Firm Name Collaterals 87,68% Query65
CNS14 Collateral Type, Appr. Report Code Collaterals 87,68% Query66
CNS15 Collateral Type, Last Appraisal Date Collaterals 87,68% Query67
4.2.2.4 KQPIs and CQPIs for DQA
The metrics identified in 4.2.2.1 can be transformed to KQPIs and CQPIs defined in
3.2.2.3 in order to evaluate quality performance of credit risk data of ABC Bank.
Violations rates obtained in 4.2.2.3 can be used to calculate KQPIs and CQPIs.
Deduction of violation rates from the total outcomes, i.e. 100%, will yield non-
violation rates which can be transformed to standardized values that fall into certain
standard scale. Then, each standardized value can denote a KQPI that represents
performance of a field for a given DQ dimension. Weights for each KQPI can be
determined according to the significance of the field for credit risk measurement and
calculation. CQPI for each dimension can be constructed by summing up weighted
KQPIs where sum of weights add up to one. In the case of credit risk data of ABC
Bank, KQPI scale is used as the range between 0 and 10. KQPI having value of 10
means perfect quality performance in that field while value of 0 corresponds to the
worst quality performance.
Weights of KQPI to form CQPI are determined based on four cases. In the first case
(Case 1), all fields are treated equally. In other cases (Case 2, Case3 and Case 4),
weights are determined according to significance of the fields for credit risk
calculation.
For this purpose, data fields of the relevant tables are grouped under three clusters
based on their effect on credit risk calculation as described in Section 3.2.2.3. Cluster
A contains the fields which are directly represented as parameters in credit risk
function. Cluster B contains the fields that affect the parameters in credit risk
function. Cluster C contains the fields that do not have significant effect on credit
risk calculation. The fields are clustered in Table 25.
Weights of each cluster, which are used to calculate CQPIs by weighted sums of
KQPIs are determined based on their significance for credit risk calculation. Weights
of the fields in Cluster C are taken zero for all three cases (Case 2, Case 3 and Case

68
4). Weights of Cluster A is taken greater than or equal to those of Cluster B. Weight
of Cluster A and Cluster B are equal in Case 2 while Weight of Cluster A is two
times higher in Case 3 and three times higher in Case 4 that that of Cluster B.
Table 25 Clustering data fields of credit risk tables according to their significance for
credit risk calculation
Cluster Description Data fields in the cluster Weight for the
cluster
Cluster A: Fields
directly represented as
parameters in credit risk
function
Credit Period, Credit Conversion Factor, Credit
Price Volatility, Credit Principal, Credit Interest,
Provision/Loss, Credit Risk Weight, Exposure
Before CRM, RWA After CRM, Collateral Fair
Value, Collateral Value Allocated, Collateral Price
Volatility, Maturity Adjustment, Collateral Value
After Adjustment, Collateral Risk Weight,
Collateral Period, Mortgage Value, Mortgage
Degree
Wa
Cluster B: Fields
affecting parameters in
credit risk function
Risk Category Code, Risk Category Name, (Client)
Country Code, (Collateral) Country Code, Client
Risk Class, Firm Turnover, Firm Staff Size, Firm
Asset Size, Firm Segment, Trial Balance Code,
Credit Type, Credit Open Date, Credit Risk Class,
(Credit) Currency Code, (Collateral) Currency
Code, (Obligor) Rating Grade, Credit Quality
Level, Balance Sheet Class, TB or BB, Foreign
Exchange Indexed, Collateral Type, Warrantor Risk
Class, (Collateral) Rating Grade, CRA Rating1,
CRA Rating2, CRA Rating3, CRA Rating4, OECD
Rating
Wb
Cluster C: Fields not
having significant effect
on credit risk calculation
Client ID, (Client) Tax ID, Client Name, Credit
Account No, ISIN Code, Warrantor Tax ID,
Collateral ID, Warrantor Client ID, Appraisal Firm
Name/Code, Last Appraisal Date, Mortgage No,
Appraisal Report Code
Wc = 0
Wa = k × Wb ; Cases: k = 1, 2, 3
Weights of each field are determined accordingly for uniqueness, completeness,
accuracy and completeness dimensions and presented in Table 26, Table 27, Table
28 and Table 29, respectively. Calculation of KQPIs and CQPIs are performed in
accordance with the formulas proposed in 3.2.2.3 for the DQ dimensions and results
of CQPIs are presented in Table 30.

69
Table 26 KQPIs and CQPIs for uniqueness dimension
DQ
Metric
Code
Violation
Rate
KQPI Relevant
Field(s)
Cluster Weight
(C:1)
Weight
(C:2)
(k=1)
Weight
(C:3)
(k=2)
Weight
(C:4)
(k=3)
UNQ1 0% 10 Client ID C 0,5 0 0 0
UNQ2 0,01% 9,999 Tax ID C 0,5 0 0 0
Table 27 KQPIs and CQPIs for completeness dimension
DQ
Metric
Code
Violati
on Rate
KQPI Relevant Field(s) Cluster Weight
(C:1)
Weight
(C:2)
(k=1)
Weight
(C:3)
(k=2)
Weight
(C:4)
(k=3)
CMP1 0% 10 Client ID C 0,029 0,000 0,000 0,000
CMP2 54,92% 4,51 Tax ID C 0,029 0,000 0,000 0,000
CMP3 0% 10 Client Name C 0,029 0,000 0,000 0,000
CMP4 89,75% 1,03 Risk Cat. Code B 0,029 0,040 0,029 0,023
CMP5 89,75% 1,03 Risk Cat. Name B 0,029 0,040 0,029 0,023
CMP6 0% 10 Country Code B 0,029 0,040 0,029 0,023
CMP7 0% 10 Client Risk Class B 0,029 0,040 0,029 0,023
CMP8 0% 10 Client ID C 0,029 0,000 0,000 0,000
CMP9 42,21% 5,78 Tax ID C 0,029 0,000 0,000 0,000
CMP10 0% 10 Credit Acc. No C 0,029 0,000 0,000 0,000
CMP11 0% 10 Trial Bal. Code B 0,029 0,040 0,029 0,023
CMP12 0% 10 Credit Type B 0,029 0,040 0,029 0,023
CMP13 0% 10 Credit Open Date B 0,029 0,040 0,029 0,023
CMP14 0% 10 Credit Period A 0,029 0,040 0,059 0,070
CMP15 0% 10 Credit Conv. Fac. A 0,029 0,040 0,059 0,070
CMP16 0% 10 Credit Risk Class B 0,029 0,040 0,029 0,023
CMP17 0% 10 Currency Code B 0,029 0,040 0,029 0,023
CMP18 0% 10 Credit Principal A 0,029 0,040 0,059 0,070
CMP19 0% 10 Cr. Risk Weight A 0,029 0,040 0,059 0,070
CMP20 0% 10 Exp. Before CRM A 0,029 0,040 0,059 0,070
CMP21 0% 10 RWA After CRM A 0,029 0,040 0,059 0,070
CMP22 0% 10 Bal. Sheet Class B 0,029 0,040 0,029 0,023
CMP23 0% 10 TB or BB B 0,029 0,040 0,029 0,023
CMP24 0% 10 Client ID C 0,029 0,000 0,000 0,000
CMP25 34,18% 6,58 Client Tax ID C 0,029 0,000 0,000 0,000
CMP26 0% 10 Trial Bal. Code B 0,029 0,040 0,029 0,023
CMP27 33,45% 6,66 Warrantor Tax ID C 0,029 0,000 0,000 0,000
CMP28 0% 10 Collateral ID C 0,029 0,000 0,000 0,000
CMP29 0% 10 Collateral Type B 0,029 0,040 0,029 0,023
CMP30 0% 10 Currency Code B 0,029 0,040 0,029 0,023
CMP31 0% 10 War. Risk Class B 0,029 0,040 0,029 0,023
CMP32 0% 10 Coll. Fair Value A 0,029 0,040 0,059 0,070
CMP33 0% 10 Coll. Value Alloc. A 0,029 0,040 0,059 0,070
CMP34 0% 10 Coll. Count. Code B 0,029 0,040 0,029 0,023
CMP35 0% 10 Collateral Period A 0,029 0,040 0,059 0,070

70
Table 28 KQPIs and CQPIs for accuracy dimension
DQ
Metric
Code
Violation
Rate
KQPI Relevant Field(s) Cluster Weight
(C:1)
Weight
(C:2)
(k=1)
Weight
(C:3)
(k=2)
Weight
(C:4)
(k=3)
ACC1 0% 10 Client Risk Class B 0,067 0,067 0,053 0,043
ACC2 0% 10 Firm Segment B 0,067 0,067 0,053 0,043
ACC3 0% 10 Trial Bal. Code B 0,067 0,067 0,053 0,043
ACC4 0% 10 Credit Type B 0,067 0,067 0,053 0,043
ACC5 0% 10 Credit Conv. Fac. A 0,067 0,067 0,105 0,130
ACC6 0% 10 Credit Risk Class B 0,067 0,067 0,053 0,043
ACC7 0% 10 Cr. Quality Level B 0,067 0,067 0,053 0,043
ACC8 0% 10 Cr. Risk Weight A 0,067 0,067 0,105 0,130
ACC9 0% 10 Bal. Sheet Class B 0,067 0,067 0,053 0,043
ACC10 0% 10 TB or BB B 0,067 0,067 0,053 0,043
ACC11 0% 10 For. Exc. Indexed B 0,067 0,067 0,053 0,043
ACC12 0% 10 Collateral Type B 0,067 0,067 0,053 0,043
ACC13 0% 10 War. Risk Class B 0,067 0,067 0,053 0,043
ACC14 0% 10 Coll. Risk Weight A 0,067 0,067 0,105 0,130
ACC15 0% 10 Mortgage Degree A 0,067 0,067 0,105 0,130
Table 29 KQPIs and CQPIs for consistency dimension
DQ
Metric
Code
Violation
Rate
KQPI Relevant Field(s) Cluster Weight
(C:1)
Weight
(C:2)
(k=1)
Weight
(C:3)
(k=2)
Weight
(C:4)
(k=3)
CNS1 0% 10 Client ID C 0,067 0,000 0,000 0,000
CNS2 0,01% 9,999 Tax ID C 0,067 0,000 0,000 0,000
CNS3 3,61% 9,639 Risk Cat. Code B 0,067 0,077 0,063 0,053
CNS4 3,61% 9,639 Risk Cat. Name B 0,067 0,077 0,063 0,053
CNS5 0% 10 Client Risk Class,
Firm Segment
B 0,067 0,077 0,063 0,053
CNS6 43,84% 5,616 Firm Segment,
Firm Turnover
B 0,067 0,077 0,063 0,053
CNS7 6,28% 9,372 Firm Segment,
Firm Per. Number
B 0,067 0,077 0,063 0,053
CNS8 38,31% 6,169 Firm Segment,
Firm Asset Size
B 0,067 0,077 0,063 0,053
CNS9 0% 10 Credit Type, CCF A 0,067 0,077 0,125 0,158
CNS10 87,68% 1,232 Collateral Type,
Mortgage Value
A 0,067 0,077 0,125 0,158
CNS11 87,68% 1,232 Collateral Type,
Mortgage Degree
A 0,067 0,077 0,125 0,158
CNS12 87,68% 1,232 Collateral Type,
Mortgage No
B 0,067 0,077 0,063 0,053
CNS13 87,68% 1,232 Collateral Type,
Appr. Firm Name
B 0,067 0,077 0,063 0,053
CNS14 87,68% 1,232 Collateral Type,
Appr. Rep. Code
B 0,067 0,077 0,063 0,053
CNS15 87,68% 1,232 Collateral Type,
Last Appr. Date
B 0,067 0,077 0,063 0,053
Since there is no field directly affecting credit risk calculation in KQPIs formed for
uniqueness dimension, all weights are assumed to be equal for all the cases.
Therefore, CQPIs yield the same result for all the cases. Due to application of this
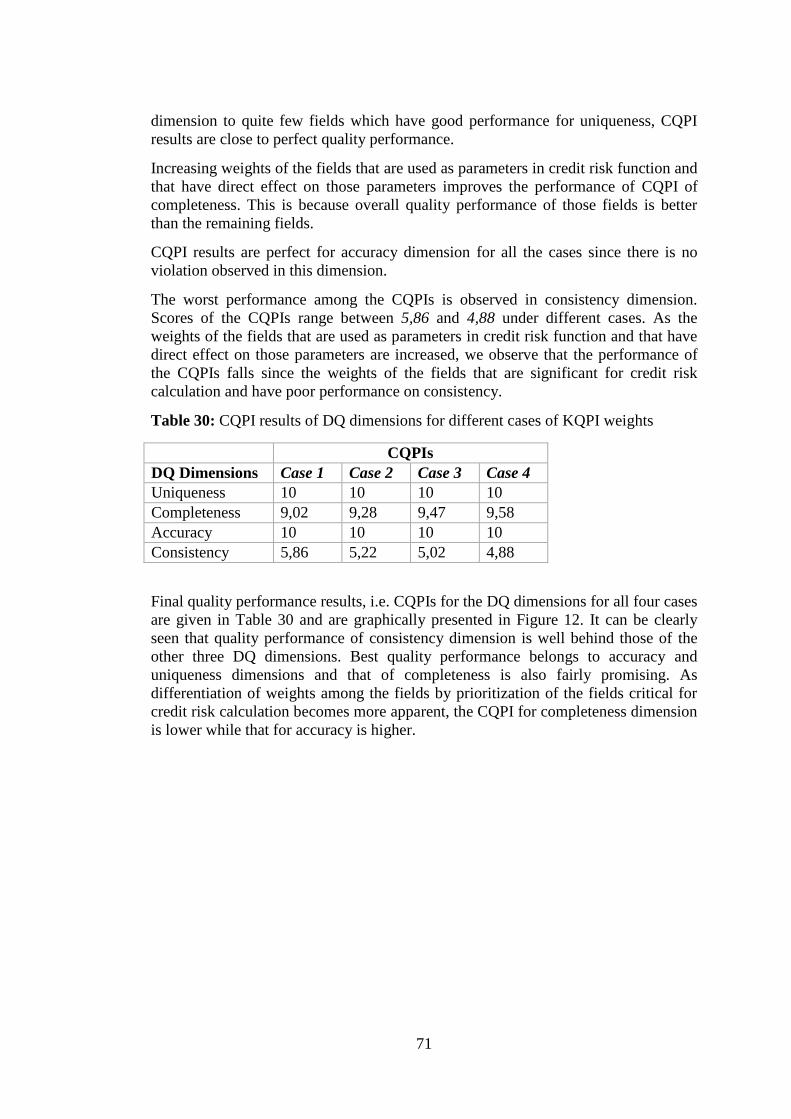
71
dimension to quite few fields which have good performance for uniqueness, CQPI
results are close to perfect quality performance.
Increasing weights of the fields that are used as parameters in credit risk function and
that have direct effect on those parameters improves the performance of CQPI of
completeness. This is because overall quality performance of those fields is better
than the remaining fields.
CQPI results are perfect for accuracy dimension for all the cases since there is no
violation observed in this dimension.
The worst performance among the CQPIs is observed in consistency dimension.
Scores of the CQPIs range between 5,86 and 4,88 under different cases. As the
weights of the fields that are used as parameters in credit risk function and that have
direct effect on those parameters are increased, we observe that the performance of
the CQPIs falls since the weights of the fields that are significant for credit risk
calculation and have poor performance on consistency.
Table 30: CQPI results of DQ dimensions for different cases of KQPI weights
CQPIs
DQ Dimensions Case 1 Case 2 Case 3 Case 4
Uniqueness 10 10 10 10
Completeness 9,02 9,28 9,47 9,58
Accuracy 10 10 10 10
Consistency 5,86 5,22 5,02 4,88
Final quality performance results, i.e. CQPIs for the DQ dimensions for all four cases
are given in Table 30 and are graphically presented in Figure 12. It can be clearly
seen that quality performance of consistency dimension is well behind those of the
other three DQ dimensions. Best quality performance belongs to accuracy and
uniqueness dimensions and that of completeness is also fairly promising. As
differentiation of weights among the fields by prioritization of the fields critical for
credit risk calculation becomes more apparent, the CQPI for completeness dimension
is lower while that for accuracy is higher.

72
Figure 12 Performance of CQPIs of DQ dimensions for different cases of KQPI
weights
Designation of threshold values for DQA of the relevant DQ dimensions as proposed
in Section 3.2.2.3 depends on the purpose of DQA and perception of criticality of the
fields in concern. Criteria for setting threshold values for DQA of credit risk data can
be based on subjective judgment and/or objective values.
4.2.3 Analysis of results of DQA for ABC Bank
The performance results of the DQ metrics provided in Section 4.2.2 can be analyzed
to investigate the causes of poor DQ and underlying problems. We observe that the
deterioration of DQ for relevant DQ dimension stems from poor and uncontrolled
population of certain fields in various tables. Tax ID of both clients and warrantors
0
1
2
3
4
5
6
7
8
9
10
Uniqueness Completeness Accuracy Consistency
Sco
re
Performance of CQPIs of DQ dimensions
Case 1
Case 2
Case 3
Case 4
0
2
4
6
8
10Uniqueness
Completeness
Accuracy
Consistency
Performance of CQPIs of DQ dimensions
Case 1
Case 2
Case 3
Case 4

73
reduces quality performance for various DQ dimensions. Unavailability of Tax IDs
for considerable amount of clients causes such deterioration in uniqueness,
completeness and consistency of data records belonging to all three tables. Risk
Category Code and Risk Category Name fields existing in clients table also cause
poor DQ for consistency and completeness. Unavailability and incorrect population
of these fields deteriorates DQ in terms of completeness and consistency of these
fields. Unavailability of firm information such as turnover, asset size and staff size
for SMEs or corporates also causes inconsistencies among the fields; Firm Segment,
Firm Turnover, Firm Asset Size and Firm Staff Size. Collaterals that are type of real
estate also lack information about the real estate such as mortgage and appraisal
information. Unavailability of Mortgage Value, Mortgage No, Mortgage Degree,
Appraisal Firm Name, Appraisal Report Code and Last Appraisal Date for Collateral
Type being real estate causes poor performance of DQ for consistency dimension.
Thus, consistency performance of credit risk data is poor due to DQ problems in
certain fields that have strong dependence on more than one field. Such dependence
leads to spreading of DQ problems to the correlated fields, which reduces DQ
performance with multiplicative effect.
ABC Bank was asked for an explanation regarding the problems confronted in the
fields mentioned above. The bank has provided the outline of data collection and
production process and explained the causes of deficiencies in satisfaction of DQ.
Production process of credit risk data of ABC bank is carried out through an
application named “Credit Risk Management for Banking” (CRMB) embedded in a
commercial software package used by the bank for credit risk management purposes.
Raw data from the core banking software existing in the database of the bank were
collected via Extract, Transform and Load (ETL) process and they were transferred
to the database management system (DBMS). A second ETL process transforms
these raw data to the format that can be used as input for the CRMB application.
Processing of credit risk data in this application consists of four steps. These steps
are:
1. ETL process – collection of raw data from DBMS, transformation of raw data
to appropriate data format for CRMB application and determination of
parameters rule sets for CRMB;
2. Matching credits with collaterals by using the new data format in accordance
with rule set and calculation of ratios for credit risk management;
3. Formation of data tables via CRMB application that will be source for final
outputs that contains results of credit risk calculation;
4. Production of final output tables for credit risk calculation in such a format
that can be submitted to data transfer system of BRSA.
The current process of production and reporting of credit risk data summarized above
is illustrated in APPENDIX C provided by the IT department of ABC Bank.
The underlying cause of the incompleteness and inconsistencies of the fields cited at
the beginning of this section arises from the static nature of CRMB application which
involves processes of creation, use and deletion of sophisticated data tables for credit
risk calculation which prevent involvement of the users. Adaptation of the
application for a new resulting data table format is very difficult due to prevention of
such involvement. The final output table produced only contains risk calculation

74
results in credit risk class level. When detailed report based on individual client,
credit and/or collateral is desired; the application cannot provide data for all fields.
Since temporary tables created for credit risk calculation in the third step are deleted
after production of the resulting table, data belonging to certain fields cannot be
accessed anymore. Thus, unavailability of data for those fields is mostly caused by
ETL process which does not transfer input data to the resulting tables.
Another cause of the unavailability of those fields arises at the very beginning of data
collection process from the clients. There is no well-integrated data collection system
throughout the various branches of the bank. Data collected from the client by
different branches are not systematically controlled while entering them into core
banking software. Lack of such control leads to entrance of incomplete and
inconsistent data.
4.2.4 DQ improvement actions for credit risk data of ABC Bank
Improvement techniques for DQ of a certain context depends on the nature of DQ
problems that are revealed as a result of analysis of DQA results and investigation of
causes of such problems as addressed in Section 3.2.3. Analysis of DQA results
carried out in 4.2.3 reveals that there is a black box for the process of data
transformation and credit risk calculation via matching credits of clients with
collaterals of them, in which there is no possibility to monitor details of such
transformation and matching and to manipulate temporary data tables created during
the process. The process which is executed by CRMB application cannot provide
some of the fields necessary for credit risk management and control due to loss or
unavailability of transient data tables. Another revelation of the analysis is the lack of
integrated data collection system for client information throughout the all units or
branches of the core banking software of ABC Bank. Based on these findings,
possible areas for improvement of quality of credit risk data are suggested as follows:
As a short term solution, certain steps for process of production of credit risk
data can be extracted from the black box so that the process of transformation
of raw data and matching of credits with collaterals be more transparent and
enable manipulation of data more easily. Challenges in implementing this
solution may arise depending on ability of the bank to intervene the structure
of the application due to complexity of codes and privacy concerns of the
vendor. Since business rules imposed by the Basel framework for credit risk
management are embedded in this application, the extent of intervention in
the structure of the application would be limited.
As a long term solution, in-house solutions can be developed which can
relieve the bank from dependence on the vendors, which limit capability of
the bank in processing data. A new investment for IT infrastructure due to
such solution requires budget and time. Cost-benefit analysis of such analysis
should be performed carefully. On the other hand, dynamic nature of the new
system would enable the bank to ensure quality of its credit risk and adapt
and implement new business rules more comfortably.
Data collection should be performed more systematically. Roles, functions
and responsibilities for the process must be defined clearly and distributed
accordingly throughout the bank organization. Check points must be
established for entrance of certain types of data that belong to clients in

75
different hierarchical levels so that errors caused by manual entry operations
are minimized. Above all, the whole process should be integrated to the credit
risk management system.
Implementation of some of the proposals outlined above will help the bank to
achieve higher quality of its credit risk data which will enable the bank to accurately
quantify, measure and calculate its risk exposure issues.
Since the author of the present study has been a member of the team of auditors for
ABC Bank, the present method discussed in Chapter 3 was applied as described in
Chapter 4 in the audit process during the period April 2015 – May 2015 in order to
identify major DQ problems causing deficiencies in credit risk management. An
action plan based on our findings reported May 2015 has been prepared by ABC
officers in order to resolve the issues pointed out in the report. The action plan is
focused mainly on reducing dependency on the software of the vendor which limits
the capability of the bank in extracting and processing credit risk data. All four steps
of the process of credit data production summarized in Section 4.2.3 are performed
by the CRMB application of the software used in credit risk calculations while the
action plan intends to internalize most of these steps (excluding Step 2 in which a
calculation engine matches credits with collaterals optimally) rather than outsourcing
to the vendor. The fundamental steps of the action plan are presented in APPENDIX
D.

76

77
CHAPTER 5
VALIDATION OF THE DQA APPROACH
This chapter is devoted to assessing the applicability and validity of the DQA
approach proposed by carrying out a comprehensive survey addressing numerous
Turkish banks. The survey questionnaire (APPENDIX E) mainly consists of two
parts and an appendix. The first part investigates ongoing data quality assessment
activities within the banks surveyed and their understanding of the concept of data
quality in credit risk management. The second part requests evaluation of the
proposed approach by the banks‟ risk management seniors. The appendix presents
the approach in order to help banks understand its details.
5.1 General information about the participants of the questionnaire
The questionnaire has been prepared and sent to 46 banks present in the sector;
however, thirteen of those banks have responded to the survey. Some banks sent their
apologies for not participating in the survey due to their lack of time arising from
having to prepare end-of-year reports while some other banks sent their apologies
stating that they, as risk management department, cannot individually respond to the
questionnaire since it requires to involve participation of all stakeholders within the
bank organization which would take very long time periods.
When we studied the participant profiles of the thirteen banks who participated, we
observed that all participants were senior managers working within either risk
management departments or equivalent units. Also, risk management departments of
some banks have got support from IT departments or several other departments of
their own banks as suggested by the questionnaire. Participant profiles of the banks
surveyed are outlined in Table 31. Asset sizes and types of the banks are also
provided in the table. Asset size of the banks is grouped under three classes. Class
„A‟ refers to those banks having asset size higher than 100 billion TL, Class „B‟
refers to those banks having asset size between 10 billion TL and 100 billion TL, and
Class C refers to those banks having asset size lower than 10 billion TL. The banks
are of type either deposit or development and investment.

78
Table 31 General information about the participants of the questionnaire
Bank
No
Asset Size
Group
Bank Type Participant
Title
Department/Unit Experience
(years)
Bank1 A Deposit Basel II
Validation
Manager
Risk Management 6
Bank2 A Deposit Assist. Credit
Risk Manager
Risk Management 16
Bank3 C Development
& Investment
Assistant
Manager/
Assistant
Manager
Risk Management/
Financial Control
8/17
Bank4 B Deposit Manager Capital Management 8
Bank5 C Deposit Manager Risk Management 17
Bank6 B Deposit Manager/
Senior
Engineer
Credit Risk Analytics
& Capital
Management/ IT
15/?
Bank7 B Deposit Manager Risk Management 20
Bank8 B Deposit Manager Risk Management 17
Bank9 C Development
& Investment
(Risk)
Manager/
(Credit Risk)
Manager
Risk Management 16/12
Bank10 C Deposit Manager Risk Management 15
Bank11 C Development
& Investment
Manager Risk Management 20
Bank12 B Deposit Manager Risk Weighted Asset
Reporting
13
Bank13 C Deposit Competent Risk Management 27
Average 15,9
5.2 Findings of the Questionnaire
This section will present the findings of the questionnaire which inquires both
ongoing data quality activities within the banks and evaluation of the banks towards
our proposed approach.
5.2.1 Data Quality Assessment Activities within the Banks
The findings of the part of the survey that inquires ongoing data quality assessment
within the banks are provided in this section.
All surveyed banks except one consider that there should somewhat exist a specific
approach or method in order to assess quality of credit risk. As Figure 13 indicates,
most banks agree that there is a significant need for a specific approach.

79
Figure 13 Banks' view on necessity for a specific approach for credit risk DQA
Only one of the banks stated that there is no any ongoing DQA activity performed in
credit risk management of the bank as shown in Figure 14.
Figure 14 Banks performing DQA activities in credit risk management
In order to understand which activities in data quality assessment process are
performed by the banks, participants are inquired as to whether they perform
activities similar to the ones defined in our approach. The responses are depicted in
Figure 15.
5
2
5
1
Necessity for a specific approach for credit risk DQA
Definitely required
Significantly required
Partially required
Definitely not required
12 92%
1 8%
DQA activities performed within the bank
Performed
Not performed

80
Figure 15 Data quality assessment activities performed by the banks
The activity mostly performed by banks is identification of credit risk data sources
and its integration to the risk management system. Other most performed activities
are definition of data taxonomies and identification of improvement areas with viable
actions. On the other hand, the least performed activity is analysis of DQ
performance and detection of causes of DQ problems. One of the banks does not
perform any activity listed in our survey.
Data quality assessment methods of banks are observed to include both qualitative
and quantitative elements. Self-evaluation results of their DQA methods by the banks
in terms of quantitativeness versus qualitativeness are given in Figure 16. There is no
bank that applies purely quantitative assessment method. On the other hand, there is
one bank that performs the assessment purely on a qualitative basis. We observe that
DQA methods of the banks are evenly distributed in being whether they tend to be
more quantitative or qualitative.
0% 10% 20% 30% 40% 50% 60% 70%
Data taxonomy for credit risk context
Detection of credit risk data sources andintegration of them to risk management system
Definition of data quality dimensions for credit riskcontext
Development of DQ metrics
Measurement of DQ performance via DQ metrics
Analysis of DQ performance and detection ofcauses of poor DQ
Identification of improvement areas and actions toimprove DQ
Comprehensive cost/benefit analysis for viableimprovement actions
None
Presence of DQA activities (%)
Presence of DQA activities (%)

81
Figure 16 Quantitativeness versus Qualitativeness of DQA methods used by the
banks
Our approach has identified four main data categories one of which is derived from
the other three as described in Section 3.2.1.1. Those categories contain final data
that are used in credit risk management and more specifically credit risk calculation.
The banks participating in the survey were also inquired as to which categories they
use in their credit risk management practices. The responses are presented in Table
32.
Table 32 Classification of credit risk data by the banks
Bank No Classification of Credit Risk Data
Bank1 Clients, Credits (including collaterals), Parameter tables (CCF,
classification etc.), Rating tables based on credit/client
Bank2 Clients, Credit Cards, Derivative transactions, Personal loans,
Commercial loans, Collaterals
Bank3 Credits, Collaterals, Repos, Derivative financial instruments, Securities
portfolio, Clients-trial balance
Bank4 Clients, Credits, Collaterals, Client groups, Rating grades, Scorecards
Bank5 Clients, Credits, Collaterals, Trial balance, Country ratings
Bank6 Clients, Credits, Collaterals
Bank7 Clients, Credits, Collaterals, Rating system, Approving authorities
Bank8 Clients, Credit type (cash/non-cash), Interest type (fixed/variable),
Collaterals
Bank9 Clients, Credits, Collaterals, Client/firm group information, Risk
classes, Client types, Non-performing loans
Bank10 Clients, Credit types (cash/non-cash), Collateral types
Bank11 Clients, Credits, Transaction type, Client groups
Bank12 All details of the clients based the account number
Bank13 Clients, Credits, Collaterals, Limits
0
1
2
3
4
5
6
7
8
9
10
0 1 2 3 4 5 6 7 8 9 10 11 12 13 14← Q
UA
LıTA
TıV
ENES
S -
Q
UA
NTI
TATI
VEN
ESS →
BANKS
Quantitative vs. Qualitative

82
The categories presented by the banks demonstrate considerable variation. Although
almost all banks have distinct tables for clients, credits and collaterals; there are
additional tables used in credit risk management. Certain banks have divided their
transactions into different tables such as personal loans, commercial loans,
derivatives, securities portfolio and repos. Several banks count rating system under
one of the categories. Some banks have created distinct tables for identifying client
groups. We infer that banks can categorize their credit risk data based on their
portfolio content. Our approach combines most of the distinct tables of the banks in a
number of data categories. There is also a different perspective between the data
taxonomy of our approach and those of the banks in that they also contain data tables
which are considered under supplementary system in our approach. Rating system,
parameter tables and trial balance can be given as examples.
Our approach has determined four supplementary systems that feed data to risk
management system in the definition phase of the approach in Section 3.2.1.2. Those
are account management system, accounting system, collateral management system
and rating system. Use rates of those systems obtained from the survey questionnaire
are provided in Figure 17. Survey findings indicate that accounting system is used by
all banks as expected. Other systems mostly used as data source for risk management
system are account management system and collateral management system. Near
half of the banks use data obtained from their rating system. There are certain banks
that use additional data sources different than the systems identified by the approach
we have proposed. Two banks state that they also gather information from “core
banking system”. This system is the software used to support most common
transactions of banks such as managing accounts, loans, deposits and payments. In
other words, it contains some of the systems proposed by the approach and it
integrates them with an interface. One bank uses an additional system for non-
performing loans.
Figure 17 Data source systems used by the banks
Our approach has defined five data quality dimensions in the definition phase of the
approach in Section 3.2.1.3. Those data quality dimensions are completeness,
0% 10% 20% 30% 40% 50% 60% 70% 80% 90% 100%
Account Management System
Accounting System
Collateral Management System
Rating System
Other
Data Source Systems Used By the Banks
Data Source Systems Used By the Banks

83
uniqueness, consistency, accuracy and timeliness. Use rate of those dimensions
obtained from survey results are provided in Figure 18. Survey findings show that
the majority of banks use all of those dimensions in their data quality assessment
activities. All banks surveyed use accuracy and consistency dimensions. One bank
uses a data quality dimension other than those defined in our approach. This
dimension is “coherence” which is defined by the bank as conformance to reference
data set (data from external tables).
Figure 18 Use of data quality dimensions across the banks
Survey findings show that 5 out of the 13 participating banks use data quality metrics
in order to measure data quality performance for given data quality dimension. That
implies it is ambiguous what majority of banks use as reference in order to perform
DQA.
DQA methods that can be used to measure the performance of the metrics created
have been given in Section 3.2.2.2. Banks were asked to provide which DQM
methods they were using in their quality assessment of credit risk data. Findings are
provided in Figure 19. The most commonly used method is data validation. The next
commonly used method is column analysis. About half of the responding banks also
use semantic profiling, domain analysis, cross-domain analysis and primary
key/foreign key analysis. Schema matching and matching algorithms are the less
commonly used methods by the banks. One bank also uses a method referred as
“Trend Analysis”. This method is used by the bank instead of matching algorithms in
order to identify duplicate values.
0% 10% 20% 30% 40% 50% 60% 70% 80% 90% 100%
Completeness
Uniqueness
Consistency
Accuracy
Timeliness
Other
Use of Data Quality Dimensions
Use of Data Quality Dimensions

84
Figure 19 DQA methods that are used by the banks
Eight of the banks state that they prioritize data types used in credit risk management
since they consider that certain data types are critical for credit risk management.
When banks are asked to state the purpose why they are performing DQA according
to their priority for credit risk management, great majority of them put allocating
accurate capital by calculating credit risk accurately at first place as shown in Figure
20. One bank considers it is the second most important purpose while another bank
puts it at third place in DQA in credit risk. In addition, all the banks surveyed view
this purpose among the first three ones. Majority of banks consider verifying quality
of data obtained from other data sources via IS infrastructure to be the second most
significant purpose in DQA in credit risk while some banks put it at third place and
some banks do not view it as one of the most important purposes of DQA. More than
half of the banks have stated that ensuring reliability of data used in credit risk
management as input for credit risk calculations is the third most significant purpose
in their DQA practices while a bank considers it as the most desired purpose for
performing DQA and certain banks consider its importance at second place. One
bank has also additional purposes for DQA other than the choices provided in the
questionnaire. The bank states that the most important purpose of DQA is to ensure
the rating systems of the bank make the right decisions in such areas as credit
allocation and monitoring, budget planning, risk appetite.
0% 10% 20% 30% 40% 50% 60% 70% 80% 90% 100%
Column analysis
Data validation
Cross-domain analysis
Domain analysis
Primary key/foreign key analysis
Semantic profiling
Lexical analysis
Matching algorithms
Schema matching
Other
DQA Methods
DQA Methods

85
Figure 20 Precedence of purposes of data quality assessment across the banks
Survey findings indicate that the most frequently encountered problems are missing
data values and duplicate records. About half of the banks surveyed have stated that
they experience those data quality problems. The least commonly encountered
problem has come out as data values violating domain constraints. On the other hand,
about one third of the banks state that they do not experience any data quality
problem.
Figure 21 Data quality problems experienced by the banks
Inquiring the causes of those data quality problems, the findings presented in Figure
22 have been obtained. The most critical cause of the problems is suggested as
0%
10%
20%
30%
40%
50%
60%
70%
80%
90%
100%
Allocating accuratecapital by calculatingcredit risk accurately
Verifying quality of dataobtained from other
sources
Enhancing reliability ofdata used in credit riskmanagement as input
Other
Purposes of Data Quality Assessment in Banks
1st purpose 2nd purpose 3rd purpose 4th purpose
0% 10% 20% 30% 40% 50% 60% 70% 80% 90% 100%
Duplicate records
Missing data values
Data values violating domain constraints
Inconsistency of data values in different fields ortables
Outdated data values
None
Data quality problems in banks
Data quality problems in banks

86
manual data entry. Majority of the banks view this cause as critical. The next most
critical causes are observed to be consolidation of data from multiple tables and
inability to update data simultaneously in all relevant tables. Other than lack of
central database, all other causes suggested in the questionnaire are somewhat
experienced by the banks surveyed. On the other hand, three banks out of thirteen
banks surveyed have stated that none of the causes provided are encountered in their
data quality management activities.
Figure 22 The causes of data quality problems experienced by the banks
The banks surveyed stated that they have already applied improvement methods to
some extent in order to solve data quality issues they faced as shown in Figure 23.
About half of the banks have implemented solutions that have changed IT
infrastructure significantly. Others have implemented solutions that have partly
changed IT infrastructure or that are patch solutions not affecting IT infrastructure
significantly. On the other hand, two banks have expressed that there has been no
improvement activity performed.
0% 10% 20% 30% 40% 50% 60% 70%
Manual data entry
Consolidation of data from multiple tables
Inadequacy of IT infrastructure
Complexity of IT infrastructure
Use of many temporary tables before final tables
Lack of central database
Inability to update data simultaneously in all tables
Lack of controls for data constraints
Inaccurate definition of business rules
None
Causes of Data Quality Problems
1st important cause 2nd important cause 3rd important cause

87
Figure 23 Solutions for improvement of data quality performed by the banks
When banks were inquired as to the criteria they take into consideration in selecting
methods for improvement of data quality, they point out that they focus more on
legal applicability of the method as indicated in Figure 24. Costs, benefits and
practical applicability of the method are the other most favored criteria for the banks
surveyed. The least favored criterion is acceptance of the method within the bank.
One bank does not state any selection criterion since it does not use any
improvement method.
Figure 24 Selection criteria for methods of data quality improvement
6
3
2
2
Solutions for improvement of data quality
Solutions significantly changing ITinfrastructure
Solutions partly changing ITinfrastructure
Patch solutions not seriouslychanging IT infrastructure
No solution implemented
0% 10% 20% 30% 40% 50% 60% 70% 80% 90% 100%
Costs
Benefits
Practical applicability
Acceptance within bank
Legal applicability
No method selected
Selection Criteria for Improvement Methods
1st criteria 2nd criteria 3rd criteria 4th criteria 5th criteria
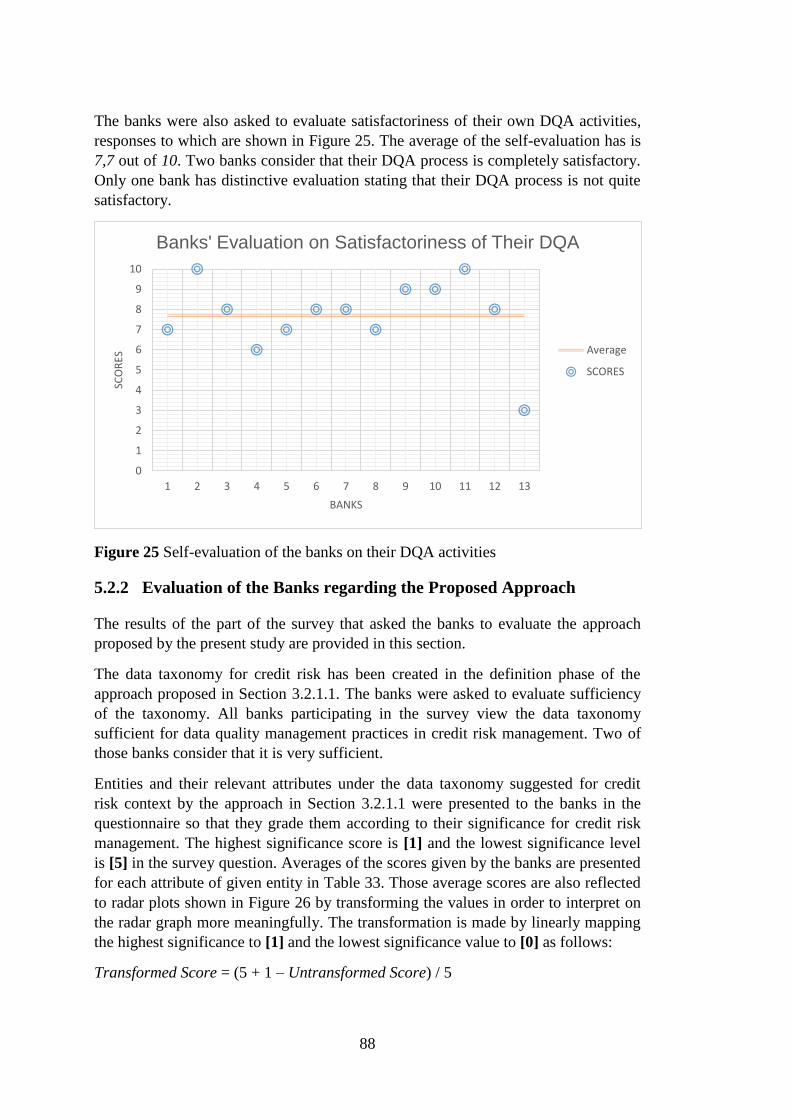
88
The banks were also asked to evaluate satisfactoriness of their own DQA activities,
responses to which are shown in Figure 25. The average of the self-evaluation has is
7,7 out of 10. Two banks consider that their DQA process is completely satisfactory.
Only one bank has distinctive evaluation stating that their DQA process is not quite
satisfactory.
Figure 25 Self-evaluation of the banks on their DQA activities
5.2.2 Evaluation of the Banks regarding the Proposed Approach
The results of the part of the survey that asked the banks to evaluate the approach
proposed by the present study are provided in this section.
The data taxonomy for credit risk has been created in the definition phase of the
approach proposed in Section 3.2.1.1. The banks were asked to evaluate sufficiency
of the taxonomy. All banks participating in the survey view the data taxonomy
sufficient for data quality management practices in credit risk management. Two of
those banks consider that it is very sufficient.
Entities and their relevant attributes under the data taxonomy suggested for credit
risk context by the approach in Section 3.2.1.1 were presented to the banks in the
questionnaire so that they grade them according to their significance for credit risk
management. The highest significance score is [1] and the lowest significance level
is [5] in the survey question. Averages of the scores given by the banks are presented
for each attribute of given entity in Table 33. Those average scores are also reflected
to radar plots shown in Figure 26 by transforming the values in order to interpret on
the radar graph more meaningfully. The transformation is made by linearly mapping
the highest significance to [1] and the lowest significance value to [0] as follows:
Transformed Score = (5 + 1 – Untransformed Score) / 5
0
1
2
3
4
5
6
7
8
9
10
1 2 3 4 5 6 7 8 9 10 11 12 13
SCO
RES
BANKS
Banks' Evaluation on Satisfactoriness of Their DQA
Average
SCORES

89
The banks have rated all the attributes defined for the data entities under credit risk
context as over a certain significance level (the arithmetic average of all significance
levels from [1] to [5]). Therefore, they view each of the attributes considerably
significant for credit risk management based on the average scores assigned by the
banks.
The most significant obligor attribute is risk group of the obligor on the average
according to the banks. On the other hand, the least significant obligor attribute
seems to be obligor identity. Transaction amount appears to be the most significant
attribute of transaction entity on the average while accounting record is viewed as the
least significant attribute according to the banks‟ responses. The banks consider the
type of credit protects as the most significant attribute of credit protection entity
whereas the identity (ID number) of credit protection is regarded as the least
significant attribute. Allocated protection amount and risk weighted exposure after
credit risk mitigation are the most significant attributes for credit risk management
while obligor identity attribute of the relationship entity, credit risk function, is the
least significant one according to the banks evaluation.
Table 33 Average of scores assigned by the banks to the importance of the proposed
attributes of credit risk data entities by the banks
Entity Attribute Average Importance
(1-highest, 5-lowest)
Obligors
Obligor Identity 2,69
Obligor Type 2,00
Financial Statement (for firms) 1,62
Staff Size (for firms) 2,69
Obligor Credibility (rating) 1,62
Risk Group 1,54
Transactions
Transaction Identity 2,15
Accounting Record 2,38
Transaction Type 1,46
Credit Conversion Factor 1,38
Transaction Amount 1,15
Transaction Return 2,31
Provisions/Losses 1,31
Transaction Maturity 1,46
Transaction Currency 1,77
Credit Protections
Credit Protection Identity 2,23
Protection Type 1,00
Protection Amount 1,08
Protection Maturity 1,54
Protection Rating 1,54
Protection Currency 1,62
Credit Risk
Function
Obligor Identity 1,92
Transaction Identity 1,85
Protection Identity 1,69
Final Rating (after match) 1,77
Exposure Before CRM 1,15
Allocated Protection Amount 1,08
Risk Weighted Exposure After CRM 1,08

90
Figure 26 Significance of attributes of credit risk data entities (obligors, transactions,
credit protections and credit risk function) assigned by the banks
The supplementary systems that are used as data source of risk management system
have been defined in Section 3.2.1.2. The banks were invited to evaluate
appropriateness, i.e. comprehensiveness and modularity of those systems in terms of
risk management. Averages of scores assigned by the banks are reflected in radar
plots shown Figure 27. The banks find all systems defined by the approach
remarkably appropriate overall. The most appropriate system seems to be accounting
00,20,40,60,8
1
ObligorIdentity
ObligorType
FinancialStatement
PersonnelNumber
ObligorCredibility
Risk Group
Attributes of Obligors
Significance of Attributes of Obligors
00,20,40,60,8
1
TransactionID
AccountingRecord
TransactionType
CCF
TransactionAmount
TransactionReturn
Provisions/Losses
TransactionMaturity
TransactionCurrency
Attributes of Transactions
Significance of Attributes of Transactions
00,20,40,60,8
1
ProtectionID
ProtectionType
ProtectionAmount
ProtectionMaturity
ProtectionRating
ProtectionCurrency
Attributes of Credit Protections
Significance of Attributes of CreditProtections
00,20,40,60,8
1Obligor ID
TransactionID
ProtectionID
Final RatingExp. Before
CRM
Alloc. Prot.Amount
RW Exp.After CRM
Attributes of Credit Risk Function
Significance of Attributes of Credit RiskFunction

91
system followed by risk management system while the least appropriate system
appears to be rating system according to the banks.
Figure 27 Evaluation of the banks on appropriateness (comprehensiveness and
modularity) of the systems defined for credit risk management
Except one bank all banks consider that adequacy of the proposed systems used to
supply data to risk management system are satisfactory. Only one bank has
responded that it is not satisfactory since a supplementary system is required. That is,
there should be a special and comprehensive system for non-performing (past due)
loans.
The banks surveyed were invited to evaluate relevancy of DQ dimensions which are
defined and used in the definition phase of the approach in Section 3.2.1.3. The
results of the evaluation are shown in Figure 28 as a radar graph formed by average
of the scores submitted by the banks. The banks view all the DQ dimensions as
relevant to credit risk management. The highest relevancy is attributed to accuracy
and timeliness dimensions by the banks although other dimensions are also
considered significant.
0,00
0,20
0,40
0,60
0,80
1,00
Account ManagementSystem
Accounting System
Collateral ManagementSystem
Rating System
Risk Management System
Appropriateness of the Systems
Appropriateness of the Systems

92
Figure 28 Evaluation of the banks on relevancy of the DQ dimensions suggested by
the approach
In addition, all the banks surveyed agree that the DQ dimensions suggested by the
approach are satisfactory in overall in terms of data quality activities within credit
risk management.
When asked about the contribution of the DQ metrics developed in the measurement
phase of the approach to DQA practices and credit risk management, nine banks
consider that significant contribution can be made while the remaining four banks
have stated the opinion that there is partial contribution. No bank has pointed out
uselessness of the DQ metrics.
Eight banks have stated that use of DQA techniques outlined in Section 3.2.2.2 and
corresponding SQL queries created in the measurement phase of the approach are
significantly effective on DQA process while the remaining five banks think that it
has partial effect on the process. No bank has pointed out ineffectiveness of the DQA
techniques.
Nine of the banks surveyed have stated that composite indicators which are derived
from individual indicators in Section 3.2.2.3 are good representatives in the
measurement of data quality performance for given dimension. Others are of the
opinion that individual indicators would be solely better indicators or different kind
of indicators could be developed.
The banks were asked about their opinion on how weights of each individual
indicator for a given DQ dimension should be determined. Majority of them consider
that they should be prioritized according to their significance for credit risk
calculation while certain banks have stated that they can be changed depending on
changes in credit risk management functions as shown in Figure 29.
0
0,2
0,4
0,6
0,8
1Completeness
Uniqueness
ConsistencyAccuracy
Timeliness
Relevancy of DQ Dimensions
Relevancy of DQ Dimensions

93
Figure 29 Evaluation of the banks on prioritization of individual indicator, i.e.
determination of their weights
Only one bank has stated that equal weights should be attributed to each individual
indicator. Furthermore, no bank considers that they should be prioritized according to
the complexity extent of transformation that raw data of the attribute are exposed in
derivation of final data.
More than half of the banks expect to detect DQ issues related to inconsistency of
data values in different fields or tables in the analysis phase of the approach if they
were to implement the approach proposed within their data quality management
process according to the survey results of which provided in Figure 30. The next DQ
issue to be addressed by the approach is expected to be missing data values
according to slightly less than half of the banks. Duplicate records are also expected
to be detected by the approach according to considerable number of the banks. On
the other hand, three banks are of the opinion that there would be no DQ issue to be
detected by the approach proposed if they were to apply it.
1
9
0
3
Prioritization of Individual Indicators (determination of the weights)
Equal weights for each indicator given DQdimension
Prioritization according to significance forcredit risk calculation
Prioritization according to complexity extentof transformation for obtaining final data
Based on changes in credit risk managementfunctions
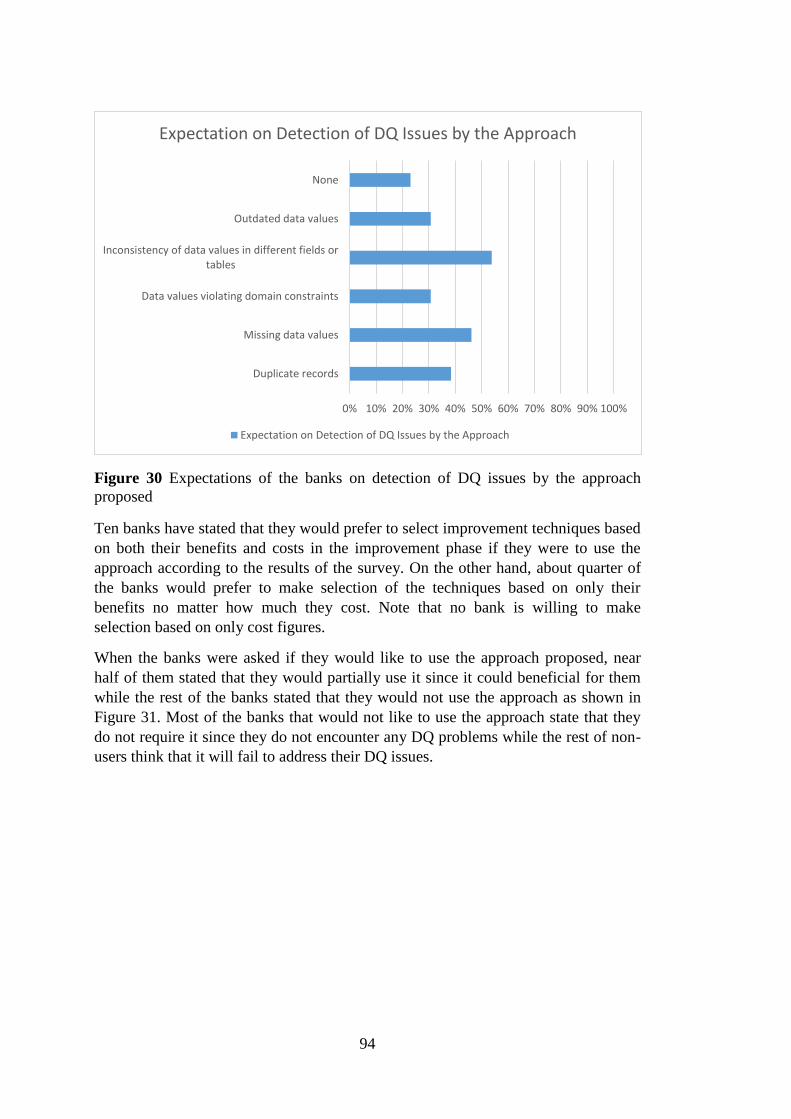
94
Figure 30 Expectations of the banks on detection of DQ issues by the approach
proposed
Ten banks have stated that they would prefer to select improvement techniques based
on both their benefits and costs in the improvement phase if they were to use the
approach according to the results of the survey. On the other hand, about quarter of
the banks would prefer to make selection of the techniques based on only their
benefits no matter how much they cost. Note that no bank is willing to make
selection based on only cost figures.
When the banks were asked if they would like to use the approach proposed, near
half of them stated that they would partially use it since it could beneficial for them
while the rest of the banks stated that they would not use the approach as shown in
Figure 31. Most of the banks that would not like to use the approach state that they
do not require it since they do not encounter any DQ problems while the rest of non-
users think that it will fail to address their DQ issues.
0% 10% 20% 30% 40% 50% 60% 70% 80% 90% 100%
Duplicate records
Missing data values
Data values violating domain constraints
Inconsistency of data values in different fields ortables
Outdated data values
None
Expectation on Detection of DQ Issues by the Approach
Expectation on Detection of DQ Issues by the Approach

95
Figure 31 Banks' use tendency of the approach proposed
The banks were asked to what extent they would rely on the findings of the approach
if they used the approach and obtain certain results based on performance of the
metrics of the approach. Twelve banks think that they could rely on the findings to
some extent and they would consider them in data quality improvement while only
one bank is willing to use with no doubt and plan actions for data quality
improvement based on the evaluation of the findings according to the survey results.
Note that no bank has stated that it would completely reject using the proposed
approach due to unreliability to its results.
Figure 32: Evaluation of the banks on satisfactoriness of the approach proposed
0
6
5
2
Use Tendency of the Approach
Complete use since our DQ problemsat serious level
Partial use due to its benefits
No use since no DQ problemsexperienced
No use since it is insufficient to solveour DQ issues
0
1
2
3
4
5
6
7
8
9
10
1 2 3 4 5 6 7 8 9 10 11 12 13
SCO
RES
BANKS
Banks' Evaluation on Satisfactoriness of the Approach
Average
SCORES

96
The banks were invited to evaluate satisfactoriness of the approach proposed in
overall. Significant number of banks put it at considerable sufficiency level while
certain banks have stated that it does not sufficiently meet their expectations as
indicated in Figure 32. The average satisfaction level is about 7 out of 10. Most
scores are near or over the average value.
Banks were invited to comment on whether there is any deficiency to fulfill or areas
to improve about the approach proposed. Opinions of the banks on the subject are
outlined in Table 34. Eight banks have commented on the subject, four of which state
that there is no deficiency in the approach and no need for further improvement. Five
banks have no comment on the subject. Suggestions for improvement mostly have
concern for focus on controls while maintaining the approach. Those controls include
development of separate methodology and separate systems such as control on
acceptance of data from other sources. One bank stresses the need for an adaptive
infrastructure in order to handle the changes or shifts driven by the approach.
Another bank has stated the need for another system for data archiving.
Table 34 Banks' comment on deficiencies and possible improvement areas of the
approach proposed
Bank No Deficiencies and possible suggestions for improvement
Bank1 The approach has great similarity with the data quality project for rating
systems initiated by our (the bank‟s) risk management department. The extent
of the assessment rules is key for maintaining the system soundly. Therefore,
a different methodology for evaluation of those rules can be developed.
Bank2 (No comment)
Bank3 (No comment)
Bank4 Arranging operations regarding first time retrieval of the data is vital to
accuracy of the data. Consistency of the data can be checked in order to
ensure control retrieval of the data.
Bank5 No deficiency exists and no further improvement is required.
Bank6 (No comment)
Bank7 Another system for data archiving (especially for non-performing loans and
collaterals) is suggested.
Bank8 No deficiency exists and no further improvement is required.
Bank9 No deficiency exists and no further improvement is required.
Bank10 No deficiency exists and no further improvement is required.
Bank11 An adaptive infrastructure should be built.
Bank12 (No comment)
Bank13 (No comment)
Banks were also asked to state what type of difficulties they may face in practical
application of the approach. Opinions submitted by the banks on the subject are
summarized in Table 35. Four banks have no comment on the subject. One bank
thinks that it can be applied through all banks with ease. Most of the concerns about
the practical applicability of the approach concentrate on requirement for change in
IT infrastructure of the bank, financial and qualified human resources, and on
compatibility issues.

97
Table 35 Banks' comment on potential difficulties in practical application of the
approach
Bank No Potential difficulties in practical application of the approach
Bank1 Since change in data (due to changes in model, shifts in systems etc.) in daily
operations is too fast, dedicated teams should be set up to manage the system
and support of the senior management to those teams is very crucial. The
support of the senior management has critical significance especially for
adopting data stewardship in all data quality/data governance projects by
business units.
Bank2 (No comment)
Bank3 No internal model is used within the bank, credit risk is calculated via simple
method. Data required for calculation is obtained from core banking system.
Quality of data used in core banking system is managed in accordance with
the regulation relevant to information system management.
Bank4 Accordance with banking systems is critical
Bank5 There might be difficulties in integration of rating systems to local systems
Bank6 (No comment)
Bank7 There might be difficulties in allocating financial and human resources
Bank8 It is a project that requires to have expert staff in IT, and participation of the
relevant departments. Therefore, there might arise resource issues and
prioritization problems while working through the project.
Bank9 Since implementation of the approach requires significant studies and
arrangements in system infrastructure, it rises the issue of requirements for
significant time and workforce.
Bank10 The approach proposed seems to be applicable by all financial institutions.
Bank11 It may require evaluation in terms of its harmony with portfolio structure of
the bank.
Bank12 (No comment)
Bank13 (No comment)
5.3 Evaluation of the Survey Findings
The average experience of the managers from 13 banks who responded to survey
questions is about 16 years. The banks which participated in the survey belong to
different range in terms of their size and core business in the Turkish banking sector.
The attitude and activities regarding the DQA of credit risk within the banks are
considerably in line with the content of DQA approach proposed. The approach is
evaluated as extensively addressing data quality issues of the banks. Most banks are
confident with what the approach presents and they are willing to implement it to
certain extent. Evaluations of the banks on their own DQA activities and on the
approach proposed are remarkably consistent with each other.

98

99
CHAPTER 6
DISCUSSION AND CONCLUSION
This chapter is devoted to discussion of the findings of the study, the conclusion of
the study, contribution of the study to the literature of DQA in the context of credit
risk management, and recommendations for future research in this field.
6.1 Discussion
The studies related to DQA in the context credit risk management in the literature
usually focus on subjective assessment of DQ in credit risk management. Empirical
studies using questionnaires conducted at the managerial levels in financial firms
suggest methods for improvement of DQ based on statistical findings obtained from
analyzing the results of the questionnaires (Moges et al., 2013). Some other studies
propose the best practice solutions such as a centralized approach to risk data or
integration of risk and finance data to improve DQ of risk data of financial
institutions based on regulatory requirements of the Basel framework (Bonollo &
Neri, 2011). Some studies present an approach that considers both quantitative and
qualitative aspects (Yin et al., 2014). However, there is a clear need for objective
assessment based on DQ metrics developed for the fundamental entities of credit
risk. The present study explored the possibility of developing well-defined DQ
metrics for credit risk management.
For this purpose, the study first attempted to designate categorization of credit risk
data; that is, data taxonomy of the context in accordance with the Basel Accords is
identified. The following main entities are identified as candidates for root data
tables in credit risk management practices: obligors, transactions and credit
protections. Attributes for each entity are also identified based on the characteristics
of those entities. The reason for such taxonomy is the aim to reduce dependencies
among the tables in the databases of banks and reduce DQ related problems
proactively by modularizing data tables based on the characteristics of the entities.
What distinguishes this study from the other studies dealing with DQA is its
proactive structure in the definition phase of the approach. Proposal of appropriate
and efficient decomposition of entities, more specifically root data tables, give the
risk manager of banks the clue for initial elimination of the most DQ challenges.
Relational tables can be grounded the root tables identified in the definition phase,
which allows the banks to manipulate their data tables flexibly in order to produce
final reporting tables.
Determination of proper data taxonomy is not sufficient for initial inspection of
vulnerabilities to poor DQ risk. Investigation of original sources of the identified

100
attributes of the entities is also crucial in detecting major causes of DQ issues. A
complex IS infrastructure where various raw data required by risk management
system are obtained from not-so-well disintegrated or highly dependent systems, i.e.
low modular systems, may cause labyrinthical DQ problems resolution of which can
be burdensome. The study proposes the use of the modular systems each of which
specifically provides data for certain domain and supplements risk management
system. Those systems supplement risk management system of the bank by
providing data for specific domains of the tables, which are summarized in Table 36.
Table 36 Risk management system and the supplementary systems proposed for risk
management systems and possible domains that can be provided via those systems
Proposed supplementary system
for risk management system
Possible domains that can be fed to risk
management system
Account Management System Identity of the obligor (tax ID, client ID,
account number, country and obligor type)
financial statement of the obligor
(turnover, active size and staff size)
Accounting System Accounting record, transaction type,
transaction amount (principal, return and
provision), transaction period, transaction
currency type
Rating System Credibility of obligor, credibility of
warrantor
Collateral Management System Credit protection identity, protection type,
protection period, protection currency type
Risk Management System Risk group of the obligor, credit
conversion factor
DQ dimensions are defined according to DQ requirements of each attribute of an
entity. The range of DQ dimensions are limited to those ones which are mostly cited
in the literature. These are uniqueness, completeness, accuracy, consistency and
timeliness. Those dimensions are selected since the approach proposed in the study
mostly considers quantitative aspects of DQA, and their use in database applications
is rather easy and common.
Other significant outcomes of the study are the definition and implementation of DQ
metrics specifically designated for credit risk context, and quality performance
indicators developed from those metrics. DQ metrics are developed for each attribute
relevant for a given DQ dimensions. Specialization of DQ metrics for credit risk
management purposes enables banks to develop systematic and standardized
approach towards DQA of their databases, and allows comparative analysis of
sector-wide credit risk data. Development of individual and composite quality
performance indicators contributes to standardization and visualization of DQA
results. Number of the proposed DQ metrics, KQPIs and CQPIs are tabulated in
Table 37.

101
Table 37 Number of DQ metrics, KQPIs, and CQPIs developed for each DQ
dimension and entity
DQ dimension Entity name Number of
DQ metrics
developed
Number of
KQPIs
developed
Number
of CQPIs
developed
Uniqueness Obligors 2 2 1
Transactions 1 1
Credit
Protections
1 1
Credit Risk 0 0
Total 4 4
Completeness Obligors 5 5 1
Transactions 9 9
Credit
Protections
7 7
Credit Risk 7 7
Total 28 28
Accuracy Obligors 3 3 1
Transactions 4 4
Credit
Protections
3 3
Credit Risk 1 1
Total 11 11
Consistency Obligors 3 3 1
Transactions 2 2
Credit
Protections
0 0
Credit Risk 7 7
Total 12 12
Timeliness Obligors 0 0 1
Transactions 4 4
Credit
Protections
2 2
Credit Risk 0 0
Total 6 6
ALL Grand Total 61 61 5
Evaluation of the DQ metrics proposed is performed by DQA methods such as
column analysis, cross-domain analysis, domain analysis and semantic profiling.
Although those methods are cited in the literature, there is no specific definition or
procedure for such methods specifically for assessment of bank credit risk data since
it depends on the data context. Therefore, SQL queries which can be regarded as
special application of such methods are developed in order to measure the DQ
metrics which will reveal DQ level of credit risk data.
Analysis and improvement phases of the proposed approach depend on the results of
DQA. However, the study has provided guidance on possible DQ problems
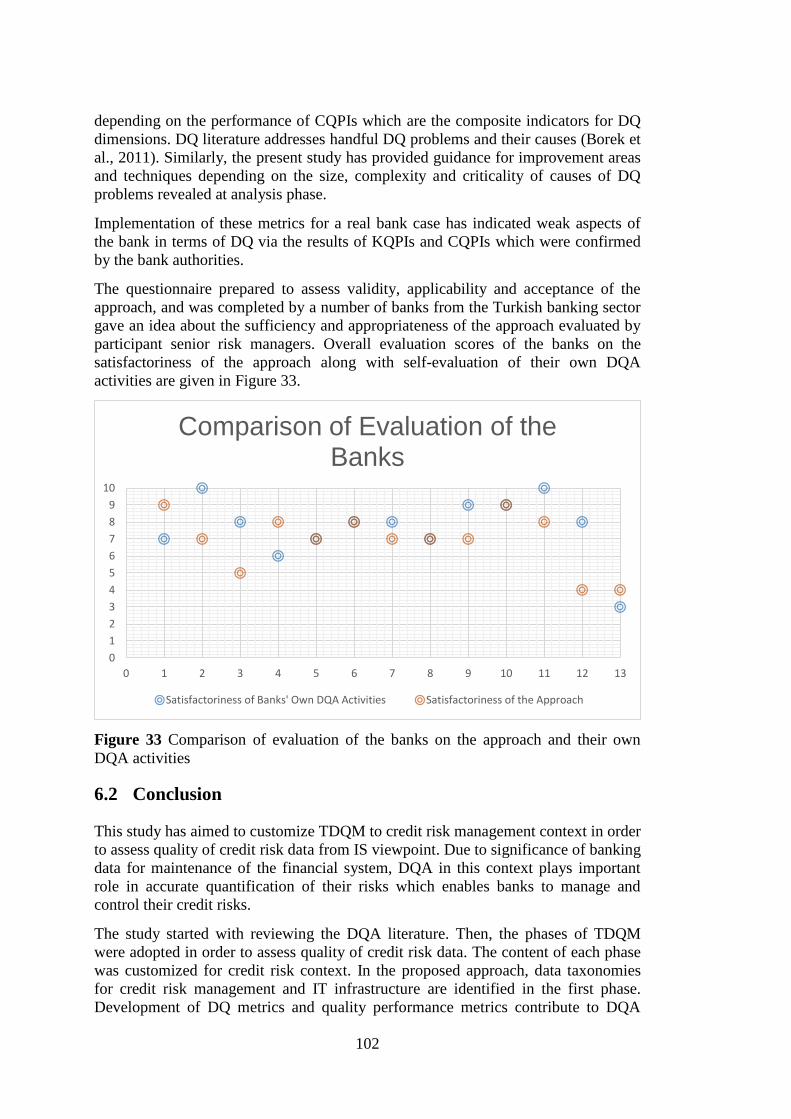
102
depending on the performance of CQPIs which are the composite indicators for DQ
dimensions. DQ literature addresses handful DQ problems and their causes (Borek et
al., 2011). Similarly, the present study has provided guidance for improvement areas
and techniques depending on the size, complexity and criticality of causes of DQ
problems revealed at analysis phase.
Implementation of these metrics for a real bank case has indicated weak aspects of
the bank in terms of DQ via the results of KQPIs and CQPIs which were confirmed
by the bank authorities.
The questionnaire prepared to assess validity, applicability and acceptance of the
approach, and was completed by a number of banks from the Turkish banking sector
gave an idea about the sufficiency and appropriateness of the approach evaluated by
participant senior risk managers. Overall evaluation scores of the banks on the
satisfactoriness of the approach along with self-evaluation of their own DQA
activities are given in Figure 33.
Figure 33 Comparison of evaluation of the banks on the approach and their own
DQA activities
6.2 Conclusion
This study has aimed to customize TDQM to credit risk management context in order
to assess quality of credit risk data from IS viewpoint. Due to significance of banking
data for maintenance of the financial system, DQA in this context plays important
role in accurate quantification of their risks which enables banks to manage and
control their credit risks.
The study started with reviewing the DQA literature. Then, the phases of TDQM
were adopted in order to assess quality of credit risk data. The content of each phase
was customized for credit risk context. In the proposed approach, data taxonomies
for credit risk management and IT infrastructure are identified in the first phase.
Development of DQ metrics and quality performance metrics contribute to DQA
0
1
2
3
4
5
6
7
8
9
10
0 1 2 3 4 5 6 7 8 9 10 11 12 13
Comparison of Evaluation of the Banks
Satisfactoriness of Banks' Own DQA Activities Satisfactoriness of the Approach

103
process. Measurement of those metrics via DQA methods, more specifically SQL
queries, developed to assess DQ of credit risk produces DQA results. Those results
reveal the DQ problems and enable investigation of underlying causes of those
problems, which leads to the formulation of appropriate techniques for improvement
of poor DQ.
Implementation of the study on credit risk data of a real bank has revealed the
applicability and meaningfulness of the approach which is supported by the officers
of the bank. In addition, a survey for evaluation of the approach carried out within
numerous banks indicated validity and applicability of the approach.
It can be concluded that development of a tailored approach for DQA in credit risk
management can provide indispensable benefits in achieving higher maturity level in
IS capabilities. Those benefits range from identification of problematic areas that
cause economic losses chronically to accurate quantification of credit risk which
contribute to manage those risks and determine capital amount required to be hold.
6.3 Contribution of the Study
Studies dealing with DQA of credit risk focus on inquiring DQ challenges by
interviewing with the managers from various financial institutions. Those studies
usually rest on subjective assessment of DQ by the stakeholders of credit risk data
production process (Moges et al., 2013). However, this study has mostly focused on
quantitative aspects DQA and has developed DQ metrics specifically for the entities
of credit risk. The study has contributed to the literature by proposing a tailored
approach for DQA of credit risk management, customizing the phases of TDQM.
TDQM proposed by Wang (1998) does not provide guidance on detailed
implementation of the approach for a specific context but rather outlines fundamental
structure of the phases. The present study elaborates on each phase of TDQM at a
more granular level. Specifically, the definition and measurement phases constitute a
significant part in the approach. Definition phase is not only restricted to definition
of DQ dimensions but also includes identification of data taxonomies for credit risk.
Measurement phase also provides detailed and specific definitions for DQ metrics,
which is a significant contribution to that field.
6.4 Limitations of the Study and Future Research
Several limitations of the present study have to be pointed out.
Although the proposed TDQM customization for the purposes of this study in the
context of credit risk management can be used for credit risk data under both SA and
IRB approach, implementation of the definition phase of TDQM has been restricted
to credit risk data under SA only. Number of data tables and fields can be different
for the two approaches. Therefore, data quality requirements for SA and IRB
approach may differ, thus, require definition of different DQ dimensions and DQ
metrics. Moreover, IRB approach entails more sophisticated data requirements than
those for SA, which necessitates definition of additional DQ dimensions.
Implementation of the phases of TDQM for the data requirements of the IRB
approach will have to be realized in future studies as the Turkish banking sector
adopts and uses IRB approach in the near future.

104
Secondly, DQ dimensions investigated in this study only cover the mostly cited ones
in the literature; namely, uniqueness, completeness, accuracy, consistency and
timeliness. These dimensions overlap with a significant number of other DQ
dimensions studied in the literature. Moreover, their suitability for direct use in
objective assessments and database applications has motivated this study to select
these DQ dimensions. However, the range of DQ dimensions can be extended to
various other dimensions studied in the literature. For example, DQ dimensions
proposed by Wang and Strong (1996) that are relevant to the credit risk management
context can also be incorporated to the study.
Thirdly, implementation of the approach proposed has been performed only for just
one bank. Possible extension of the implementation of such an approach to a wide
range of banks in the sector will reveal the major DQ challenges in the sector. The
extension of the application of the study to more banks will definitely contribute to
the enhancement of DQ metrics developed, and thus to, DQA techniques.
Also, the fact that just 13 bank managers have responded to the evaluation survey
discussed in Chapter 5 obviously indicates that further evaluations and possible
adaptations to actual needs and requirements of the banking sector may be helpful in
enhancing comprehensiveness as well as practicality of the proposed approach. As
the number of responses was quite limited, we have intentionally refrained from
attempting to derive any quantitative or universal interpretations of the evaluations
provided. A more objective and wide ranging assessment of what we have proposed
is definitely needed before any further work is undertaken in this direction.
In addition, the survey was conducted via emails sent to banks due to busy agenda of
the senior managers. We do not know their background and familiarity with the IT
issues and terminology although this issue has been addressed by providing
explanatory information about the questions in addition to a condensed summary of
the proposed approach. They were also invited to answer those questions with the
assistance of senior IT staff. We know that some took this route.
Lastly, qualitative aspects of the DQA methods proposed can be strengthened via
surveys pointing out inquiry and evaluation of IS infrastructure of the bank in terms
of credit risk management, and DQ quality of databases utilized in credit risk
management similar to those surveys carried out by Moges et al. (2013). Extension
of the study in order to cover more subjective aspects will allow incorporation of
further DQ dimensions into the approach.

105
REFERENCES
Bai, X., Nunez M. and Kalagnanam J.R. (2012). Managing Data Quality Risk in
Accounting Information Systems. Information Systems Research, Vol. 23 Issue
2, p453.
Ballou, D. and Pazer, H. (1985). Modelling data and process quality in multi-input,
multi-output information systems. Management Science 31, 2, pp 150-162.
Batini, C., Cappiello, C., Francalanci, C. and Maurino, A. (2009). Methodologies for
data quality assessment and improvement. ACM Computing Surveys, 41, 3,
Article 16.
Batini, C. and Scannapieco, M. (2006). Data Quality: Concepts, Methodologies and
Techniques. Springer Verlag.
BCBS. (2006). International convergence of capital measurement and capital
standards. A revised framework, Bank of international settlements.
www.bis.org.
BCBS. (2013a). Principles for effective risk data aggregation and risk reporting.
www.bis.org.
BCBS. (2013b). Progress in adopting the principles for effective risk data
aggregation and risk reporting. www.bis.org.
BRSA. (2014a). Regulation on Measurement and Evaluation of Capital Adequacy of
Banks. www.bddk.org.tr.
BRSA. (2014b). Regulation on Equities of Banks. www.bddk.org.tr.
BRSA. (2014c). Communique on calculation of credit exposure amount via internal
rating based approaches. www.bddk.org.tr.
Bonollo, M. and Neri, M. (2011). Data quality in banking: Regulatory requirements
and best practices. Journal of Risk Management in Financial Institutions. Vol.
5, 2 pp. 146-161.
Borek, A., Woodall, P., Oberhofer, M. and Parlikad, K. (2011). A classification of
data quality assessment methods. Proceedings of the 16th
International
Conference on Information Quality.

106
Bovee, M., Srivastava, R. and Mak, B. (2001). A conceptual framework and belief-
function approach to assessing overall information quality. Proceedings of the
6th
International Conference on Information Quality.
De Amicis, F. and Batini, C. (2004). A methodology for data quality assessment on
financial data. Studies Commun. Sci. SCKM.
Dejaeger, K., Hamers, B., Poelmans, J. and Baesens, B. (2010). A novel approach to
the evaluation and improvement of data quality in the financial sector.
Proceedings of the 15th
International Conference on Information Quality.
English, L. (1999). Improving data warehouse and business information quality.
Wiley & Sons.
Eppler, M. and Münzenmaier, P. (2002). Measuring information quality in the web
context: A survey of state-of-the-art instruments and an application
methodology. Proceedings of the 7th
International Conference on Information
Quality.
Falorsi, P., Pallara, S., Pavone, A., Alessandroni, A, Massella, E. and Scannapieco,
M. (2003). Improving the quality of toponymic data in the Italian public
administration. Proceedings of the ICDT Workshop on Data Quality in
Cooperative Information Systems (DQCIS).
Gozman, D., Currie, W. (2015). Managing Governance, Risk and Compliance for
Post-Crisis Regulatory Change: A Model of IS Capabilities for Financial
Organizations. 48th
Hawaii International Conference on System Sciences.
Huang, K. T., Lee, Y. W., and Wang, R. Y. (1998). Quality Information and
Knowledge Management. 1st Edition. Prentice Hall.
Jarke, M., Lenzerini, M., Vassiliou, Y. and Vassiliadis, P. (1995). Fundamentals of
Data Warehouses. Springer Verlag.
Jeusfeld, M., Quix, C. and Jarke, M. (1998). Design and analysis of quality
information for data warehouses. Proceedings of the 3rd
International
Conference on Conceptual Modelling.
Juran, J., and Godfrey, B. (1999). Juran's Quality Handbook. 5th
Edition. McGraw
Hill.
Kahn, B. K. and Strong, D. M. (1998). Product and service performance model for
information quality: An update. Proceedings of the 3rd
International
Conference on Information Quality.
Kerr, K. (2006). The Institutionalisation of Data Quality in the New Zealand Health
Sector (PhD Thesis).
Lee, Y. W., Strong, D. M., Kahn, B. K. and Wang R. (2002). AIQM: A methodology
for information quality assessment. Information & Management 40, 2. pp. 133-
146.

107
Lee, Y. W., Pionino, L.L., Funk, J.D. and Wang, R. (2006). Journey to Data Quality,
pp. 67-108. The MIT Press.
Liu, L. and Chi, L. (2002). Evolutionary data quality. Proceedings of the 7th
International Conference on Information Quality.
Long, J. and Seko, C. (2005). A cyclical-hierarchical method for database data-
quality evaluation and improvement. Advances in Management Information
Systems – Information Quality Monograph.
Loshin, D. (2004). Enterprise Knowledge Management – The Data Quality
Approach. Series in Data Management Systems, Morgan Kaufmann, chapter 4.
Moges, H. T., Dejaeger, K., Lemahieu, W., Baesens, B. (2011). Data Quality for
Credit Risk Management: New Insights and Challenges. Proceedings of the
16th
International Conference on Information Quality.
Moges, H. T., Dejaeger, K., Lemahieu, W., Baesens, B. (2013). A multidimensional
analysis of data quality for credit risk management: New insights and
challenges. Information & Management 50, pp. 43-58.
Moges, H. (2014). A Contextual Data Quality Analysis for Credit Risk Management
in Financial Institutions (PhD Thesis).
Naumann, F. (2013), Data profiling revisited, ACM SIGMOD Record 42, 4, pp. 40-
49
Pipino, L. and Wang, R. (2002). Data Quality Assessment. Communications of the
ACM 45, 4.
Redman, T. (1996). Data Quality for the Information Age. Artech House.
Su, Y. and Jin, Z. (2004). A methodology for information quality assessment in the
designing and manufacturing processes of mechanical products. Proceedings of
the 9th
International Conference on Information Quality.
Scannapieco. M., Virgillito, A., Marchetti, M., Mecella, M. and Baldoni, R. (2004).
The DaQuinCIS architecture: a platform for exchanging and improving data
quality in cooperative information systems. Information Systems 29, 7, pp. 551-
582.
Wand, Y. and Wang, R. (1996). Anchoring data quality dimensions in ontological
foundations. Communications of the ACM 39, 11.
Wang, R. and Strong, D. (1996). Beyond accuracy: What data quality means to data
consumers. Journal of Management Information Systems, 12(4).
Wang, R. (1998). A product perspective on total data quality management.
Communications of the ACM, 41, 2.

108
Woodall, P. and Parlikad, K. (2010). A hybrid approach to assessing data quality.
Proceedings of the 15th
International Conference on Information Quality.
Woodall, P., Borek, A. and Parlikad, K. (2013). Data quality assessment: The hybrid
approach. Cambridge Service Alliance (August 2013).
Yin, K., Pu Y., Liu, Z., Yu, Q. and Zhou, B. (2014). An AHP-based Approach for
Banking Data Quality Evaluation. Information Technology Journal, 13(8), pp.
1523-1531, 2014.

109
APPENDICES
APPENDIX A: DQ Dimensions Studied In the Literature
DQ dimension Definition/Description
Accuracy Batini et al. (2009):
Syntactic accuracy: it is measured as the distance between the value
stored in the database and the correct one
Syntactic Accuracy=Number of correct values/number of total values
Number of delivered accurate tuples
Moges et al. (2011 & 2013) and Moges (2014):
The extent to which data are certified, error-free, correct, flawless and
reliable
Dejaeger et al. (2010):
Syntactic accuracy: It represents the approximation of a value to the
elements of the corresponding domain D.
Semantic accuracy: It describes the approximation of a value x to the
true value x‟.
Completeness Batini et al. (2009):
Completeness = Number of not null values/total number of values
Completeness = Number of tuples delivered/Expected number
Completeness of Web data = (Tmax – Tcurrent) ∗ (CompletenessMax –
CompletenessCurrent)/2
Moges et al. (2011 & 2013) and Moges (2014):
The extent to which data are not missing and covers the
needs of the tasks and is of sufficient breadth and depth
of the task at hand
Dejaeger et al. (2010):
It is defined as to what extent there are no missing values (causal/not
causal)
Consistency Batini et al. (2009):
Consistency = Number of consistent values/number of total values
Number of tuples violating constraints, number of coding differences
Number of pages with style guide deviation
Dejaeger et al. (2010):
A data set can be said to be consistent when the constraints within each
observation are met
Interrelational consistency: It deals with rules established for all the
records within the data set
Intrarelational consistency: It verifies whether rules
which are applicable within one record are being respected
Timeliness Batini et al. (2009):
Timeliness = (max (0; 1-Currency/Volatility))s
Percentage of process executions able to be performed within the
required time frame
Moges et al. (2011 & 2013) and Moges (2014):
The extent to which data are sufficiently up-to-date for
the task at hand
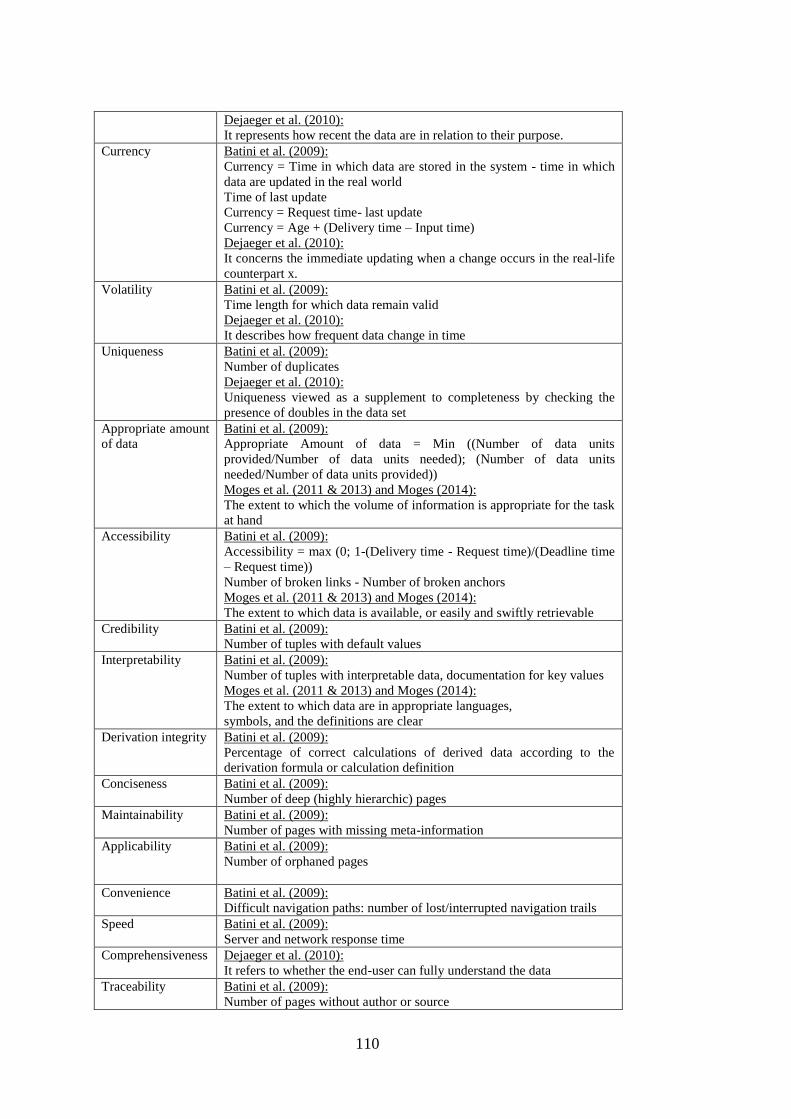
110
Dejaeger et al. (2010):
It represents how recent the data are in relation to their purpose.
Currency Batini et al. (2009):
Currency = Time in which data are stored in the system - time in which
data are updated in the real world
Time of last update
Currency = Request time- last update
Currency = Age + (Delivery time – Input time)
Dejaeger et al. (2010):
It concerns the immediate updating when a change occurs in the real-life
counterpart x.
Volatility Batini et al. (2009):
Time length for which data remain valid
Dejaeger et al. (2010):
It describes how frequent data change in time
Uniqueness Batini et al. (2009):
Number of duplicates
Dejaeger et al. (2010):
Uniqueness viewed as a supplement to completeness by checking the
presence of doubles in the data set
Appropriate amount
of data
Batini et al. (2009):
Appropriate Amount of data = Min ((Number of data units
provided/Number of data units needed); (Number of data units
needed/Number of data units provided))
Moges et al. (2011 & 2013) and Moges (2014):
The extent to which the volume of information is appropriate for the task
at hand
Accessibility Batini et al. (2009):
Accessibility = max (0; 1-(Delivery time - Request time)/(Deadline time
– Request time))
Number of broken links - Number of broken anchors
Moges et al. (2011 & 2013) and Moges (2014):
The extent to which data is available, or easily and swiftly retrievable
Credibility Batini et al. (2009):
Number of tuples with default values
Interpretability Batini et al. (2009):
Number of tuples with interpretable data, documentation for key values
Moges et al. (2011 & 2013) and Moges (2014):
The extent to which data are in appropriate languages,
symbols, and the definitions are clear
Derivation integrity Batini et al. (2009):
Percentage of correct calculations of derived data according to the
derivation formula or calculation definition
Conciseness Batini et al. (2009):
Number of deep (highly hierarchic) pages
Maintainability Batini et al. (2009):
Number of pages with missing meta-information
Applicability Batini et al. (2009):
Number of orphaned pages
Convenience Batini et al. (2009):
Difficult navigation paths: number of lost/interrupted navigation trails
Speed Batini et al. (2009):
Server and network response time
Comprehensiveness Dejaeger et al. (2010):
It refers to whether the end-user can fully understand the data
Traceability Batini et al. (2009):
Number of pages without author or source

111
Moges et al. (2011 & 2013) and Moges (2014):
The extent to which data is traceable to the source
Security Batini et al. (2009):
Number of weak log-ins
Moges et al. (2011 & 2013) and Moges (2014):
The extent to which access to data is restricted appropriately to maintain
its security
Dejaeger et al. (2010):
It is related to privacy and safety regulations
(IT-elements / human aspects)
Objectivity Moges et al. (2011 & 2013) and Moges (2014):
The extent to which data are unbiased, unprejudiced,
based on facts and impartial
Relevancy Moges et al. (2011 & 2013) and Moges (2014):
The extent to which data are applicable and helpful for
the task at hand
Reputation Moges et al. (2011 & 2013) and Moges (2014):
The extent to which data are highly regarded in terms of its sources or
content
Interactivity Batini et al. (2009):
Number of forms - Number of personalizable pages
Value-added Moges et al. (2011 & 2013) and Moges (2014):
The extent to which data are beneficial and provides advantages from its
use
Actionable Moges et al. (2011 & 2013) and Moges (2014):
The extent to which data is ready for use
Easily-
understandable
The extent to which data are easily comprehended
Representational-
consistency
Moges et al. (2011 & 2013) and Moges (2014):
The extent to which data are continuously presented in same format
Concisely-
presented
Moges et al. (2011 & 2013) and Moges (2014):
The extent to which data is compactly represented, well-presented, well-
organized, and well-formatted
Alignment Moges et al. (2011 & 2013) and Moges (2014):
The extent to which data is reconcilable (compatible)
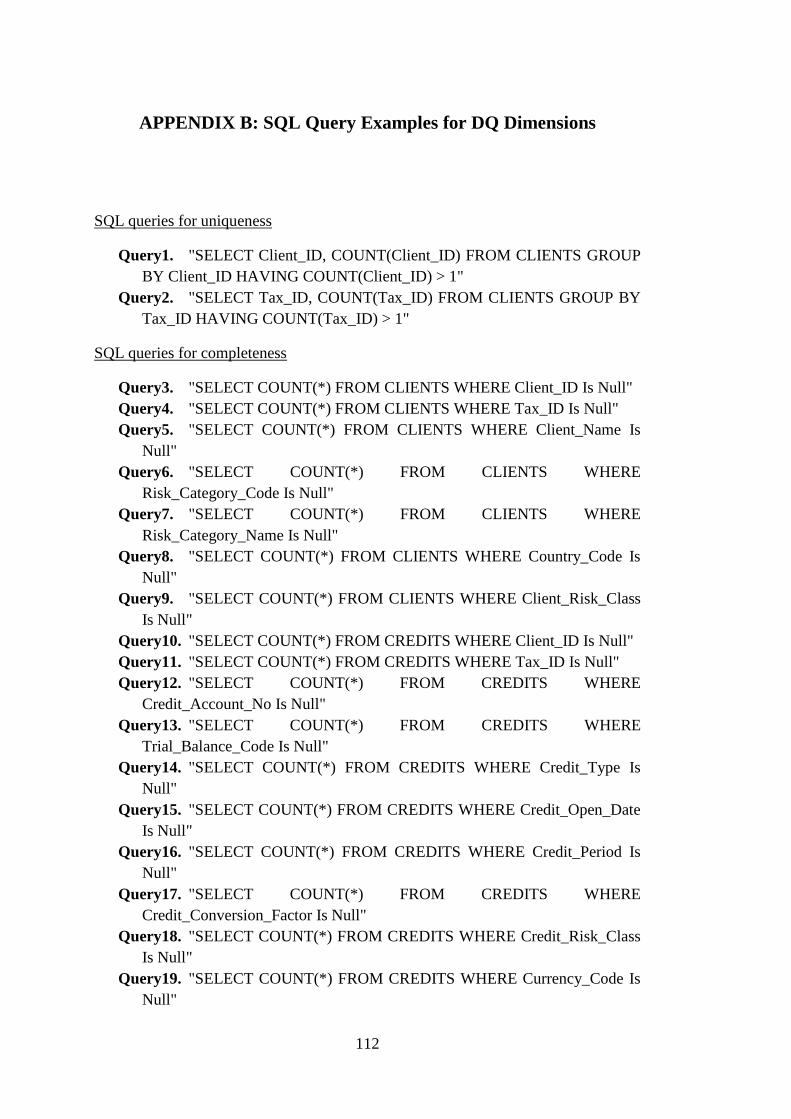
112
APPENDIX B: SQL Query Examples for DQ Dimensions
SQL queries for uniqueness
Query1. "SELECT Client_ID, COUNT(Client_ID) FROM CLIENTS GROUP
BY Client_ID HAVING COUNT(Client_ID) > 1"
Query2. "SELECT Tax_ID, COUNT(Tax_ID) FROM CLIENTS GROUP BY
Tax_ID HAVING COUNT(Tax_ID) > 1"
SQL queries for completeness
Query3. "SELECT COUNT(*) FROM CLIENTS WHERE Client_ID Is Null"
Query4. "SELECT COUNT(*) FROM CLIENTS WHERE Tax_ID Is Null"
Query5. "SELECT COUNT(*) FROM CLIENTS WHERE Client_Name Is
Null"
Query6. "SELECT COUNT(*) FROM CLIENTS WHERE
Risk_Category_Code Is Null"
Query7. "SELECT COUNT(*) FROM CLIENTS WHERE
Risk_Category_Name Is Null"
Query8. "SELECT COUNT(*) FROM CLIENTS WHERE Country_Code Is
Null"
Query9. "SELECT COUNT(*) FROM CLIENTS WHERE Client_Risk_Class
Is Null"
Query10. "SELECT COUNT(*) FROM CREDITS WHERE Client_ID Is Null"
Query11. "SELECT COUNT(*) FROM CREDITS WHERE Tax_ID Is Null"
Query12. "SELECT COUNT(*) FROM CREDITS WHERE
Credit_Account_No Is Null"
Query13. "SELECT COUNT(*) FROM CREDITS WHERE
Trial_Balance_Code Is Null"
Query14. "SELECT COUNT(*) FROM CREDITS WHERE Credit_Type Is
Null"
Query15. "SELECT COUNT(*) FROM CREDITS WHERE Credit_Open_Date
Is Null"
Query16. "SELECT COUNT(*) FROM CREDITS WHERE Credit_Period Is
Null"
Query17. "SELECT COUNT(*) FROM CREDITS WHERE
Credit_Conversion_Factor Is Null"
Query18. "SELECT COUNT(*) FROM CREDITS WHERE Credit_Risk_Class
Is Null"
Query19. "SELECT COUNT(*) FROM CREDITS WHERE Currency_Code Is
Null"

113
Query20. "SELECT COUNT(*) FROM CREDITS WHERE Credit_Principal Is
Null"
Query21. "SELECT COUNT(*) FROM CREDITS WHERE
Credit_Risk_Weight Is Null"
Query22. "SELECT COUNT(*) FROM CREDITS WHERE
Exposure_Before_CRM Is Null"
Query23. "SELECT COUNT(*) FROM CREDITS WHERE RWA_After_CRM
Is Null"
Query24. "SELECT COUNT(*) FROM CREDITS WHERE
Balance_Sheet_Class Is Null"
Query25. "SELECT COUNT(*) FROM CREDITS WHERE TB_or_BB Is Null"
Query26. "SELECT COUNT(*) FROM COLLATERALS WHERE Client_ID
Is Null"
Query27. "SELECT COUNT(*) FROM COLLATERALS WHERE
Client_Tax_ID Is Null"
Query28. "SELECT COUNT(*) FROM COLLATERALS WHERE
Trial_Balance_Code Is Null"
Query29. "SELECT COUNT(*) FROM COLLATERALS WHERE
Warrantor_Tax_ID Is Null"
Query30. "SELECT COUNT(*) FROM COLLATERALS WHERE
Collateral_ID Is Null"
Query31. "SELECT COUNT(*) FROM COLLATERALS WHERE
Collateral_Type Is Null"
Query32. "SELECT COUNT(*) FROM COLLATERALS WHERE
Currency_Code Is Null"
Query33. "SELECT COUNT(*) FROM COLLATERALS WHERE
Warrantor_Risk_Class Is Null"
Query34. "SELECT COUNT(*) FROM COLLATERALS WHERE
Collateral_Fair_Value Is Null"
Query35. "SELECT COUNT(*) FROM COLLATERALS WHERE
Collateral_Value_Allocated Is Null"
Query36. "SELECT COUNT(*) FROM COLLATERALS WHERE
Collateral_Country_Code Is Null"
Query37. "SELECT COUNT(*) FROM COLLATERALS WHERE
Collateral_Period Is Null"
SQL queries for accuracy
Query38. "SELECT COUNT(*) FROM CLIENTS WHERE Client_Risk_Class
NOT LIKE 'MRS[1-9]' AND Client_Risk_Class NOT LIKE 'MRS1[0-3]' "
Query39. "SELECT COUNT(*) FROM CLIENTS WHERE Firm_Segment <>
'KI' AND Firm_Segment <> 'KOBI' AND Firm_Segment IS NOT NULL"
Query40. "SELECT COUNT(*) FROM CREDITS WHERE
Trial_Balance_Code LIKE '%[!0-9]%'"

114
Query41. "SELECT COUNT(*) FROM CREDITS WHERE Credit_Type <>
'NK' AND Credit_Type <> 'NKKF' AND Credit_Type NOT LIKE 'GNA0[1-
9]' AND Credit_Type NOT LIKE 'GNA1[0-3]' AND Credit_Type NOT
LIKE 'GNB0[1-6]' AND Credit_Type NOT LIKE 'GN[CD]0[1-7]' AND
Credit_Type NOT LIKE 'KTR0[1256789]' AND Credit_Type NOT LIKE
'KTR0[56][AB]' AND Credit_Type NOT LIKE 'KTR10' AND Credit_Type
NOT LIKE 'DA'";
Query42. "SELECT COUNT(*) FROM CREDITS WHERE
Credit_Conversion_Factor <> 0 AND Credit_Conversion_Factor <> 0.2
AND Credit_Conversion_Factor <> 0.5 AND Credit_Conversion_Factor <>
1"
Query43. "SELECT COUNT(*) FROM CREDITS WHERE Credit_Risk_Class
NOT LIKE 'ARS0[1-9]' AND Credit_Risk_Class NOT LIKE 'ARS1[0-9]'
AND Credit_Risk_Class NOT LIKE 'ASH99'"
Query44. "SELECT COUNT(*) FROM CREDITS WHERE
Credit_Quality_Level <> 1 AND Credit_Quality_Level <> 2 AND
Credit_Quality_Level <> 3 AND Credit_Quality_Level <> 4 AND
Credit_Quality_Level <> 5 AND Credit_Quality_Level <> 6"
Query45. "SELECT COUNT(*) FROM CREDITS WHERE
Credit_Risk_Weight <> 0 AND Credit_Risk_Weight <> 0.2 AND
Credit_Risk_Weight <> 0.5 AND Credit_Risk_Weight <> 0.75 AND
Credit_Risk_Weight <> 1 AND Credit_Risk_Weight <> 1.5 AND
Credit_Risk_Weight <> 2 AND Credit_Risk_Weight <> 2.5 "
Query46. "SELECT COUNT(*) FROM CREDITS WHERE
Balance_Sheet_Class < 1 OR (Balance_Sheet_Class > 20 AND
Balance_Sheet_Class <> 27 AND Balance_Sheet_Class <> 48 AND
Balance_Sheet_Class <> 50 AND Balance_Sheet_Class <> 51) "
Query47. "SELECT COUNT(*) FROM CREDITS WHERE TB_or_BB <> 'TB'
AND TB_or_BB <> 'BB'"
Query48. "SELECT COUNT(*) FROM CREDITS WHERE
Foreign_Exchange_Indexed <> 'Y' AND Foreign_Exchange_Indexed IS
NOT NULL"
Query49. "SELECT COUNT(*) FROM COLLATERALS WHERE
Collateral_Type NOT LIKE 'T[1-9]' AND Collateral_Type NOT LIKE 'T1[0-
2]'"
Query50. "SELECT COUNT(*) FROM COLLATERALS WHERE
Warrantor_Risk_Class NOT LIKE 'TRS0[1-9]' AND Warrantor_Risk_Class
NOT LIKE 'TRS1[0-6]'"
Query51. "SELECT COUNT(*) FROM COLLATERALS WHERE
Collateral_Risk_Weight <> 0 AND Collateral_Risk_Weight <> 0.2 AND
Collateral_Risk_Weight <> 0.5 AND Collateral_Risk_Weight <> 0.75 AND
Collateral_Risk_Weight <> 1 AND Collateral_Risk_Weight <> 1.5 AND
Collateral_Risk_Weight <> 2 AND Collateral_Risk_Weight <> 2.5 "

115
Query52. "SELECT COUNT(*) FROM COLLATERALS WHERE
Mortgage_Degree NOT LIKE '[1-3]' AND Mortgage_Degree IS NOT NULL
"
SQL queries for consistency
Query53. "SELECT Client_ID, COUNT(Tax_ID) FROM CLIENTS GROUP
BY Client_ID HAVING COUNT(Tax_ID) > 1"
Query54. "SELECT Tax_ID, COUNT(Client_ID) FROM CLIENTS GROUP
BY Tax_ID HAVING COUNT(Client_ID) > 1"
Query55. "SELECT Risk_Category_Code, COUNT(Risk_Category_Name)
FROM CLIENTS GROUP BY Risk_Category_Code HAVING
COUNT(Risk_Category_Name) > 1"
Query56. "SELECT Risk_Category_Name, COUNT(Risk_Category_Code)
FROM CLIENTS GROUP BY Risk_Category_Name HAVING
COUNT(Risk_Category_Code) > 1"
Query57. "SELECT COUNT(*) FROM CLIENTS WHERE
((Client_Risk_Class = 'MRS8' OR Client_Risk_Class = 'MRS9') AND
Firm_Segment <> 'KOBI') OR ((Client_Risk_Class <> 'MRS8' AND
Client_Risk_Class <> 'MRS9') AND Firm_Segment = 'KOBI') OR
(Client_Risk_Class = 'MRS7' AND Firm_Segment <> 'KI') OR
(Client_Risk_Class <> 'MRS7' AND Firm_Segment = 'KI') "
Query58. "SELECT COUNT(*) FROM CLIENTS WHERE ((Firm_Turnover =
0 OR Firm_Turnover IS NULL) AND (Firm_Segment = 'KOBI' OR
Firm_Segment = 'KI')) OR (Firm_Turnover > 0 AND (Firm_Segment <>
'KOBI' OR Firm_Segment <> 'KI'))"
Query59. "SELECT COUNT(*) FROM CLIENTS WHERE
((Firm_Personnel_Number = 0 OR Firm_Personnel_Number IS NULL)
AND (Firm_Segment = 'KOBI' OR Firm_Segment = 'KI')) OR (Firm_
Personnel_Number > 0 AND (Firm_Segment <> 'KOBI' OR Firm_Segment
<> 'KI')) "
Query60. "SELECT COUNT(*) FROM CLIENTS WHERE ((Firm_Asset_Size
= 0 OR Firm_Asset_Size IS NULL) AND (Firm_Segment = 'KOBI' OR
Firm_Segment = 'KI')) OR (Firm_Asset_Size > 0 AND (Firm_Segment <>
'KOBI' OR Firm_Segment <> 'KI'))"
Query61. "SELECT COUNT(*) FROM CREDITS WHERE ((Credit_Type =
'NK' OR Credit_Type = 'NKKF' OR Credit_Type = 'DA' OR Credit_Type
LIKE 'KTR0[1256789]' OR Credit_Type LIKE 'KTR0[56][AB]' OR
Credit_Type LIKE 'KTR10' OR Credit_Type LIKE 'GNA0[1-9]' OR
Credit_Type LIKE 'GNA1[0-3]') AND Credit_Conversion_Factor <> 1) OR
(Credit_Type LIKE 'GNB0[1-6]' AND Credit_Conversion_Factor <> 0.5)
OR (Credit_Type LIKE 'GNC0[1-7]' AND Credit_Conversion_Factor <>
0.2) OR (Credit_Type LIKE 'GND0[1-7]' AND Credit_Conversion_Factor
<> 0)"

116
Query62. "SELECT COUNT(*) FROM COLLATERALS WHERE
(Collateral_Type = 'T6' AND Mortgage_Value Is Null) OR (Collateral_Type
<> 'T6' AND Mortgage_Value Is Not Null)"
Query63. "SELECT COUNT(*) FROM COLLATERALS WHERE
(Collateral_Type = 'T6' AND Mortgage_Degree Is Null) OR
(Collateral_Type <> 'T6' AND Mortgage_Degree Is Not Null)"
Query64. "SELECT COUNT(*) FROM COLLATERALS WHERE
(Collateral_Type = 'T6' AND Mortgage_No Is Null) OR (Collateral_Type <>
'T6' AND Mortgage_No Is Not Null)"
Query65. "SELECT COUNT(*) FROM COLLATERALS WHERE
(Collateral_Type = 'T6' AND Appraisal_Firm_Name Is Null) OR
(Collateral_Type <> 'T6' AND Appraisal_Firm_Name Is Not Null)"
Query66. "SELECT COUNT(*) FROM COLLATERALS WHERE
(Collateral_Type = 'T6' AND Appraisal_Report_Code Is Null) OR
(Collateral_Type <> 'T6' AND Appraisal_Report_Code Is Not Null)"
Query67. "SELECT COUNT(*) FROM COLLATERALS WHERE
(Collateral_Type = 'T6' AND Last_Appraisal_Date Is Null) OR
(Collateral_Type <> 'T6' AND Last_Appraisal_Date Is Not Null)"

117
APPENDIX C: Current Process for Credit Risk Data Production
and Reporting in ABC Bank

118
APPENDIX D: Planned Process for Credit Risk Data Production
and Reporting in ABC Bank

119
APPENDIX E: Questionnaire for Data Quality Assessment of
Banks’ Credit Risk
Title of the participant4: ……………………………………………………………….
Department of the participant: ………………………………………………………...
Experience of the participant in banking sector (years): ……………………………...
This questionnaire is formed as a part of a Master of Science thesis study carried out
in Department of Information Systems, Graduate School of Informatics of the Middle
East Technical University. The questionnaire aims to evaluate an approach proposed
to assess quality of data used to quantify, measure and calculate credit risk of banks
based on responses obtained from the banks, and to improve the approach based on
the results of the evaluation. The first part of the questionnaire (Part A) involves
questions related to ongoing activities on data quality assessment within the banks,
and the second part (Part B) involves questions related to banks‟ evaluation of the
approach proposed by the study. A brief summary of the approach has been provided
in Appendix-1 of the questionnaire.
The questionnaire has 36 questions in total, which roughly takes 15 to 20 minutes to
complete.
Important Note: Responses given to questionnaire will not be used for any other
purposes but only for academic research. Privacy of identities of the participants will
be ensured and they will not be shared with third parties.
4 The questionnaire is expected to be answered by senior managers of risk
management departments of the banks. While filling out the questionnaire, it is
advised to take assistance from senior IT personnel who are functional in providing
IT infrastructure and database applications.

120
A. DATA QUALITY ASSESSMENT ACTIVITIES WITHIN THE BANK
1- Do you think that a specific approach or method is required to assess quality
of credit risk data of banks?
a. Definitely not required
b. Partially required
c. Considerably required
d. Definitely required
2- Are there any ongoing activities for quality assessment of credit risk data of
your bank?
a. Yes
b. No
3- Which one(s) of following activities are involved in quality assessment of
credit risk data of your bank? (multiple choice is possible)
a. Data taxonomy of credit risk data
b. Detection of credit risk data sources and integration of them to risk
management system
c. Definition of data quality dimensions for risk data
d. Development of data quality metrics to measure quality of risk data
e. Measurement of data quality performance via data quality metrics
f. Analysis quality performance and detection of causes of poor data
quality
g. Identification of improvement areas and actions to solve data quality
issues
h. Doing comprehensive cost/benefit analysis for viable improvement
actions
i. Other (state)……………………………………………………………
j. None
4- Is quality assessment of credit risk data of your bank based on qualitative or
quantitative assessment? (1-purely qualitative, 10- purely quantitative
assessment)
Qualitative ① ② ③ ④ ⑤ ⑥ ⑦ ⑧ ⑨ ⑩ Quantitative
5- Under which categories (data table type and number) does your bank classify
final data used in calculation of credit risk? (e.g. clients, credits, collaterals
etc.)
…………………………………………………………………………………
……………………………………………………………..

121
6- Which systems or databases does risk management department require to
provide raw data before creating final data for credit risk? (multiple choice is
possible)
a. Client Account Management System (client personal information and
account information)
b. Accounting System (accounting records regarding client transactions)
c. Collateral Management System (collaterals and guarantees of clients)
d. Rating System (ratings belonging to clients and collaterals)
e. Other (state)……………………………………………………………
f. None
7- While assessing data quality, it might require to use more than one data
quality dimension depending on requirements and their relevance.
Completeness is described as requirement for a data field not to have null
values; uniqueness is described as requirement for a data field not to have
duplicate values; consistency is described as requirement for conformance of
data values in a data field to data values in another data field due to business
rules and their relations to each other; accuracy is described as requirement
for conformance of data values in a data field due to rules or constraints
defined for that field; and timeliness is described as requirement for data
values in a data field to be up-to-date based on a reference time point. Which
data quality dimensions does your bank use in quality assessment of credit
risk data? (multiple choice is possible)
a. Completeness
b. Uniqueness
c. Consistency
d. Accuracy
e. Timeliness
f. Other (state)……………………………………………………………
g. None
8- Does your bank use quality performance metrics related to data quality
dimensions in order to measure data quality?
a. Yes, it does
b. No, it does not

122
9- Various control techniques can be used in the data quality assessment
processes and database applications. Examples for such techniques are
provided in the following table.
DQA Method Description
Column analysis Computation related to uniqueness, null values, min and max value,
totals, standard deviations, inferred types etc. in a column
Cross-domain analysis Identification of redundant data across columns in the same or
different tables
Data validation Verification of values against a reference data set via algorithms
Domain Analysis Checking if a data value within certain domain of values
Lexical Analysis Mapping unstructured content to structured set of attributes
Matching Algorithms Identification of duplicate values
Primary Key / Foreign
Key Analysis
Analysis applied to columns from different tables to detect good
candidates for Primary Key /Foreign Key relation
Schema Matching Detection of semantically equivalent attributes via algorithms
Semantic Profiling Business rules on data in columns or tables and measurement of the
compliance of data to the rules
Which data quality assessment techniques does your bank use to measure
quality of data in the database of the bank? (Multiple choice is possible)
a. Column analysis
b. Data validation
c. Cross-domain analysis
d. Domain analysis
e. Primary key / foreign key analysis
f. Semantic profiling
g. Lexical analysis
h. Matching algorithms
i. Schema matching
j. Other (state)……………………………………………………………
10- Does any prioritization take place for data types used in credit risk
management of which you think that quality concern and sensitivity is
critical?
a. Yes, it does.
b. No, there is no prioritization (same quality sensitivity is attributed to
all data types).
11- Which goals or concerns are overseen while assessing data quality in credit
risk management? (Rank those goals according to their significance starting
from “1”)
a. Allocating accurate capital by accurate calculation of credit risk ( )
b. Verifying quality of data obtained via information system of the bank,
and used in credit risk management ( )
c. Enhancing reliability of data used as input for credit risk management
( )
d. Other (state)……………………………………………………………

123
e. There is no concern for data quality of credit risk data of the bank.
12- Which problems does your bank experience about quality of credit risk data?
(Multiple choice is possible)
a. Duplicate records
b. Missing data values
c. Data values violating domain constraints
d. Inconsistency of data values in different fields or tables
e. Outdated data values
f. Other (state)……………………………………………………………
g. None
13- What are the causes of data quality issues experienced in credit risk by your
bank? (Rank those causes according to their significance starting from “1”)
a. Manual data entry ( )
b. Problems faced during consolidation of data obtained by multiple
tables ( )
c. Inadequacy of IT infrastructure (e.g. odd and non-communicating
tables) ( )
d. Complexity of IT infrastructure ( )
e. Use of many temporary tables during the creation of final tables ( )
f. Lack of central database ( )
g. Inability to update data simultaneously in all other tables when an
update of data is made in a table ( )
h. Lack of controls for data constraints ( )
i. Inaccurate definition of business rules ( )
j. Other (state)……………………………………………………………
k. None
14- Which improvement methods have already been applied in your bank to solve
data quality issues?
a. Patch solutions that do not seriously change IT infrastructure (changes
not affecting major processes but minor steps)
b. Solutions that partly change IT infrastructure (partial changes in major
processes)
c. Solutions/investments that significantly change IT infrastructure
(significant changes in major processes)
d. No activity regarding selection of viable improvement methods has
been performed before within the bank

124
15- Which criteria does your bank take into consideration while selecting
methods for improvement of data quality? (Rank selected criteria according
to their significance starting from “1”)
a. Costs of the method (including cost of investment, application and
management) ( )
b. Benefits of the method (including contribution to reduction of
operational costs) ( )
c. Practical applicability of the method (including burden of application
and influence on relevant systems) ( )
d. Acceptance of the method within the bank ( )
e. Legal applicability of the method ( )
f. Other (state)……………………………………………………………
g. No activity regarding selection of viable improvement methods has
been performed before within the bank
16- If there are activities regarding quality assessment of credit risk data within
your bank, evaluate its satisfactoriness between the scores 1 and 10 (1-
Completely unsatisfactory, 10- Completely satisfactory).
① ② ③ ④ ⑤ ⑥ ⑦ ⑧ ⑨ ⑩
B. EVALUATION OF BANKS ON THE APPROACH PROPOSED
17- Data taxonomy for credit risk data has been created in definition phase of the
approach. Data are classified under three entities, i.e. obligors, transactions
and credit protections, based on their characteristics. Attributes for entity has
been identified. Additionally, forth entity (credit risk function) with its
attributes is derived from other three entities (See Appendix, Definition
phase). Do you find the data taxonomy created sufficient in terms of quality
management of credit risk data?
a. Quite insufficient
b. Insufficient
c. Sufficient
d. Quite sufficient
18- Evaluate the following attributes belonging to obligors entity according to
significance for credit risk management. (1-very important, 5-not important at
all)
a. Obligor Identity (ID) ( )
b. Obligor Type (Class) ( )
c. Financial Statement of Obligor (for firms; revenue and asset size) ( )
d. Staff Size (for firms) ( )
e. Obligor Credibility (rating) ( )
f. Risk Group ( )

125
19- Evaluate the following attributes belonging to transactions entity according to
significance for credit risk management. (1-very important, 5-not important at
all)
a. Transaction Identity (ID) ( )
b. Accounting Record ( )
c. Transaction Type ( )
d. Credit Conversion Factor ( )
e. Transaction Amount ( )
f. Transaction Return ( )
g. Provisions/Losses ( )
h. Transaction Maturity ( )
i. Transaction Currency ( )
20- Evaluate the following attributes belonging to credit protections entity
according to significance for credit risk management. (1-very important, 5-
not important at all)
a. Credit Protection Identity (ID) ( )
b. Protection Type ( )
c. Protection Amount ( )
d. Protection Maturity ( )
e. Protection Rating ( )
f. Protection Currency ( )
21- Evaluate the following attributes belonging to credit risk function entity
according to significance for credit risk management. (1-very important, 5-
not important at all)
a. Obligor Identity (ID) ( )
b. Transaction Identity (ID) ( )
c. Protection Identity (ID) ( )
d. Final Rating (after matching obligor with credit protection) ( )
e. Exposure Before Credit Risk Mitigation ( )
f. Allocated Credit Protection Amount ( )
g. Risk Weighted Exposure After Credit Risk Mitigation ( )

126
22- Data sources that data related to attributes of entities proposed by the
approach can be obtained are classified by the approach under certain systems
(See part A) as follows. To what extent do you think those systems are
appropriate (comprehensive and modular) in terms of credit risk
management? (1-very appropriate, 5- not appropriate at all)
a. Client Account Management System – contains personal information
and account information of obligors ( )
b. Accounting System – contains accounting records belonging to
transactions of obligors ( )
c. Collateral Management System – contains information about
collaterals and guarantees of obligors ( )
d. Rating System – contains ratings belonging to obligors and collaterals
( )
e. Risk Management System – contains (derived) information other than
those obtained from other systems ( )
23- What do you think about satisfactoriness of data source system provided by
the approach in the definition phase?
a. Yes, satisfactory
b. No, it is unsatisfactory; data sources that can be added
(state)…………………………
24- Evaluate following data quality dimensions that are used in the proposed data
quality assessment approach in terms of their relevance to credit risk? (1-
completely relevant, 5-not relevant at all)
a. Completeness ( )
b. Uniqueness ( )
c. Consistency ( )
d. Accuracy ( )
e. Timeliness ( )
25- Data quality dimensions proposed by the approach to assess credit risk data
quality are uniqueness, completeness, consistency, accuracy and timeliness
(Definitions have been provided in question 7). What do you think
satisfactoriness of those dimensions in terms of their comprehensiveness?
a. Yes, satisfactory
b. No, it is unsatisfactory; data dimensions that can be added
(state)……………………

127
26- In the measurement phase of the approach, to what extent do you think
developing metrics by the approach to measure performance of data quality
dimensions for each attribute of the entities contribute to credit risk
management and data quality management?
a. No contribution made
b. No significant contribution made
c. Partial contribution made
d. Significant contribution made
27- In the measurement phase, assessment techniques that the approach focuses
on are primary key/foreign key analysis, column analysis, cross-domain
analysis, domain analysis and semantic profiling. SQL queries created based
on those techniques are used to measure the metrics created in this phase.
What do you think about effectiveness of those techniques used and queries
created by the approach in measurement of quality of credit risk data?
a. No effect at all
b. No significant effect
c. Partial effect
d. Significant effect
28- In the measurement phase, key (individual) quality performance indicators
for each metric are developed to assess results of performance metrics more
meaningfully based on scores. Those indicators transforms metric results to
scores based on a scale (e.g. out of 10). Individual indicators for each relevant
data quality dimension are aggregated with certain weights in order to
calculate composite quality performance indicators for each relevant data
quality dimension. Do you think that deriving and calculating composite
indicators from individual indicators will accurately represent and measure
performance of relevant data quality dimension?
a. Yes, I do
b. No, individual indicators would be better indicator or different kind of
metrics could be developed
29- If you think that composite indicators are significant and effective, how do
you think that weights of individual indicators that composite ones is derived
should be determined?
a. Equal weights should be given.
b. They should be prioritized according to their significance for credit
risk calculation.
c. They should be prioritized according to the complexity extent of
transformation they are exposed while obtaining final data.
d. The weights can be changed depending on changes in credit risk
management functions.

128
30- In case that approach is implemented within your bank, which data quality
issues do you think it will detect and provide support to find solutions to
those issues in the analysis phase?
a. Duplicate records
b. Missing data values
c. Data values violating domain constraints
d. Inconsistency of data values in different fields or tables
e. Outdated data values
f. Other (state)……………………………………………………………
g. None
31- If your bank were to use the approach proposed, what should be the basis
point in selecting improvement techniques in terms of their benefits and costs
in order to solve data quality problems in the improvement phase?
a. They should be selected based on their benefits regardless of their
costs.
b. The costs are critical for the bank; therefore, the selection criteria
should mostly be based on the costs.
c. Both benefits and costs should be regarded as equally important in
selecting the techniques.
32- Would you like to use the approach proposed at your bank? If you would,
what is the reason such use?
a. Yes, data quality problems in our bank are at serious level.
b. Yes, partial implementation of the approach could be beneficial for
our bank.
c. No, since we do not experience data quality problems, there is no such
need.
d. No, we experience data quality problems but such an approach would
be insufficient in resolving those problems.
33- Let us say you have used the approach proposed in your bank. Thus, you
have obtained certain results based performance of metrics with that
approach. To what extent would you trust the findings of the approach in
terms of problems, their causes and improvement areas detected?
a. Definitely, I would not. I am not sure the approach would cover all
quality concerns.
b. I have doubts about trusting the findings.
c. I can trust the findings to some extent and I would consider them in
improving data quality.
d. Definitely, I would. I would immediately evaluate the findings
revealed, and plan actions for data quality improvement.

129
34- How do you evaluate satisfactoriness of the approach proposed in general
between scores 1 and 10? (1- Completely unsatisfactory, 10- Completely
satisfactory)
① ② ③ ④ ⑤ ⑥ ⑦ ⑧ ⑨ ⑩
35- Do you think there are deficiencies to fulfill or areas to improve regarding the
approach proposed? Please state if any.
…………………………………………………………………………………
……………………………………………….....................................................
.............................................................................................................................
.............................................................................................................................
.............................................................................................................................
......................................
36- What type of difficulties do you think your bank might experience in
practical application of the approach proposed? Please state if any.
…………………………………………………………………………………
……………………………………………….....................................................
.............................................................................................................................
.............................................................................................................................
.............................................................................................................................
......................................
Thank you for participating our survey…
Please send e-mail to [email protected] if you have any question.

130
Appendix: Summary of the Data Quality Assessment Approach
The approach consists of four phases. These phases are definition, measurement,
analysis and improvement of data quality. The phases are executed iteratively.
(DefinitionMeasurementAnalysisImprovementDefinition). The phases are
summarized with their outputs as follows.
1-Definition Phase
Definition of data entities and their attributes o Obligors/Transactions/Credit Protections
o o Credit Risk Function (derived from obligor, transaction and credit protection
relationship)
o
Identification of data sources used to obtain information about the attributes
of the entities o Account Management System
o Accounting System
o Collateral Management System
o Rating System
o Risk Management System (fed by other systems)
Definition data quality dimensions for each attribute of an entity o Uniqueness/Completeness/Accuracy/Consistency/Timeliness
Outputs of the Phase
Data entities and attributes
Data quality dimensions
2-Measurement Phase
Development of data quality metrics
Obligor
•Obligor Identity
•Type
•Financial Statement
•Personnel Number
•Credibility
•Risk Group
Transaction
•Credit Identity
•Transaction Record
•Type
•Credit Conversion Factor
•Amount
•Return
•Provision/Loss
•Period
•Currency Type
Credit Protection
•Protection Identity
•Protection Type
•Amount
•Period
•Provider Credibility
•Currency Type
Credit Risk Function
•Obligor Identity
•Transaction Identity
•Protection Identity
•Final Risk Weight
•Exposure Amount Before CRM
•Risk-weighted Exposure Amount After CRM

131
o Data quality metrics for each attribute given data quality dimension
Selection data quality assessment techniques for measurement of data quality
metrics o Primary key/secondary key analysis, column analysis, cross-domain analysis,
domain analysis, semantic profiling etc.
o Creation of queries related to data quality assessment techniques
Development of key quality performance indicators (individual indicators) o Transformation of data quality metrics to key quality performance indicators
Development of composite quality performance indicators o Determination of weights of individual indicators (equal/prioritized)
o Derivation of composite indicators by weighted sum of individual indicator for each
dimension
Data quality assessment based on composite indicator results
Outputs of the Phase
Composite indicator results
Data quality assessment results
3-Analysis Phase
Analysis of indicator results and data quality assessment results
Detection of drivers causing poor data quality performance by assessing
composite indicators
Outputs of the Phase
Causes of data quality problems
Attributes causing poor data quality
4-Improvement Phase
Identification of improvement areas based on the causes of poor data quality
Investigation of improvement techniques
o Cost/benefit analysis
Recommendation of a combination of improvement techniques
Selection among the alternative techniques.
Outputs of the Phase
Improvement actions decided
Improvement techniques selected

132
APPENDIX F: Curriculum Vitae
CURRICULUM VITAE
PERSONAL INFORMATION
Surname, Name: GÜNEġ, Muhammed Ġlyas
Nationality: Turkish (TC)
Date and Place of Birth: 16 July 1985, Malatya
Phone: +90 538 266 49 17
Email: [email protected]
EDUCATION
Degree Institution Year of
Graduation
B.S. METU Industrial Engineering 2008
M.Sc. METU Information Systems 2016
PROFESSIONAL EXPERIENCE
Year Place Enrollment
2008-2013 Proje Enerji Ltd. Industrial Engineer
2013-present BRSA (BDDK) Assistant Specialist
FOREIGN LANGUAGES
Advanced English

TEZ FOTOKOPİSİ İZİN FORMU
ENSTİTÜ
Fen Bilimleri Enstitüsü
Sosyal Bilimler Enstitüsü
Uygulamalı Matematik Enstitüsü
Enformatik Enstitüsü
Deniz Bilimleri Enstitüsü
YAZARIN
Soyadı : GÜNEġ
Adı : Muhammed Ġlyas
Bölümü : BiliĢim Sistemleri
TEZİN ADI (Ġngilizce) : DATA QUALITY ASSESSMENT IN CREDIT RISK
MANAGEMENT BY A CUSTOMIZED TOTAL DATA QUALITY
ASSESSMENT APPROACH
TEZİN TÜRÜ : Yüksek Lisans Doktora
1. Tezimin tamamından kaynak gösterilmek Ģartıyla fotokopi alınabilir.
2. Tezimin içindekiler sayfası, özet, indeks sayfalarından ve/veya bir bölümünden
kaynak gösterilmek Ģartıyla fotokopi alınabilir.
3. Tezimden bir (1) yıl süreyle fotokopi alınamaz.
TEZİN KÜTÜPHANEYE TESLİM TARİHİ : …………………….