Embed Size (px)
Citation preview
Proc. IODP | Volume 313
Mountain, G., Proust, J.-N., McInroy, D., Cotterill, C., and the Expedition 313 ScientistsProceedings of the Integrated Ocean Drilling Program, Volume 313
Data report: grain size distribution of Miocene successions, IODP Expedition 313 Sites M0027, M0028, and M0029,
New Jersey shallow shelf1
Hisao Ando,2 Miho Oyama,3 and Futoshi Nanayama4
Chapter contents
Abstract . . . . . . . . . . . . . . . . . . . . . . . . . . . . . . . 1
Introduction . . . . . . . . . . . . . . . . . . . . . . . . . . . 1
Methods and materials . . . . . . . . . . . . . . . . . . . 2
Results . . . . . . . . . . . . . . . . . . . . . . . . . . . . . . . . 3
Conclusions . . . . . . . . . . . . . . . . . . . . . . . . . . . . 6
Acknowledgments. . . . . . . . . . . . . . . . . . . . . . . 6
References . . . . . . . . . . . . . . . . . . . . . . . . . . . . . 6
Figures . . . . . . . . . . . . . . . . . . . . . . . . . . . . . . . . 8
Tables. . . . . . . . . . . . . . . . . . . . . . . . . . . . . . . . 14
1Ando, H., Oyama, M., and Nanayama, F., 2014. Data report: grain size distribution of Miocene successions, IODP Expedition 313 Sites M0027, M0028, and M0029, New Jersey shallow shelf. In Mountain, G., Proust, J.-N., McInroy, D., Cotterill, C., and the Expedition 313 Scientists, Proc. IODP, 313: Tokyo (Integrated Ocean Drilling Program Management International, Inc.). doi:10.2204/iodp.proc.313.201.20142Ibaraki University, Department of Earth Science, Faculty of Science, 2-1-1 Bunkyo, Mito, Ibaraki 310-8512, Japan. [email protected] University, Graduate School of Science and Engineering, 2-1-1 Bunkyo, Mito, Ibaraki 310-8512, Japan.4Geological Survey of Japan, AIST, Site 7, 1-1-1 Higashi, Tsukuba, Ibaraki 305-8567, Japan.
AbstractDuring Integrated Ocean Drilling Program Expedition 313 on theNew Jersey shallow shelf, sandy shallow-marine late Eocene tomiddle Miocene sediments were successfully drilled at three sites(M0027, M0028, and M0029). From the upper unconsolidated in-tervals, ~634 m thick overall, a total of 275 sediment sampleswere analyzed for grain-size distributions. Average (arithmeticmean) grain size ranges from fine silt to coarse sand, passing frommedium silt to medium sand because of the limited occurrence ofcoarse silt and fine sand. Silty sediments dominate overall, andclay-dominated sediments were not recognized. Average grain-size data plotted on the equivalent intervals of geologic columnarsections show that stratigraphic changes concordantly reflect lith-ology and sequence stratigraphy at all three sites. Grain-size fre-quency curves of measured sediment samples can be divided into16 silt and 8 sand sediment types on the basis of shape, mode po-sition, grain size range, and volume of skewed coarser or finergrain components. Lithostratigraphic changes are concordant toaverage grain-size curves and sequence stratigraphy, in general.
IntroductionDuring Integrated Ocean Drilling Program (IODP) Expedition313, Miocene intervals of midshelf clinoforms were drilled in theNew Jersey shallow shelf at three sites (M0027, M0028, andM0029), complementing the coastal plain to slope core data setsand building a large “New Jersey transect” across the U.S. Atlanticpassive margin. Despite the difficulties of coring in the sandyshallow shelf, Expedition 313 successfully collected a total of1311 m of core with ~80% recovery for target intervals (see the“Expedition 313 summary” chapter [Expedition 313 Scientists,2010a]). The main goals of Expedition 313 were to estimate thetime, amplitudes, rates, and mechanisms of sea level change andto evaluate sequence stratigraphic facies models that predict de-positional environments, sediment compositions, and stratal ge-ometries in response to sea level change.
The lithostratigraphic descriptions of split cores show sand-,sandy silt-, and silt-dominated continuous successions of shallow-marine (shoreface to shelf) sediments developed in the late Eo-cene to middle Miocene that form more than 10 sedimentary cy-cles. These sediments seem to reflect 50–100 m sea level changes
doi:10.2204/iodp.proc.313.201.2014
H. Ando et al. Data report: grain size distribution of Miocene sediment
controlled by global eustasy, high sediment supply,and some local factors during the time interval from34 to 13 Ma (see the “Expedition 313 summary”chapter [Expedition 313 Scientists, 2010a; Miller etal., 2013a, 2013b]).
Our purpose is to detect stratigraphic trends of Mio-cene successions by analyzing the drilled sedimentsfor characteristics of grain size, grain-size frequency,and changes in distribution and by constructingmean grain-size curves. Saito (1996) and Hoyanagiand Omura (2001) analyzed grain sizes in the Pleisto-cene muddy successions of the New Jersey shelfslope (Ocean Drilling Program [ODP] Leg 150) andshelf margin (ODP Leg 174A). However, our targetintervals are Miocene shallow-marine successionsdrilled on the New Jersey shallow shelf.
Methods and materials
Premeasurement treatment of sediment samples
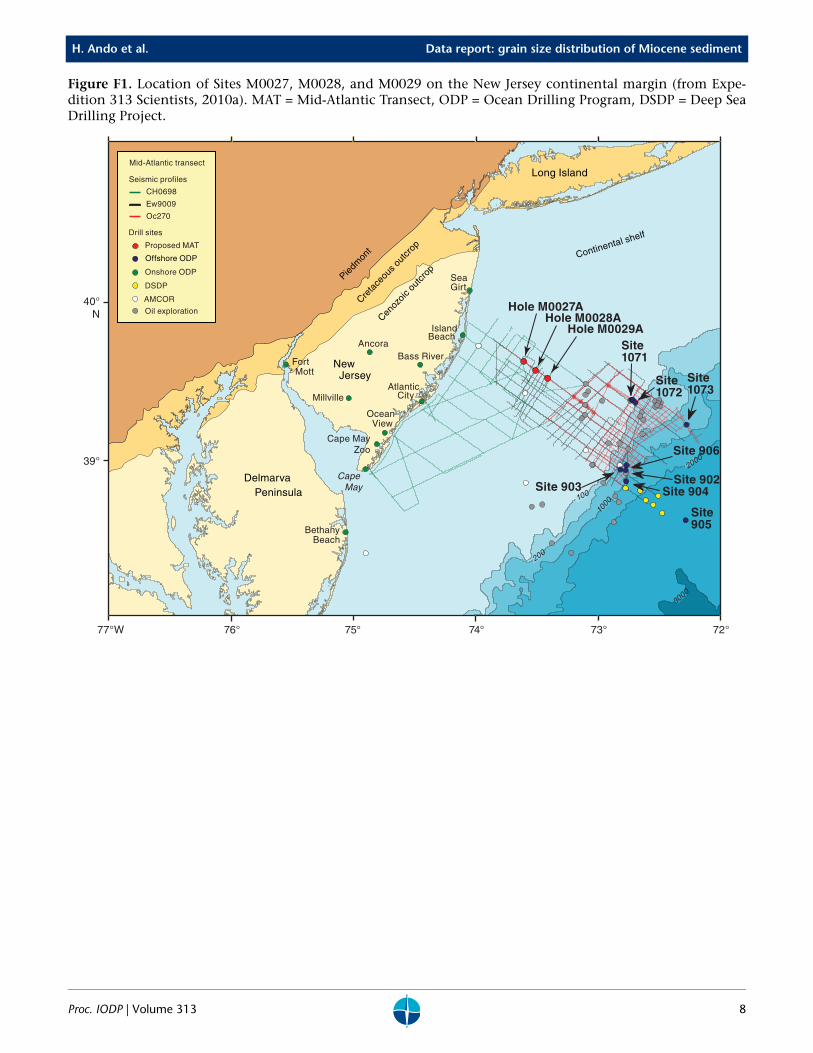
Siliciclastic sediments drilled from three sites of Ex-pedition 313 on the New Jersey shallow shelf (Fig.F1) often include biogenic materials (e.g., organicmatter and calcareous and siliceous biogenic skele-tons such as foraminifers, nannoplankton, radiolar-ians, diatoms, etc.). Before analyzing the sedimentgrain size, all organic materials were dissolved usingthe particle degradation treatment described below.
After drying a subsample of 5–8 g taken from each 20cm3 or 10 g of sediment, it was first degraded intoparticles through pounding semisolid parts softlyand carefully in an agate mortar using a pestle. Todissolve organic material, the sediment sample firstsoaked in 5–8 cm3 of 0.1 M H2O2 solution in a testtube for a day at room temperature. After adding 3–6cm3 of 0.1 M H2O2, the tube was then kept in a shak-ing water bath for 1 h at 30°C and a 100 rpm shakingrate. Following shaking, the sample was kept in awarm water bath at 50°C for 1 day. After cooling toambient temperature, the tube was filled by addingdistilled water and centrifuged for 1 h at 3400 rpm.After removing the upper clean layer and adding dis-tilled water, the sediment was centrifuged twicemore. The sediment was then dried for a few days ina thermostatic oven. As a last procedure the sedi-ment was again degraded into particles by softly andcarefully pounding semisolid parts, using a pestle inan agate mortar. Ultrasonic vibration for particledegradation was not used in order to avoid particlebreakage.
Proc. IODP | Volume 313
MeasurementWe used two analyzers installed at the GeologicalSurvey of Japan, the LA-300 for silt-sized sedimentsfiner than fine sand and the CAMSIZER for sand-sized sediments, both of which are made by HoribaCo. Ltd. (www.horiba.com/). The LA-300 is a laserscattering particle-size distribution analyzer with ameasurable size range from 0.1 to 600 µm. Electricalsignals corresponding to the intensity of the scat-tered light are used to calculate the size distributionof particles, based on the Mie scattering theory. Inthis study, we measured sediment samples under arelative refraction index as 120-001i. After adjust-ment of the optical axis, samples were put into a dis-persion medium chamber and measured with a laserlight transmission rate of 85%–90%. A data set ofeach measurement is divided into 64 logarithmicallyequally spaced classes between 0.1 and 600 µm. Theinstalled software calculates major statistical parame-ters.
A particle analyzer with digital image processing(CAMSIZER) uses two digital (CCD) cameras for themeasurable range from 30 µm to 30 mm. A data setof each measurement is divided into 40 logarithmi-cally equally spaced classes between –3.0 and 6.0 φwith intervals of 0.2 φ. Using Microsoft Excel soft-ware, four major statistical parameters were calcu-lated.
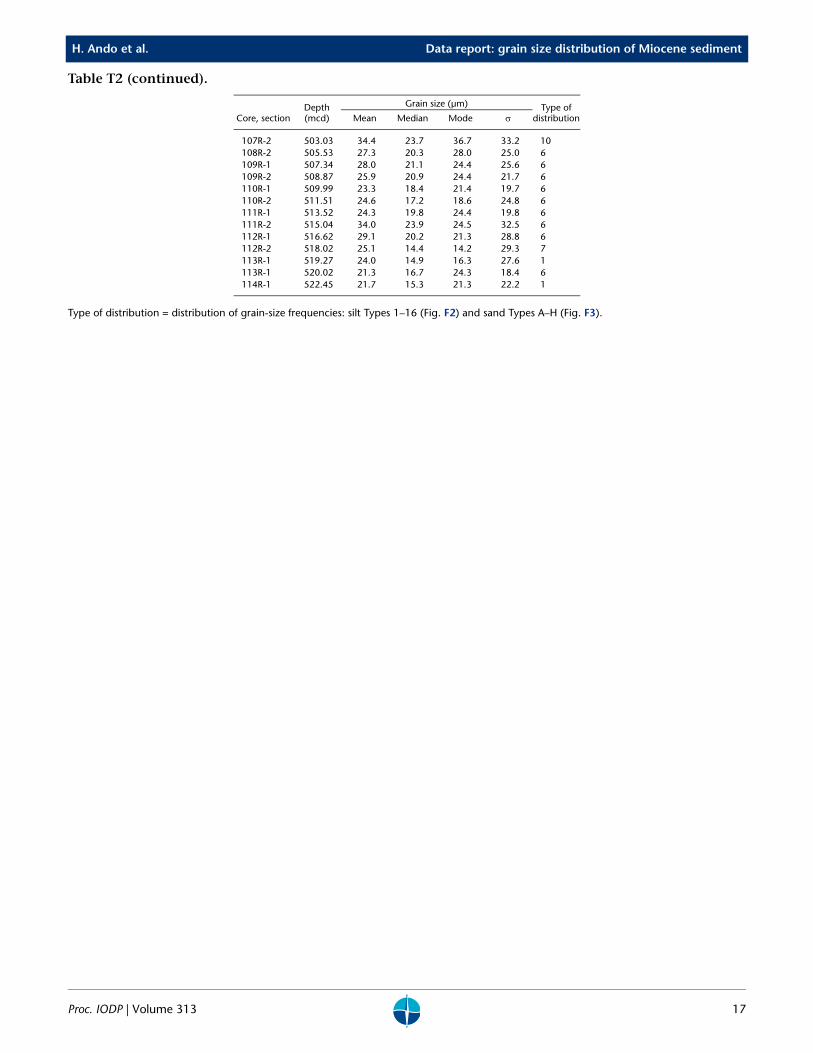
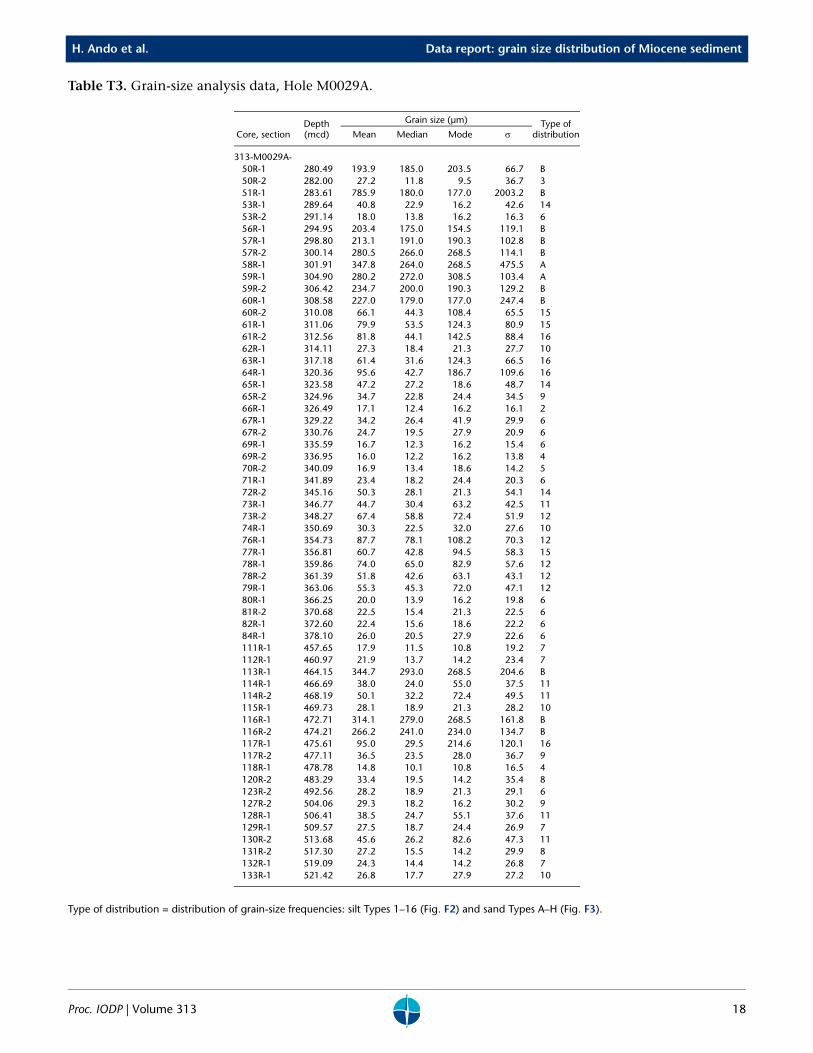
Tables T1, T2, and T3 show four statistical parame-ters such as mean, median, mode of grain size, andstandard deviation for each sample measurement.
MaterialsA total of 275 sediment samples were measured fromthe three sites. The measurable horizons at the threesites are approximately within the unconsolidatedupper half of the drilled sections, representing thick-ness ranges of 293, 177, and 164 m at Sites M0027,M0028, and M0029, respectively, and a total of634 m.
Site M0027A total of 135 unconsolidated sediment samples suit-able for measurements were obtained from Cores313-M0027A-66X (195 meters composite depth[mcd]) to 170R (489 mcd) (293 m thick). Consoli-dated sediments abundant in authigenic glaucony(glauconite) grains were unfit for analysis fromdepths below Core 171R and so were the poorly re-coverable horizons above Core 65X.
In general, we took one sample from each core in thesilt-sized sediment intervals and from each section in
2
H. Ando et al. Data report: grain size distribution of Miocene sediment
the sand-sized sediments, except for horizons dis-turbed during drilling or core splitting. Of the 135samples, 99 came from muddy to very fine sandysediments that were measured using the LA-300,whereas 36 samples from fine to coarse sandy sedi-ments were measured using the CAMSIZER.
Site M0028At Site M0028, we selected a total of 80 samples fromunconsolidated and well-recovered intervals of Cores313-M0028A-14R to 38R (257–323 mcd; 66 m) and79R to 114R (412–523 mcd; 111 m). We generallytook one sample from each core except for the hori-zons disturbed during drilling or core splitting. Theinterval between Cores 39R and 78R (323–412 mcd)is heterogeneously consolidated and poorly recov-ered at large. Among 80 samples, 73 were measuredby the LA-300 and the others were measured by theCAMSIZER.
Site M0029At Site M0029, a total of 60 samples were selectedfrom unconsolidated intervals of Cores 313-M0029A-50R to 84R (280–379 mcd; 99 m) and 111Rto 133R (457–522 mcd; 65 m). We generally took onesample from each core. Twelve sand-sized sedimentswere measured by the CAMSIZER and the rest weremeasured by the LA-300.
Results
Types of grain-size frequency curvesThe grain-size frequency curves for the samples fromthe three sites drawn by the installed software in theLA-300 and CAMSIZER are divided into 16 silt and 8sand types on the basis of their curve shape, modeposition, grain size range, and volume of skewedcoarser or finer grain components. These curves re-flect altogether the nature of the source area, the ero-sion processes, and sediment transportation history.
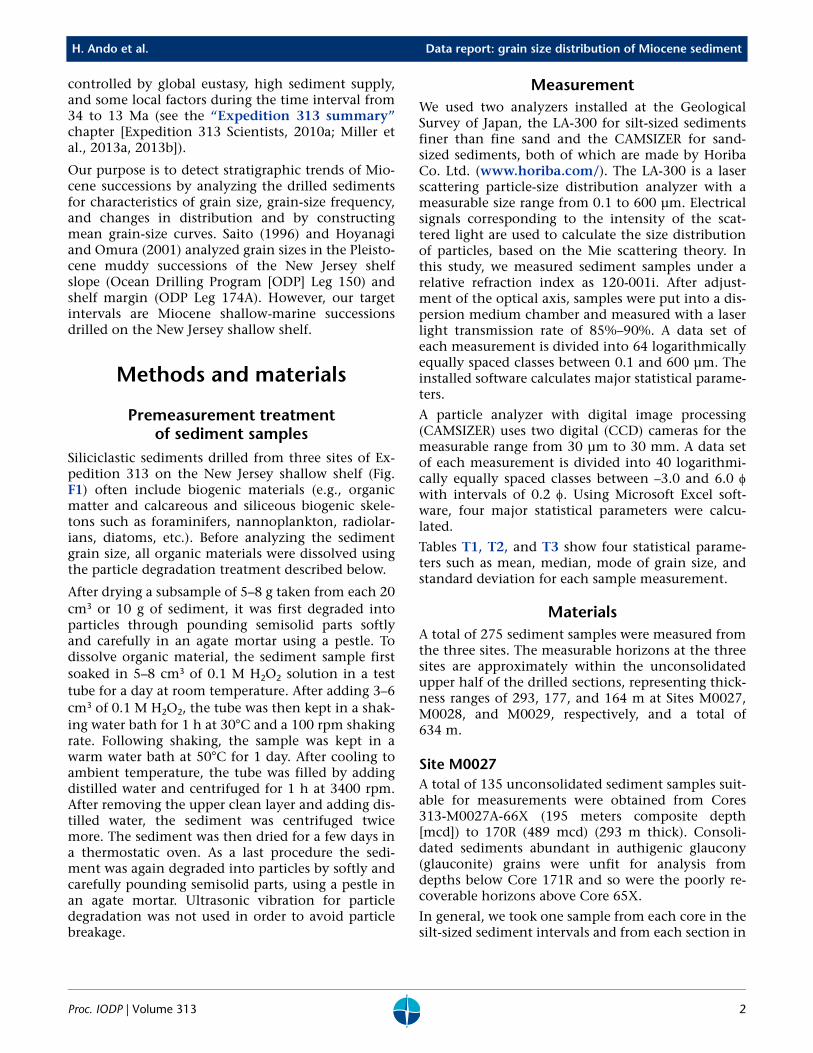
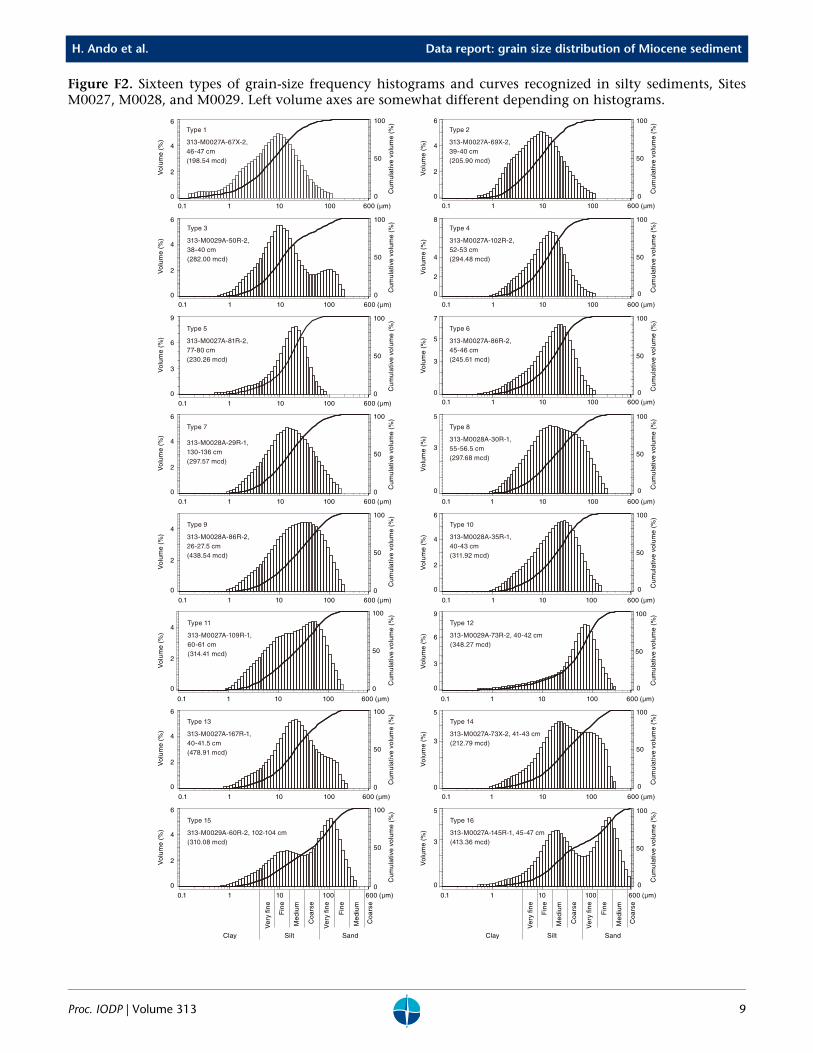
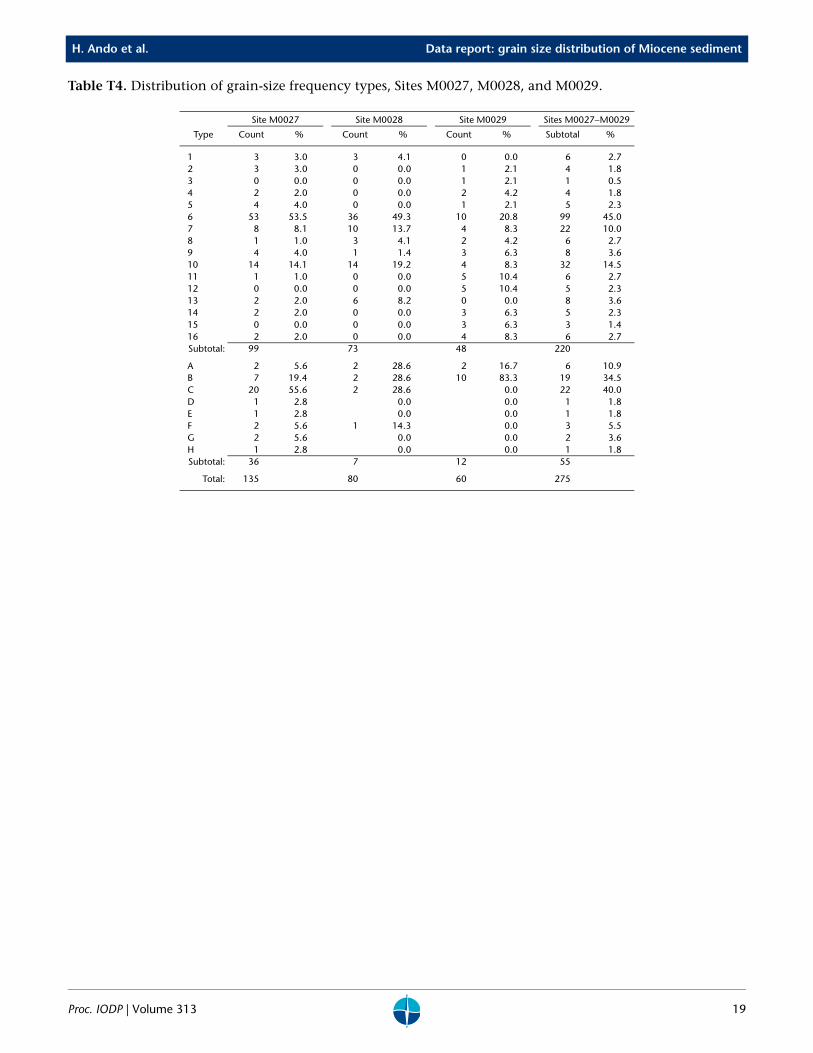
Silt sediment typesFigure F2 shows the representative histograms andcumulative volume curves of 16 types (Types 1–16)of grain-size frequency distributions in 220 silt sam-ples finer than fine sand. The three most frequenttypes, namely Types 6, 10, and 7, reach 45%, 14.5%,and 10%, respectively, as a whole and occupy ~70%of the total (Table T4). No other type exceeds 4%.The frequency of types varies depending on the site.Among the three sites, Site M0029 is more variable,though the number of measured samples is thesmallest. The following is a brief description of eachcurve type:
Proc. IODP | Volume 313
• Types 1 and 2: the mode generally shows symmet-rical pyramidal shapes on the fine silt class, butType 1 has a smaller amount of finer clay frac-tions. Both types have gently concave left (finer)and concave right (coarser) lower slopes.Although Type 1 is the finest among 16 types,both Types 1 and 2 can be classified as clayey silt.Both of the types are recognized in three samplesfrom Site M0027. Three samples from Site M0028are Type 1, and one sample from Site M0029 isType 2.
• Type 3: this type is recognized only in one samplefrom Site M0029; it is characterized by a bimodalshape with the higher mode on fine silt and thelower on very fine sand. This type is classified asvery fine sandy silt.
• Type 4: the mode has a nearly symmetrical, trian-gular shape with a gently concave right lowerslope. This type is classified as silt and is recog-nized in two samples from both Sites M0027 andM0029.
• Type 5: though similar to Type 6 in its generalmode curve shape, Type 5 has an acute peakbetween fine to medium silt with a more concaveand long left slope. Type 5 is classified as silt andis observed in four samples from Site M0027 andin one sample from Site M0029.
• Type 6: this type is the most frequent type foundin silty sediment samples from all three of thesites. It reaches 53.5% and 49.3% at Sites M0027and M0028, respectively, but decreases to 20.8%at Site M0029. This type has a leftward skewedasymmetric shape with a mode on medium siltand gently concave slopes on both sides. Type 6 isclassified as silt as well as Types 4 and 5.
• Type 7: the mode has a pyramidal symmetricalform, both flat sides and a peak at medium silt. Itincludes <20% of very fine to fine sand. Thus, thistype is classified as slightly sandy silt. This is thethird most common type at the three sites andoccurs adjacent to Type 6 horizons.
• Type 8: the mode is somewhat similar in shape toType 7 except for the convex-up coarser side oncoarse silt and very fine sand. This type is classi-fied as sandy silt and is observed in 1–3 samples ateach site.
• Type 9: the mode forms a round-top asymmetricalshape with a peak at medium to coarse silt andincludes >20%–30% very fine to medium sand.Type 9 is classified as very sandy silt and isobserved in one to four samples of the three sites.
• Type 10: the mode is similar in its asymmetricaltriangular general shape to Type 6, but its peak issituated on medium to coarse silt. Though Type
3
H. Ando et al. Data report: grain size distribution of Miocene sediment
10 is also similar to Type 9, it has an angular modewith flat left and slightly concave right sides. Type10 is the second most common type found at allthe three sites. This type is classified as slightlysandy silt. Four types (Types 7–10) can be gener-ally classified as sandy silt.
• Type 11: although classified as poorly sortedsandy silt as well as Type 9, this type is character-ized by a mode with convex-up left side and a dis-tinct peak at coarse silt to very fine sand. Themode is somewhat similar to Type 9 in generalshape and the flat lower part of the both sides,though the top surfaces differ. Type 11 is recog-nized in one sample from Site M0027 and in fivesamples from Site M0029.
• Type 12: the mode has an acute peak on coarse siltto very fine sand with a skewed toward finer, longleft lower slope. This can be classified as silty veryfine sand. Type 12 was found only in five samplesat Site M0029.
• Types 13 and 14: these types are classified as sandysilt, have modes with similar shapes with peaks atmedium silt, and have shoulderlike convexity invery fine and fine sand classes. As Type 14includes more coarser components, its mode has aconspicuous convex form in the right side. Thismeans that Type 14 is coarser than Type 13 as awhole. Type 13 is recognized in two samples atSite M0027 and in six samples at Site M0028, andType 14 is seen in two samples at Site M0027 andin three samples at Site M0029.
• Types 15 and 16: these types are characteristicbimodal shapes within a wide range of grain size,indicating poorly sorted silt to sand sediments:the mode for Type 15 has a set of left lower andright higher peaks at fine silt and very fine sand,respectively. Type 15 very sandy silt is onlydetected in three samples at Site M0029. Type 16mode has two similarly high peaks situated on thecoarser side, namely medium silt and fine sand.Furthermore, Type 16 contains common mediumsand grains. Type 16 very silty fine sand is recog-nized in two samples at Site M0027 and in foursamples at Site M0029.
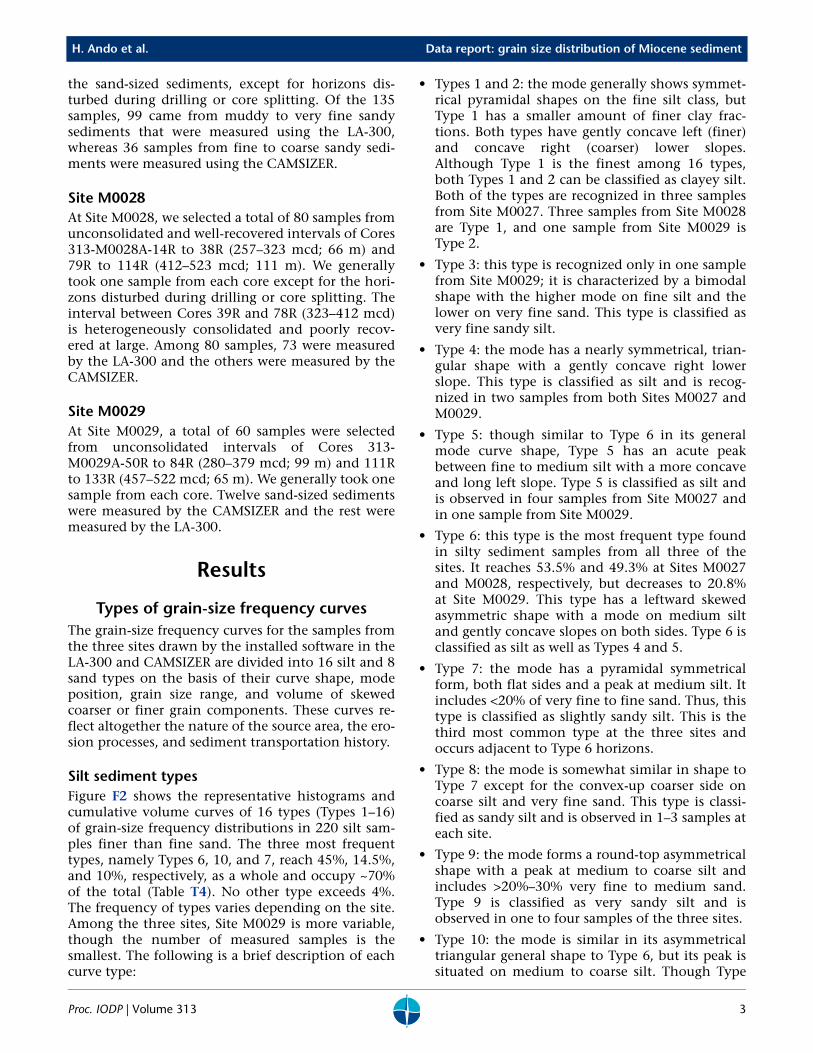
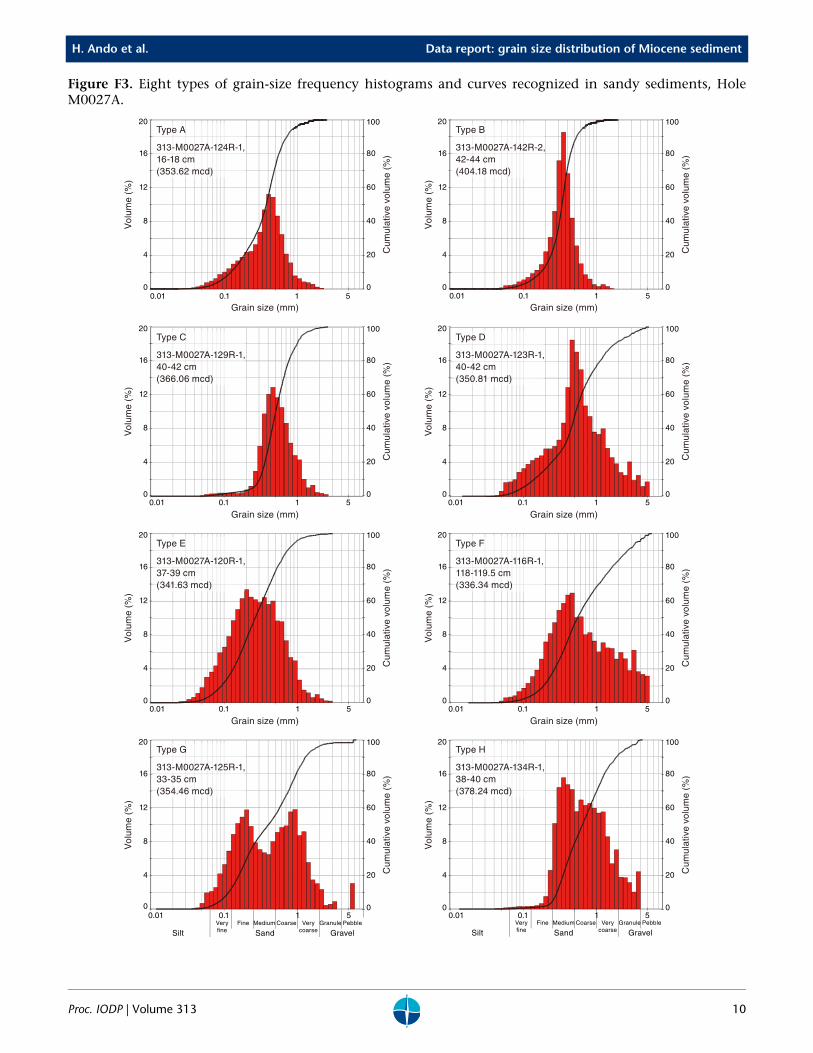
Sandy sediment typesFigure F3 shows the representative histograms andcumulative volume curves of eight types (A–H) ofgrain-size frequency distributions in a total of 55sandy samples from the three sites measured by theCAMSIZER.
Three curve types, namely Types A, B, and C, showmonomodal simple curves and occupy 85% of thetotal measured samples (Table T4). No other type ex-
Proc. IODP | Volume 313
ceeds 6% of the total. Their frequency varies depend-ing on sites, though the numbers of measured sam-ples are smaller than in silty sediments. Each type isbriefly described below.
Types A–C have monomodal shapes with peaks inmedium sand and both upper steep and lower con-cave slopes, showing relatively well sorted sand sedi-ments. Types D–H are observed only in one or twosamples at Site M0027, except for Type F, which isfound in a sample at Site M0028. These types arepoorly sorted sediments and show characteristicgrain-size frequency curves different from TypesA–C.
• Type A differs from Types B and C; the mode isskewed toward finer and the shape is asymmetri-cal, with the gentle concave left slope finer thanmedium sand. Type A medium to coarse sand isrecognized in two samples from each site.
• Type B is characterized by a mode with symmetri-cal shape with an acute and high (leptokurtic)peak and both steep concave slopes, indicatingwell-sorted medium to coarse sand deposits. TypeB is common at all three sites.
• Type C has the left side steep and leftward-con-tinuing low skirt, showing a small amount of finercomponents than fine sand. The right half is simi-lar to Type B in the rightward concave shape. TypeC (medium to coarse sand deposits) is abundant atSite M0027 but was not found at Site M0029.
• Type D is characterized by a mode with a centralhigh peak on medium to coarse sand and bothsides smooth and flat over a wide range of grainsizes, indicating that this sediment is very poorlysorted. Type D also includes very coarse sand andgranule gravel.
• Type E has a trapezoidal shape with a gently right-ward-inclined flat top (fine to coarse sand) andsymmetrically inclined sides.
• Type F is characterized by a mode with left-sidesteep slope and right-side gentle slope and a peakbetween medium and coarse sand. It includesgranules and a small amount of small pebbles.Therefore, Type F granule-bearing medium tocoarse sand is a very poorly sorted sediment simi-lar to Types D and G.
• Type G has a conspicuous bimodal shape with theleft peak on fine sand and the right peak betweencoarse and very coarse sand. Type G poorly sortedfine to very coarse sand includes a small amountof granules and small pebbles.
• Type H is a medium to very coarse sand with gran-ules. Its mode peaks at medium sand, though itincludes a large amount of coarse to very coarse
4
H. Ando et al. Data report: grain size distribution of Miocene sediment
sand. The mode for Type H has a very steep leftslope side and a gentle right slope.
Stratigraphic trends of average grain-size variations
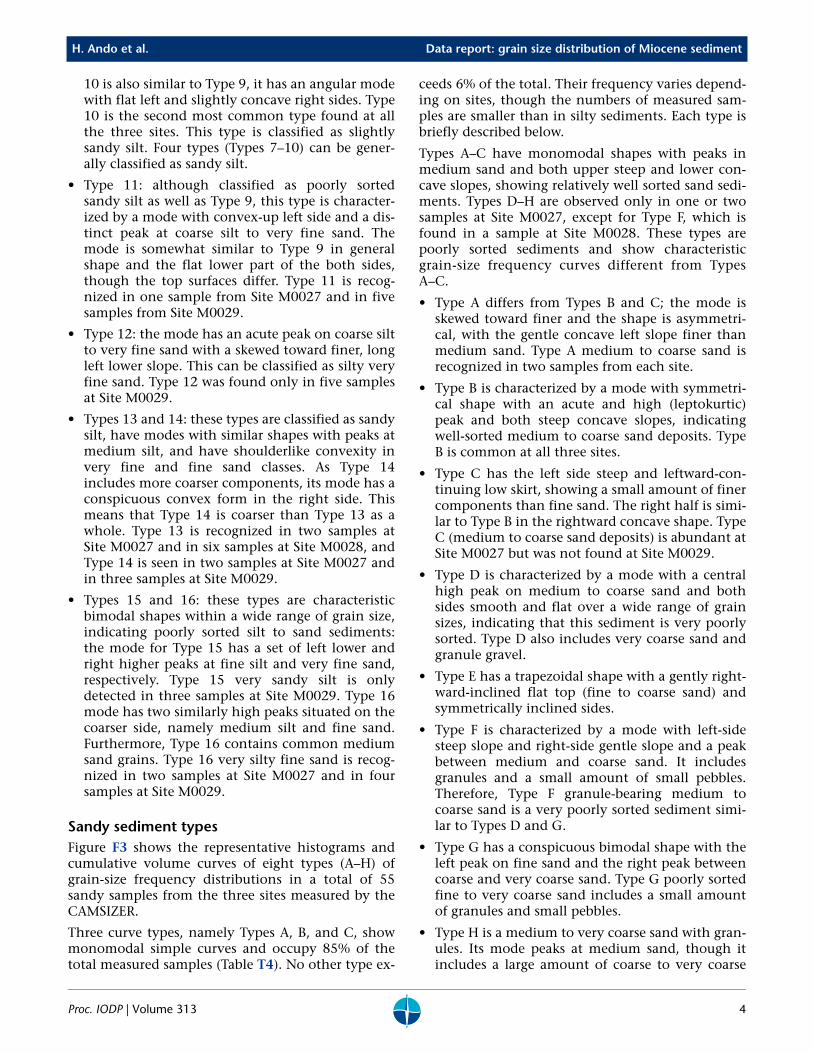
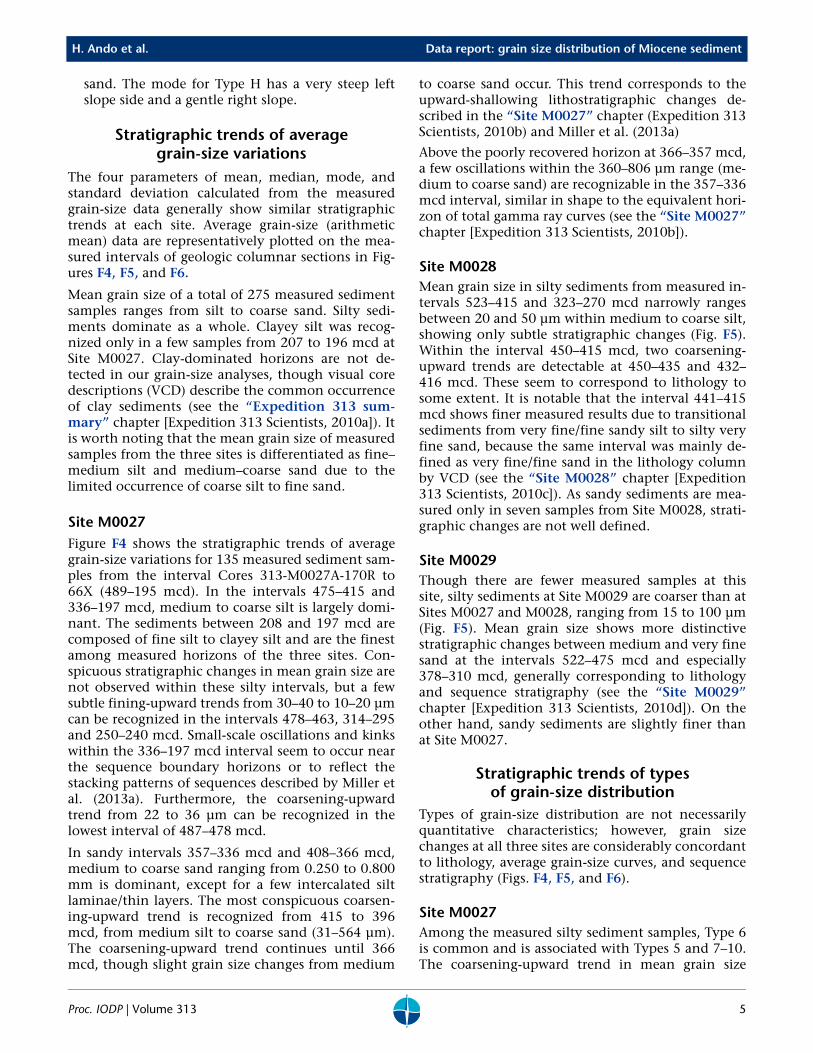
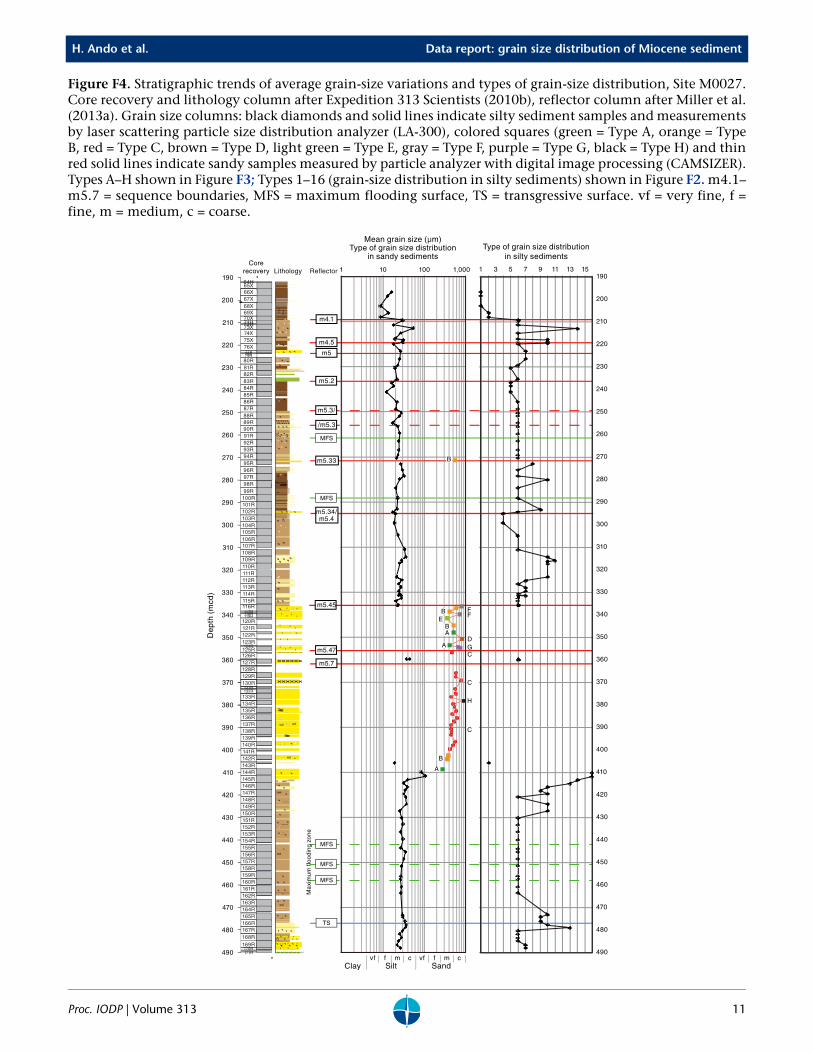
The four parameters of mean, median, mode, andstandard deviation calculated from the measuredgrain-size data generally show similar stratigraphictrends at each site. Average grain-size (arithmeticmean) data are representatively plotted on the mea-sured intervals of geologic columnar sections in Fig-ures F4, F5, and F6.
Mean grain size of a total of 275 measured sedimentsamples ranges from silt to coarse sand. Silty sedi-ments dominate as a whole. Clayey silt was recog-nized only in a few samples from 207 to 196 mcd atSite M0027. Clay-dominated horizons are not de-tected in our grain-size analyses, though visual coredescriptions (VCD) describe the common occurrenceof clay sediments (see the “Expedition 313 sum-mary” chapter [Expedition 313 Scientists, 2010a]). Itis worth noting that the mean grain size of measuredsamples from the three sites is differentiated as fine–medium silt and medium–coarse sand due to thelimited occurrence of coarse silt to fine sand.
Site M0027Figure F4 shows the stratigraphic trends of averagegrain-size variations for 135 measured sediment sam-ples from the interval Cores 313-M0027A-170R to66X (489–195 mcd). In the intervals 475–415 and336–197 mcd, medium to coarse silt is largely domi-nant. The sediments between 208 and 197 mcd arecomposed of fine silt to clayey silt and are the finestamong measured horizons of the three sites. Con-spicuous stratigraphic changes in mean grain size arenot observed within these silty intervals, but a fewsubtle fining-upward trends from 30–40 to 10–20 µmcan be recognized in the intervals 478–463, 314–295and 250–240 mcd. Small-scale oscillations and kinkswithin the 336–197 mcd interval seem to occur nearthe sequence boundary horizons or to reflect thestacking patterns of sequences described by Miller etal. (2013a). Furthermore, the coarsening-upwardtrend from 22 to 36 µm can be recognized in thelowest interval of 487–478 mcd.
In sandy intervals 357–336 mcd and 408–366 mcd,medium to coarse sand ranging from 0.250 to 0.800mm is dominant, except for a few intercalated siltlaminae/thin layers. The most conspicuous coarsen-ing-upward trend is recognized from 415 to 396mcd, from medium silt to coarse sand (31–564 µm).The coarsening-upward trend continues until 366mcd, though slight grain size changes from medium
Proc. IODP | Volume 313
to coarse sand occur. This trend corresponds to theupward-shallowing lithostratigraphic changes de-scribed in the “Site M0027” chapter (Expedition 313Scientists, 2010b) and Miller et al. (2013a)
Above the poorly recovered horizon at 366–357 mcd,a few oscillations within the 360–806 µm range (me-dium to coarse sand) are recognizable in the 357–336mcd interval, similar in shape to the equivalent hori-zon of total gamma ray curves (see the “Site M0027”chapter [Expedition 313 Scientists, 2010b]).
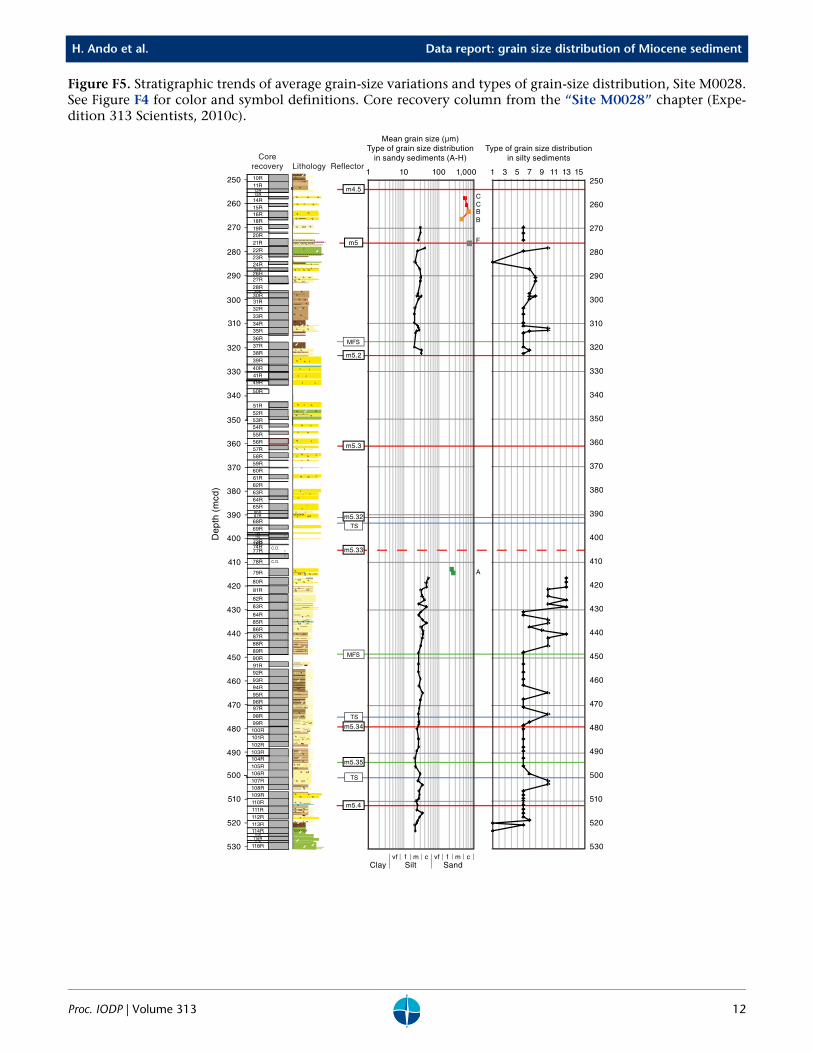
Site M0028Mean grain size in silty sediments from measured in-tervals 523–415 and 323–270 mcd narrowly rangesbetween 20 and 50 µm within medium to coarse silt,showing only subtle stratigraphic changes (Fig. F5).Within the interval 450–415 mcd, two coarsening-upward trends are detectable at 450–435 and 432–416 mcd. These seem to correspond to lithology tosome extent. It is notable that the interval 441–415mcd shows finer measured results due to transitionalsediments from very fine/fine sandy silt to silty veryfine sand, because the same interval was mainly de-fined as very fine/fine sand in the lithology columnby VCD (see the “Site M0028” chapter [Expedition313 Scientists, 2010c]). As sandy sediments are mea-sured only in seven samples from Site M0028, strati-graphic changes are not well defined.
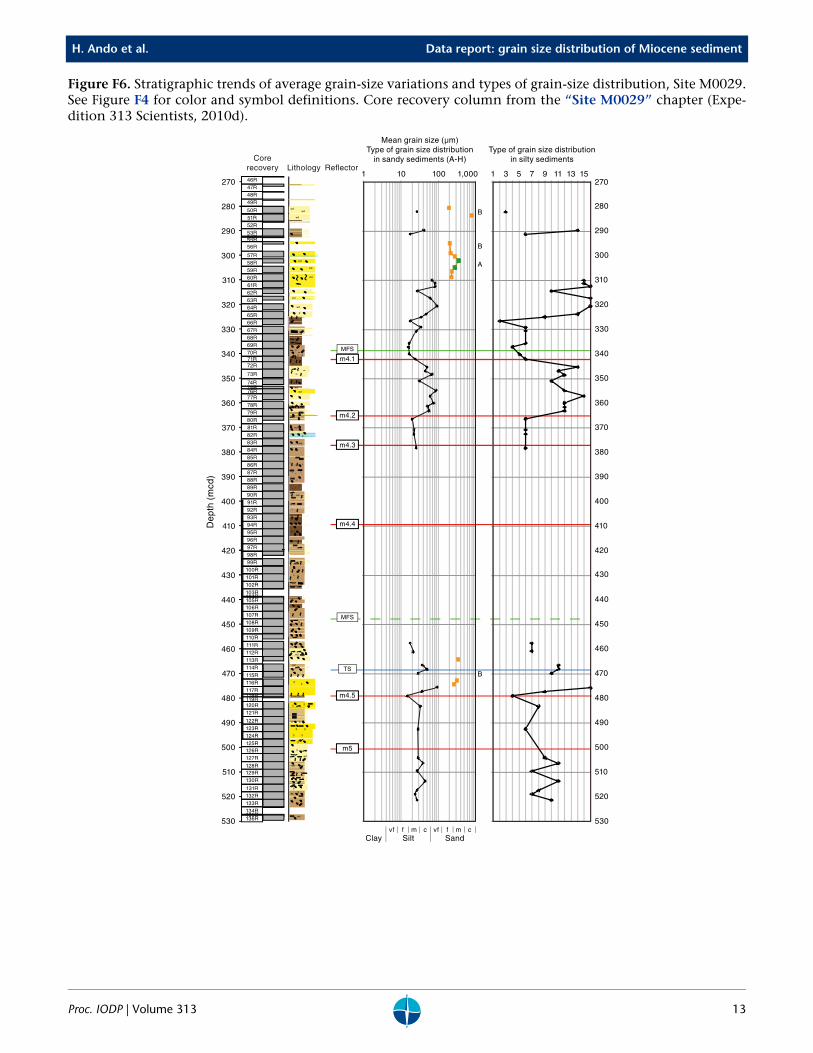
Site M0029Though there are fewer measured samples at thissite, silty sediments at Site M0029 are coarser than atSites M0027 and M0028, ranging from 15 to 100 µm(Fig. F5). Mean grain size shows more distinctivestratigraphic changes between medium and very finesand at the intervals 522–475 mcd and especially378–310 mcd, generally corresponding to lithologyand sequence stratigraphy (see the “Site M0029”chapter [Expedition 313 Scientists, 2010d]). On theother hand, sandy sediments are slightly finer thanat Site M0027.
Stratigraphic trends of types of grain-size distribution
Types of grain-size distribution are not necessarilyquantitative characteristics; however, grain sizechanges at all three sites are considerably concordantto lithology, average grain-size curves, and sequencestratigraphy (Figs. F4, F5, and F6).
Site M0027Among the measured silty sediment samples, Type 6is common and is associated with Types 5 and 7–10.The coarsening-upward trend in mean grain size
5
H. Ando et al. Data report: grain size distribution of Miocene sediment
from 415 to 396 mcd appears to be parallel to thechange from Type 9 to Type 16. Type C is abundantin the sandy sediment interval 409–366 mcd, exceptfor the lowest three samples, which are Types A andB, and for one sample at 378.24 mcd, which is TypeH. In the upper sandy interval 357–336 mcd, fre-quent changes among seven types (A–G) generallyseem to correspond to a few small-scale oscillationsin average grain size, suggesting some relation to theglauconite-bearing lithology (see the “Site M0027”chapter [Expedition 313 Scientists, 2010b]).
Site M0028As silty sediments dominate among the measuredsamples, Type 6 is common and is associated withTypes 7–10 as at Site M0027. In the interval 440–424mcd, the upper part of Sequence m5.34, Type 13 iscommon. The interval 450–415 mcd shows two sub-tle coarsening-upward trends in mean grain size,whereas types of grain-size distributions also changetwice concordantly in general. Seven measuredsandy samples are divided into two samples each ofType A, B, and C and one sample of Type F.
Site M0029Curves of both mean grain size and type of grain-sizedistribution show nearly the same trends, especiallyabove 360 mcd, also broadly corresponding to litho-logy and sequence stratigraphy. Some turnoff pointsin the type of grain-size distribution and mean grainsize in some cases correspond to sequence boundar-ies (e.g., Sequences m4.2 and m.4.1). Therefore, thismeans that both parameters are closely related toeach other.
ConclusionsWe analyzed grain-size distributions of a total of 275sediment samples from unconsolidated Miocenehorizons from three sites (135 samples at SiteM0027, 80 samples at Site M0028, and 60 samples atSite M0029). Their horizons cover approximately theupper half of Sites M0027, M0028, and M0029, rang-ing 293, 177, and 164 m, respectively, a total intervalof 634 m. Mean grain size of measured samples fromthree sites ranges from silt to coarse sand; however, itis differentiated to fine–medium silt and medium–coarse sand due to a limited occurrence of coarse siltto fine sand. Silty sediments dominate as a whole,and clay-dominated sediments were not recognized.Mean grain-size data plotted on the equivalent inter-vals of geologic columnar sections show several stra-tigraphic changes concordantly reflecting lithologyand sequence stratigraphy at all three sites. Grain-size frequency curves of silty sediment samples mea-
Proc. IODP | Volume 313
sured by the laser scattering particle size distributionanalyzer can be divided into 16 types on the basis ofthe mode shape and position, range of grain size,and volume of skewed coarser or finer grain compo-nents. Grain-size frequency curves of sandy sedi-ments measured by particle analyzer with digital im-age processing can be also divided into 8 types.These types of grain-size frequency distributions alsoshow several stratigraphic changes considerably con-cordant to lithology mean grain-size curves and se-quence stratigraphy in general.
AcknowledgmentsWe thank the Integrated Ocean Drilling Program(IODP), ECORD Science Operator (EOS), and BremenCore Repository (BCR) staff for helping and support-ing our sediment sampling. We also thank Dr. Greg-ory S. Mountain and Dr. Jean-Noel Proust and scien-tists of Expedition 313 for giving an opportunity tocontribute this paper to the IODP publication andtheir collaboration during the onshore party and thepostcruise meeting. We appreciate Dr. James V.Browning of Rutgers University for helpful reviews ofthe original manuscript. This research has been fi-nancially supported in part by Japan Drilling EarthScience Consortium (J-DESC) and Japan Agency forMarine-Earth Science and Technology (JAMSTEC).
ReferencesExpedition 313 Scientists, 2010a. Expedition 313 sum-
mary. In Mountain, G., Proust, J.-N., McInroy, D., Cot-terill, C., and the Expedition 313 Scientists, Proc. IODP, 313: Tokyo (Integrated Ocean Drilling Program Manage-ment International, Inc.). doi:10.2204/iodp.proc.313.101.2010
Expedition 313 Scientists, 2010b. Site M0027. In Moun-tain, G., Proust, J.-N., McInroy, D., Cotterill, C., and the Expedition 313 Scientists, Proc. IODP, 313: Tokyo (Inte-grated Ocean Drilling Program Management Interna-tional, Inc.). doi:10.2204/iodp.proc.313.103.2010
Expedition 313 Scientists, 2010c. Site M0028. In Moun-tain, G., Proust, J.-N., McInroy, D., Cotterill, C., and the Expedition 313 Scientists, Proc. IODP, 313: Tokyo (Inte-grated Ocean Drilling Program Management Interna-tional, Inc.). doi:10.2204/iodp.proc.313.104.2010
Expedition 313 Scientists, 2010d. Site M0029. In Moun-tain, G., Proust, J.-N., McInroy, D., Cotterill, C., and the Expedition 313 Scientists, Proc. IODP, 313: Tokyo (Inte-grated Ocean Drilling Program Management Interna-tional, Inc.). doi:10.2204/iodp.proc.313.105.2010
Hoyanagi, K., and Omura, A., 2001. Data report: grain-size analysis of Pleistocene cores from ODP Sites 1071, 1072, and 1073, New Jersey margin. In Christie-Blick, N., Aus-tin, J.A., Jr., and Malone, M.J. (Eds.), Proc. ODP, Sci. Results, 174A: College Station, TX (Ocean Drilling Pro-gram), 1–18. doi:10.2973/odp.proc.sr.174A.159.2002
6
H. Ando et al. Data report: grain size distribution of Miocene sediment
Miller, K.G., Browning, J.V., Mountain, G.S., Bassetti, M.A., Monteverde, D., Katz, M.E., Inwood, J., Lofi, J., and Proust, J.-N., 2013a. Sequence boundaries are imped-ance contrasts: core-seismic-log integration of Oligo-cene–Miocene sequences, New Jersey shallow shelf. Geosphere, 9(5):1257–1285. doi:10.1130/GES00858.1
Miller, K.G., Mountain, G.S., Browning, J.V., Katz, M.E., Monteverde, D., Sugarman, P.J., Ando, H., Bassetti, M.A., Bjerrum, C.J., Hodgson, D., Hesselbo, S., Karakaya, S., Proust, J.-N., and Rabineau, M., 2013b. Testing sequence stratigraphic models by drilling Mio-cene foresets on the New Jersey shallow shelf. Geosphere, 9(5):1236–1256. doi:10.1130/GES00884.1
Proc. IODP | Volume 313
Saito, Y., 1996. Grain-size and sediment-color variations of Pleistocene slope sediments off New Jersey. In Moun-tain, G.S., Miller, K.G., Blum, P., Poag, C.W., and Twichell, D.C. (Eds.), Proc. ODP, Sci. Results, 150: College Station, TX (Ocean Drilling Program), 229–239. doi:10.2973/odp.proc.sr.150.018.1996
Initial receipt: 28 February 2013Acceptance: 21 February 2014Publication: 16 May 2014MS 313-201
7
H. Ando et al. Data report: grain size distribution of Miocene sediment
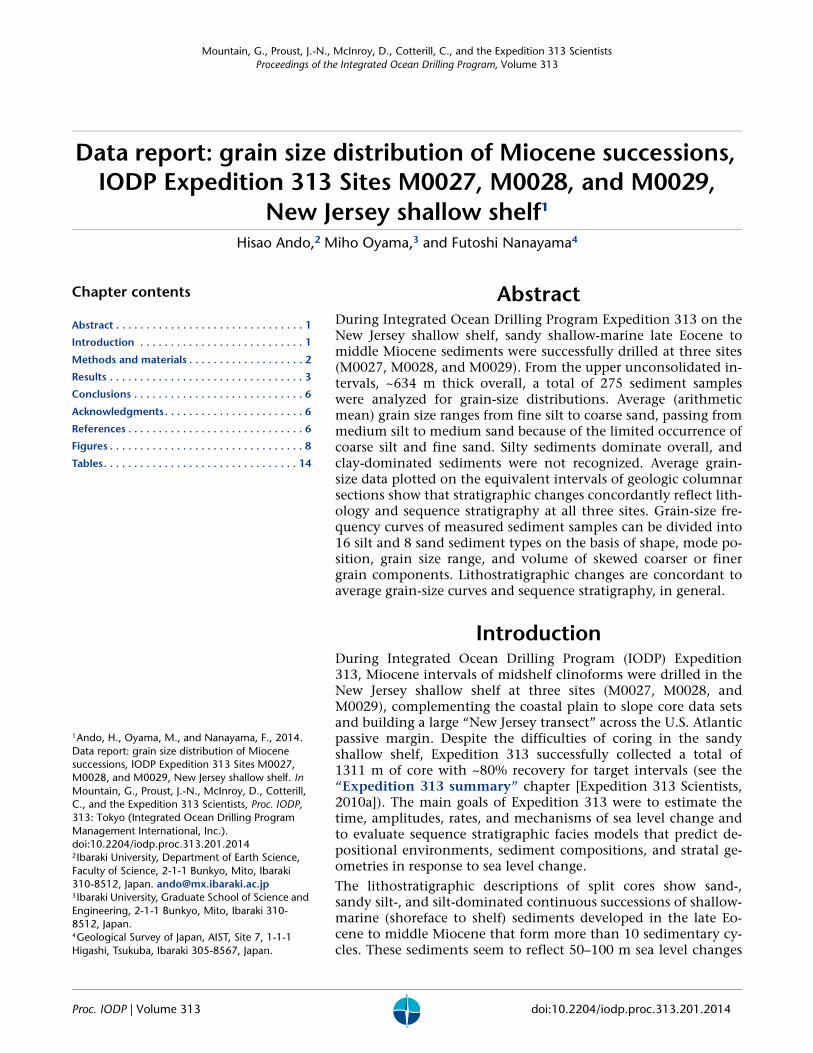
Figure F1. Location of Sites M0027, M0028, and M0029 on the New Jersey continental margin (from Expe-dition 313 Scientists, 2010a). MAT = Mid-Atlantic Transect, ODP = Ocean Drilling Program, DSDP = Deep SeaDrilling Project.
100
200
1000
2000
3000
NewJersey
Long Island
DelmarvaPeninsula
Piedm
ont
Creta
ceou
s out
crop
Cenoz
oic o
utcr
op
Continental shelf
73° 72°76° 75° 74°77°W
40°N
39°
Onshore ODP
Mid-Atlantic transect
AMCOR
DSDP
Oil exploration
Proposed MAT
Seismic profiles
Oc270
CH0698
Ew9009
Drill sites
Offshore ODP
Hole M0027AHole M0028A
Hole M0029A
Atlantic
Cape May
Bass RiverAncora
Millville
Site1071
Site 1072
Site 1073
Beach
View
Island
BeachBethany
Ocean
City
Sea
Site 903 Site 904
Site 905
Site 902
Site 906
Girt
MottFort
Cape MayZoo
Proc. IODP | Volume 313 8
H. Ando et al. Data report: grain size distribution of Miocene sediment
Figure F2. Sixteen types of grain-size frequency histograms and curves recognized in silty sediments, SitesM0027, M0028, and M0029. Left volume axes are somewhat different depending on histograms.
0.1 600 (µm)1 10 1000
6
4
2
0
100
50
0.1 600 (µm)1 10 1000
6
4
2
0
100
50
0.1 600 (µm)1 10 1000
6
4
2
0
100
50
0.1 600 (µm)1 10 100
0
8
4
2
0
100
50
0.1 600 (µm)1 10 100
0
9
6
3
0
100
50
0.1 600 (µm)1 10 1000
7
5
3
0
100
50
0.1 600 (µm)1 10 100
0
6
4
2
0
100
50
0.1 600 (µm)1 10 100
0
5
3
0
100
50
0.1 600 (µm)1 10 1000
100
50
0.1 600 (µm)1 10 100
0
6
4
2
0
100
50
0.1 600 (µm)1 10 100
0
4
2
0
4
2
0
100
50
0.1 600 (µm)1 10 100
0
9
6
3
0
100
50
0.1 600 (µm)1 10 100
0
6
4
2
0
100
50
0.1 600 (µm)1 10 1000
5
3
0
100
50
0.1 600 (µm)1 10 100
0
6
4
2
Vo
lum
e (%
)V
olu
me
(%)
Vo
lum
e (%
)V
olu
me
(%)
Vo
lum
e (%
)V
olu
me
(%)
Vo
lum
e (%
)V
olu
me
(%)
0
100
50
Cum
ulat
ive
volu
me
(%)
Cum
ulat
ive
volu
me
(%)
Cum
ulat
ive
volu
me
(%)
Cum
ulat
ive
volu
me
(%)
Cum
ulat
ive
volu
me
(%)
Cum
ulat
ive
volu
me
(%)
Cum
ulat
ive
volu
me
(%)
Cum
ulat
ive
volu
me
(%)
0.1 600 (µm)1 10 100
0
5
3
Vo
lum
e (%
)V
olu
me
(%)
Vo
lum
e (%
)V
olu
me
(%)
Vo
lum
e (%
)V
olu
me
(%)
Vo
lum
e (%
)V
olu
me
(%)
0
100
50
Cum
ulat
ive
volu
me
(%)
Cum
ulat
ive
volu
me
(%)
Cum
ulat
ive
volu
me
(%)
Cum
ulat
ive
volu
me
(%)
Cum
ulat
ive
volu
me
(%)
Cum
ulat
ive
volu
me
(%)
Cum
ulat
ive
volu
me
(%)
Cum
ulat
ive
volu
me
(%)
A
124R-1 16-18
(353.62 mbsf)
Clay
Ver
y fin
e
Ver
y fin
e
Fin
e
Me
diu
m
Me
diu
m
Fin
e
Coa
rse
Coa
rse
SandSilt Clay
Ver
y fin
e
Ver
y fin
e
Fin
e
Me
diu
m
Me
diu
m
Fin
e
Coa
rse
Coa
rse
SandSilt
Type 1
313-M0027A-67X-2,46-47 cm (198.54 mcd)
Type 2
313-M0027A-69X-2,39-40 cm(205.90 mcd)
Type 3
313-M0029A-50R-2,38-40 cm (282.00 mcd)
Type 4
313-M0027A-102R-2,52-53 cm (294.48 mcd)
Type 5
313-M0027A-81R-2,77-80 cm (230.26 mcd)
Type 6
313-M0027A-86R-2,45-46 cm (245.61 mcd)
Type 7
313-M0028A-29R-1,130-136 cm (297.57 mcd)
Type 8
313-M0028A-30R-1,55-56.5 cm (297.68 mcd)
Type 9
313-M0028A-86R-2,26-27.5 cm (438.54 mcd)
Type 10
313-M0028A-35R-1,40-43 cm (311.92 mcd)
Type 11
313-M0027A-109R-1,60-61 cm (314.41 mcd)
Type 12
313-M0029A-73R-2, 40-42 cm (348.27 mcd)
Type 13
313-M0027A-167R-1,40-41.5 cm (478.91 mcd)
Type 14
313-M0027A-73X-2, 41-43 cm (212.79 mcd)
Type 15
313-M0029A-60R-2, 102-104 cm (310.08 mcd)
Type 16
313-M0027A-145R-1, 45-47 cm (413.36 mcd)
Proc. IODP | Volume 313 9
H. Ando et al. Data report: grain size distribution of Miocene sediment
Figure F3. Eight types of grain-size frequency histograms and curves recognized in sandy sediments, HoleM0027A.
0
20
40
60
80
100
Cum
ulat
ive
volu
me
(%)
0
4
8
12
16
20V
olum
e (%
)
0.01 0.1 1 5
Grain size (mm)
0
20
40
60
80
100
Cum
ulat
ive
volu
me
(%)
0
4
8
12
16
20
Vol
ume
(%)
0.01 0.1 1 5
Grain size (mm)
0
20
40
60
80
100
Cum
ulat
ive
volu
me
(%)
0
4
8
12
16
20
Vol
ume
(%)
0.01 0.1 1 5
Grain size (mm)
0
20
40
60
80
100
Cum
ulat
ive
volu
me
(%)
0
4
8
12
16
20
Vol
ume
(%)
0.01 0.1 1 5
Grain size (mm)
0
20
40
60
80
100
Cum
ulat
ive
volu
me
(%)
0
4
8
12
16
20
Vol
ume
(%)
0.01 0.1 1 5
Grain size (mm)
0
20
40
60
80
100
Cum
ulat
ive
volu
me
(%)
0
4
8
12
16
20
Vol
ume
(%)
0.01 0.1 1 5
Grain size (mm)
0
20
40
60
80
100
Cum
ulat
ive
volu
me
(%)
0
4
8
12
16
20
Vol
ume
(%)
0.01 0.1 510
20
40
60
80
100
Cum
ulat
ive
volu
me
(%)
0
4
8
12
16
20
Vol
ume
(%)
0.01 0.1 1 5Veryfine
GranuleMedium Verycoarse
Fine Coarse Pebble
GravelSandSilt GravelVeryfine
GranuleMedium Verycoarse
Fine Coarse Pebble
SandSilt
Type A
313-M0027A-124R-1, 16-18 cm (353.62 mcd)
Type B
313-M0027A-142R-2, 42-44 cm(404.18 mcd)
Type C
313-M0027A-129R-1, 40-42 cm (366.06 mcd)
Type D
313-M0027A-123R-1, 40-42 cm (350.81 mcd)
Type E
313-M0027A-120R-1, 37-39 cm (341.63 mcd)
Type F
313-M0027A-116R-1, 118-119.5 cm (336.34 mcd)
Type G
313-M0027A-125R-1, 33-35 cm (354.46 mcd)
Type H
313-M0027A-134R-1, 38-40 cm (378.24 mcd)
Proc. IODP | Volume 313 10
H. Ando et al. Data report: grain size distribution of Miocene sediment
Figure F4. Stratigraphic trends of average grain-size variations and types of grain-size distribution, Site M0027.Core recovery and lithology column after Expedition 313 Scientists (2010b), reflector column after Miller et al.(2013a). Grain size columns: black diamonds and solid lines indicate silty sediment samples and measurementsby laser scattering particle size distribution analyzer (LA-300), colored squares (green = Type A, orange = TypeB, red = Type C, brown = Type D, light green = Type E, gray = Type F, purple = Type G, black = Type H) and thinred solid lines indicate sandy samples measured by particle analyzer with digital image processing (CAMSIZER).Types A–H shown in Figure F3; Types 1–16 (grain-size distribution in silty sediments) shown in Figure F2. m4.1–m5.7 = sequence boundaries, MFS = maximum flooding surface, TS = transgressive surface. vf = very fine, f =fine, m = medium, c = coarse.
g g
XXXXXXX
g
g gg g
XXXXXX
XXXXXX
wd
g
g g
wd
wd
wd
wd
g gg
g g
g g
g gg
De
pth
(mcd
)
gg
* * *
XXXXXX
XXXXXX
XXXXXX
g g
g gg g
g
g g
g g
g
g
g gg g
Lithology
480
490
390
400
410
420
430
440
450
460
470
360
370
380
280
290
300
310
320
330
340
350
270
200
210
220
230
240
250
260
190
480
490
390
400
410
420
430
440
450
460
470
360
370
380
280
290
300
310
320
330
340
350
270
200
210
220
230
240
250
260
190
Corerecovery Reflector
Ma
xim
um fl
oodi
ng z
one
m4.5
m4.1
m5
m5.2
m5.3/
/m5.3
m5.34/m5.4
m5.7
MFS
TS
m5.33
m5.45
m5.47
MFS
MFS
MFS
MFS
1 10 100 1,000
vf m cf cSandSiltClay
vf mf
F
G
F
B
B
D
BE
H
B
A
A
A
C
C
C
Mean grain size (µm)Type of grain size distribution
in sandy sediments
1 3 5 7 9 11 13 15
Type of grain size distributionin silty sediments
127R128R129R130R131R132R
133R134R135R136R137R138R139R140R141R142R143R144R145R146R147R148R149R150R151R152R153R154R155R156R157R158R159R160R161R162R163R164R165R166R
169R170R
66X67X68X69X70X
73X74X75X76X77X78X
64H65X
168R
171R
71H72H
79R80R81R82R83R84R85R86R87R88R89R90R91R92R93R94R95R96R97R98R99R100R101R102R103R104R105R106R107R108R109R110R111R112R113R114R115R116R117R118R119R
120R121R122R123R124R
125R126R
167R
Proc. IODP | Volume 313 11
H. Ando et al. Data report: grain size distribution of Miocene sediment
Figure F5. Stratigraphic trends of average grain-size variations and types of grain-size distribution, Site M0028.See Figure F4 for color and symbol definitions. Core recovery column from the “Site M0028” chapter (Expe-dition 313 Scientists, 2010c).
Lithology
wd
wd
wd
wd
wd
wd
g
g g
wd gg
XXXXXX
g
wd
xxxxxxxxxxxxxxxx
xxxxxxxxxxxxxxxxxxxxxxxxxxxxxxxx
g g
p
xxx xxxx xxxxxxxxxxxxxxxxxxxxx
xxxxxxxxxxxxxxxxxxxxxxxxxxxxxxxx
gxxxxxxxxxxxxxxxx xxxxxxxxxxxxxxxxxxxxxx
xxxxxxxxxxxxxxxx xxxxxxgg wd
wd
wd
wd
g
g
gg
g
g
gg
gg
gg
g g
g
g
g
g
gg
g
g
g
gg
g
g
g
xxxxxxxg wd
wd
wd
wd
wd
wd
wd
x
wd
wd
wd
wd
wd
wd
wdwd
wd
250
260
270
280
290
300
310
320
330
340
350
360
370
380
390
400
410
420
430
440
450
460
470
480
490
500
510
520
530
Reflector
SandSiltClayvf m cf c vf mf
m4.5
m5
m5.2
m5.3
m5.32
m5.33
m5.34
m5.35
m5.4
MFS
MFS
TS
TS
TS
Corerecovery
?
?
?
C.D.
C.D.
Dep
th (
mcd
)
250
260
270
280
290
300
310
320
330
340
350
360
370
380
390
400
410
420
430
440
450
460
470
480
490
500
510
520
530
10R11R12R13R
14R15R16R18R19R20R21R22R23R24R25R26R27R28R29R30R31R32R33R34R35R36R37R38R39R
40R41R49R
50R
51R52R53R54R55R56R57R58R59R60R61R62R63R64R65R66R67R
68R69R
70R71R72R
73R74R76R77R
78R
79R
80R
81R
82R
83R
84R85R86R87R88R89R90R91R92R93R94R95R96R97R98R99R100R101R102R103R104R105R106R107R108R109R110R111R112R113R114R
115R
116R117R
118R
1 10 100 1,000
Mean grain size (µm)Type of grain size distribution
in sandy sediments (A-H)
CCB
A
B
F
Type of grain size distributionin silty sediments
1 3 5 7 9 11 13 15
Proc. IODP | Volume 313 12
H. Ando et al. Data report: grain size distribution of Miocene sediment
Figure F6. Stratigraphic trends of average grain-size variations and types of grain-size distribution, Site M0029.See Figure F4 for color and symbol definitions. Core recovery column from the “Site M0029” chapter (Expe-dition 313 Scientists, 2010d).
Dep
th (
mcd
)
430
420
410
400
390
380
370
360
350
340
330
320
310
300
290
280
270
530
520
510
500
490
480
470
460
450
440
Lithology
wdwd
wd
xxxxxxxx
wd
wd
wd
wd
wd
p
p
p
g g
g
wd
wd
wd
g
wd
XX X
X Xp
p
X XXp
wd
X
XX
g
x
wdwd
wd
x
gg
wd
wd
gg
xxxxxxxxxx
g g
g g
g g
g g
g
g
wd
wd
g
gg
wd
Corerecovery
430
420
410
400
390
380
370
360
350
340
330
320
310
300
290
280
270
530
520
510
500
490
480
470
460
450
440
50R51R52R53R54R55R56R
57R58R59R60R61R62R63R64R65R66R67R68R69R70R71R72R
73R
74R75R76R77R78R79R80R81R82R83R84R85R86R87R88R89R90R91R92R93R94R95R96R97R98R99R100R
46R47R48R49R
101R102R103R104R105R106R107R108R109R110R111R112R113R114R115R116R117R118R119R120R121R
122R123R124R125R126R127R
128R129R130R
131R132R133R134R135R136R
Reflector
vf m cf c vf mf
m4.1
m4.2
m4.3
m4.4
m4.5
m5
MFS
TS
MFS
Mean grain size (µm)Type of grain size distribution
in sandy sediments (A-H)
1 10 100 1,000
A
B
B
B
Type of grain size distributionin silty sediments
1 3 5 7 9 11 13 15
Proc. IODP | Volume 313 13
SandSiltClay
H. Ando et al. Data report: grain size distribution of Miocene sediment
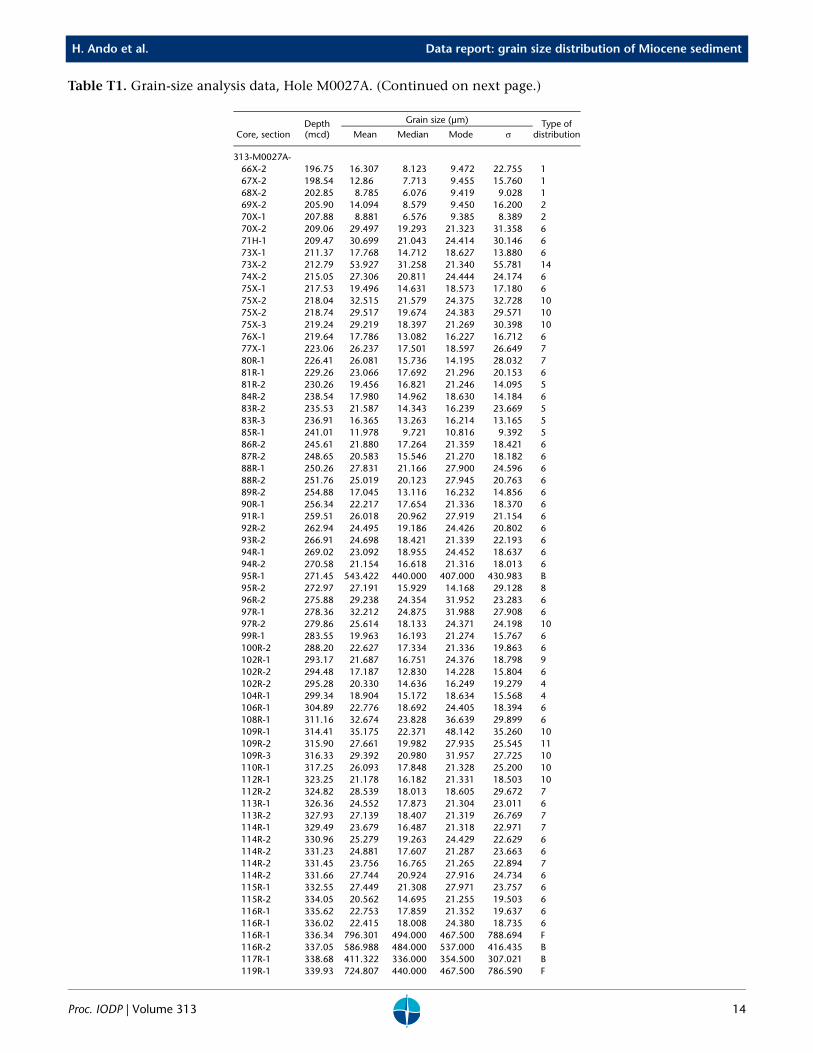
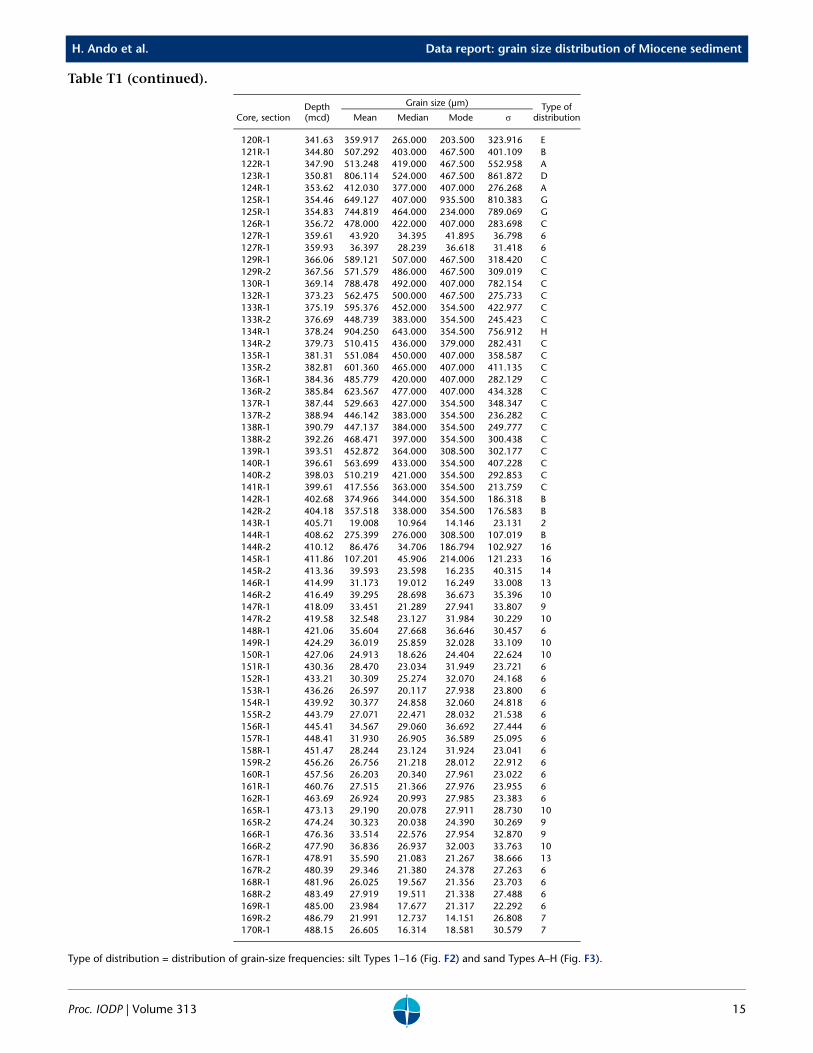
Table T1. Grain-size analysis data, Hole M0027A. (Continued on next page.)
Core, sectionDepth (mcd)
Grain size (µm) Type of distributionMean Median Mode σ
313-M0027A-66X-2 196.75 16.307 8.123 9.472 22.755 1 67X-2 198.54 12.86 7.713 9.455 15.760 1 68X-2 202.85 8.785 6.076 9.419 9.028 1 69X-2 205.90 14.094 8.579 9.450 16.200 2 70X-1 207.88 8.881 6.576 9.385 8.389 2 70X-2 209.06 29.497 19.293 21.323 31.358 6 71H-1 209.47 30.699 21.043 24.414 30.146 6 73X-1 211.37 17.768 14.712 18.627 13.880 6 73X-2 212.79 53.927 31.258 21.340 55.781 14 74X-2 215.05 27.306 20.811 24.444 24.174 6 75X-1 217.53 19.496 14.631 18.573 17.180 6 75X-2 218.04 32.515 21.579 24.375 32.728 10 75X-2 218.74 29.517 19.674 24.383 29.571 10 75X-3 219.24 29.219 18.397 21.269 30.398 10 76X-1 219.64 17.786 13.082 16.227 16.712 6 77X-1 223.06 26.237 17.501 18.597 26.649 7 80R-1 226.41 26.081 15.736 14.195 28.032 7 81R-1 229.26 23.066 17.692 21.296 20.153 6 81R-2 230.26 19.456 16.821 21.246 14.095 5 84R-2 238.54 17.980 14.962 18.630 14.184 6 83R-2 235.53 21.587 14.343 16.239 23.669 5 83R-3 236.91 16.365 13.263 16.214 13.165 5 85R-1 241.01 11.978 9.721 10.816 9.392 5 86R-2 245.61 21.880 17.264 21.359 18.421 6 87R-2 248.65 20.583 15.546 21.270 18.182 6 88R-1 250.26 27.831 21.166 27.900 24.596 6 88R-2 251.76 25.019 20.123 27.945 20.763 6 89R-2 254.88 17.045 13.116 16.232 14.856 6 90R-1 256.34 22.217 17.654 21.336 18.370 6 91R-1 259.51 26.018 20.962 27.919 21.154 6 92R-2 262.94 24.495 19.186 24.426 20.802 6 93R-2 266.91 24.698 18.421 21.339 22.193 6 94R-1 269.02 23.092 18.955 24.452 18.637 6 94R-2 270.58 21.154 16.618 21.316 18.013 6 95R-1 271.45 543.422 440.000 407.000 430.983 B95R-2 272.97 27.191 15.929 14.168 29.128 8 96R-2 275.88 29.238 24.354 31.952 23.283 6 97R-1 278.36 32.212 24.875 31.988 27.908 6 97R-2 279.86 25.614 18.133 24.371 24.198 10 99R-1 283.55 19.963 16.193 21.274 15.767 6 100R-2 288.20 22.627 17.334 21.336 19.863 6 102R-1 293.17 21.687 16.751 24.376 18.798 9 102R-2 294.48 17.187 12.830 14.228 15.804 6 102R-2 295.28 20.330 14.636 16.249 19.279 4 104R-1 299.34 18.904 15.172 18.634 15.568 4 106R-1 304.89 22.776 18.692 24.405 18.394 6 108R-1 311.16 32.674 23.828 36.639 29.899 6 109R-1 314.41 35.175 22.371 48.142 35.260 10 109R-2 315.90 27.661 19.982 27.935 25.545 11 109R-3 316.33 29.392 20.980 31.957 27.725 10 110R-1 317.25 26.093 17.848 21.328 25.200 10 112R-1 323.25 21.178 16.182 21.331 18.503 10 112R-2 324.82 28.539 18.013 18.605 29.672 7 113R-1 326.36 24.552 17.873 21.304 23.011 6 113R-2 327.93 27.139 18.407 21.319 26.769 7 114R-1 329.49 23.679 16.487 21.318 22.971 7 114R-2 330.96 25.279 19.263 24.429 22.629 6 114R-2 331.23 24.881 17.607 21.287 23.663 6 114R-2 331.45 23.756 16.765 21.265 22.894 7 114R-2 331.66 27.744 20.924 27.916 24.734 6 115R-1 332.55 27.449 21.308 27.971 23.757 6 115R-2 334.05 20.562 14.695 21.255 19.503 6 116R-1 335.62 22.753 17.859 21.352 19.637 6 116R-1 336.02 22.415 18.008 24.380 18.735 6 116R-1 336.34 796.301 494.000 467.500 788.694 F116R-2 337.05 586.988 484.000 537.000 416.435 B117R-1 338.68 411.322 336.000 354.500 307.021 B119R-1 339.93 724.807 440.000 467.500 786.590 F
Proc. IODP | Volume 313 14
H. Ando et al. Data report: grain size distribution of Miocene sediment
Type of distribution = distribution of grain-size frequencies: silt Types 1–16 (Fig. F2) and sand Types A–H (Fig. F3).
120R-1 341.63 359.917 265.000 203.500 323.916 E121R-1 344.80 507.292 403.000 467.500 401.109 B122R-1 347.90 513.248 419.000 467.500 552.958 A123R-1 350.81 806.114 524.000 467.500 861.872 D124R-1 353.62 412.030 377.000 407.000 276.268 A125R-1 354.46 649.127 407.000 935.500 810.383 G125R-1 354.83 744.819 464.000 234.000 789.069 G126R-1 356.72 478.000 422.000 407.000 283.698 C127R-1 359.61 43.920 34.395 41.895 36.798 6 127R-1 359.93 36.397 28.239 36.618 31.418 6 129R-1 366.06 589.121 507.000 467.500 318.420 C129R-2 367.56 571.579 486.000 467.500 309.019 C130R-1 369.14 788.478 492.000 407.000 782.154 C132R-1 373.23 562.475 500.000 467.500 275.733 C133R-1 375.19 595.376 452.000 354.500 422.977 C133R-2 376.69 448.739 383.000 354.500 245.423 C134R-1 378.24 904.250 643.000 354.500 756.912 H134R-2 379.73 510.415 436.000 379.000 282.431 C135R-1 381.31 551.084 450.000 407.000 358.587 C135R-2 382.81 601.360 465.000 407.000 411.135 C136R-1 384.36 485.779 420.000 407.000 282.129 C136R-2 385.84 623.567 477.000 407.000 434.328 C137R-1 387.44 529.663 427.000 354.500 348.347 C137R-2 388.94 446.142 383.000 354.500 236.282 C138R-1 390.79 447.137 384.000 354.500 249.777 C138R-2 392.26 468.471 397.000 354.500 300.438 C139R-1 393.51 452.872 364.000 308.500 302.177 C140R-1 396.61 563.699 433.000 354.500 407.228 C140R-2 398.03 510.219 421.000 354.500 292.853 C141R-1 399.61 417.556 363.000 354.500 213.759 C142R-1 402.68 374.966 344.000 354.500 186.318 B142R-2 404.18 357.518 338.000 354.500 176.583 B143R-1 405.71 19.008 10.964 14.146 23.131 2 144R-1 408.62 275.399 276.000 308.500 107.019 B144R-2 410.12 86.476 34.706 186.794 102.927 16 145R-1 411.86 107.201 45.906 214.006 121.233 16 145R-2 413.36 39.593 23.598 16.235 40.315 14 146R-1 414.99 31.173 19.012 16.249 33.008 13 146R-2 416.49 39.295 28.698 36.673 35.396 10 147R-1 418.09 33.451 21.289 27.941 33.807 9 147R-2 419.58 32.548 23.127 31.984 30.229 10 148R-1 421.06 35.604 27.668 36.646 30.457 6 149R-1 424.29 36.019 25.859 32.028 33.109 10 150R-1 427.06 24.913 18.626 24.404 22.624 10 151R-1 430.36 28.470 23.034 31.949 23.721 6 152R-1 433.21 30.309 25.274 32.070 24.168 6 153R-1 436.26 26.597 20.117 27.938 23.800 6 154R-1 439.92 30.377 24.858 32.060 24.818 6 155R-2 443.79 27.071 22.471 28.032 21.538 6 156R-1 445.41 34.567 29.060 36.692 27.444 6 157R-1 448.41 31.930 26.905 36.589 25.095 6 158R-1 451.47 28.244 23.124 31.924 23.041 6 159R-2 456.26 26.756 21.218 28.012 22.912 6 160R-1 457.56 26.203 20.340 27.961 23.022 6 161R-1 460.76 27.515 21.366 27.976 23.955 6 162R-1 463.69 26.924 20.993 27.985 23.383 6 165R-1 473.13 29.190 20.078 27.911 28.730 10 165R-2 474.24 30.323 20.038 24.390 30.269 9 166R-1 476.36 33.514 22.576 27.954 32.870 9 166R-2 477.90 36.836 26.937 32.003 33.763 10 167R-1 478.91 35.590 21.083 21.267 38.666 13 167R-2 480.39 29.346 21.380 24.378 27.263 6 168R-1 481.96 26.025 19.567 21.356 23.703 6 168R-2 483.49 27.919 19.511 21.338 27.488 6 169R-1 485.00 23.984 17.677 21.317 22.292 6 169R-2 486.79 21.991 12.737 14.151 26.808 7 170R-1 488.15 26.605 16.314 18.581 30.579 7
Core, sectionDepth (mcd)
Grain size (µm) Type of distributionMean Median Mode σ
Table T1 (continued).
Proc. IODP | Volume 313 15
H. Ando et al. Data report: grain size distribution of Miocene sediment
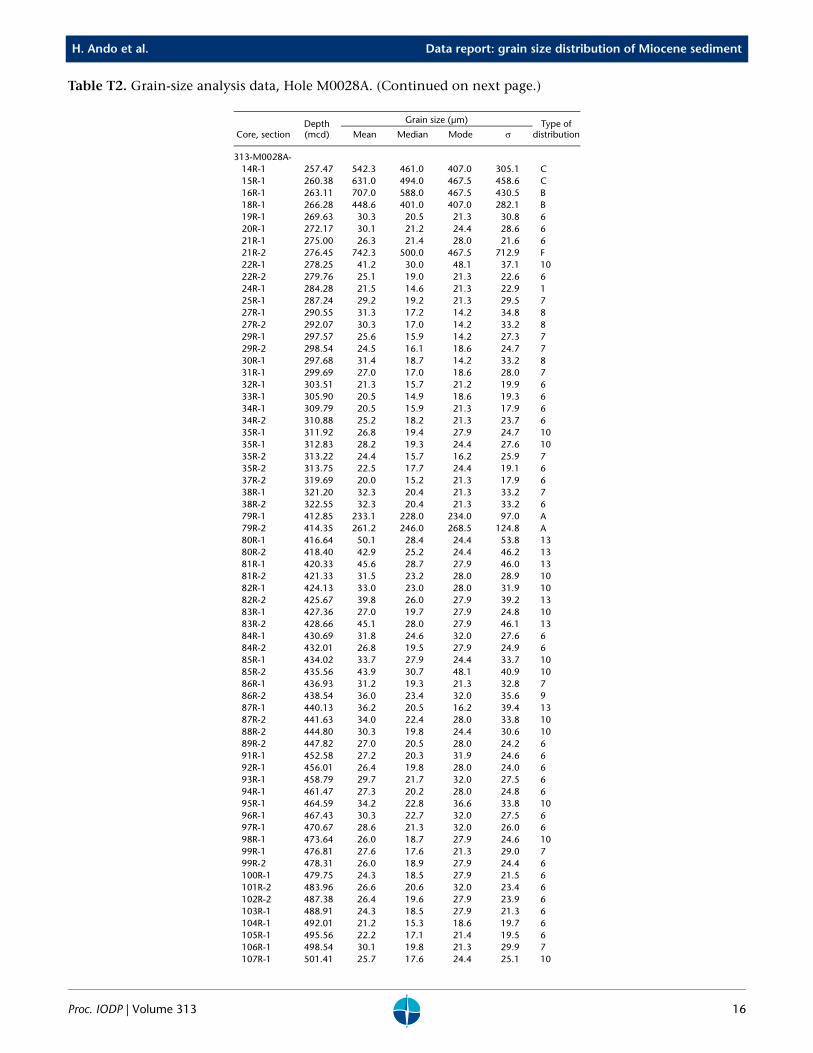
Table T2. Grain-size analysis data, Hole M0028A. (Continued on next page.)
Core, sectionDepth (mcd)
Grain size (µm) Type of distributionMean Median Mode σ
313-M0028A-14R-1 257.47 542.3 461.0 407.0 305.1 C15R-1 260.38 631.0 494.0 467.5 458.6 C16R-1 263.11 707.0 588.0 467.5 430.5 B18R-1 266.28 448.6 401.0 407.0 282.1 B19R-1 269.63 30.3 20.5 21.3 30.8 620R-1 272.17 30.1 21.2 24.4 28.6 621R-1 275.00 26.3 21.4 28.0 21.6 621R-2 276.45 742.3 500.0 467.5 712.9 F22R-1 278.25 41.2 30.0 48.1 37.1 1022R-2 279.76 25.1 19.0 21.3 22.6 624R-1 284.28 21.5 14.6 21.3 22.9 125R-1 287.24 29.2 19.2 21.3 29.5 727R-1 290.55 31.3 17.2 14.2 34.8 827R-2 292.07 30.3 17.0 14.2 33.2 829R-1 297.57 25.6 15.9 14.2 27.3 729R-2 298.54 24.5 16.1 18.6 24.7 730R-1 297.68 31.4 18.7 14.2 33.2 831R-1 299.69 27.0 17.0 18.6 28.0 732R-1 303.51 21.3 15.7 21.2 19.9 633R-1 305.90 20.5 14.9 18.6 19.3 634R-1 309.79 20.5 15.9 21.3 17.9 634R-2 310.88 25.2 18.2 21.3 23.7 635R-1 311.92 26.8 19.4 27.9 24.7 1035R-1 312.83 28.2 19.3 24.4 27.6 1035R-2 313.22 24.4 15.7 16.2 25.9 735R-2 313.75 22.5 17.7 24.4 19.1 637R-2 319.69 20.0 15.2 21.3 17.9 638R-1 321.20 32.3 20.4 21.3 33.2 738R-2 322.55 32.3 20.4 21.3 33.2 679R-1 412.85 233.1 228.0 234.0 97.0 A79R-2 414.35 261.2 246.0 268.5 124.8 A80R-1 416.64 50.1 28.4 24.4 53.8 1380R-2 418.40 42.9 25.2 24.4 46.2 1381R-1 420.33 45.6 28.7 27.9 46.0 1381R-2 421.33 31.5 23.2 28.0 28.9 1082R-1 424.13 33.0 23.0 28.0 31.9 1082R-2 425.67 39.8 26.0 27.9 39.2 1383R-1 427.36 27.0 19.7 27.9 24.8 1083R-2 428.66 45.1 28.0 27.9 46.1 1384R-1 430.69 31.8 24.6 32.0 27.6 684R-2 432.01 26.8 19.5 27.9 24.9 685R-1 434.02 33.7 27.9 24.4 33.7 1085R-2 435.56 43.9 30.7 48.1 40.9 1086R-1 436.93 31.2 19.3 21.3 32.8 786R-2 438.54 36.0 23.4 32.0 35.6 987R-1 440.13 36.2 20.5 16.2 39.4 1387R-2 441.63 34.0 22.4 28.0 33.8 1088R-2 444.80 30.3 19.8 24.4 30.6 1089R-2 447.82 27.0 20.5 28.0 24.2 691R-1 452.58 27.2 20.3 31.9 24.6 692R-1 456.01 26.4 19.8 28.0 24.0 693R-1 458.79 29.7 21.7 32.0 27.5 694R-1 461.47 27.3 20.2 28.0 24.8 695R-1 464.59 34.2 22.8 36.6 33.8 1096R-1 467.43 30.3 22.7 32.0 27.5 697R-1 470.67 28.6 21.3 32.0 26.0 698R-1 473.64 26.0 18.7 27.9 24.6 1099R-1 476.81 27.6 17.6 21.3 29.0 799R-2 478.31 26.0 18.9 27.9 24.4 6100R-1 479.75 24.3 18.5 27.9 21.5 6101R-2 483.96 26.6 20.6 32.0 23.4 6102R-2 487.38 26.4 19.6 27.9 23.9 6103R-1 488.91 24.3 18.5 27.9 21.3 6104R-1 492.01 21.2 15.3 18.6 19.7 6105R-1 495.56 22.2 17.1 21.4 19.5 6106R-1 498.54 30.1 19.8 21.3 29.9 7107R-1 501.41 25.7 17.6 24.4 25.1 10
Proc. IODP | Volume 313 16
H. Ando et al. Data report: grain size distribution of Miocene sediment
Type of distribution = distribution of grain-size frequencies: silt Types 1–16 (Fig. F2) and sand Types A–H (Fig. F3).
107R-2 503.03 34.4 23.7 36.7 33.2 10108R-2 505.53 27.3 20.3 28.0 25.0 6109R-1 507.34 28.0 21.1 24.4 25.6 6109R-2 508.87 25.9 20.9 24.4 21.7 6110R-1 509.99 23.3 18.4 21.4 19.7 6110R-2 511.51 24.6 17.2 18.6 24.8 6111R-1 513.52 24.3 19.8 24.4 19.8 6111R-2 515.04 34.0 23.9 24.5 32.5 6112R-1 516.62 29.1 20.2 21.3 28.8 6112R-2 518.02 25.1 14.4 14.2 29.3 7113R-1 519.27 24.0 14.9 16.3 27.6 1113R-1 520.02 21.3 16.7 24.3 18.4 6114R-1 522.45 21.7 15.3 21.3 22.2 1
Core, sectionDepth (mcd)
Grain size (µm) Type of distributionMean Median Mode σ
Table T2 (continued).
Proc. IODP | Volume 313 17
H. Ando et al. Data report: grain size distribution of Miocene sediment
Table T3. Grain-size analysis data, Hole M0029A.
Type of distribution = distribution of grain-size frequencies: silt Types 1–16 (Fig. F2) and sand Types A–H (Fig. F3).
Core, sectionDepth (mcd)
Grain size (µm) Type of distributionMean Median Mode σ
313-M0029A-50R-1 280.49 193.9 185.0 203.5 66.7 B50R-2 282.00 27.2 11.8 9.5 36.7 3 51R-1 283.61 785.9 180.0 177.0 2003.2 B53R-1 289.64 40.8 22.9 16.2 42.6 14 53R-2 291.14 18.0 13.8 16.2 16.3 6 56R-1 294.95 203.4 175.0 154.5 119.1 B57R-1 298.80 213.1 191.0 190.3 102.8 B57R-2 300.14 280.5 266.0 268.5 114.1 B58R-1 301.91 347.8 264.0 268.5 475.5 A59R-1 304.90 280.2 272.0 308.5 103.4 A59R-2 306.42 234.7 200.0 190.3 129.2 B60R-1 308.58 227.0 179.0 177.0 247.4 B60R-2 310.08 66.1 44.3 108.4 65.5 15 61R-1 311.06 79.9 53.5 124.3 80.9 15 61R-2 312.56 81.8 44.1 142.5 88.4 16 62R-1 314.11 27.3 18.4 21.3 27.7 10 63R-1 317.18 61.4 31.6 124.3 66.5 16 64R-1 320.36 95.6 42.7 186.7 109.6 16 65R-1 323.58 47.2 27.2 18.6 48.7 14 65R-2 324.96 34.7 22.8 24.4 34.5 9 66R-1 326.49 17.1 12.4 16.2 16.1 2 67R-1 329.22 34.2 26.4 41.9 29.9 6 67R-2 330.76 24.7 19.5 27.9 20.9 6 69R-1 335.59 16.7 12.3 16.2 15.4 6 69R-2 336.95 16.0 12.2 16.2 13.8 4 70R-2 340.09 16.9 13.4 18.6 14.2 5 71R-1 341.89 23.4 18.2 24.4 20.3 6 72R-2 345.16 50.3 28.1 21.3 54.1 14 73R-1 346.77 44.7 30.4 63.2 42.5 11 73R-2 348.27 67.4 58.8 72.4 51.9 12 74R-1 350.69 30.3 22.5 32.0 27.6 10 76R-1 354.73 87.7 78.1 108.2 70.3 12 77R-1 356.81 60.7 42.8 94.5 58.3 15 78R-1 359.86 74.0 65.0 82.9 57.6 12 78R-2 361.39 51.8 42.6 63.1 43.1 12 79R-1 363.06 55.3 45.3 72.0 47.1 12 80R-1 366.25 20.0 13.9 16.2 19.8 6 81R-2 370.68 22.5 15.4 21.3 22.5 6 82R-1 372.60 22.4 15.6 18.6 22.2 6 84R-1 378.10 26.0 20.5 27.9 22.6 6 111R-1 457.65 17.9 11.5 10.8 19.2 7 112R-1 460.97 21.9 13.7 14.2 23.4 7 113R-1 464.15 344.7 293.0 268.5 204.6 B114R-1 466.69 38.0 24.0 55.0 37.5 11 114R-2 468.19 50.1 32.2 72.4 49.5 11 115R-1 469.73 28.1 18.9 21.3 28.2 10 116R-1 472.71 314.1 279.0 268.5 161.8 B116R-2 474.21 266.2 241.0 234.0 134.7 B117R-1 475.61 95.0 29.5 214.6 120.1 16 117R-2 477.11 36.5 23.5 28.0 36.7 9 118R-1 478.78 14.8 10.1 10.8 16.5 4 120R-2 483.29 33.4 19.5 14.2 35.4 8 123R-2 492.56 28.2 18.9 21.3 29.1 6 127R-2 504.06 29.3 18.2 16.2 30.2 9 128R-1 506.41 38.5 24.7 55.1 37.6 11 129R-1 509.57 27.5 18.7 24.4 26.9 7 130R-2 513.68 45.6 26.2 82.6 47.3 11 131R-2 517.30 27.2 15.5 14.2 29.9 8 132R-1 519.09 24.3 14.4 14.2 26.8 7 133R-1 521.42 26.8 17.7 27.9 27.2 10
Proc. IODP | Volume 313 18
H. Ando et al. Data report: grain size distribution of Miocene sediment
Table T4. Distribution of grain-size frequency types, Sites M0027, M0028, and M0029.
Type
Site M0027 Site M0028 Site M0029 Sites M0027−M0029
Count % Count % Count % Subtotal %
1 3 3.0 3 4.1 0 0.0 6 2.7 2 3 3.0 0 0.0 1 2.1 4 1.8 3 0 0.0 0 0.0 1 2.1 1 0.5 4 2 2.0 0 0.0 2 4.2 4 1.8 5 4 4.0 0 0.0 1 2.1 5 2.3 6 53 53.5 36 49.3 10 20.8 99 45.0 7 8 8.1 10 13.7 4 8.3 22 10.0 8 1 1.0 3 4.1 2 4.2 6 2.7 9 4 4.0 1 1.4 3 6.3 8 3.6 10 14 14.1 14 19.2 4 8.3 32 14.5 11 1 1.0 0 0.0 5 10.4 6 2.7 12 0 0.0 0 0.0 5 10.4 5 2.3 13 2 2.0 6 8.2 0 0.0 8 3.6 14 2 2.0 0 0.0 3 6.3 5 2.3 15 0 0.0 0 0.0 3 6.3 3 1.4 16 2 2.0 0 0.0 4 8.3 6 2.7 Subtotal: 99 73 48 220
A 2 5.6 2 28.6 2 16.7 6 10.9 B 7 19.4 2 28.6 10 83.3 19 34.5 C 20 55.6 2 28.6 0.0 22 40.0 D 1 2.8 0.0 0.0 1 1.8 E 1 2.8 0.0 0.0 1 1.8 F 2 5.6 1 14.3 0.0 3 5.5 G 2 5.6 0.0 0.0 2 3.6 H 1 2.8 0.0 0.0 1 1.8 Subtotal: 36 7 12 55
Total: 135 80 60 275
Proc. IODP | Volume 313 19