Embed Size (px)
Citation preview
DATA REPORT: NETWORK CRASH EDITIONSeptember 2016
© Apteligent 2016
INTRODUCTIONIn this report we analyze mobile app crashes during interactions with cloud services. We
compare the failure rates on iOS and Android, dive into which App Store categories are the
most affected by networking issues, and most importantly analyze why these issues occur
at such an alarming rate in the first place!
Network Crash /ˈnɛtwərk kræʃ / A crash in a mobile app caused by a network call. For example, an app communicating with
a cloud service may return bad data, result in an error, take too long for the request to
complete, or simply fail to respond at all.
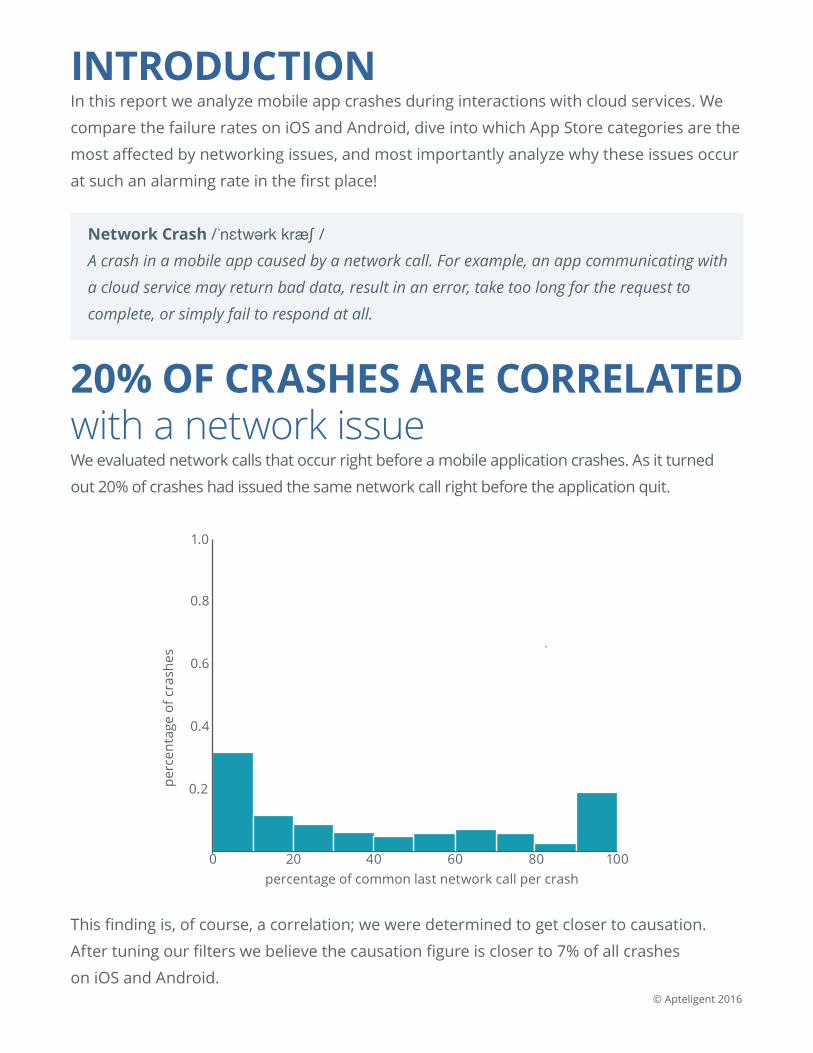
20% OF CRASHES ARE CORRELATED with a network issueWe evaluated network calls that occur right before a mobile application crashes. As it turned
out 20% of crashes had issued the same network call right before the application quit.
percentage of common last network call per crash
perc
enta
ge o
f cra
shes
20 40 60 80 1000
0.2
0.4
0.6
0.8
1.0
This finding is, of course, a correlation; we were determined to get closer to causation.
After tuning our filters we believe the causation figure is closer to 7% of all crashes
on iOS and Android.
© Apteligent 2016
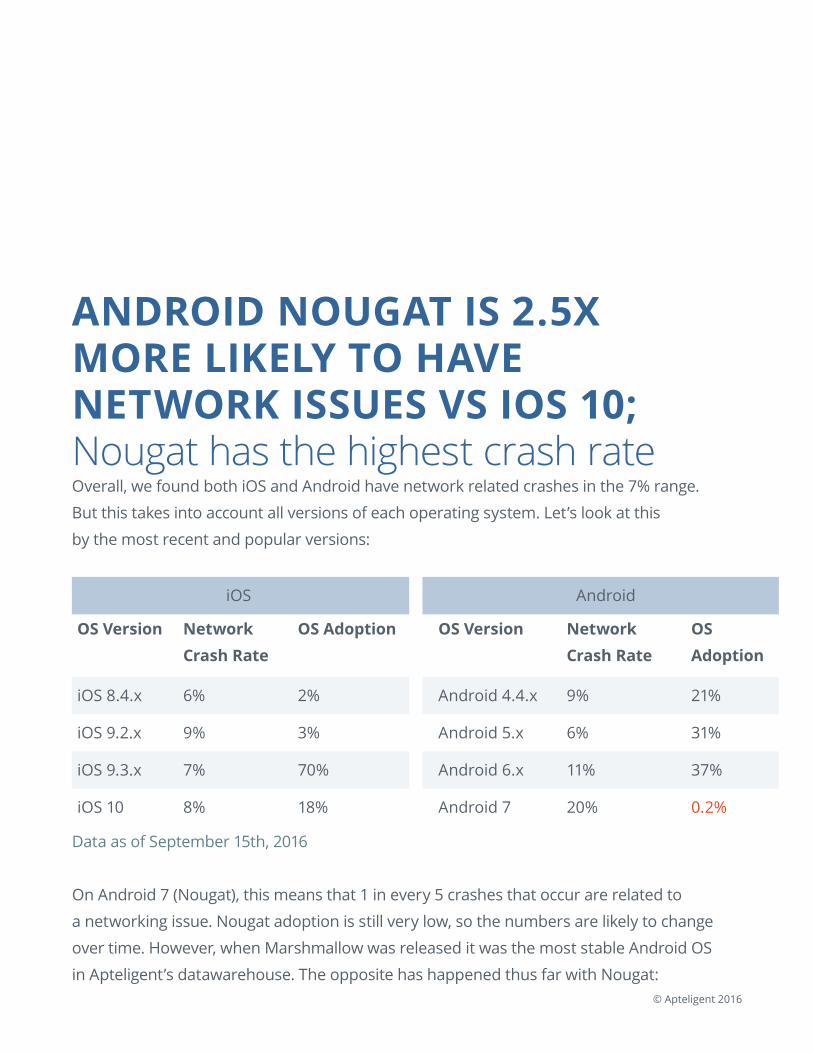
ANDROID NOUGAT IS 2.5X MORE LIKELY TO HAVE NETWORK ISSUES VS IOS 10; Nougat has the highest crash rateOverall, we found both iOS and Android have network related crashes in the 7% range.
But this takes into account all versions of each operating system. Let’s look at this
by the most recent and popular versions:
iOS Android
OS Version Network Crash Rate
OS Adoption OS Version Network Crash Rate
OS Adoption
iOS 8.4.x 6% 2% Android 4.4.x 9% 21%
iOS 9.2.x 9% 3% Android 5.x 6% 31%
iOS 9.3.x 7% 70% Android 6.x 11% 37%
iOS 10 8% 18% Android 7 20% 0.2%
Data as of September 15th, 2016
On Android 7 (Nougat), this means that 1 in every 5 crashes that occur are related to
a networking issue. Nougat adoption is still very low, so the numbers are likely to change
over time. However, when Marshmallow was released it was the most stable Android OS
in Apteligent’s datawarehouse. The opposite has happened thus far with Nougat:
© Apteligent 2016
For more iOS adoption data and crash rate data:
data.apteligent.com/ios
data.apteligent.com/ios-crash-rate-by-version
For more Android adoption data and crash rate data:
data.apteligent.com/android
data.apteligent.com/android-crash-rate-by-version
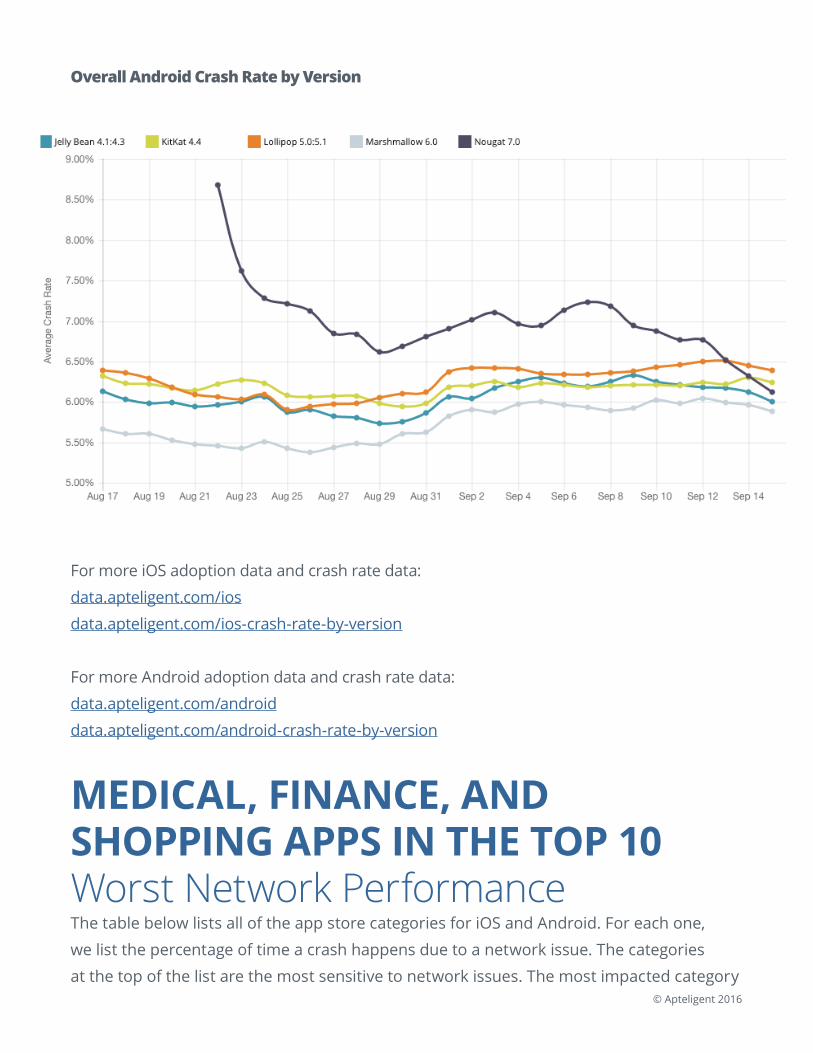
MEDICAL, FINANCE, AND SHOPPING APPS IN THE TOP 10 Worst Network PerformanceThe table below lists all of the app store categories for iOS and Android. For each one,
we list the percentage of time a crash happens due to a network issue. The categories
at the top of the list are the most sensitive to network issues. The most impacted category
Overall Android Crash Rate by Version
© Apteligent 2016
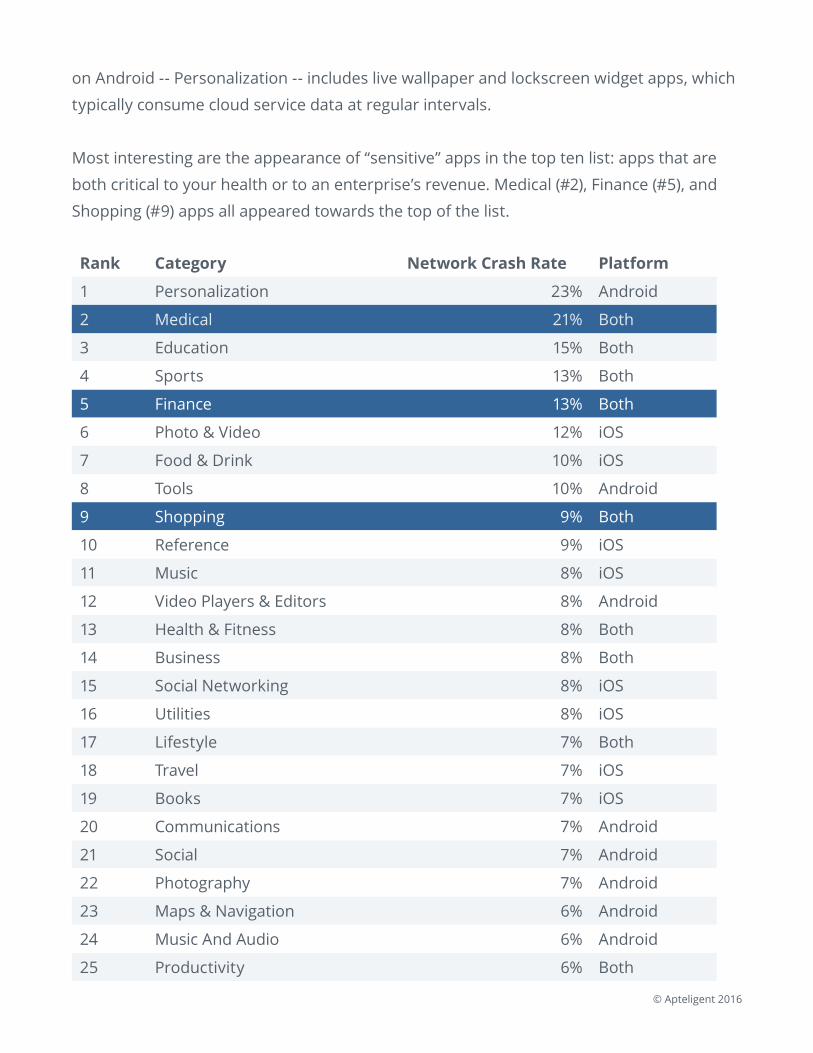
on Android -- Personalization -- includes live wallpaper and lockscreen widget apps, which
typically consume cloud service data at regular intervals.
Most interesting are the appearance of “sensitive” apps in the top ten list: apps that are
both critical to your health or to an enterprise’s revenue. Medical (#2), Finance (#5), and
Shopping (#9) apps all appeared towards the top of the list.
Rank Category Network Crash Rate Platform
1 Personalization 23% Android
2 Medical 21% Both
3 Education 15% Both
4 Sports 13% Both
5 Finance 13% Both
6 Photo & Video 12% iOS
7 Food & Drink 10% iOS
8 Tools 10% Android
9 Shopping 9% Both
10 Reference 9% iOS
11 Music 8% iOS
12 Video Players & Editors 8% Android
13 Health & Fitness 8% Both
14 Business 8% Both
15 Social Networking 8% iOS
16 Utilities 8% iOS
17 Lifestyle 7% Both
18 Travel 7% iOS
19 Books 7% iOS
20 Communications 7% Android
21 Social 7% Android
22 Photography 7% Android
23 Maps & Navigation 6% Android
24 Music And Audio 6% Android
25 Productivity 6% Both
© Apteligent 2016
26 Weather 6% Android
27 Travel And Local 6% Android
28 Navigation 6% iOS
29 News And Magazines 5% Android
30 Entertainment 5% Both
31 News 5% iOS
32 Books And Reference 5% Android
In the table above, some categories exist on both platforms while some are unique to either
Android or iOS. For more information on app store categories, check out the iOS listing and
the Google Play listing.
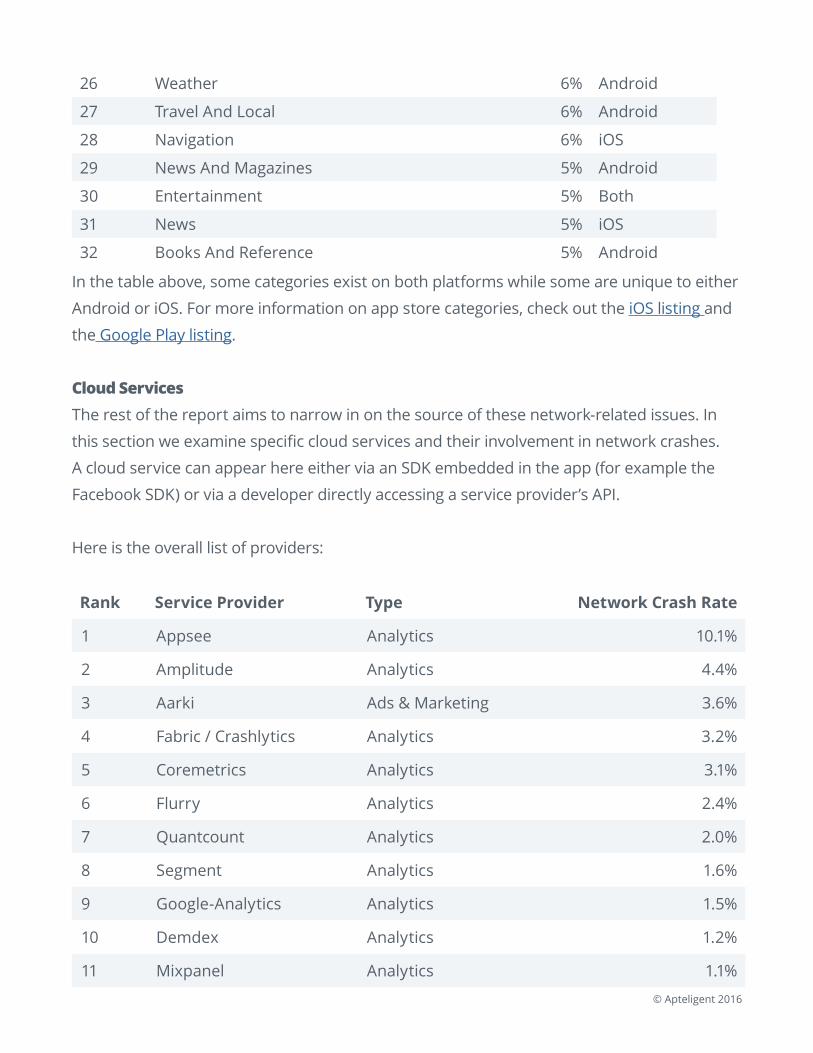
Cloud ServicesThe rest of the report aims to narrow in on the source of these network-related issues. In
this section we examine specific cloud services and their involvement in network crashes.
A cloud service can appear here either via an SDK embedded in the app (for example the
Facebook SDK) or via a developer directly accessing a service provider’s API.
Here is the overall list of providers:
Rank Service Provider Type Network Crash Rate
1 Appsee Analytics 10.1%
2 Amplitude Analytics 4.4%
3 Aarki Ads & Marketing 3.6%
4 Fabric / Crashlytics Analytics 3.2%
5 Coremetrics Analytics 3.1%
6 Flurry Analytics 2.4%
7 Quantcount Analytics 2.0%
8 Segment Analytics 1.6%
9 Google-Analytics Analytics 1.5%
10 Demdex Analytics 1.2%
11 Mixpanel Analytics 1.1%
© Apteligent 2016
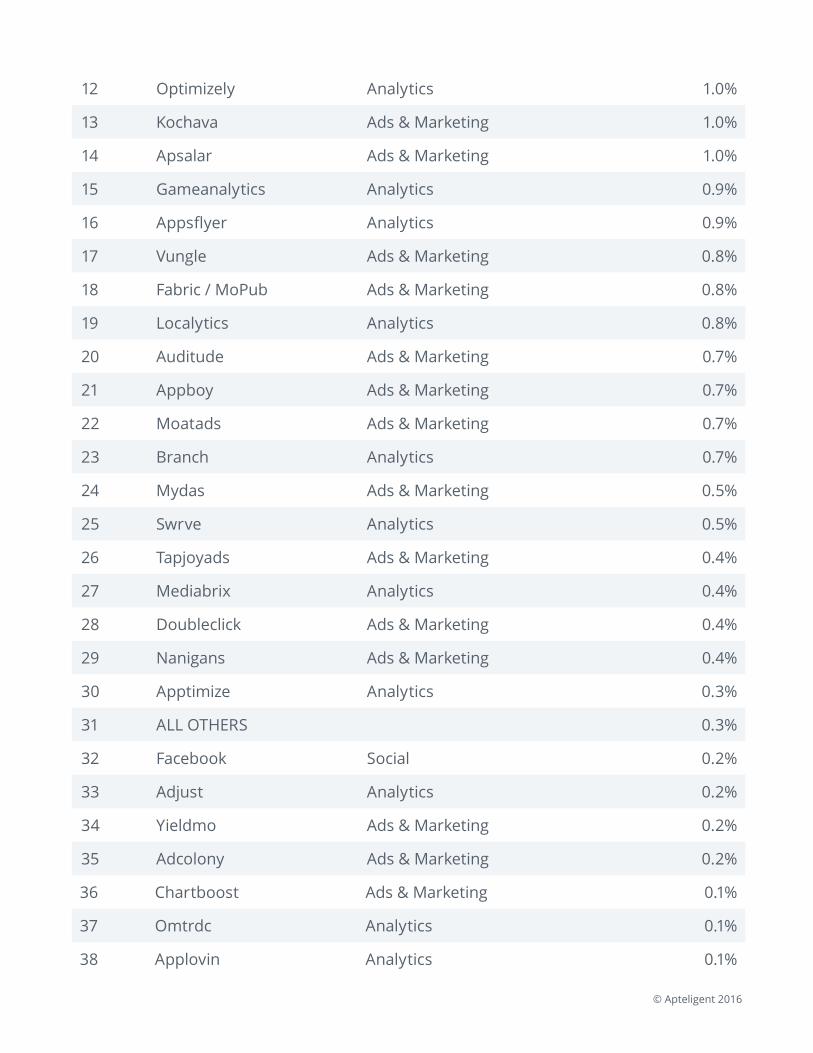
12 Optimizely Analytics 1.0%
13 Kochava Ads & Marketing 1.0%
14 Apsalar Ads & Marketing 1.0%
15 Gameanalytics Analytics 0.9%
16 Appsflyer Analytics 0.9%
17 Vungle Ads & Marketing 0.8%
18 Fabric / MoPub Ads & Marketing 0.8%
19 Localytics Analytics 0.8%
20 Auditude Ads & Marketing 0.7%
21 Appboy Ads & Marketing 0.7%
22 Moatads Ads & Marketing 0.7%
23 Branch Analytics 0.7%
24 Mydas Ads & Marketing 0.5%
25 Swrve Analytics 0.5%
26 Tapjoyads Ads & Marketing 0.4%
27 Mediabrix Analytics 0.4%
28 Doubleclick Ads & Marketing 0.4%
29 Nanigans Ads & Marketing 0.4%
30 Apptimize Analytics 0.3%
31 ALL OTHERS 0.3%
32 Facebook Social 0.2%
33 Adjust Analytics 0.2%
34 Yieldmo Ads & Marketing 0.2%
35 Adcolony Ads & Marketing 0.2%
36 Chartboost Ads & Marketing 0.1%
37 Omtrdc Analytics 0.1%
38 Applovin Analytics 0.1%
© Apteligent 2016
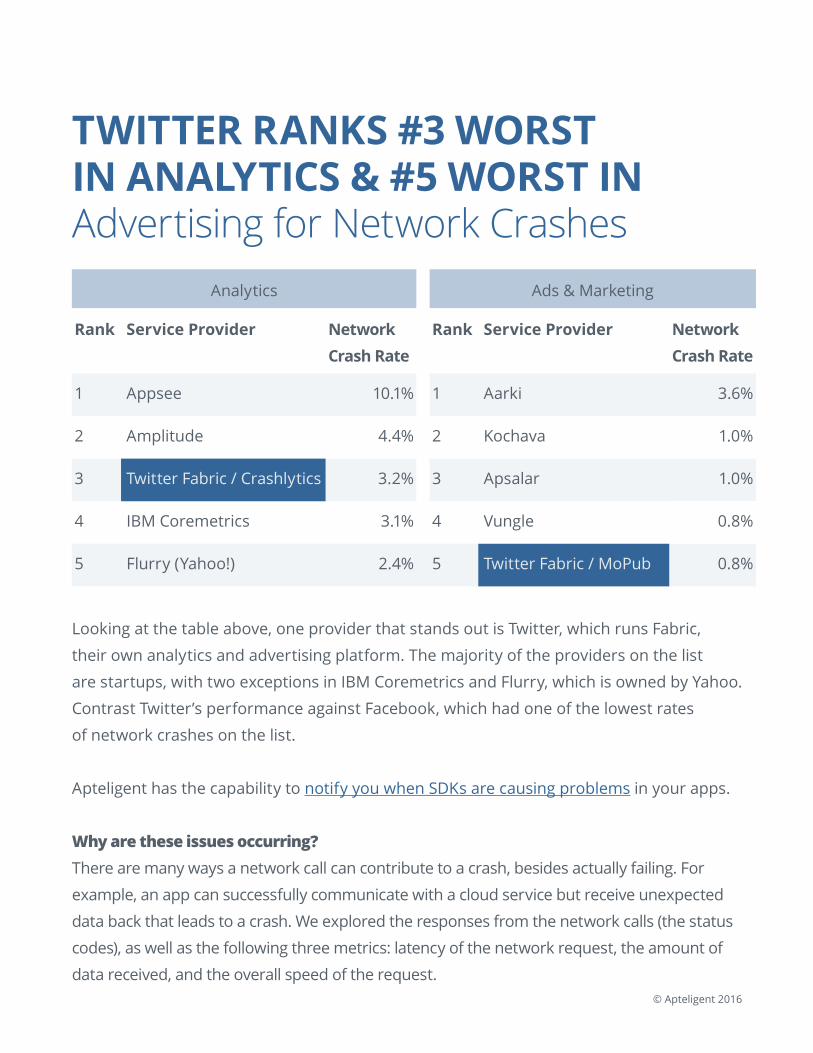
TWITTER RANKS #3 WORST IN ANALYTICS & #5 WORST IN Advertising for Network Crashes
Analytics Ads & Marketing
Rank Service Provider Network Crash Rate
Rank Service Provider Network Crash Rate
1 Appsee 10.1% 1 Aarki 3.6%
2 Amplitude 4.4% 2 Kochava 1.0%
3 Twitter Fabric / Crashlytics 3.2% 3 Apsalar 1.0%
4 IBM Coremetrics 3.1% 4 Vungle 0.8%
5 Flurry (Yahoo!) 2.4% 5 Twitter Fabric / MoPub 0.8%
Looking at the table above, one provider that stands out is Twitter, which runs Fabric,
their own analytics and advertising platform. The majority of the providers on the list
are startups, with two exceptions in IBM Coremetrics and Flurry, which is owned by Yahoo.
Contrast Twitter’s performance against Facebook, which had one of the lowest rates
of network crashes on the list.
Apteligent has the capability to notify you when SDKs are causing problems in your apps.
Why are these issues occurring? There are many ways a network call can contribute to a crash, besides actually failing. For
example, an app can successfully communicate with a cloud service but receive unexpected
data back that leads to a crash. We explored the responses from the network calls (the status
codes), as well as the following three metrics: latency of the network request, the amount of
data received, and the overall speed of the request.
© Apteligent 2016
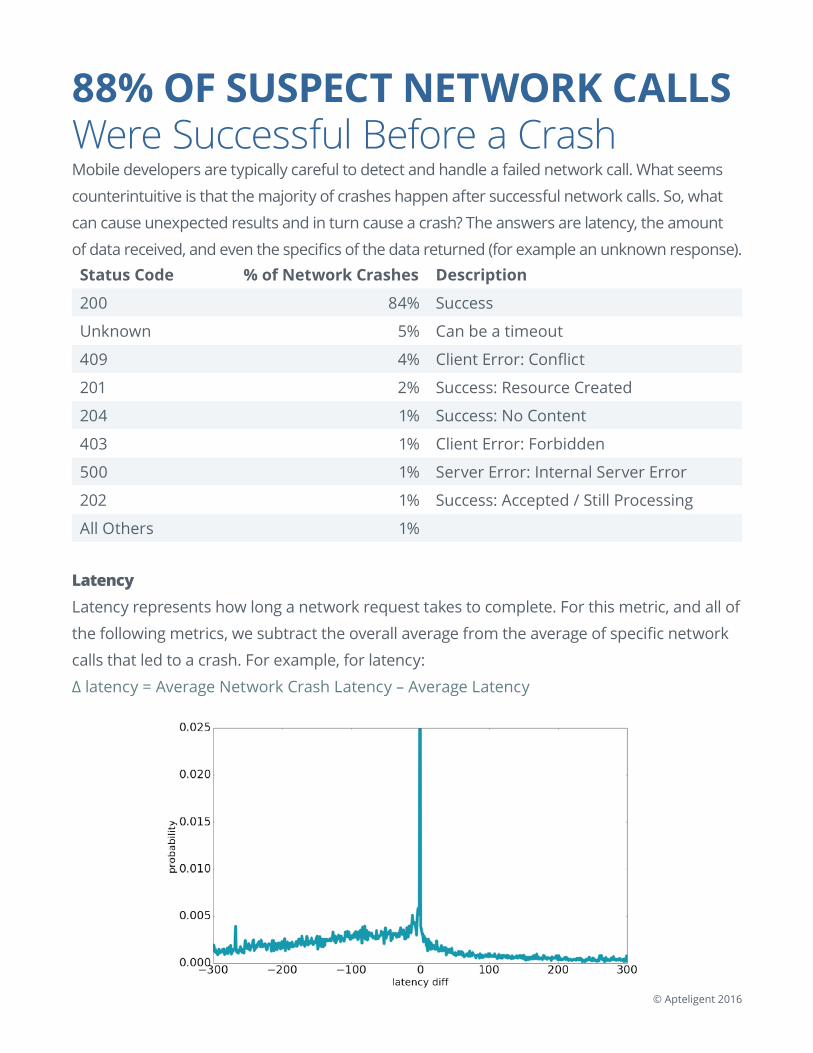
88% OF SUSPECT NETWORK CALLS Were Successful Before a CrashMobile developers are typically careful to detect and handle a failed network call. What seems
counterintuitive is that the majority of crashes happen after successful network calls. So, what
can cause unexpected results and in turn cause a crash? The answers are latency, the amount
of data received, and even the specifics of the data returned (for example an unknown response). Status Code % of Network Crashes Description
200 84% Success
Unknown 5% Can be a timeout
409 4% Client Error: Conflict
201 2% Success: Resource Created
204 1% Success: No Content
403 1% Client Error: Forbidden
500 1% Server Error: Internal Server Error
202 1% Success: Accepted / Still Processing
All Others 1%
LatencyLatency represents how long a network request takes to complete. For this metric, and all of
the following metrics, we subtract the overall average from the average of specific network
calls that led to a crash. For example, for latency:
∆ latency = Average Network Crash Latency – Average Latency
© Apteligent 2016
The negative skew in the graph means network calls that led to a crash took less time than
expected. The resulting integral (area under the graph) shows that 72% of network-related
crashes took less time than average to complete, 5% took the same time as the average,
and 23% took longer than average to complete.
Based on the results of the analysis below, we believe the negative latency skew is due to
less data being returned on average for network calls that lead to a crash.
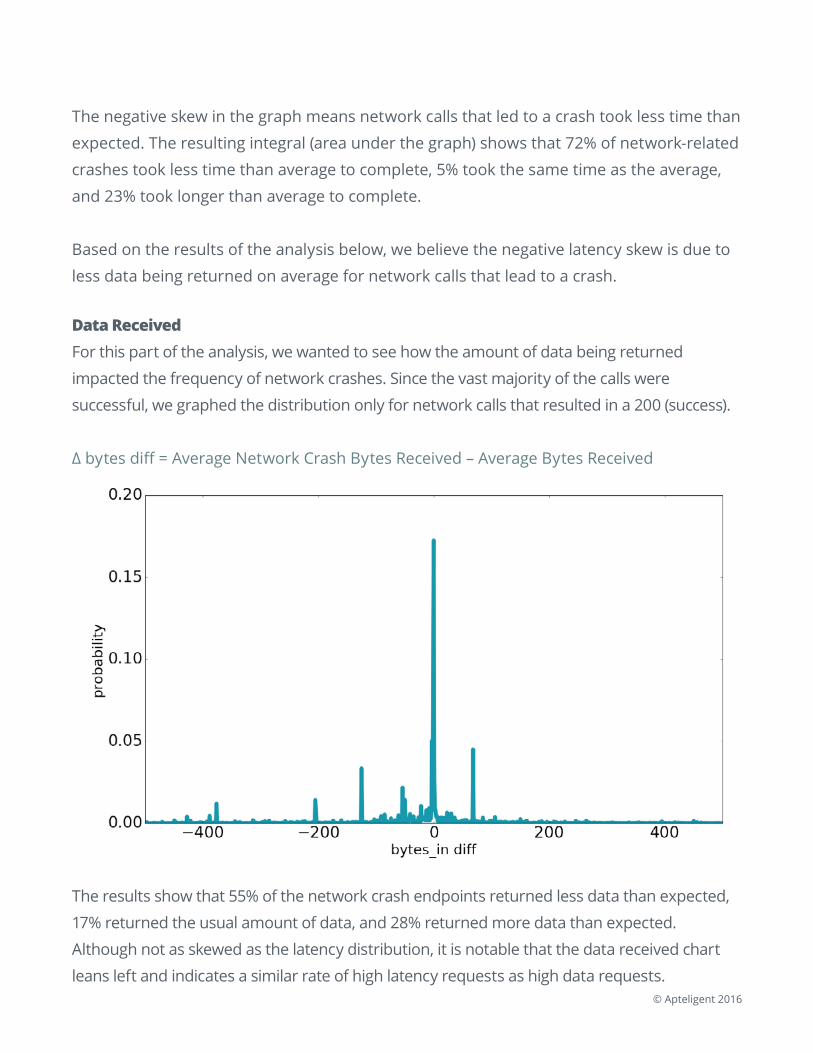
Data ReceivedFor this part of the analysis, we wanted to see how the amount of data being returned
impacted the frequency of network crashes. Since the vast majority of the calls were
successful, we graphed the distribution only for network calls that resulted in a 200 (success).
∆ bytes diff = Average Network Crash Bytes Received – Average Bytes Received
The results show that 55% of the network crash endpoints returned less data than expected,
17% returned the usual amount of data, and 28% returned more data than expected.
Although not as skewed as the latency distribution, it is notable that the data received chart
leans left and indicates a similar rate of high latency requests as high data requests.
© Apteligent 2016
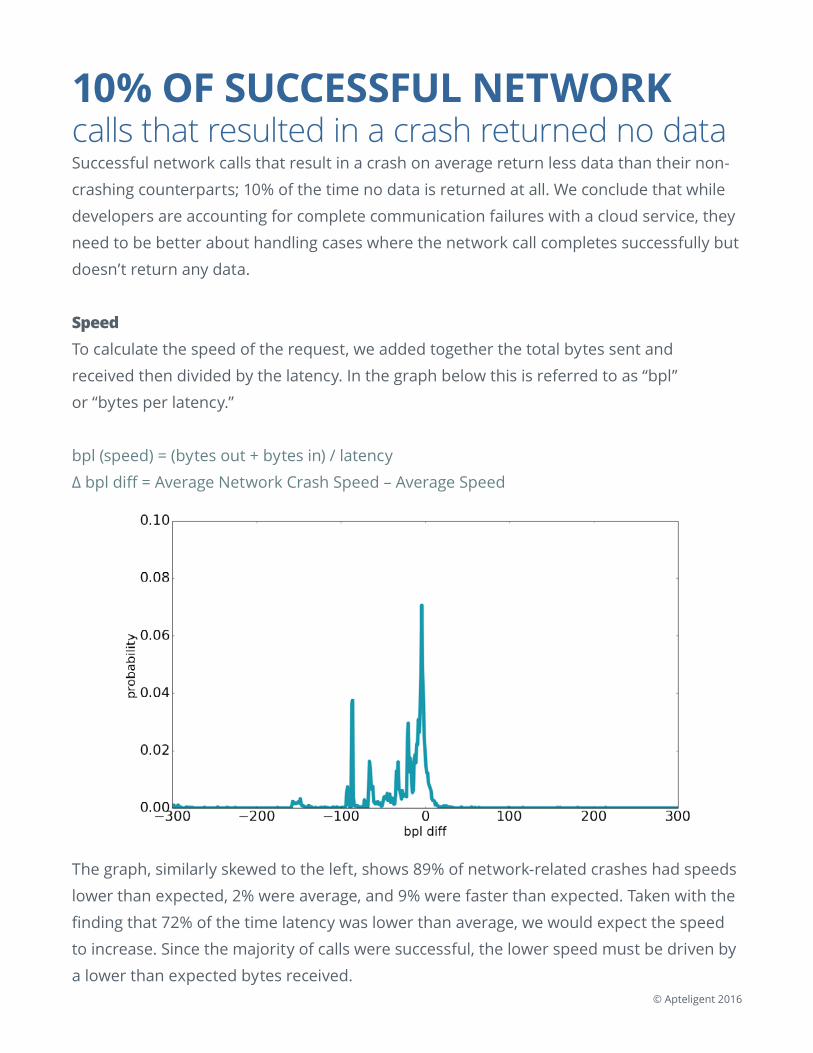
10% OF SUCCESSFUL NETWORK calls that resulted in a crash returned no dataSuccessful network calls that result in a crash on average return less data than their non-
crashing counterparts; 10% of the time no data is returned at all. We conclude that while
developers are accounting for complete communication failures with a cloud service, they
need to be better about handling cases where the network call completes successfully but
doesn’t return any data.
SpeedTo calculate the speed of the request, we added together the total bytes sent and
received then divided by the latency. In the graph below this is referred to as “bpl”
or “bytes per latency.”
bpl (speed) = (bytes out + bytes in) / latency
∆ bpl diff = Average Network Crash Speed – Average Speed
The graph, similarly skewed to the left, shows 89% of network-related crashes had speeds
lower than expected, 2% were average, and 9% were faster than expected. Taken with the
finding that 72% of the time latency was lower than average, we would expect the speed
to increase. Since the majority of calls were successful, the lower speed must be driven by
a lower than expected bytes received.
© Apteligent 2016
CONCLUSIONA surprisingly high percentage of fatal errors in apps are caused by network issues.
Therefore it is important to have what we call “network breadcrumbs” or the ability
to see how user behavior initiates certain network calls that can ultimately lead to a crash.
Our analysis showed that certain external factors do influence the network crash rate,
including OS version, app store category, and cloud service provider. We also found that
certain external factors do not influence the likelihood of network crashes; for example,
we found no meaningful difference among specific network carriers. We did, however,
discover clear signals coming from latency, data received, and request speed. Mobile
developers are handling the case of complete communication failures, but must expand
error handling to include cases when an endpoint returns either unexpected data or no
data at all.
To receive your own report like this, check out our new CUSTOM INSIGHTSTM capability.
You gain access to billions of data points about the mobile ecosystem in the context of
your app and utilize the same big data tools as our data science team. Existing customers
can log in to the portal to access custom insights.
Apteligent Network Insights product provides what we call ‘network breadcrumbs’
to automatically capture and show all the network calls leading up to each crash.
The Apteligent Userflows product additionally provides visibility into user behavior
that triggers these fatal flows.
© Apteligent 2016
ABOUT APTELIGENT If you develop an app, or are responsible for the success of a mobile app, Apteligent’s
lightweight SDK helps you optimize user experience by identifying performance issues,
such as crashes and network failures, that impact user behavior.
The company’s solution provides a real-time global view of apps across iOS, Android, Windows
Phone 10, Hybrid and HTML5. Trusted by three of the top five credit card issuers, three of the
top five media companies, three of the top five retailers, and two of the top three hotel chains
with the success of their strategic mobile app initiatives. Apteligent is leading the drive to the
App Economy.
www.apteligent.com | @apteligent | [email protected]
A note on our dataOur data is benchmarked across tens of thousands of mobile apps representing hundreds
of millions of application launches. Adoption rate is based on app loads and network data,
which means it is based on actual usage of the operating system. You may see slightly
different numbers reported in the future by Apple, which are solely based on activations
vs actual device usage.
You can find mobile industry benchmarks updated daily at data.apteligent.com. In addition,
every month we publish a recap of the trends and movements in the industry.