Embed Size (px)
Citation preview

Proc. IODP | Volume 329
D’Hondt, S., Inagaki, F., Alvarez Zarikian, C.A., and the Expedition 329 ScientistsProceedings of the Integrated Ocean Drilling Program, Volume 329
Data report: quantification of potential drillingcontamination using perfluorocarbon tracer
at IODP Expedition 329 sites1
Justine Sauvage,2 Leah Lewis,3 Dennis Graham,2 Arthur J. Spivack,2 and Steven D’Hondt3
Chapter contents
Abstract . . . . . . . . . . . . . . . . . . . . . . . . . . . . . . . 1
Introduction . . . . . . . . . . . . . . . . . . . . . . . . . . . 1
Methods . . . . . . . . . . . . . . . . . . . . . . . . . . . . . . 2
Results . . . . . . . . . . . . . . . . . . . . . . . . . . . . . . . . 3
Acknowledgments. . . . . . . . . . . . . . . . . . . . . . . 4
References . . . . . . . . . . . . . . . . . . . . . . . . . . . . . 4
Figures . . . . . . . . . . . . . . . . . . . . . . . . . . . . . . . . 5
Tables. . . . . . . . . . . . . . . . . . . . . . . . . . . . . . . . 10
Appendix A . . . . . . . . . . . . . . . . . . . . . . . . . . . 16
Appendix B . . . . . . . . . . . . . . . . . . . . . . . . . . . 16
Appendix C . . . . . . . . . . . . . . . . . . . . . . . . . . . 17
Appendix D . . . . . . . . . . . . . . . . . . . . . . . . . . . 17
1Sauvage, J., Lewis, L., Graham, D., Spivack, A.J., and D’Hondt, S.D., 2017. Data report: quantification of potential drilling contamination using perfluorocarbon tracer at IODP Expedition 329 sites. In D’Hondt, S., Inagaki, F., Alvarez Zarikian, C.A., and the Expedition 329 Scientists, Proceedings of the Integrated Ocean Drilling Program, 329: Tokyo (Integrated Ocean Drilling Program Management International, Inc.). doi:10.2204/iodp.proc.329.204.20172Graduate School of Oceanography, University of Rhode Island, Narragansett RI 02882, USA. Correspondence author: [email protected] Institution of Oceanography, University of California San Diego, La Jolla CA 92037, USA.
AbstractTo quantify the potential for biological contamination associ-ated with the coring process, we conducted perfluorocarbontracer (PFT) analysis on 556 sediment samples from IntegratedOcean Drilling Program (IODP) Expedition 329. The expeditioncored deep-sea sediment at seven sites in the South Pacific Gyre(Sites U1365–U1371). We analyzed two types of sediment sam-ples: (1) samples taken in the central part of the core (i.e., inte-rior samples) and (2) samples taken near the core edge (i.e., exte-rior samples). We calculated the amount of potential drillingfluid intrusion from the mass of PFT that we measured in eachsample. For the seven Expedition 329 sites (15 holes analyzed),PFT content ranges from below detection to levels where con-tamination is extremely apparent. The centers of the sedimentcores (interior samples) contained generally less PFT than thecore margins (exterior samples) and thus have lower potentialdrilling fluid (DF) contamination. The majority of sedimentsamples (interior) at Sites U1370 and U1371 have a contamina-tion potential close to or below detection levels (i.e., 1.19 × 10⁻⁴
ngPFT/gsediment or 1.78 × 10⁻³ µLDF/gsediment on average). We observedhigher contamination values (i.e., 7.28 × 10⁻³ ngPFT/gsediment or6.98 × 10–2 µLDF/gsediment on average) at Sites U1365, U1366, andU1367. Finally, we measured much higher PFT concentrationsthroughout the sediment of Sites U1368 and U1369 (i.e., 5.48 ×10⁻² ngPFT/gsediment or 6.60 × 10⁻¹ µLDF/gsediment on average). We ob-serve no apparent correlation of sample PFT content to sedimentlithology, degree of sediment disturbance, core section number,or porosity.
IntroductionIntegrated Ocean Drilling Program (IODP) Expedition 329 to theSouth Pacific Gyre was conducted to document the extent andcharacter of life in sedimentary habitats with very low biomassand rates of activity (D’Hondt et al., 2013). To meet these objec-tives, Expedition 329 scientists cored the entire sediment columnat seven sites along two transects in the South Pacific Gyre (seethe “Expedition 329 summary” chapter [Expedition 329 Scien-tists, 2011]). Characterization of microbial communities in the re-covered sediment requires precise constraints on the maximumpotential for microbiological contamination associated with the
doi:10.2204/iodp.proc.329.204.2017

J. Sauvage et al. Data report: quantification of potential drilling contamination
coring process. Surface seawater used as the drillingfluid is a ubiquitous potential contaminating me-dium (Smith et al., 2000). With about three orders ofmagnitude difference between in situ (sediment) cellabundances and cell abundances in South PacificGyre surface seawater, the potential for microbialcontamination is of major concern (see D’Hondt etal., 2011; D’Hondt et al., 2015). We monitored theintrusion potential of drilling fluid during the coringoperations by adding a water-soluble perfluorocar-bon tracer (PFT) to the drilling fluid and subse-quently measuring the PFT concentration in sedi-ment samples immediately adjacent to dedicatedmicrobiology samples. The addition of PFT to drill-ing fluid is an effective way to quantify drilling-in-duced contamination, as it is inert and can be de-tected with high sensitivity (Colwell et al., 1992).The measured PFT concentration in the sedimentcan then be used as an indirect measure of drillingfluid intrusion and potential associated entrainmentof nonindigenous cells. PFT analyses have been suc-cessfully applied to detect contaminants prior to mi-crobiological studies on numerous other deep-bio-sphere projects, such as Ocean Drilling Program(ODP) Leg 201 (House et al., 2003) and IODP Expedi-tion 301 (Lever et al., 2006).
The R/V JOIDES Resolution piston cored sediment atall seven sites (IODP Sites U1365–U1371) during Ex-pedition 329 (Fig. F1; see the “Expedition 329 sum-mary” chapter [Expedition 329 Scientists, 2011]). Atotal of 556 sediment samples were recovered fromthese sites to analyze their PFT content for (1) quan-tification of potential drilling fluid intrusion and(2) introduction of nonindigenous cells during cor-ing. The primary objective of these analyses was toidentify core intervals with the least potential coringcontamination for microbiological studies.
MethodsPFT delivery
PFT was introduced into the drilling fluid (DF)stream at a rate calculated to achieve a concentrationof 0.89 mgPFT/LDF. The injection rate was controlledwith a single-piston high-pressure liquid chromatog-raphy (HPLC) pump, which pumps the PFT from apolypropylene carboy into the drilling mud stream.For each hole, we started pumping the tracer earlyenough to ensure that the tracer reached the drill bitwell before drilling operations began. We kept trackof drilling fluid PFT concentrations by monitoring
Proc. IODP | Volume 329
the drilling mud pump rate (in liters per minute) andthe PFT delivery rate (in milliliters PFT per minute)using shipboard instrumentation software (an exam-ple for Site U1370 is shown in Fig. F2).
Sample collectionUnconsolidated sediment was sampled on the cat-walk for PFT analyses immediately after core re-trieval. PFT samples were consistently sampled adja-cent to the section/whole round that had beenselected for microbiological analysis. Two cylindricalplugs (3 cm3 each) were taken from the bottom endof each section with 5 mL cut-off syringes. One plugwas taken from the outer edge near the core liner toconfirm successful delivery of the tracer (exteriorsamples) and the other was taken from near the cen-ter of the core to quantify drill water intrusion to thecore center (interior samples). The samples were im-mediately extruded into 20 mL capacity headspaceglass vials containing iso-octane (Sites U1365 andU1366) or water (Sites U1367–U1371) and sealedwith gas-tight caps containing septa.
PFT analysis (postcruise)The low solubility of PFT in water facilitates gas par-titioning, allowing a quantitative headspace analysisvia gas chromatography (GC). Due to the lack of anappropriate GC column, PFT measurements were notpossible during the expedition. Therefore, we quan-tified the PFT concentration in the samples post-cruise using a Shimadzu 17A gas chromatographwith an electron capture detector (ECD) at the Grad-uate School of Oceanography, University of RhodeIsland. We heated the headspace vials containing thesediment samples for at least 30 min in a 70°C ovenin order to release the tracer from the sediment. Wedirectly injected 2.0 mL of headspace gas from sam-ples, standards, and blanks manually using 3 mLplastic syringes and needles. Syringes and needleswere similarly heated for 30 min at 70°C prior to in-jection in order to minimize absorption of PFT intothe interior of the syringe and to negate samplecross-contamination. The oven temperature was set6°C lower than the PFT boiling point (76°C) to avoidmelting the plastic syringes during the heating pro-cess. Because the temperature was slightly below thePFT boiling point, PFT extraction may not have beencomplete. However, because PFT readily evaporatesdue to its inherent low viscosity and low surface ten-sion, we believe that most of the PFT was extracted.For description of a detailed analytical protocol, werefer to Smith et al. (2000) and House et al. (2003).
2

J. Sauvage et al. Data report: quantification of potential drilling contamination
Calibration, instrumental and procedural blanks, and detection limit
For standards, we diluted PFT in ultrapure methanolto 10–2, 10–4, 10–6, and 10–8 vol:vol in 20 mL capacityheadspace vials (see Appendix A). We constructed astandard curve by plotting the PFT peak area versusPFT mass injected, resulting in a log-log correlation.We calculated the amount of PFT (in grams) con-tained within an injection by using the formula de-scribed in Appendix A. Further details on GC cali-bration slopes are presented in Appendix B. Weanalyzed both procedural and instrumental blanksto determine experimental backgrounds. Each in-strumental blank consisted of a 2 mL injection of aircollected in a heated gas-tight syringe from outsidethe laboratory. We also ran procedural blanks con-sisting of a 2 mL injection of ambient coring air(headspace gas sealed in an empty vial at time ofsample collection), when available. Proceduralblanks were collected for Holes U1367D, U1370E,U1370F, and U1371E. To calculate the detectionlimit, we used the average value and standard devia-tion of all blank runs combined. We present furtherdetails regarding detection limit analysis in Appen-dix C.
Estimates of maximum potential of drilling fluid intrusion and nonindigenous cells
We calculated the volume of drilling water intrusionbased on the PFT content of each sample and assum-ing a PFT concentration of 0.89 mg/L in the drillingfluid. A detailed description of the calculationmethod is given in Appendix D. We then used thecalculated volume of drilling water in each sample toestimate the potential number of contaminant cells.This estimate is usually based on the measured den-sity of cells in the drilling fluid (Lever et al., 2006).However, because no drill water samples were takenfor cell counts during Expedition 329 coring opera-tions, we used the average surface seawater cellcount from the 2006 site survey expedition, KNOX-02RR (1.7 × 10⁵ cells/mL; see D’Hondt et al., 2011).
ResultsTable T1 presents the detection limits (in nanogramsPFT), drilling fluid equivalents (microliters), andnonindigenous cells equivalents (cells) for each ofthe Expedition 329 sites. The PFT detection limits re-ported for Expedition 329 sites were in the range of1.03 × 10–3 to 2.17 × 10⁻³ ng PFT or 1.16 × 10⁻³ to2.44 × 10–3 µL potential seawater intrusion. Varia-tions in detection limit were driven by variations inthe instrument calibration obtained for each site
Proc. IODP | Volume 329
during the course of the analysis. Tables T2, T3, T4,T5, T6, T7, and T8 contain the measured PFT con-tent (interior and exterior sample pairs), deriveddrilling fluid intrusion, and nonindigenous cell en-trainment for all analyzed samples, sorted by siteand hole. These tables also report sample location,lithology, and degree of sediment disturbance foreach analyzed sample. Samples that produced a peakarea below their hole’s detection limit are denoted as“BD.” Downhole variations in PFT content at Expe-dition 329 sites are shown in Figures F3, F4, F5, F6,F7, F8, and F9 on a logarithmic scale. In these fig-ures, intervals characterized by slight to severe cor-ing disturbance intensity are annotated with shadedareas.
The centers of the sediment cores contain generallyless PFT than the core margins. Detection of thetracer in exterior core samples confirms successfuldelivery, whereas lower concentrations within theinterior samples generally demonstrate lower con-tamination potential in core interiors. Despite thesegeneral patterns, PFT concentrations in interior-exte-rior sample pairs did not always follow a predictablegradient, with maxima at the core liner and minimain the center of the core. More than 50% of samplepairs in Holes U1365B and U1369C showed elevatedPFT content in the center of the core compared tothe core margins. These unexpected reversals of theexpected pattern might be artifacts of (1) samplemislabeling, (2) differential PFT loss during relativelylong sample storage times (months), or (3) advectionof drilling fluid through microfissures (Lever et al.,2006). Lever et al. (2006) found relatively highercontamination potential in fine-grained samples(clay) compared to fine sand sediment, possibly dueto preferential cracking of clays and resultant advec-tion of drilling fluid through the core interior.
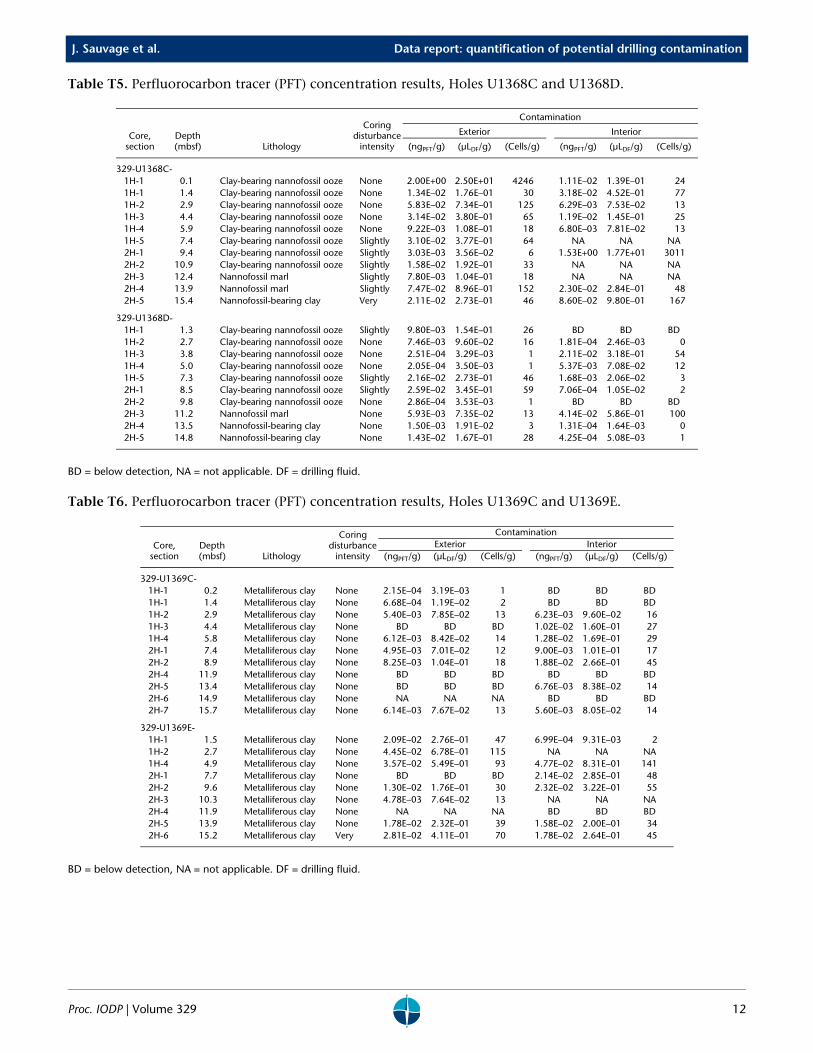
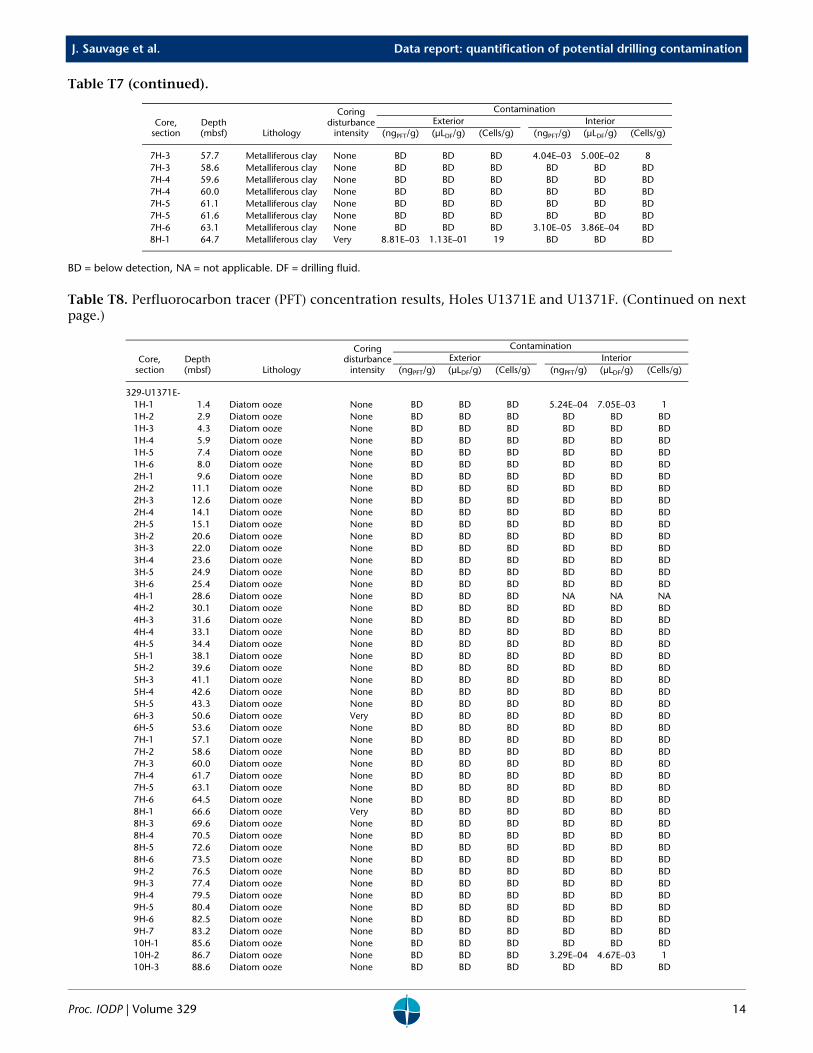
Different degrees of contamination potential charac-terize the PFT records of different sites. Sites U1370and U1371 exhibit minimal contamination poten-tial with PFT measurements in 71%, 99%, 99%, and100% of the interior samples below detection forHoles U1370E, U1370F, U1371E, and U1371F, respec-tively. For above detection samples at Sites U1370and U1371, the detected PFT concentration is rela-tively low, averaging 8.86 × 10⁻⁴ ngPFT/gsediment. PFTconcentrations were generally above detection levelsat Sites U1365–U1369. Intermediate contaminationlevels (i.e., 7.28 × 10⁻³ ngPFT/gsediment or 6.98 × 10⁻²
µLDF/gsediment on average) were measured at SitesU1365–U1367. Finally, Sites U1368 and U1369showed contamination potential averaging 9.87 ×10⁻² and 1.09 × 10⁻² ngPFT/gsediment, respectively. Alarge fraction of the sediment from Hole U1368Cwas reported as slightly disturbed by the shipboard
3

J. Sauvage et al. Data report: quantification of potential drilling contamination
scientific party, which may partly explain the ele-vated PFT content observed for that hole.
To understand the large variation in measured PFTcontent throughout Expedition 329 sites, we lookedfor relationships between observed PFT concentra-tion and other parameters, including core sectionnumber, core depth, porosity, sediment lithology,and degree of coring disturbance. We found elevatedPFT content in 55% of the samples from sedimentaryintervals characterized by shipboard sedimentolo-gists as heavily disturbed. We observed no relation-ship between lithology (e.g., abyssal clay, carbonateooze, and siliceous ooze) and PFT content. However,because PFT extraction may have been incomplete at70°C, we cannot fully preclude the possibility of a re-lationship between contamination potential andlithology.
AcknowledgmentsThis research used samples provided by the Inte-grated Ocean Drilling Program (IODP). All sampleswere collected during IODP Expedition 329. Wethank the Expedition 329 captain, crew, technicians,and science party of the R/V JOIDES Resolution fortheir assistance during the expedition. We especiallythank Steven Midgley for his postcruise help in pro-viding logging data. We thank Dr. Mark AlexanderLever for very helpful comments. Postexpeditionanalyses were funded by the National Science Foun-dation (NSF) Division of Ocean Sciences (grant OCE-1130735) and the NSF-funded Center for Dark En-ergy Biosphere Investigations (grant NSF-OCE-0939564). This is a contribution to the Deep CarbonObservatory (DCO). It is Center for Dark Energy Bio-sphere Investigations (C-DEBI) contribution #335.
ReferencesColwell, F.S., Stormberg, G.J., Phelps, T.J., Birnbaum, S.A.,
McKinley, J., Rawson, S.A., Veverka, C., Goodwin, S., Long, P.E., Russell, B.F., Garland, T., Thompson, D., Skinner, P., and Grover, S., 1992. Innovative techniques for collection of saturated and unsaturated subsurface basalts and sediments for microbiological characteriza-tion. Journal of Microbiological Methods, 15(4):279–292. http://dx.doi.org/10.1016/0167-7012(92)90047-8
D’Hondt, S., Abrams, L.J., Anderson, R., Dorrance, J., Durbin, A., Ellett, L., Ferdelman, T., Fischer, J., Forschner, S., Fuldauer, R., Goldstein, H., Graham, D., Griffith, W., Halm, H., Harris, R., Harrison, B., Hasiuk, F., Horn, G., Kallmeyer, J., Lever, M., Meyer, J., Morse, L., Moser, C., Murphy, B., Nordhausen, A., Parry, L., Pockalny, R., Puschell, A., Rogers, J., Schrum, H., Smith,
Proc. IODP | Volume 329
D.C., Soffientino, B., Spivack, A.J., Stancin, A., Stein-man, M., and Walczak, P., 2011. KNOX-02RR: drilling site survey—life in subseafloor sediments of the South Pacific Gyre. In D’Hondt, S., Inagaki, F., Alvarez Zarik-ian, C.A., and the Expedition 329 Scientists, Proceedings of the Integrated Ocean Drilling Program, 329: Tokyo (Inte-grated Ocean Drilling Program Management Interna-tional, Inc.). http://dx.doi.org/10.2204/iodp.proc.329.112.2011
D’Hondt, S., Inagaki, F., Alvarez Zarikian, C., Abrams, L.J., Dubois, N., Engelhardt, T., Evans, H., Ferdelman, T., Gribsholt, B., Harris, R.N., Hoppie, B.W., Hyun, J.-H., Kallmeyer, J., Kim. J., Lynch, J.E., McKinley, C.C., Mitsu-nobu, S., Morono, Y., Murray, R.W., Pockalny, R., Sau-vage, J., Shimono, T., Shiraishi, F., Smith, D.C., Smith-Duque, C.E., Spivack, A.J., Steinsbu, B.O., Suzuki, Y., Szpak, M., Toffin, L., Uramoto, G., Yamaguchi, Y.T., Zhang, G., Zhang, X.-H., and Ziebis, W., 2015. Presence of oxygen and aerobic communities from sea floor to basement in deep-sea sediments. Nature Geoscience, 8(4):299–304. http://dx.doi.org/10.1038/ngeo2387
D’Hondt, S., Inagaki, F., Alvarez Zarikian, C.A., and the IODP Expedition 329 Science Party, 2013. IODP Expedi-tion 329: life and habitability beneath the seafloor of the South Pacific Gyre. Scientific Drilling, 15:4–10.http://dx.doi.org/10.2204/iodp.sd.15.01.2013
Expedition 329 Scientists, 2011. Expedition 329 summary. In D’Hondt, S., Inagaki, F., Alvarez Zarikian, C.A., and the Expedition 329 Scientists, Proceedings of the Inte-grated Ocean Drilling Program, 329: Tokyo (Integrated Ocean Drilling Program Management International, Inc.).http://dx.doi.org/10.2204/iodp.proc.329.101.2011
House, C.H., Cragg, B.A., Teske, A., and the Leg 201 Scien-tific Party, 2003. Drilling contamination tests during ODP Leg 201 using chemical and particulate tracers. In D’Hondt, S.L., Jørgensen, B.B., Miller, D.J., et al., Pro-ceedings of the Ocean Drilling Program, Initial Reports, 201: College Station, TX (Ocean Drilling Program), 1–19. http://dx.doi.org/10.2973/odp.proc.ir.201.102.2003
Lever, M.A., Alperin, M., Engelen, B., Inagaki, F., Nak-agawa, S., Steinsbu, B.O., Teske A., and IODP Expedition 301 Scientists, 2006. Trends in basalt and sediment core contamination during IODP Expedition 301. Geomicro-biology Journal, 23(7):517–530. http://dx.doi.org/10.1080/01490450600897245
Smith, D.C., Spivack, A.J., Fisk, M.R., Haveman, S.A., Stau-digel, H., and the Leg 185 Shipboard Scientific Party, 2000. Methods for quantifying potential microbial con-tamination during deep ocean coring. Ocean Drilling Program Technical Note, 28. http://dx.doi.org/10.2973/odp.tn.28.2000
Initial receipt: 2 June 2016Acceptance: 3 October 2016 Publication: 30 January 2017 MS 329-204
4

J. Sauvage et al. Data report: quantification of potential drilling contamination
Figure F1. Map of seafloor bathymetry showing Expedition 329 site locations.
Figure F2. Drilling mud pump rate and perfluorocarbon tracer (PFT) delivery rate monitored during drillingoperations and calculated drilling fluid (DF) PFT concentration, Site U1370.
Site U1365
Site U1366
Site U1367
Site U1368
Site U1369
Site U1370
Site U1371
5000
4000
2000
3000
1000
0
2
1.5
0.5
1
0
1
0.8
0.4
0.6
0.2
0
Dril
ling
mud
pum
p ra
te(L
/min
)
Dril
ling
fluid
PF
T c
once
ntra
tion
(mg P
FT /L
DF)
PF
T d
eliv
ery
rate
(m
L/m
in)
Time (days)0 0.5 1 1.5 2 2.5 3 3.5
Proc. IODP | Volume 329 5

J. Sauvage et al. Data report: quantification of potential drilling contamination
Figure F3. Downcore perfluorocarbon tracer (PFT) concentrations, Site U1365.
Figure F4. Downcore perfluorocarbon tracer (PFT) concentrations, Site U1366.
0
20
40
60
80
100
120
Dep
th (
mbs
f)
Interior sample
Exterior sample
Limit of detection
Slightly disturbed sediment
Heavily disturbed sediment
10-5 10-4 10-3 10-2 10-1 1 10-5 10-4 10-3 10-2 10-1 110-5 10-4 10-3 10-2 10-1 1
Hole U1365BPFT concentration(ngPFT/gsediment)
Hole U1365CPFT concentration(ngPFT/gsediment)
Hole U1365DPFT concentration(ngPFT/gsediment)
0
20
40
60
80
100
120
Dep
th (
mbs
f)
Interior sample
Exterior sample
Limit of detection
Slightly disturbed sediment
Heavily disturbed sediment
10-5 10-4 10-3 10-2 10-1 1 10-5 10-4 10-3 10-2 10-1 1
Hole U1366DPFT concentration(ngPFT/gsediment)
Hole U1366FPFT concentration(ngPFT/gsediment)
Proc. IODP | Volume 329 6

J. Sauvage et al. Data report: quantification of potential drilling contamination
Figure F5. Downcore perfluorocarbon tracer (PFT) concentrations, Site U1367.
Figure F6. Downcore perfluorocarbon tracer (PFT) concentrations, Site U1368.
0
20
40
60
80
100
120
Dep
th (
mbs
f)
Interior sample
Exterior sample
Limit of detection
Slightly disturbed sediment
Heavily disturbed sediment
10-5 10-4 10-3 10-2 10-1 1 10-5 10-4 10-3 10-2 10-1 1
Hole U1367CPFT concentration(ngPFT/gsediment)
Hole U1367DPFT concentration(ngPFT/gsediment)
0
20
40
60
80
100
120
Dep
th (
mbs
f)
Interior sample
Exterior sample
Limit of detection
Slightly disturbed sediment
Heavily disturbed sediment
10-5 10-4 10-3 10-2 10-1 1 10-5 10-4 10-3 10-2 10-1 1
Hole U1368CPFT concentration(ngPFT/gsediment)
Hole U1368DPFT concentration(ngPFT/gsediment)
Proc. IODP | Volume 329 7

J. Sauvage et al. Data report: quantification of potential drilling contamination
Figure F7. Downcore perfluorocarbon tracer (PFT) concentrations, Site U1369.
Figure F8. Downcore perfluorocarbon tracer (PFT) concentrations, Site U1370.
0
20
40
60
80
100
120
Dep
th (
mbs
f)
Interior sample
Exterior sample
Limit of detection
Slightly disturbed sediment
Heavily disturbed sediment
10-5 10-4 10-3 10-2 10-1 1 10-5 10-4 10-3 10-2 10-1 1
Hole U1369CPFT concentration(ngPFT/gsediment)
Hole U1369EPFT concentration(ngPFT/gsediment)
0
20
40
60
80
100
120
Dep
th (
mbs
f)
Interior sample
Exterior sample
Limit of detection
Slightly disturbed sediment
Heavily disturbed sediment
10-5 10-4 10-3 10-2 10-1 1 10-5 10-4 10-3 10-2 10-1 1
Hole U1370EPFT concentration(ngPFT/gsediment)
Hole U1370FPFT concentration(ngPFT/gsediment)
Proc. IODP | Volume 329 8

J. Sauvage et al. Data report: quantification of potential drilling contamination
Figure F9. Downcore perfluorocarbon tracer (PFT) concentrations, Site U1371.
0
20
40
60
80
100
120
Dep
th (
mbs
f)
Interior sample
Exterior sample
Limit of detection
Slightly disturbed sediment
Heavily disturbed sediment
10-5 10-4 10-3 10-2 10-1 1 10-5 10-4 10-3 10-2 10-1 1
Hole U1371EPFT concentration
Hole U1371FPFT concentration(ngPFT/gsediment)(ngPFT/gsediment)
Proc. IODP | Volume 329 9

J. Sauvage et al. Data report: quantification of potential drilling contamination
Table T1. Detection limits, drilling fluid equivalents, and nonindigenous cells equivalents, Sites U1365–U1371.
PFT = perfluorocarbon tracer.
Table T2. Perfluorocarbon tracer (PFT) concentration results, Holes U1365B–U1365D.
BD = below detection, NA = not applicable. DF = drilling fluid.
Holes
Detection limit
PFT in sample(ng)
Drilling fluidequivalent (µL)
Cells equivalent(cells)
U1365B–U1365D 2.17E–03 2.44E–03 0.4U1366D and U1366F 1.06E–03 1.19E–03 0.2U1367C and U1367D 1.18E–03 1.32E–03 0.2U1368C and U1368D 1.03E–03 1.16E–03 0.2U1369C and U1369E 1.29E–03 1.46E–03 0.2U1370E and U1370F 1.33E–03 1.50E–03 0.3U1371E and U1371F 1.65E–03 1.86E–03 0.3
Core,section
Depth(mbsf) Lithology
Coringdisturbance
intensity
Contamination
Exterior Interior
(ngPFT/g) (µLDF/g) (Cells/g) (ngPFT/g) (µLDF/g) (Cells/g)
329-U1365B-1H-1 1.5 Metalliferous clay Very 7.59E–02 5.79E–01 99 4.15E–01 3.73E+00 6332H-4 10.1 Metalliferous clay None BD BD BD 5.92E–02 5.74E–01 983H-4 18.9 Pelagic clay None BD BD BD BD BD BD3H-4 19.6 Pelagic clay None BD BD BD 1.35E–03 1.39E–02 24H-4 29.1 Pelagic clay None BD BD BD 1.60E–03 1.56E–02 35H-4 38.6 Zeolitic metalliferous pelagic clay None 4.74E–03 4.93E–02 8 1.08E–03 1.12E–02 28H-2 66.0 Metalliferous clay None 3.05E–03 2.99E–02 5 2.89E–03 2.94E–02 59H-3 71.5 Metalliferous clay None 1.78E–03 1.72E–02 3 2.18E–03 2.14E–02 4
329-U1365C-1H-2 2.7 Metalliferous clay None 1.28E–03 1.29E–02 2 1.17E–03 1.20E–02 21H-3 3.8 Metalliferous clay None 1.71E–02 1.78E–01 30 6.66E–04 6.94E–03 11H-4 5.2 Metalliferous clay None 7.63E–04 7.96E–03 1 1.71E–03 1.78E–02 33H-2 17.2 Metalliferous clay None BD BD BD BD BD BD3H-2 17.9 Metalliferous clay None 7.65E–03 7.90E–02 13 1.40E–03 1.45E–02 23H-3 19.3 Metalliferous clay None 2.20E–03 2.28E–02 4 8.49E–04 8.94E–03 23H-4 20.1 Metalliferous clay None 1.76E–03 1.83E–02 3 BD BD BD3H-5 22.0 Metalliferous clay None 2.47E–03 2.54E–02 4 2.07E–03 2.14E–02 44H-2 26.9 Metalliferous clay None 2.44E–03 2.52E–02 4 1.96E–03 2.03E–02 34H-2 27.5 Metalliferous clay None 1.87E–03 1.94E–02 3 3.51E–03 3.70E–02 64H-3 28.5 Metalliferous clay None 9.31E–03 9.65E–02 16 BD BD BD4H-4 29.6 Metalliferous clay None 8.79E–03 9.07E–02 15 1.12E–03 1.16E–02 24H-4 30.0 Metalliferous clay None 9.31E–04 9.55E–03 2 3.61E–03 3.75E–02 64H-6 32.7 Metalliferous clay None BD BD BD 1.23E–03 1.28E–02 25H-1 35.4 Metalliferous clay None 1.15E–03 1.24E–02 2 2.19E–03 2.26E–02 45H-2 36.8 Metalliferous clay Very 4.46E–03 4.55E–02 8 1.55E–03 1.58E–02 37H-3 66.3 Metalliferous clay None 9.35E–04 9.27E–03 2 9.14E–04 9.10E–03 28H-1 68.4 Chert-metalliferous clay None BD BD BD BD BD BD8H-2 69.9 Metalliferous clay None 1.21E–03 1.19E–02 2 6.58E–04 6.42E–03 18H-3 70.3 Metalliferous clay None 6.55E–04 6.44E–03 1 2.50E–03 2.44E–02 48H-2 73.7 Metalliferous clay None 4.56E–04 4.44E–03 1 5.35E–03 5.10E–02 99H-3 74.6 Metalliferous clay Slightly 2.24E–03 2.25E–02 4 BD BD BD
329-U1365D-1H-1 1.5 Metalliferous clay Very 3.34E–03 3.38E–02 6 BD BD BD1H-2 2.6 Metalliferous clay Slightly BD BD BD BD BD BD1H-3 3.8 Metalliferous clay None 1.06E–02 1.10E–01 19 BD BD BD1H-4 5.2 Metalliferous clay None 2.11E–03 2.20E–02 4 1.22E–03 1.29E–02 21H-5 6.5 Metalliferous clay None 2.66E–02 2.76E–01 47 2.66E–03 2.72E–02 51H-6 7.9 Metalliferous clay None 1.00E–03 1.03E–02 2 BD BD BD2H-1 10.3 Metalliferous clay None 3.30E–03 3.46E–02 6 BD BD BD2H-2 11.7 Metalliferous clay None 3.13E–02 3.28E–01 56 2.78E–03 2.87E–02 52H-3 13.1 Metalliferous clay None 9.68E–03 1.02E–01 17 BD BD BD2H-5 16.0 Metalliferous clay None 2.03E–03 2.09E–02 4 NA NA NA
Proc. IODP | Volume 329 10

J. Sauvage et al. Data report: quantification of potential drilling contamination
Table T3. Perfluorocarbon tracer (PFT) concentration results, Holes U1366D and U1366F.
BD = below detection. DF = drilling fluid.
Table T4. Perfluorocarbon tracer (PFT) concentration results, Holes U1367C and U1367D.
BD = below detection, NA = not applicable. DF = drilling fluid.
Core,section
Depth(mbsf) Lithology
Coringdisturbance
intensity
Contamination
Exterior Interior
(ngPFT/g) (µLDF/g) (Cells/g) (ngPFT/g) (µLDF/g) (Cells/g)
329-U1366D-1H-1 1.0 Metalliferous clay Slightly BD BD BD BD BD BD1H-3 4.0 Metalliferous clay None BD BD BD BD BD BD1H-5 7.0 Metalliferous clay None BD BD BD BD BD BD2H-1 10.4 Metalliferous clay None BD BD BD BD BD BD2H-3 13.4 Metalliferous clay None BD BD BD 4.55E–04 4.60E–03 1
329-U1366F-1H-1 1.5 Metalliferous clay None 1.06E–03 1.04E–02 2 7.88E–03 7.88E–02 131H-2 2.6 Metalliferous clay None 8.68E–02 8.60E–01 146 1.55E–03 1.52E–02 31H-3 3.6 Metalliferous clay None 1.19E–03 1.16E–02 2 2.35E–04 2.27E–03 01H-4 4.9 Metalliferous clay None 7.64E–04 7.59E–03 1 1.57E–03 1.57E–02 32H-1 6.1 Metalliferous clay None 1.08E–03 1.06E–02 2 4.85E–04 4.74E–03 12H-3 9.8 Metalliferous clay None 2.62E–04 2.61E–03 0 3.27E–04 3.26E–03 12H-4 10.7 Metalliferous clay None 1.99E–03 1.99E–02 3 4.84E–04 4.74E–03 12H-5 11.9 Metalliferous clay None 3.08E–04 3.00E–03 1 2.62E–04 2.56E–03 02H-6 13.4 Metalliferous clay None 4.86E–04 4.81E–03 1 BD BD BD3H-1 14.3 Metalliferous clay Very 3.85E–03 3.79E–02 6 8.91E–03 8.79E–02 153H-2 15.8 Metalliferous clay None 2.06E–03 2.06E–02 4 1.66E–04 1.65E–03 03H-3 17.6 Metalliferous clay None BD BD BD BD BD BD3H-4 19.6 Metalliferous clay None 2.76E–04 2.78E–03 0 6.27E–04 6.28E–03 13H-6 21.8 Metalliferous clay None 2.28E–03 2.25E–02 4 BD BD BD4H-2 25.5 Metalliferous clay Very 8.05E–03 8.04E–02 14 4.02E–04 4.11E–03 14H-4 28.1 Metalliferous clay None BD BD BD BD BD BD4H-5 29.8 Metalliferous clay Very 2.20E–04 2.12E–03 0 7.47E–04 7.48E–03 1
Core,section
Depth(mbsf) Lithology
Coringdisturbance
intensity
Contamination
Exterior Interior
(ngPFT/g) (µLDF/g) (Cells/g) (ngPFT/g) (µLDF/g) (Cells/g)
329-U1367C-1H-1 1.4 Metalliferous clay None 1.82E–04 2.16E–03 0 7.26E–03 8.23E–02 141H-3 4.4 Metalliferous clay None 5.81E–04 7.06E–03 1 BD BD BD1H-5 6.9 Nannofossil ooze Slightly BD BD BD BD BD BD2H-1 8.7 Nannofossil ooze None BD BD BD BD BD BD2H-3 11.7 Nannofossil ooze None BD BD BD BD BD BD2H-5 14.7 Clay-bearing nannofossil ooze None NA NA NA BD BD BD3H-2 18.2 Clay-bearing nannofossil ooze None BD BD BD BD BD BD3H-6 23.6 Nannofossil chalk Flow in; slurry BD BD BD BD BD BD
329-U1367D-1H-1 1.5 Metalliferous clay None BD BD BD 7.84E–03 1.02E–01 171H-2 2.9 Metalliferous clay None 1.69E–02 3.02E–01 51 BD BD BD1H-3 3.6 Metalliferous clay None 7.42E–03 1.06E–01 18 5.08E–04 6.60E–03 11H-4 4.9 Metalliferous clay None 9.02E–03 1.18E–01 20 NA NA NA1H-5 6.5 Metalliferous clay None 6.30E–04 8.18E–03 1 BD BD BD2H-1 7.9 Nannofossil ooze Very 4.50E–02 5.28E–01 90 1.14E–03 1.34E–02 22H-2 9.9 Nannofossil ooze Slightly 9.46E–03 1.25E–01 21 BD BD BD2H-3 10.8 Nannofossil ooze Slightly BD BD BD 1.52E–02 1.90E–01 322H-4 12.3 Nannofossil ooze Slightly 1.27E–02 1.55E–01 26 BD BD BD2H-5 13.7 Nannofossil ooze Slightly 7.41E–02 8.69E–01 148 1.22E–03 1.45E–02 22H-6 15.3 Clay-bearing nannofossil ooze Slightly 3.19E–02 4.25E–01 72 1.03E–02 1.26E–01 213H-1 17.9 Clay-bearing nannofossil ooze Slightly 2.59E–02 2.82E–01 48 1.06E–02 1.29E–01 223H-2 19.0 Clay-bearing nannofossil ooze Slightly 1.57E–02 1.95E–01 33 BD BD BD3H-3 20.3 Clay-bearing nannofossil ooze Slightly BD BD BD 7.95E–05 9.59E–04 03H-3 21.3 Clay-bearing nannofossil ooze None 1.41E–01 1.87E+00 317 1.38E–03 1.56E–02 33H-4 22.8 Clay-bearing nannofossil ooze Slightly 3.08E–03 3.65E–02 6 1.94E–02 2.41E–01 413H-5 23.0 Clay-bearing nannofossil ooze None 3.32E–04 3.87E–03 1 BD BD BD3H-6 25.0 Metalliferous clay None 5.69E–03 7.20E–02 12 4.45E–04 5.96E–03 1
Proc. IODP | Volume 329 11
J. Sauvage et al. Data report: quantification of potential drilling contamination
Table T5. Perfluorocarbon tracer (PFT) concentration results, Holes U1368C and U1368D.
BD = below detection, NA = not applicable. DF = drilling fluid.
Table T6. Perfluorocarbon tracer (PFT) concentration results, Holes U1369C and U1369E.
BD = below detection, NA = not applicable. DF = drilling fluid.
Core,section
Depth(mbsf) Lithology
Coringdisturbance
intensity
Contamination
Exterior Interior
(ngPFT/g) (µLDF/g) (Cells/g) (ngPFT/g) (µLDF/g) (Cells/g)
329-U1368C-1H-1 0.1 Clay-bearing nannofossil ooze None 2.00E+00 2.50E+01 4246 1.11E–02 1.39E–01 241H-1 1.4 Clay-bearing nannofossil ooze None 1.34E–02 1.76E–01 30 3.18E–02 4.52E–01 771H-2 2.9 Clay-bearing nannofossil ooze None 5.83E–02 7.34E–01 125 6.29E–03 7.53E–02 131H-3 4.4 Clay-bearing nannofossil ooze None 3.14E–02 3.80E–01 65 1.19E–02 1.45E–01 251H-4 5.9 Clay-bearing nannofossil ooze None 9.22E–03 1.08E–01 18 6.80E–03 7.81E–02 131H-5 7.4 Clay-bearing nannofossil ooze Slightly 3.10E–02 3.77E–01 64 NA NA NA2H-1 9.4 Clay-bearing nannofossil ooze Slightly 3.03E–03 3.56E–02 6 1.53E+00 1.77E+01 30112H-2 10.9 Clay-bearing nannofossil ooze Slightly 1.58E–02 1.92E–01 33 NA NA NA2H-3 12.4 Nannofossil marl Slightly 7.80E–03 1.04E–01 18 NA NA NA2H-4 13.9 Nannofossil marl Slightly 7.47E–02 8.96E–01 152 2.30E–02 2.84E–01 482H-5 15.4 Nannofossil-bearing clay Very 2.11E–02 2.73E–01 46 8.60E–02 9.80E–01 167
329-U1368D-1H-1 1.3 Clay-bearing nannofossil ooze Slightly 9.80E–03 1.54E–01 26 BD BD BD1H-2 2.7 Clay-bearing nannofossil ooze None 7.46E–03 9.60E–02 16 1.81E–04 2.46E–03 01H-3 3.8 Clay-bearing nannofossil ooze None 2.51E–04 3.29E–03 1 2.11E–02 3.18E–01 541H-4 5.0 Clay-bearing nannofossil ooze None 2.05E–04 3.50E–03 1 5.37E–03 7.08E–02 121H-5 7.3 Clay-bearing nannofossil ooze Slightly 2.16E–02 2.73E–01 46 1.68E–03 2.06E–02 32H-1 8.5 Clay-bearing nannofossil ooze Slightly 2.59E–02 3.45E–01 59 7.06E–04 1.05E–02 22H-2 9.8 Clay-bearing nannofossil ooze None 2.86E–04 3.53E–03 1 BD BD BD2H-3 11.2 Nannofossil marl None 5.93E–03 7.35E–02 13 4.14E–02 5.86E–01 1002H-4 13.5 Nannofossil-bearing clay None 1.50E–03 1.91E–02 3 1.31E–04 1.64E–03 02H-5 14.8 Nannofossil-bearing clay None 1.43E–02 1.67E–01 28 4.25E–04 5.08E–03 1
Core,section
Depth(mbsf) Lithology
Coringdisturbance
intensity
ContaminationExterior Interior
(ngPFT/g) (µLDF/g) (Cells/g) (ngPFT/g) (µLDF/g) (Cells/g)
329-U1369C-1H-1 0.2 Metalliferous clay None 2.15E–04 3.19E–03 1 BD BD BD1H-1 1.4 Metalliferous clay None 6.68E–04 1.19E–02 2 BD BD BD1H-2 2.9 Metalliferous clay None 5.40E–03 7.85E–02 13 6.23E–03 9.60E–02 161H-3 4.4 Metalliferous clay None BD BD BD 1.02E–02 1.60E–01 271H-4 5.8 Metalliferous clay None 6.12E–03 8.42E–02 14 1.28E–02 1.69E–01 292H-1 7.4 Metalliferous clay None 4.95E–03 7.01E–02 12 9.00E–03 1.01E–01 172H-2 8.9 Metalliferous clay None 8.25E–03 1.04E–01 18 1.88E–02 2.66E–01 452H-4 11.9 Metalliferous clay None BD BD BD BD BD BD2H-5 13.4 Metalliferous clay None BD BD BD 6.76E–03 8.38E–02 142H-6 14.9 Metalliferous clay None NA NA NA BD BD BD2H-7 15.7 Metalliferous clay None 6.14E–03 7.67E–02 13 5.60E–03 8.05E–02 14
329-U1369E-1H-1 1.5 Metalliferous clay None 2.09E–02 2.76E–01 47 6.99E–04 9.31E–03 21H-2 2.7 Metalliferous clay None 4.45E–02 6.78E–01 115 NA NA NA1H-4 4.9 Metalliferous clay None 3.57E–02 5.49E–01 93 4.77E–02 8.31E–01 1412H-1 7.7 Metalliferous clay None BD BD BD 2.14E–02 2.85E–01 482H-2 9.6 Metalliferous clay None 1.30E–02 1.76E–01 30 2.32E–02 3.22E–01 552H-3 10.3 Metalliferous clay None 4.78E–03 7.64E–02 13 NA NA NA2H-4 11.9 Metalliferous clay None NA NA NA BD BD BD2H-5 13.9 Metalliferous clay None 1.78E–02 2.32E–01 39 1.58E–02 2.00E–01 342H-6 15.2 Metalliferous clay Very 2.81E–02 4.11E–01 70 1.78E–02 2.64E–01 45
Proc. IODP | Volume 329 12

J. Sauvage et al. Data report: quantification of potential drilling contamination
Table T7. Perfluorocarbon tracer (PFT) concentration results, Holes U1370E and U1370F. (Continued on nextpage.)
Core,section
Depth(mbsf) Lithology
Coringdisturbance
intensity
ContaminationExterior Interior
(ngPFT/g) (µLDF/g) (Cells/g) (ngPFT/g) (µLDF/g) (Cells/g)
329-U1370E-1H-1 1.4 Metalliferous clay None BD BD BD BD BD BD1H-2 2.9 Metalliferous clay None BD BD BD BD BD BD1H-3 4.3 Metalliferous clay None 1.33E–03 2.68E–02 5 BD BD BD1H-4 6.0 Metalliferous clay None 2.63E–04 3.39E–03 1 2.23E–04 2.78E–03 02H-1 7.6 Metalliferous clay None 1.66E–03 2.93E–02 5 4.55E–04 1.53E–02 32H-2 9.1 Metalliferous clay None BD BD BD BD BD BD2H-3 10.6 Metalliferous clay None 4.33E–04 6.05E–03 1 2.91E–04 3.66E–03 12H-4 12.0 Metalliferous clay None 5.11E–03 6.75E–02 11 BD BD BD2H-5 13.6 Metalliferous clay None BD BD BD 3.17E–03 4.10E–02 72H-6 14.9 Metalliferous clay None BD BD BD 2.54E–04 3.18E–03 13H-1 17.1 Metalliferous clay None 5.35E–04 8.85E–03 2 BD BD BD3H-2 18.6 Metalliferous clay None 1.24E–03 1.78E–02 3 BD BD BD3H-3 20.1 Metalliferous clay None 2.35E–04 3.26E–03 1 2.97E–03 6.55E–02 113H-4 21.5 Metalliferous clay None 1.49E–03 1.99E–02 3 BD BD BD3H-5 23.1 Metalliferous clay None BD BD BD BD BD BD3H-6 23.8 Metalliferous clay None 2.59E–04 3.31E–03 1 BD BD BD4H-1 26.6 Metalliferous clay None 2.28E–04 3.25E–03 1 BD BD BD4H-2 28.1 Metalliferous clay None BD BD BD BD BD BD4H-3 29.6 Metalliferous clay None BD BD BD BD BD BD4H-5 32.6 Metalliferous clay None 5.62E–04 8.49E–03 1 BD BD BD4H-6 33.2 Metalliferous clay None BD BD BD BD BD BD5H-1 36.1 Metalliferous clay None BD BD BD BD BD BD5H-2 37.5 Metalliferous clay None BD BD BD 2.68E–04 3.20E–03 15H-3 39.0 Metalliferous clay None 2.56E–04 4.06E–03 1 BD BD BD5H-4 40.4 Metalliferous clay None BD BD BD BD BD BD5H-5 42.0 Metalliferous clay None BD BD BD BD BD BD5H-6 42.7 Metalliferous clay None BD BD BD BD BD BD6H-1 45.6 Metalliferous clay None BD BD BD 3.61E–04 4.72E–03 16H-2 47.0 Metalliferous clay None BD BD BD BD BD BD6H-3 48.5 Metalliferous clay None BD BD BD BD BD BD6H-4 50.0 Metalliferous clay None 4.45E–04 5.22E–03 1 1.09E–04 1.51E–03 06H-5 51.1 Metalliferous clay Slurry BD BD BD BD BD BD8H-2 58.3 Metalliferous clay Very 4.34E–04 5.20E–03 1 BD BD BD8H-3 59.8 Metalliferous clay Very BD BD BD 3.70E–04 5.40E–03 18H-4 61.2 Metalliferous clay Very BD BD BD BD BD BD8H-5 62.8 Pelagic clay Very BD BD BD 1.58E–03 2.00E–02 39H-1 63.5 Pelagic clay Very BD BD BD 5.96E–04 7.08E–03 18H-6 64.3 Pelagic clay Very 2.80E–04 4.23E–03 1 BD BD BD9H-2 65.0 Pelagic clay Very NA NA NA BD BD BD
329-U1370F-1H-1 1.5 Metalliferous clay None 3.87E–04 6.41E–03 1 BD BD BD1H-2 3.0 Metalliferous clay None BD BD BD BD BD BD1H-3 4.1 Metalliferous clay None 4.42E–03 6.10E–02 10 BD BD BD1H-4 5.1 Metalliferous clay None 8.96E–03 1.35E–01 23 BD BD BD2H-1 7.9 Metalliferous clay None 1.93E–03 2.56E–02 4 BD BD BD2H-3 10.7 Metalliferous clay None 6.62E–04 9.09E–03 2 BD BD BD2H-5 13.1 Metalliferous clay None BD BD BD BD BD BD3H-2 18.6 Metalliferous clay None BD BD BD BD BD BD3H-5 22.7 Metalliferous clay None BD BD BD BD BD BD4H-3 29.8 Metalliferous clay None BD BD BD BD BD BD4H-5 32.2 Metalliferous clay None BD BD BD BD BD BD5H-2 37.9 Metalliferous clay None BD BD BD BD BD BD5H-3 39.6 Metalliferous clay None BD BD BD BD BD BD5H-4 41.1 Metalliferous clay None BD BD BD BD BD BD5H-5 42.0 Metalliferous clay None BD BD BD BD BD BD5H-5 42.6 Metalliferous clay None BD BD BD BD BD BD6H-2 47.6 Metalliferous clay None BD BD BD BD BD BD6H-3 48.7 Metalliferous clay None BD BD BD BD BD BD6H-3 49.1 Metalliferous clay None BD BD BD BD BD BD6H-4 50.6 Metalliferous clay None BD BD BD BD BD BD6H-5 51.1 Metalliferous clay None BD BD BD NA NA NA6H-5 52.1 Metalliferous clay None BD BD BD BD BD BD7H-1 55.6 Metalliferous clay None BD BD BD BD BD BD7H-2 56.8 Metalliferous clay None BD BD BD BD BD BD7H-2 57.1 Metalliferous clay None BD BD BD BD BD BD
Proc. IODP | Volume 329 13
J. Sauvage et al. Data report: quantification of potential drilling contamination
BD = below detection, NA = not applicable. DF = drilling fluid.
Table T8. Perfluorocarbon tracer (PFT) concentration results, Holes U1371E and U1371F. (Continued on nextpage.)
7H-3 57.7 Metalliferous clay None BD BD BD 4.04E–03 5.00E–02 87H-3 58.6 Metalliferous clay None BD BD BD BD BD BD7H-4 59.6 Metalliferous clay None BD BD BD BD BD BD7H-4 60.0 Metalliferous clay None BD BD BD BD BD BD7H-5 61.1 Metalliferous clay None BD BD BD BD BD BD7H-5 61.6 Metalliferous clay None BD BD BD BD BD BD7H-6 63.1 Metalliferous clay None BD BD BD 3.10E–05 3.86E–04 BD8H-1 64.7 Metalliferous clay Very 8.81E–03 1.13E–01 19 BD BD BD
Core,section
Depth(mbsf) Lithology
Coringdisturbance
intensity
ContaminationExterior Interior
(ngPFT/g) (µLDF/g) (Cells/g) (ngPFT/g) (µLDF/g) (Cells/g)
329-U1371E-1H-1 1.4 Diatom ooze None BD BD BD 5.24E–04 7.05E–03 11H-2 2.9 Diatom ooze None BD BD BD BD BD BD1H-3 4.3 Diatom ooze None BD BD BD BD BD BD1H-4 5.9 Diatom ooze None BD BD BD BD BD BD1H-5 7.4 Diatom ooze None BD BD BD BD BD BD1H-6 8.0 Diatom ooze None BD BD BD BD BD BD2H-1 9.6 Diatom ooze None BD BD BD BD BD BD2H-2 11.1 Diatom ooze None BD BD BD BD BD BD2H-3 12.6 Diatom ooze None BD BD BD BD BD BD2H-4 14.1 Diatom ooze None BD BD BD BD BD BD2H-5 15.1 Diatom ooze None BD BD BD BD BD BD3H-2 20.6 Diatom ooze None BD BD BD BD BD BD3H-3 22.0 Diatom ooze None BD BD BD BD BD BD3H-4 23.6 Diatom ooze None BD BD BD BD BD BD3H-5 24.9 Diatom ooze None BD BD BD BD BD BD3H-6 25.4 Diatom ooze None BD BD BD BD BD BD4H-1 28.6 Diatom ooze None BD BD BD NA NA NA4H-2 30.1 Diatom ooze None BD BD BD BD BD BD4H-3 31.6 Diatom ooze None BD BD BD BD BD BD4H-4 33.1 Diatom ooze None BD BD BD BD BD BD4H-5 34.4 Diatom ooze None BD BD BD BD BD BD5H-1 38.1 Diatom ooze None BD BD BD BD BD BD5H-2 39.6 Diatom ooze None BD BD BD BD BD BD5H-3 41.1 Diatom ooze None BD BD BD BD BD BD5H-4 42.6 Diatom ooze None BD BD BD BD BD BD5H-5 43.3 Diatom ooze None BD BD BD BD BD BD6H-3 50.6 Diatom ooze Very BD BD BD BD BD BD6H-5 53.6 Diatom ooze None BD BD BD BD BD BD7H-1 57.1 Diatom ooze None BD BD BD BD BD BD7H-2 58.6 Diatom ooze None BD BD BD BD BD BD7H-3 60.0 Diatom ooze None BD BD BD BD BD BD7H-4 61.7 Diatom ooze None BD BD BD BD BD BD7H-5 63.1 Diatom ooze None BD BD BD BD BD BD7H-6 64.5 Diatom ooze None BD BD BD BD BD BD8H-1 66.6 Diatom ooze Very BD BD BD BD BD BD8H-3 69.6 Diatom ooze None BD BD BD BD BD BD8H-4 70.5 Diatom ooze None BD BD BD BD BD BD8H-5 72.6 Diatom ooze None BD BD BD BD BD BD8H-6 73.5 Diatom ooze None BD BD BD BD BD BD9H-2 76.5 Diatom ooze None BD BD BD BD BD BD9H-3 77.4 Diatom ooze None BD BD BD BD BD BD9H-4 79.5 Diatom ooze None BD BD BD BD BD BD9H-5 80.4 Diatom ooze None BD BD BD BD BD BD9H-6 82.5 Diatom ooze None BD BD BD BD BD BD9H-7 83.2 Diatom ooze None BD BD BD BD BD BD10H-1 85.6 Diatom ooze None BD BD BD BD BD BD10H-2 86.7 Diatom ooze None BD BD BD 3.29E–04 4.67E–03 110H-3 88.6 Diatom ooze None BD BD BD BD BD BD
Core,section
Depth(mbsf) Lithology
Coringdisturbance
intensity
ContaminationExterior Interior
(ngPFT/g) (µLDF/g) (Cells/g) (ngPFT/g) (µLDF/g) (Cells/g)
Table T7 (continued).
Proc. IODP | Volume 329 14

J. Sauvage et al. Data report: quantification of potential drilling contamination
BD = below detection, NA = not applicable. DF = drilling fluid.
10H-4 89.5 Diatom ooze None BD BD BD BD BD BD10H-5 91.6 Diatom ooze None BD BD BD BD BD BD10H-6 92.7 Diatom ooze None BD BD BD BD BD BD11H-1 95.1 Diatom ooze None BD BD BD BD BD BD11H-2 96.0 Diatom ooze None NA NA NA BD BD BD11H-3 98.0 Diatom ooze None 4.04E–04 5.09E–03 1 BD BD BD11H-4 98.9 Diatom ooze None BD BD BD BD BD BD11H-5 101.1 Diatom ooze None BD BD BD BD BD BD11H-6 102.2 Diatom ooze None BD BD BD BD BD BD12H-2 106.1 Diatom ooze None BD BD BD BD BD BD12H-3 107.5 Diatom ooze None BD BD BD BD BD BD12H-4 108.8 Diatom ooze None BD BD BD BD BD BD13H-1 114.1 Zeolitic metalliferous clay None BD BD BD BD BD BD13H-2 115.6 Zeolitic metalliferous clay None BD BD BD BD BD BD13H-3 117.0 Zeolitic metalliferous clay None BD BD BD BD BD BD13H-4 117.7 Zeolitic metalliferous clay None BD BD BD BD BD BD13H-4 118.6 Zeolitic metalliferous clay None BD BD BD BD BD BD13H-5 120.1 Metalliferous clay None BD BD BD BD BD BD13H-6 121.6 Metalliferous clay None BD BD BD BD BD BD13H-7 122.0 Metalliferous clay None BD BD BD BD BD BD14H-1 123.6 Metalliferous clay None BD BD BD BD BD BD14H-2 125.1 Metalliferous clay None BD BD BD BD BD BD14H-3 126.5 Metalliferous clay None BD BD BD BD BD BD14H-4 128.0 Metalliferous clay None BD BD BD BD BD BD14H-5 129.5 Metalliferous clay Very BD BD BD BD BD BD14H-6 130.2 Metalliferous clay Very BD BD BD NA NA NA
329-U1371F-1H-1 1.4 Diatom ooze None BD BD BD BD BD BD1H-2 2.8 Diatom ooze None BD BD BD BD BD BD1H-3 4.1 Diatom ooze None BD BD BD BD BD BD1H-4 5.2 Diatom ooze None BD BD BD BD BD BD1H-5 6.6 Diatom ooze None BD BD BD BD BD BD2H-2 11.8 Diatom ooze None BD BD BD BD BD BD2H-4 14.1 Diatom ooze None BD BD BD BD BD BD14H-3 126.9 Metalliferous clay None BD BD BD BD BD BD14H-4 127.8 Metalliferous clay None BD BD BD NA NA NA14H-4 128.9 Metalliferous clay None BD BD BD BD BD BD
Core,section
Depth(mbsf) Lithology
Coringdisturbance
intensity
ContaminationExterior Interior
(ngPFT/g) (µLDF/g) (Cells/g) (ngPFT/g) (µLDF/g) (Cells/g)
Table T8 (continued).
Proc. IODP | Volume 329 15

J. Sauvage et al. Data report: quantification of potential drilling contamination
Appendix APreparation of standards for gas
chromatograph calibration1. PFT dilution series in methanol (MEOH):
10–2 = 9.9 mL MEOH + 0.1 mL PFT10–4 = 9.9 mL MEOH + 0.1 mL 10–2 PFT10–6 = 9.9 mL MEOH + 0.1 mL 10–4 PFT10–8 = 9.9 mL MEOH + 0.1 mL 10–6 PFT
2. Transfer 10 µL aliquots of each dilution into du-plicate 20 mL capacity headspace vials, seal eachwith a polytetrafluoroethylene (PTFE)/silica sep-tum, and label appropriately.
3. Heat the vials at 70°C for 30 min along with the3 m gas-tight plastic syringes and needles thatwill be used for analysis. A rotation of 4 needlesmay be used, provided that each is allocated a 30min heating period between sequential usages.
4. Inject either 0.5, 1.0, or 2.0 mL of each standard’sheadspace gas into the gas chromatograph onseparate runs using the 3 mL plastic syringe af-fixed with a luer fitting for stainless steel needles.
5. Integrate the peak area for each injection. Con-vert the PFT:MEOH dilution to PFT(g) using thefollowing formula:
PFT(g) = Vinjected × Cstd,
whereVinjected = standard volume injected,Cstd = ρPFT × df × VSTD_solution/Vheadspace in
grams PFT/volume headspace,ρPFT = density of PFT (i.e., 1.78 g/L),df = dilution factor, ratio (vol:vol) of
pure PFT:total solution,VSTD_solution = volume of diluted standard solu-
tion in vial, andVheadspace = volume of headspace.
6. Plot log[PFT(g)] against log[peak area] and per-form regression analysis to determine the calibra-tion sensitivity. See Appendix B.
Proc. IODP | Volume 329
Appendix BGas chromatograph calibration
sensitivity for PFT analysis1. Perform the procedures for standard dilutions,
injections, and peak integrations as described inAppendix A. Record the injection volume, dilu-tion used, and peak area for each standard from agiven site, organized by date of sample analysis.
2. For each site, plot the log of the PFT(g) containedin each injection against the log of the standard’sintegrated peak area (log[PFT injected] vs.log[peak area]). If necessary, discriminate be-tween standards run on different dates by plot-ting them as separate series.
3. For each separate date of standard analysis (eachseries), add a linear trend line and display all cor-responding equations.
4. From the trend line equations of the followingformat, record each series’ m and b values:
y = mx + b,
wherey = log of peak area,x = log of mass injected,b = intercept derived from the calibration
curve, andm = slope derived from the calibration curve.
5. Average the m and b values for each site. This im-plies that peak area = 10b (PFT mass injected)m.
6. Use the average m and b values from each site toform the final calibration trend line (insert theminto the generalized linear equation of y = mx +b).
16

J. Sauvage et al. Data report: quantification of potential drilling contamination
Appendix CGas chromatograph
detection limit analysis1. Using a heated 3 mL gas-tight plastic syringe, per-
form 2 mL injections of outside laboratory air(blanks) both at the start and end of each day’ssample analysis. Also run a blank injection im-mediately following any sample that produces anunusually high peak area. Expedition 329 blankvials containing ambient coring air are also runthroughout analysis.
2. Compile a list of all blank peak areas producedfrom injections of ambient coring air runthroughout Expedition 329 sample analysis.
3. Calculate the average blank peak area from thiscompilation and use this value for the blank cor-rection of measured peak areas.
4. Calculate the standard deviation of all blank peakareas.
5. The detection limit for blank corrected samplesequals three standard deviations of all blank peakareas.
Proc. IODP | Volume 329
Appendix DMethod for calculating the amount
of drill water contaminationThe following equation implies that peak area = 10b
(PFT mass injected)m:
drill water (L)/core material (g) = [(PBC/10b)1/m]/(CDW× W × F1),
where
PBC = blank corrected integrated peak area of PFTin injected sample (in arbitrary units),
b = intercept derived from the calibration curve,m = slope derived from the calibration curve,CDW = PFT concentration in drilling fluid (in
grams/liter),W = weight of sediment sample (in grams), andF1 = fraction of total headspace injected:
F1 = Vinj/[Vvial – (W/ρbulk)],
where
Vinj = volume of sample injected (in liters),Vvial = volume of vial (in liters),ρbulk = sediment sample density (in grams/liter),
andW = weight of sample (in grams).
17