Embed Size (px)
Citation preview

The creativity and innovation catastropheSmartphone patent wars Who is suing whom
2015 top 100 global innovators
Top 5 most innovative industriesNumber of US patent litigation cases against companies in the first half of 2015
Chemical
Electrical components
Automotive
Pharmaceutical
Computer hardware
2015 top 15 patent assignees
ipwatchdog.com’s favourite patent issued in 2015 went to Astrium for their patent for a satellite that retransmits sunlight to earth for growing crops
6TOSHIBA
2,627
7SONY2,455
8 LG
2,242
9INTEL2,048
10MICROSOFT
1,956
11APPLE1,938
12SAMSUNGDISPLAY
1,838
13TSM*1,774
14GE
1,757
15RICOH1,627
APPLE HP ACTIVAS AMAZON
VIMETX
APPLEGRAPHICS
PROPERTIESHOLDINGS
HTC
MOTOROLA
VIA TECHNOLOGIES
KODAK
RIM
OPENWAVE
SONY ERICSSON
LG
MICROSOFT
ORACLEGEMALTO
SAMSUNG
PANTECH
HUAWEI
ZTE
NOKIA
DIGITUDEINNOVATIONS
INTERDIGITAL
SAMSUNG
35 33 32 25 24 1 3
2 4
5
Rank Country Companies Listed
1 Japan 40% 2 USA 35% 3 France 10% 4 Germany 4% 5 South Korea 3% 6 Switzerland 3% 7 Belgium 1% 8 Canada 1% 9 Netherlands 1% 10 Sweden 1%
1IBM
7,355
2SAMSUNG
ELECTRONICS5,072
3CANON1,134
4QUALCOMM
2,900
5GOOGLE
2,835
Sources: IFI Claims | USPTO | Statistica
* Taiwan Semiconductor Manufacturing
Sources: BBC | Bloomber | CNN Money CNET | Forbes | InfoWorld | LexisNexis | MarketWatch | Microsoft | MSNBC New York Times | PC World | Reuters | SEC Filings | TechCrunch | Unified PatentsWall | Street Journal
Sources: Thomson Reuters Derwent Word Patents Index | stateofinnovation.com
There was a time when “creative” was reserved for a distinguished group of right-brain professions - writers, musicians, artists, animators, and designers etc., who alongside craftsmen and makers were revered for their individuality and imagination.
But suddenly swathes of consultants are proposing every left-brained pin-striped knowledge economy employee needs to be thinking creatively.
Their suggestion – that creativity has become a critical skill for continued success in developed economies, is backed with compelling evidence – just scan any list of the world’s most successful companies. But the blanket application of programmes to make you more creative smacks to me of Wild West secret elixir medicine shows.
In February 2014, Google purchased a little known but highly creative tech business called Nest Labs. Nest Labs make internet enabled thermostats. What stood Nest Labs apart was that while other domestic thermostat manufacturers concentrated on incorporating
unimaginative novelties, Nest Labs focused on creating a device that would learn how a family used their home.
They argued that the complexity and unpredictability of modern family life made it nearly impossible to program a thermostat with a regular schedule. Equipped with sensors that detect whether people are in the house, the Nest Labs device automatically adjusts the temperature to save energy when no one is home. In a few days, it learns the habits of the household and takes care of the temperature settings itself.
This is an example of a business looking at its market and applying creativity and innovation to product development and dramatically elevating the expectation applied now to the whole sector. And attracting a $3.6bn sale price to Google in so doing.
Fifty-three percent of our 100,000+ Leesman Index respondent employees cite “thinking / creative thinking” as an important workplace activity for them in their role and forty-three percent “collaborating on creative
work.” So it certainly appears that creativity has permeated the knowledge economy workplaces we have measured.
Tech futurist Daniel Burrus suggests that creativity is a function of knowledge, curiosity, imagination, and evaluation. He argues that the greater the curiosity, the more ideas, patterns, and combinations you can achieve, directly correlates to creating new and innovative products and services.
Perhaps not a coincidence then that our first analysis of the Leesman Index database by independent statisticians found that those selecting “collaborating on creative work,” had a significant statistical probability of selecting “variety of different types of workspace” as a key workplace feature – an indication of a curious desire to seek different spaces?
But herein lies the risk, because some associated with workplace design believe that they can help facilitate higher creative energies in their client’s organisation purely buy designing designated space for creative innovation.
Think tanks, float rooms, innovation pods, knowledge zones etc. now proliferate architectural plans.
The result? Groups of employees diarised to these rooms to be creative, management consultants sent on courses on the art of doodling and accountants being trained in the impact of a timely white board marker flow diagram or mind map. Its 21st century creativity battery farming. Anyone who believes this approach can foster creativity and innovation is catastrophically misguided.
Here, creative culture surely trumps strategy. Santa Clara University’s Professor David Caldwell, describes this as the invisible stuff that glues organisations together: things like purpose, values, approach that are the hardest to codify, difficult to evaluate, and even harder to measure and manage.
But our own work has now codified the infrastructure of collaboration and creativity. Leesman’s Dr Peggie Rothe explores these findings in detail to pages four and five, looking at how work activities statistically cluster and how
the infrastructure items that support each can be mapped.
Organisations can now use this infrastructure map to build a workplace landscape topology that is supportive of creativity and collaboration. And to understand that variety is imperative. So developing a culture that trusts employees to be curious and imaginative in the spaces they seek and how they use or configure them, is as important.
The value of teaching creativity to left brainers remains unanswered, and as a right brainer I remain unapologetically bias and sceptical. But whether your left or right hemisphere dominates, all organisations need to see workplace as a critical component in the infrastructure of organisational performance.
Understanding then how the workplace can support employees in the role or strategy they are employed to undertake, be that creative and intuitive, or organised and systematic, is critical to delivering an operationally effective knowledge economy environment.
Creativity is increasingly seen as a critical skill for continued business success, but is the blanket application of a programme to make you more creative really the answer?
Issue 19 | 2015 Q4leesmanindex.comData reported 31.12.15
Leesman Lmi
59.9Lmi 58.6 pre-occupancyLmi 65.9 post-occupancy
60.4
This issue: Collaboration: Cultural alignment, power of design, mapping infrastructure and dealing with distance
Our performance
Economic indicators
A briefing on global workplace strategy, management, satisfaction & effectivenessDelivering insights that drive better strategies
The creativity and innovation catastrophe 135,567 respondents
1,177 locations
63% av response rate
Data highlights
Imp
ortance
Satisfaction
Global distribution
Data distribution
Post 14%
Pre 68%
Day 2 13%
Lmi 58.6 Lmi 65.9 Lmi 64.5
The design of my workplace enables me to work productively My office is a place I’m proud to bring visitors to
UK 49,053 Nordics 41,702 Rest of Europe 22,814 Rest of world 17,073
55%agree
49%agree
Top 3 Activities:Individual focused work, desk based 93% 78% Planned meetings 78% 78% Telephone conversations 77% 64%
Bottom 3 Activities:Individual focused work away from your desk 35% 64% Video conferences 33% 56% Using technical / specialist equipment or materials 27% 65%
Top 3 Physical Features:Desk 92% 73% Chair 91% 67% Temperature control 80% 28%
Bottom 3 Physical Features:Shared storage 41% 41% Archive storage 36% 37% Variety of different types of workspace 36% 28%
Top 3 Service Features:Tea, coffee and other refreshment facilities 87% 63% General cleanliness 82% 61% Toilets / W.C. 80% 50%
Bottom 3 Service Features:Shower facilities 39% 35% Audio-Visual equipment 38% 44% Guest / visitor network access 35% 39%
Allison TsaoWhy is there such a disconnect between what we know and the siloed way we continue to work? Allison Tsao explores.Pages 3
Lena and Tomas Lid Falkman What scares us about collaborating virtually with people? Lena and Tomas Lid Falkman discuss the advantages of working apart. Page 8
Peter SmitAs organisations look to improve collaborative performance, Peter Smit asks whether Big Data can provide new insights.Page 9

2 –– Issue 19
Insight | Joseph White
Everyone agrees it’s a good thing, collaboration at work. Studies show strong correlations between collaborative work styles and employee engagement and between collaborative organisational cultures and corporate success.
Design for collaboration
But there’s surprisingly little research to draw on when it comes to understanding and designing workplace systems that support and encourage collaborative behaviors.
From recent studies designed to fill that void, Herman Miller has gleaned essential insights into the nature of group work in offices today and the ways in which current work environments get in the way of successful collaboration.
Outdated workplacesMost organisations struggle to make collaboration happen in workplaces designed to accommodate two broad categories of work — individual and group — with two generic types of spaces — workstations and conference rooms.
Historically, the world of work has focused on creating systems for process efficiency: streamlining the steps, minutes, and resources required to perform a specific task. But when the “task” is collaboration, process efficiency can only take you so far. Typical solutions intended to improve group work processes in these legacy spaces seem doomed to failure. Witness the deserted “breakout” spaces with their
colourful soft seating, the underutilised conference rooms outfitted with piecemeal digital and video technology we’ve all seen in offices around the world.
Our research suggests that designing systems to support collaborative interaction requires a more holistic approach, one that focuses not just on process but on the entire experience of work. A study observing some 2,900 collaborative events at 15 companies on four continents provided unique insights that informed this approach.
On-site researchers observed collaborative interactions as they happened in organisations self-identified as “highly collaborative” in the U.S., the U.K., India, and Australia. They found
that collaboration takes many forms and happens in many places: at the desk, on the fly in interstitial spaces, remotely via digital connections, and — less frequently than you might expect — in a conference room or similar space dedicated to group work.
Far from being discrete, destination-dependent incidents, collaborative events occur almost continuously over the course of the workday.
A new approachTo design for the true nature of collaborative work, we must focus on creating systems of purposeful variety, making use of the entire office landscape to support fluid interaction and smooth transitions between different modes of work. We call this “Living Office” — a conceptual framework to help organisations and their design partners make sense of and plan for the complexities of the modern work experience.
Living Office identifies and provides a custom-tailored network of settings for the full range of work activities — most of them involving collaboration — that people perform in the office today. Each setting is distinct in its purpose, scale, and sociability, aligning surroundings, furnishings, and tools (both digital and analogue) to work in concert for an elevated work experience.
An elevated experience of group workI can perhaps best convey what I mean by “an elevated experience of group work” by giving you an example of what it is not.
A large financial services firm recently spent $240 million on a new facility that
included dozens of six-person conference rooms outfitted with stunning rectangular tables, comfortable chairs, and the latest digital and analogue meeting tools — dual 60-inch touchscreen displays, high-end telepresence systems, giant whiteboards. Mere months after move-in, a space-utilisation study indicated that these conference rooms were used by groups of three 80 percent of the time, while the planned-for groups of six never used them.
Our research team quickly identified the problem. Each element of the rooms — their location, size, and the choice and placement of furniture, technology, and analogue tools within them — had been considered and designed independently, without regard for how it worked (or didn’t) with the other elements. For example, in
every conference room, one of the six chairs blocked the video camera’s viewing angle, rendering either chair or camera useless. In fact, the sightlines of remote participants were not considered at all; the whiteboards were hung off-camera. Even onsite participants had difficulty using these analogue tools because the large rectangular table and six chairs took up most of the room, leaving little circulation space to allow people to move around and interact with the whiteboards — or each other.
Taking a more holistic approach, our researchers began with a careful assessment of the people and activities these spaces were intended to serve. After identifying the type of collaboration that people wanted to use the conference rooms for — brainstorming and co-development of ideas and solutions by small groups of people located both remotely and onsite — we were able to recommend a setting that integrated surroundings, furnishings, and tools to optimise the collaborative activity we refer to as Co-Creation.
Because the utilisation study had already confirmed that the number of chairs in each room could be reduced, we pulled two chairs outside the room to provide support for another, complementary activity — quick information exchanges between participants just before or after the larger group convenes. Inside the room, fewer chairs and a smaller table shaped to improve sightlines for all participants opened up more circulation space so that people in the room could move around freely to use digital and analogue tools and interact with each other.
Our ongoing research and experience with highly collaborative organisations indicate that creating settings to support and encourage interaction is a process of constant fine-tuning and rebalancing. Ultimately, designers, IT managers, and HR professionals themselves have to collaborate around a shared understanding of human needs and organisational goals in order to make collaboration at work, work.
Joseph White I Director I Herman Miller
Witness the deserted “breakout” spaces with their colourful soft seating, the underutilised conference rooms outfitted with piecemeal digital and video technology we’ve all seen in offices around the world.
We must focus on creating systems of purposeful variety, making use of the entire office landscape to support fluid interaction and smooth transitions between different modes of work .
Joseph White is Director of Workplace Strategy, Design, and Management at Herman Miller. He is responsible for bringing the company’s point of view on workplace strategy to the tangible design of spaces and the human dynamics that bring those spaces to life.
Learn more about Living Office:
www.hermanmiller.com/solutions/living-office.html

Leesman Review –– 3
Insight | Allison Tsao
As a steward of workplace transformation, many of our clients ask for our support to help them reinvent their culture through re-designing their workspace.
The war on collaboration
One of the first questions we ask them at the start of their journey is, “What do you aspire to in your new way of working?” and over the past 25 years, one theme continues to resound – more collaboration.
Throughout the years, the conversation has remained the same. Leaders continue to strive towards this seemingly elusive goal of achieving more collaboration, in an effort to break down silos. Organisations are realising that collaboration has become a necessity. The growing complexity of the business environment and global connectivity is demanding that we draw on the collective rather than individualistic way of working. After all, two or more minds are always better than one.
Is that an assumption, though? Well, no. Numerous studies show that diverse perspectives contribute to more innovation, which translates into more efficiency and better products and services. Beyond the tangible results, there is also a major human element as collaboration can be energising. A company’s workforce is its greatest asset, and providing opportunities to connect with each other, learn and grow leads to more engagement and productivity.
Most leaders know this. So why the disconnect between what we know and the siloed way we continue to work?
There is a war on collaboration – this divide that has been created between widely recognising its criticality to our organisational survival and the inability to fully embrace it. Articles, studies, and seminars
have been extolling the virtues of collaboration for decades. Case in point – Harvard Business Review’s November 2007 issue revealed its research findings around how to build collaborative teams. It provided a great blueprint for leaders to consider. Yet, eight years later, the same challenges on how to effectively collaborate continue to rise to the top of Executive and HR agendas, and people continue to scratch their heads over this conundrum. So let’s start fighting this war.
Start with defining the term: Merriam Webster’s dictionary defines collaboration in this way: “working with another person or group in order to achieve or do something.” More controversially, they also define collaboration in the military context – “to cooperate, usually willingly, with an enemy nation, especially with an enemy occupying one’s country.”
Enemy nation? Sounds hostile. However, my own experience in large, complex organisations is that there is often a feeling of dread crossing enemy lines, leading us to pursue collaboration with tentative actions, in an effort to protect our own “nation.” The consequence is that consensus begins to masquerade around as collaboration.
Consensus is the reaching of a general agreement. Sounds like a worthy goal in the face of trying to cooperate with a perceived enemy, and no wonder so many organisations spend time “socialising” or “aligning” to reach agreement to move forward. True
collaboration, on the other hand, is about co-creation.
Reinvigorate the human connection of collaboration: Once you know what collaboration is not, then the conversation around what it is can begin. Most conversations start with what it looks like. Yet, for me, one vital ingredient continues to be missing in the research – the fundamental recognition that to collaborate effectively is to firstly establish human connections.
We need to start asking “what does great collaboration feel like?” It certainly shouldn’t feel like dread or distrust. The Harvard psychologist, Amy Cuddy, suggests that trust and competence rise to the top when first meeting someone - people fundamentally want to work with others that they feel they can rely on.
Once we know what it feels like, we are better able to distinguish what it looks like. Drawing upon people’s experiences of these feelings is a powerful guide to knowing when you’re getting it right, because when you are not, people’s behaviours will quickly change to avoid “enemy” lines, drawing us back into neutral consensus territory, unable to charge forward in the pursuit of shared outcomes.
Provide genuine choice: It is tempting to rush to create structures to encourage collaboration. This often takes the form of new performance management processes, organisational design such as self-managing teams and perhaps even a funky innovation room complete
with bean bag chairs and colourful walls.
Our experience with clients who rush to create structures is that they send a message to employees that collaboration is something to be achieved, an end rather than a means, tempting employees into consensus building, or worse, over-collaboration in an effort to be rewarded.
However, being told what to do has never been the best strategy in helping people to authentically change their ways. Rather, leaders who create genuine choice invite people to become curious about how collaboration can benefit themselves and the greater good. We must remind ourselves that the structures in place are meant to support
humans, not lead them. Humans lead humans.
Build your reinforcements: Once you have a clear picture of what collaboration is, what it should feel like, and how you can invite your organisation to truly collaborate, you are ready to build your reinforcements. There are three ways we challenge our clients to build collaborative reinforcements.
Firstly, the Propinquity Effect says that the more we interact with someone, the more easily we become friends. Creating an environment that supports this is a powerful way to reinforce collaboration. There are physical design elements that can be created to draw people to have the types of collaborative discussions
and interactions based on what the shared outcomes are. Designing with this intention is a great way to maximise the office space and enable your workplace to support these collaborative behaviours.
Secondly, supporting HR systems and processes can be very effective in making new collaborative behaviours stick. Modifying your goal setting and performance management processes as well as rewards and recognition criteria and evaluating different organisational design models are all tactics to consider to support a collaborative culture.
Lastly, reviewing virtual collaboration requirements enables your IT team to select the tools that best meet users’ needs in the new collaborative environment. This doesn’t necessarily mean getting the latest gadgets, rather investing in consistent and effective tools that make collaborating easier.
Allison Tsao I Veldhoen + Company
Allison has a background in HR Consulting and has been working with global clients to enable transformational change for the past 10 years. In her role at Veldhoen + Company, she helps clients define the possibilities for their future and enable a new way of working through Activity Based Working (ABW). Originally from New York, she now lives in Sydney, supporting clients in Australia and New Zealand.
In ConclusionOur experience suggests that there is a formula for true collaboration that starts with some fundamentals before charging across enemy lines.
True Collaboration (TC) = Feelings (F) + Choice (C) + Structures (S)
For true collaboration to exist, we must reconnect with the feelings that it elicits (and reframe our past experiences with consensus), voluntarily make the choice to collaborate as individuals, and design the right structures to support and reinforce this choice. Only then will we end the war on collaboration and make friends across enemy lines once and for all.
Being told what to do has never been the best strategy in helping people to authentically change their ways.

4 –– Issue 19
In his 2012 book “21st Century Management,” Swedish futurologist Mats Lindgren suggests that “innovative companies nurture an open, sharing and generous culture that supports playfulness and searching. They have people personally committed to innovation and a well functioning infrastructure that supports smooth and rapid innovation.” So to what extent does the hard and soft infrastructure influence organisational innovation and creativity?
Let’s first accept that changes to the physical structures alone won’t transform an introverted, individually focused organisation overnight into an extroverted, creative hotbed. But can our “100,000+ Data Report” help identify the workplace features that are the critical ingredients for fluid knowledge transfer and collaboration?
The report, with analysis across our first 100,000 employee database responses by independent statisticians
Formulate, statistically grouped (via factor analysis) our 21 standard Activities of work into distinct cluster groups. These groupings are based purely on the statistical patterns created by employees consistently selecting common activities.
There were four clear groupings that emerged, three of which are reviewed in the report. The first, “collaboration / interaction,” I will examine here. This group statistically clustered five of our 21 possible choices of activities that are “important to employees in their work;”
1. Collaborating on focused work
2. Collaborating on creative work
3. Informal, unplanned meetings
4. Informal social interaction
5. Learning from others
The second group of activities consists of the more prearranged formalised type of working together, namely:
1. Planned meetings2. Larger group meetings
or audiences3. Video conferences4. Hosting visitors,
clients or customers
The difference between the two is really in the nature of collaboration. The latter set of activities is more structured and planned, and perhaps more about sharing information and coordinating. The first is about knowledge creation, transfer, and dissemination, and comprises the interaction that is more difficult to explicitly define and that has more diverse spatial needs.
But once the Activity groupings are defined, it is then possible to look for statistical consistency in the infrastructure items employees then go on to select as “important features in an effective workplace.”
It is important to say that these are not specific infrastructure features employees have pointedly
selected to support specific activities. Rather they are infrastructure items that cluster numerically around the activities that have been selected. The statisticians refer to these as “odds ratios:” the statistical likelihood or “odds” of someone selecting particular physical or service features based on their prior Activity preferences.
These “odds ratios” expose two distinctly different infrastructure shopping lists for the two different forms of ‘working together.’ The “collaboration / interaction” group are more likely to choose as important (compared to the pre-arranged / formalised group) “accessibility of colleagues,” “small meetings rooms,” “informal work areas / breakout zones,” and “variety of different types of workspace.”
The schedule continues with “wired in-office connectivity,” “natural light,” “quiet rooms for working alone or in pairs”
and “atriums and communal areas.” So statistically these are the things we need to see as the infrastructure of collaboration and interaction.
But while one organisation might increase “accessibility of colleagues” through a more open space figuration, another organisation with a highly mobile workforce might look at introducing virtual collaboration tools to achieve the same objective. So each organisation still needs to investigate and consider the localised solution for themselves. The same problems don’t necessarily require the same solutions.
Looking then at the features that are important for formal meeting activities, we find “large” and “small meeting rooms,” “desk / room booking systems,” “audio-visual equipment” and “guest / visitor network access.” All of which make sense. Though it should be noted that only “small meeting rooms” is common to both shopping lists.
Report | Peggie Rothe
Innovation and creativity are the raw fuel of the knowledge economy and workplace designers have long since sought to help organisations by applying their own inventiveness to the issue. But have they been looking in the wrong place - are the physical building blocks that support creativity and innovation quite what we think?
Top 10 statistically most important features for collaboration / interaction
Accessibility of colleaguesMeeting rooms (small)Informal work areas / breakout zonesVariety of different types of workspaceWired in-office network connectivityNatural lightQuiet rooms for working alone or in pairsAtriums and Communal AreasRemote access to work files or networkAir quality
12345678910
Mapping the Infrastructure of collaboration
Informal, unplanned meetings
Collaborating on creative work
Learning from othersCollaborating on focused work
Informal socialinteraction
Larger group meetings or audiences
Collaboration / interaction

Leesman Review –– 5
Of course looking at what has statistically made it to the respective lists is interesting, but considering what did not make it onto the lists is perhaps even more telling. Are there features employers believe fuel collaboration and creativity that actually have no impact at all – like open plan workspaces?
Reviewing the features lists for both collaboration and interaction, and planned meetings, there is no mention of “desk” amongst our 100,000+ respondents. Those employees seem to agree that collaboration is not done at your workstation, it’s done elsewhere.
So while “informal work areas / breakout zones” and “variety of different types of workspace” do not emerge as distinguishing features for those who have selected the formal meeting activities as important, they are important for the collaborators.
As I have highlighted in past articles, this once again puts the spotlight on the
Top
10 s
tati
stic
ally
mos
t im
port
ant
feat
ures
for c
olla
bora
tion
/ in
tera
ctio
n
Top
10 s
tati
stic
ally
mos
t im
port
ant
feat
ures
for f
orm
al m
eeti
ngs
Top 10 statistically most important features for formal meetings
12345678910
Meeting rooms (large)Meeting rooms (small)Desk / Room booking systemsAudio-Visual equipmentGuest / visitor network accessReception areasRemote access to work files or networkPrinting / copying / scanning equipmentHospitality servicesQuiet rooms for working alone or in pairs
Video conferences
Hosting visitors, clients or customers
Larger group meetings or audiences
Planned meetings
The Issue The physical and virtual infrastructure provided for employees has an impact on their ability to collaborate and interact. The question posed is whether the activities cluster into recognisable groups and whether as a result, it is possible to statistically map which infrastructure features have the greatest impact.
What we looked at Across the entire respondent database*1, every employee has the opportunity to select the activities that are important to them in their work. Through numeric analysis (factor analysis) we can see how these activities statistically cluster. We can then map the probability of an employee going on to select particular physical or service features.
What the numbers say These probabilities are expressed as “odds” – the odds of an employee selecting an item based on their previous choices. This is exactly like the odds expressed in betting on a sporting event – the odds of one team winning based on their previous performance and the previous performance of their opponent. This provides us with statistical robust clusters.
The conclusion Clear patterns emerge, codifying the infrastructure needs of work activity groupings. So we can say statistically that collaboration is not happening at the desk and that smaller and more informal meeting spaces are critical to support collaboration. We can also once again see the importance of ‘variety’ – the option to choose a space appropriate to that particular type of collaboration.
The concept bite-sized
1 Accessibility of colleagues
3 Informal work areas / breakout zones
4 Variety of different types of workspace
5 Wired in-office network connectivity
6 Natural light
8 Atriums and Communal Areas
10 Air quality
2 Meeting rooms (small)
7/10 Quiet rooms for working alone or in pairs
9/7 Remote access to work files or network
1 Meeting rooms (large)
3 Desk / Room booking systems
4 Audio-Visual equipment
5 Guest / visitor network access
6 Reception areas
8 Printing / copying / scanning equipment
9 Hospitality services
Formalmeetings
importance of variety in the workplace. It all suggests that your typical open solution environment with two types of work settings – work stations and meeting rooms – might support a formal meeting culture, but that supporting collaboration and interaction requires an entirely more diverse workplace landscape.
The December (2015) issue of Harvard Business Review highlighted the notion that eating together enhances group performance and the article ‘Team building in the cafeteria’ suggested that devoting spaces, time, and resources to communal eating might be more effective than
creating spaces that promote serendipitous encounters.
Interestingly enough, “Tea, coffee and other refreshment facilities” and “Restaurant / canteen” did not statistically emerge as a feature distinguishing collaborators from non-collaborators. These features are important to everyone regardless of activity profile.
So perhaps having a break and enjoying a cuppa is important for resetting and preparing, giving yourself the mental space between collaborative and individual focused work? An avenue for further investigation I suspect.
Because though we have focused here on the
importance of collaboration, let us not forget that most of us will still need some space and time for individual work activities. Knowledge creation is a process that consists of different phases, of which some are done together and some require time for yourself.
So being successful in even the most creative, innovative and collaborative of job profiles will require some time to reflect and internalise on your own – and a high performing workplace will successfully provide space for this, alongside space for collaboration.
Dr Peggie Rothe | Development Director | Leesman
Peggie is Leesman’s resident academic. Before joining the team in September 2014, she worked as a researcher at Aalto University (Finland) with a focus on corporate real estate, workplace management and short-distance office relocations, publishing her findings in several peer-reviewed academic journals.

1.1 The design of my workspace is important to me
1.2 It contributes to a sense of community at work
1. 3 It creates an enjoyable environment to work in
1. 4 It enables me to work productively
1. 5 It's a place I'm proud to bring visitors to
Q.1 How much do you agree or disagree with the following statements about the design of your organisation's current workspace?
Disagree Strongly (-3) Disagree (-2) Disagree Slightly (-1) Neutral (0) Agree Slightly (1) Agree (2) Agree Strongly (3)
Data ranked by agreement
total no of respondents160k140k120k100k80k60k40k20k
2.1 Individual focused work, desk based
2.2 Planned meetings
2.3 Telephone conversations
2.4 Informal, un-planned meetings
2.5 Collaborating on focused work
2.6 Reading
2.7 Relaxing / taking a break
2.8 Thinking / creative thinking
2.9 Individual routine tasks
2.10 Informal social interaction
2.11 Learning from others
2.12 Audio conferences
2.13 Businessconfidentialdiscussions
2.14 Hosting visitors, clients or customers
2.15 Collaborating on creative work
2.16 Private conversations
2.17 Spreading out paper or materials
2.18 Larger group meetings or audiences
2.19 Individual focused work away from your desk
2.20 Video conferences
2.21 Using technical / specialist equipment or materials
Q.2 Which activities do you feel are important in your work?
Number of responses
Number of responses
Not Supported At All (-3) Very Under Supported (-2) Under Supported (-1) Supported (1) Well Supported (2) Very Well Supported (3)
Data ranked by importance
total no of respondents
85%
50%
57%
58%
56%
93%
59%
51%
46%
43%
77%
55%
49%
43%
35%
78%
55%
50%
43%
39%
65%
52%
49%
43%
33%
27%
160k140k120k100k80k60k40k20k0
0
6 –– Issue 19
Activities
1 Individual focused work, desk based 93% 78%
2 Planned meetings 78% 78%
3 Telephone conversations 77% 64%
4 Informal, un-planned meetings 65% 63%
5 Collaborating on focused work 59% 73%
5 Reading 55% 59%
7 Relaxing / taking a break 55% 62%
8 Thinking / creative thinking 52% 52%
9 Individual routine tasks 51% 87%
AverageSatisfaction
Leesman+Satisfaction
87%
83%
77%
82%
87%
76%
80%
69%
93%
AverageImportance
The data reported to the right shows highlights from the aggregated results across the whole database. These results are picked from the top 9 important activities, physical features and service features. The percentages show supported/satisfactionfiguresforeachtime.Comparisonisofferedthento the Leesman+ locations.
2015 Q4 Data Summary
Lmi 60.4Ratings reported from 135,567 respondents surveyed to date.
Standardised Workplace Effectiveness Measurement
The Leesman Index
Resp
onde
nts
2010 20122011 2013 2014 2015 20160
10,000
20,000
90,000
130,000
120,000
140,000
150,000
110,000
100,000
60,000
70,000
80,000
50,000
30,000
40,000
Europe’s largest resource of contemporary workplace performance data
Data review The data reported above shows highlights from the aggregated results across the 135,567 individual respondents received at 31 December 2015. These results are provided through the Leesman Index employee workplace satisfaction e-survey, which has been conducted across a range of pre and post occupancy workplace projects as shown.
Thesurveyisbasedaroundafixedcoremoduleinwhichthe questions asked do not vary. This provides us with an unrivalled ability to report and benchmark consistently acrossthatdataandoffervaluableinsightintodifferencesbetweenanynumberofvariables,includingindustry type, location, gender, age or length of service.
• 904 locations in 49 countries • 74% pre-project, 15% post-project, 11% other • 64% average response rate• 11 minute average response time
The quarterly publication of this data is something we have done since the formation of Leesman in 2010 and is a mark of our continued commitment to the distribution oftheknowledgeandfindingsweuncoverfromthedata.Academics with an interest in the the subjects that interest us can access the data from the full database. Contact Peggie Rothe for more information.
Agreement
Importance

92%
77%
70%
56%
55%
43%
80%
76%
63%
56%
54%
36%
91%
77%
67%
56%
55%
41%
80%
72%
61%
55%
54%
36%
51%
87%
79%
67%
55%
50%
79%
80%
76%
62%
51%
39%
68%
82%
78%
65%
54%
40%
75%
80%
70%
59%
51%
38%
39%
35%
Leesman Review –– 7
3.1 Desk
3.2 Chair
3.3 Temperature control
3.4 Meeting rooms (small)
3.5 Personal storage
3.6 Natural light
3.7 Noise levels
3.8 Meeting rooms (large)
3.9 Air quality
3.10 Officelighting
3.11 Quiet rooms for working alone or in pairs
3.12 General Décor
3.13 Ability to personalise my workstation
3.14 Desk / Room booking systems
3.15 Informal work areas / break-out zones
3.16 Accessibility of colleagues
3.17 Plants & Greenery
3.18 People walking past your workstation
3.19 Space between work settings
3.20 Dividers (between desks / areas)
3.21 Atriums and Communal Areas
3.22 Art & Photography
3.23 Shared storage
3.24 Archive storage
3.25 Varietyofdifferenttypesofworkspace
The charts here show the importance of each Activity, Feature and Facility. To Q2, Q3 and Q4, the bar length shows the volume of importance. The colour coding within the bar then shows supported /satisfactionfiguresdelivered across the full database to each line.
60k40k20k0 160k140k120k100k80kNumber of responses
Q.3 Which physical features do you consider to be an important part of an effective workspace?
Not Provided HighlyDissatisfied(-2) Dissatisfied(-1) Neutral (0) Satisfied(1) HighlySatisfied(2)
Data ranked by importance
total no of respondents
4.1 Tea,coffeeandotherrefreshmentfacilities
4.2 General cleanliness
4.3 Toilets / W.C.
4.4 Printing / copying / scanning equipment
4.5 Restaurant / canteen
4.6 Telephone equipment
4.7 Computingequipment,fixed(desktop)
4.8 General tidiness
4.9 Wiredin-officenetworkconnectivity
4.10 Parking (car, motorbike or bicycle)
4.11 Remoteaccesstoworkfilesornetwork
4.12 Security
4.13 Access (e.g. lifts, stairways, ramps etc)
4.14 Mail & post-room services
4.15 Reception areas
4.16 Health and safety provisions
4.17 Leisure facilities onsite or nearby
4.18 Hospitality services
4.19 Internal signage
4.20 Audio-Visual equipment
4.21 Guest / visitor network access
4.22 IT Service / Help desk*
4.23 WiFinetworkconnectivityintheoffice*
4.24 Computing equipment, mobile (laptop, tablet, etc.)*
4.25 Shower facilities*
Q.4 Which service features do you consider to be an important part of an effective workspace?
Number of responses
Not Provided HighlyDissatisfied(-2) Dissatisfied(-1) Neutral (0) Satisfied(1) HighlySatisfied(2)
Data ranked by importance
total no of respondents
* added in March 2015
160k140k120k100k80k60k40k20k0
Physical Features Service Features
1 Desk 92% 73%
2 Chair 91% 67%
3 Temperature control 80% 28%
4 Meeting rooms (small) 80% 51%
5 Personal storage 77% 56%
6 Natural light 77% 57%
7 Noise levels 76% 30%
8 Meeting rooms (large) 72% 52%
9 Air quality 70% 36%
1 Tea,coffeeandotherrefreshmentfacilities 87% 63%
2 General cleanliness 82% 61%
3 Toilets / W.C. 80% 50%
4 Printing / copying / scanning equipment 80% 68%
5 IT Service / Help desk 79% 59%
6 Restaurant / canteen 79% 49%
7 Telephone equipment 78% 69%
8 Computingequipment,fixed(desktop) 76% 66%
9 WiFinetworkconnectivityintheoffice 75% 62%
AverageSatisfaction
AverageSatisfaction
Leesman+Satisfaction
77%
74%
37%
70%
60%
73%
40%
68%
52%
Leesman+Satisfaction
80%
83%
67%
78%
73%
61%
79%
75%
72%
AverageImportance
AverageImportance
Importance
Importance

8 –– Issue 19
Does it work to work apart?
Report | Lena Lid & Tomas Lid Falkman
Do you prefer to solve a problem with the person sitting next to you, or with the person who is the most competent for solving the problem, even though this person sits elsewhere?
Many of us will answer the person sitting next to us. But experience and research says that it can work to be apart; it can work very well, and as a bonus bring us some advantages.
What is it that scares us about collaborating virtually with people? One reason that often comes up is the issue of trust. It seems to be harder to foster trust if we do not know and meet someone in real life. One study shows that teams that work virtually can indeed build trust, but it is built in a different way.
In a team that works within the same office and meets in real life, trust is created based on relationships; how we perceive people and whether we like one another. In a team that collaborates virtually, trust is created based on actions. Trust emerges based on how the team members deliver. If I experience that my team mate, who I might never have met, contributes wisely in meetings, produces smart pieces of work and delivers on promises in a timely manner, I start to trust this person. This action-based trust can actually be seen as truer, or more relevant for work, than a relation-based trust.
However, we cannot ignore the importance of being together socially; going for a coffee and engaging in small talk about the weekend or the family. This needs to be compensated for if you work virtually. My closest colleagues for the last year have been two American scholars and one Dutch scholar. Together we have written and edited leadership anthologies, without having ever met. The leader of
the team, a professor in California, starts the web conference meetings with a short mindfulness practice. She leads our team members in a meditation aimed at getting us in a good and focused mood. We then take turns telling one another how our days and lives are, ensuring we get to know one another on a more personal level. This practice allows us to really get to know each other. We may not know how tall our team members are, or what they smell like, but we do know other very personal
details. Whenever there is a break in the meeting, the web conference continues to run, so that team members can start chit-chatting as they return to their computers, replicating a real life scenario. Taking the time to get to know each other and create a social atmosphere is worthwhile when working together.
My colleague Tomas worked as a global team leader where the team consisted of members in Dallas, US; Kuala Lumpur, Malaysia; and Stockholm, Sweden. Due to reductions in the budget, travelling was restricted and the team had to rely on telephone conferences, but the team continued its collaboration. The teams were in different time zones, so the time for the meetings changed regularly, ensuring it was not always inconvenient for the same people all the time. Another important key factor for the team to collaborate was consistency. It was important to have a scheduled meeting, even if there was nothing particularly pressing to discuss. In these instances, the meeting was shorter but
time could be spent hearing what was happening in other locations within the company.
A key foundation for getting a team to function is to take advantage of the new technology. Many of the people who tried web
conference meetings early in the tech evolution still carry the misconception that video and web meetings simply do not work. Before we relied on video conferencing with expensive and complicated equipment. Now that the technology is simpler, cheaper and more intuitive, we all have a potential meeting in our pockets, in the form of our smart phones, laptops or tablets.
For our book Virtual Meetings (Virtuella Möten, 2014, Liber) we met six organisations, each radically different from one another, to see how they have worked with implementing their virtual collaboration. These organisations consisted of a governmental institution, a small non-profit organisation, the nation-wide Swedish church, a consulting agency with many local offices, an education provider and a
large global tech corporation. Each and every one of these organisations all learned, adapted and evolved their own best-practice regarding distributed collaboration.
The governmental institution organised
education for all co-workers, independent of placing. The church was able to collaborate more among congregations, and even though they had invested in technology, they very quickly benefited from this investment by replacing some physical meetings with virtual meetings. The consulting
agency saved money and time by not travelling to the different local offices; travel time between offices is not billable to customers. Also, rather than just writing policies, the routine of virtual meetings took off when the board members started being summoned to virtual meetings. The education provider was able to have the most competent lecturer teaching specific topics online, so that all participants could receive the highest quality teaching. The global tech giant used physical and virtual meetings simultaneously, leaving it to the individual to decide if they wanted to join in the room or on a screen. This company is also one of the early adopters of an activity-based office. The board of the small non-profit organisation had for
a long time been populated by members living around the capital, just because it was convenient for them to meet. The board decided to replace the physical meetings to virtual, enabling them to recruit members based on interest from around the country, rather than members who happened to live in the capital. When it was time for the annual meetings, the board members took time getting to know each other, establishing a relationship and creating a strong footing for the coming year of working together over the phone.
It seems as though working in distributed, virtual teams can work. Meeting regularly, making room for socialising and being clear about the communication are some of the key tools for making collaboration a success.
In a team that collaborates virtually, trust is created based on actions. Trust emerges based on how the team members deliver.
Lena Lid & Tomas Lid Falkman I Experts in leadership and security
Many of the people who tried web conference meetings early in the tech evolution still carry the misconception that video and web meetings simply do not work.
Lena Lid Falkman is a scholar at Stockholm School of Economics, Sweden. Lid Falkman is an expert on leadership and communication, and has the last few years studied how technology changes the possibilities for organisations and leaders. Tomas Lid Falkman is an IT security expert with long experience from working in and leading distributed teams in a global setting. Tomas and Lena published the book Virtual Meetings (Virtuella Möten) in 2014, and are currently working on a book on Virtual Teams (forthcoming 2017).

Leesman Review –– 9
Can Big Data Analytics provide new Insights into collaborative performance?
Report | Peter Smit
Organisations, the world over, are looking to improved collaboration to increase innovation, boost productivity and contribute to better business results.
They are seeking to do so at all levels throughout the organisation. A more “collaborative culture” on an organisational level means increased communication and information flows across divisions, business units and departments, leveraging the collective expertise, experience and knowledge of the organisation, thus reducing the amount of duplication of effort. For individual teams, this not only means that members communicate and share more, but also that they leverage their respective individual networks to the benefit of the greater team.
Would it not be of tremendous benefit if one could measure collaborative performance, thereby providing the ability to benchmark and establish improvement as a result of initiatives undertaken to improve?
Before exploring measurement, let us examine the elements contributing to the increased complexity in the work environment. In response to pressure from employees for more flexibility to perform their work when and where it best suits them, organisations are setting up programmes for more and more people to work remotely. This poses challenges in the areas of security and access, and highlights the importance of having a strong information governance policy in place to ensure individuals can access the information they require.
At the office, organisations are recognising the advantage
of flexible office layouts where individuals and teams select the type of space they need based on their requirements with the additional benefit of improving space utilisation and, with more people working remotely, reduces the space requirement.
With a deeper understanding of the expertise and experience of their people and better technology tools, organisations are creating teams to address issues, problems and opportunities with the best-suited people for the task. Many of these individuals are now scattered across multiple office locations, frequently across the world.
In addition to these relatively new elements in the work environment, a number of organisations are undertaking Transformations through which they are seeking to change culture, workflows, processes, environments and implement new technology tools. These are often multi-year initiatives, cost millions and are typically led by multi-stakeholder teams who are all wrestling with establishing the starting point and measuring progress toward the objectives. Improvements in IT collaboration tools are facilitating these changes to more remote work, flexible office configurations and distributed teams.
Now to measurement: each of these collaboration tools maintains an activity log; a record of who did what when and who else was involved. These activity logs can be used as a basis
with which to measure collaborative performance. Each activity can be mapped against the four components of collaboration: sharing, communicating, socialising and searching. From this, one can derive everything from a measure of “collaborative culture” down to how well a team collaborates amongst its members and how well it leverages its respective networks. This also creates a very valuable baseline against which to measure progress, good or bad, and allow organisations to take action with a high degree of confidence. Depending on availability, environmental data from building systems can be added in order to gain additional insights.
The consensus is virtually unanimous, collaboration is critical and improving collaboration is one of the primary objectives of many initiatives. Thus far it has not been measured because it has been seen as a great mystery; as being “soft and squishy”, and therefore immeasurable. Moreover, between 60 and 70 percent of those surveyed say either “nobody” or “do not know who” “owns” collaboration in their organisation. Changes in our environment and new technology, paired with analytics, are now making it possible to measure collaboration. With a clearer picture of performance, strategies to become better at collaborating can be developed with a higher degree of confidence of outcome.
Collabogence has just launched a research project to validate its model. We are in search of organisations interested in learning more about how their organisation and teams collaborate. If you are interested in participating, please get in touch.
Peter Smit I Founder I Collabogence Inc.
Peter Smit is the founder of Collabogence Inc., an organisation committed to measuring organisational collaborative performance, helping companies understand the collaborative balance of their people, processes and tools, and thus how to improve performance. He has lived in seven countries and speaks four languages. His experience includes working with Honeywell, Siemens, Motorola, Tellabs and Opentext. The common thread linking all these positions is the orchestration of cross-functional resources, scattered around the globe, so that they all work together towards a common end—collaboration.
Would it not be of tremendous benefit if one could measure collaborative performance, thereby providing the ability to benchmark and establish improvement as a result of initiatives undertaken to improve?
10 –– Issue 19
Opinion | Tim Oldman
Collaboration is a multi-dimensional activity – so one-dimensional solutions just won’t work.
Collaborate at all costs, right? It’s what every commentator and management journal wants you to be doing. And if you can do it with creativity, all the better. The result? A swathe of organisations casting their staff into one-dimensional, banal open-plan offices in the misguided view that working without walls will instantaneously spark serendipitous cross-desk interaction.
Adding to the confusion are consultants suggesting they can flood you with techniques to fuel your organisation’s collaborative creativity. Some will come from an organisational psychology background, others from an interior design background and most others from the colourful spectrum between with varying credentials.
But we think almost all are missing the multi-dimensional nature of the issue. Yes, the very premise of an ‘organisation’ is the creation of a formalised group who come together to achieve things collectively that would not be possible individually. So any strategy that gets them engaged with each other more makes sense. Right?
But there is not one killer meeting room design, or collaboration app’, or employee creativity coaching programme, or brew of coffee that is in itself going to be the single catalyst to optimise their creative interactions.
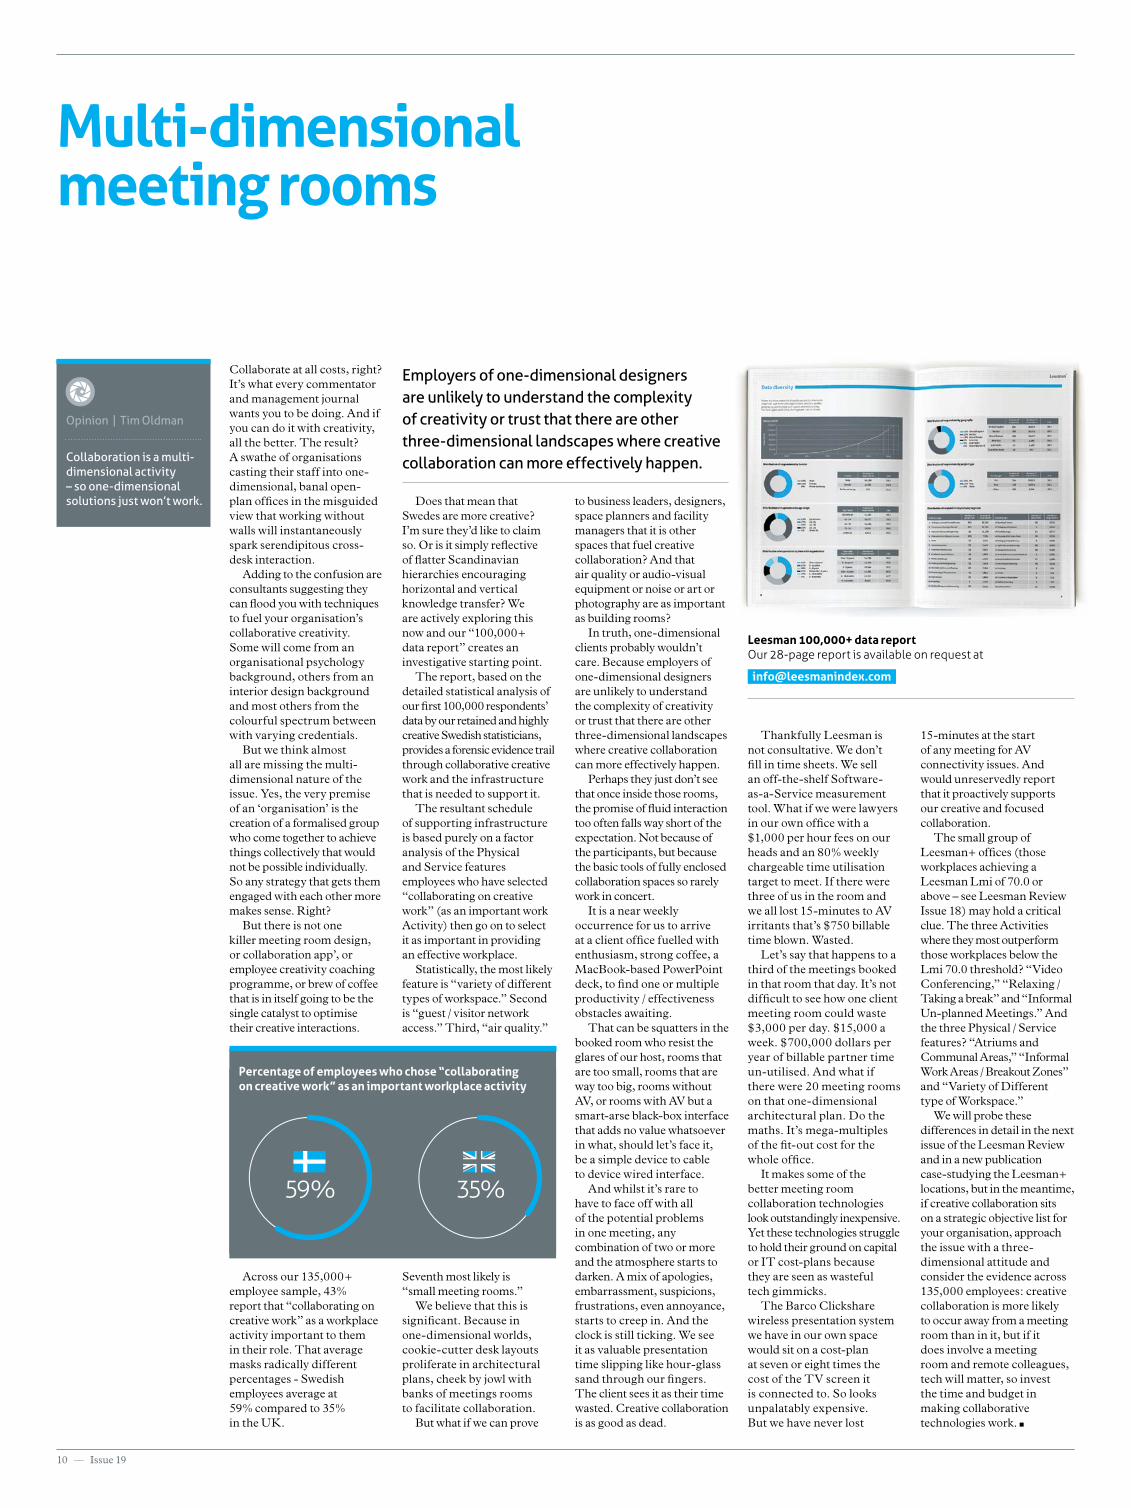
Across our 135,000+ employee sample, 43% report that “collaborating on creative work” as a workplace activity important to them in their role. That average masks radically different percentages - Swedish employees average at 59% compared to 35% in the UK.
Does that mean that Swedes are more creative? I’m sure they’d like to claim so. Or is it simply reflective of flatter Scandinavian hierarchies encouraging horizontal and vertical knowledge transfer? We are actively exploring this now and our “100,000+ data report” creates an investigative starting point.
The report, based on the detailed statistical analysis of our first 100,000 respondents’ data by our retained and highly creative Swedish statisticians, provides a forensic evidence trail through collaborative creative work and the infrastructure that is needed to support it.
The resultant schedule of supporting infrastructure is based purely on a factor analysis of the Physical and Service features employees who have selected “collaborating on creative work” (as an important work Activity) then go on to select it as important in providing an effective workplace.
Statistically, the most likely feature is “variety of different types of workspace.” Second is “guest / visitor network access.” Third, “air quality.”
Seventh most likely is “small meeting rooms.”
We believe that this is significant. Because in one-dimensional worlds, cookie-cutter desk layouts proliferate in architectural plans, cheek by jowl with banks of meetings rooms to facilitate collaboration.
But what if we can prove
to business leaders, designers, space planners and facility managers that it is other spaces that fuel creative collaboration? And that air quality or audio-visual equipment or noise or art or photography are as important as building rooms?
In truth, one-dimensional clients probably wouldn’t care. Because employers of one-dimensional designers are unlikely to understand the complexity of creativity or trust that there are other three-dimensional landscapes where creative collaboration can more effectively happen.
Perhaps they just don’t see that once inside those rooms, the promise of fluid interaction too often falls way short of the expectation. Not because of the participants, but because the basic tools of fully enclosed collaboration spaces so rarely work in concert.
It is a near weekly occurrence for us to arrive at a client office fuelled with enthusiasm, strong coffee, a MacBook-based PowerPoint deck, to find one or multiple productivity / effectiveness obstacles awaiting.
That can be squatters in the booked room who resist the glares of our host, rooms that are too small, rooms that are way too big, rooms without AV, or rooms with AV but a smart-arse black-box interface that adds no value whatsoever in what, should let’s face it, be a simple device to cable to device wired interface.
And whilst it’s rare to have to face off with all of the potential problems in one meeting, any combination of two or more and the atmosphere starts to darken. A mix of apologies, embarrassment, suspicions, frustrations, even annoyance, starts to creep in. And the clock is still ticking. We see it as valuable presentation time slipping like hour-glass sand through our fingers. The client sees it as their time wasted. Creative collaboration is as good as dead.
Thankfully Leesman is not consultative. We don’t fill in time sheets. We sell an off-the-shelf Software-as-a-Service measurement tool. What if we were lawyers in our own office with a $1,000 per hour fees on our heads and an 80% weekly chargeable time utilisation target to meet. If there were three of us in the room and we all lost 15-minutes to AV irritants that’s $750 billable time blown. Wasted.
Let’s say that happens to a third of the meetings booked in that room that day. It’s not difficult to see how one client meeting room could waste $3,000 per day. $15,000 a week. $700,000 dollars per year of billable partner time un-utilised. And what if there were 20 meeting rooms on that one-dimensional architectural plan. Do the maths. It’s mega-multiples of the fit-out cost for the whole office.
It makes some of the better meeting room collaboration technologies look outstandingly inexpensive. Yet these technologies struggle to hold their ground on capital or IT cost-plans because they are seen as wasteful tech gimmicks.
The Barco Clickshare wireless presentation system we have in our own space would sit on a cost-plan at seven or eight times the cost of the TV screen it is connected to. So looks unpalatably expensive. But we have never lost
15-minutes at the start of any meeting for AV connectivity issues. And would unreservedly report that it proactively supports our creative and focused collaboration.
The small group of Leesman+ offices (those workplaces achieving a Leesman Lmi of 70.0 or above – see Leesman Review Issue 18) may hold a critical clue. The three Activities where they most outperform those workplaces below the Lmi 70.0 threshold? “Video Conferencing,” “Relaxing / Taking a break” and “Informal Un-planned Meetings.” And the three Physical / Service features? “Atriums and Communal Areas,” “Informal Work Areas / Breakout Zones” and “Variety of Different type of Workspace.”
We will probe these differences in detail in the next issue of the Leesman Review and in a new publication case-studying the Leesman+ locations, but in the meantime, if creative collaboration sits on a strategic objective list for your organisation, approach the issue with a three-dimensional attitude and consider the evidence across 135,000 employees: creative collaboration is more likely to occur away from a meeting room than in it, but if it does involve a meeting room and remote colleagues, tech will matter, so invest the time and budget in making collaborative technologies work.
Employers of one-dimensional designers are unlikely to understand the complexity of creativity or trust that there are other three-dimensional landscapes where creative collaboration can more effectively happen.
Multi-dimensional meeting rooms
59% 35%
Percentage of employees who chose “collaborating on creative work” as an important workplace activity
Leesman 100,000+ data report Our 28-page report is available on request at

Leesman Review –– 11
©Photology1971 / Shutterstock.com

Worth a closer look
TheopinionsexpressedbycontributorsrepresentthoseoftheindividualauthorsandunlessclearlylabelledassuchdonotrepresenttheopinionsofLeesmanLtd.TheLeesmanReviewisthejournalofLeesman,theworld’slargestindependentdatabaseofworkplaceeffectivenessdata and we welcome contributions on the subjects that you think should interest us. Leesman is a registered trademark and all Leesman Review content is Copyright March 2016. Leesman, 5 Wormwood St, London EC2M 1RQ, 00 44 20 3239 5980, [email protected] |Designbyfullyfledgeddesign.com
The life changing magic of not giving a f*ck Sarah Knight, Quercus
This book is a practical guide explaining how to rid yourself of unwanted obligations, shame and guilt and stop you feeling stressed out and generally underwhelmed by life. If you’re tired of pleasing others before you please yourself, this book will help you unleash the power of not giving a…
The Innovator’s Dilemma Clayton M. Christensen, Harvard Business Review Press
Christensen shows how most companies miss out on new waves of innovation. This book demonstrates how successful companies can do everything ‘right’ and yet still lose their market leadership – or even fail – as new, unexpected competitors rise and take over the market.
Next issue Since March 2015 we have been awarding buildings achieving a Leesman Lmi of 70.0 or more with our Leesman+ accreditation. This elite group is now helping us to understand the constituent parts of a high performance workplace and creating a rich research resource. But it raises a series of new questions.
The questions circulate around the impact of occupation strategies (occupant density, desk sharing, distribution ofteamsacrossfloorsetc.) on workplace effectiveness.Sotowhatextent does the way a buildingisconfiguredor operated impact on overalleffectiveness?
As a result we are launching a major new research project that will map the impact that this has on business performance. Working on a simple crowd-sourced “the more you put in the more you can take out” principle, we will be inviting any client who undertakes a Leesman Index workplaceeffectivenessstudy to share a deeper level of real estate data with us.
So the next Leesman Review will outline our research hypothesis and discuss how we aim to elevate the understanding of the performance of the workplace and crucially demonstrate the impact it is having on employee performance. With contributions from and interviews with the leading international designers, strategists and CRE advisors who will proactively partner with the initiative, the milestone issue will also feature a case study of NAB’s newly Leesman surveyed Melbourne HQ.
More on the web
www.barco.comwww.collabogence.comwww.hermanmiller.comwww.kairosfuture.comwww.nest.comwww.plantronics.comwww.veldhoencompany.com
Meetings are where ideas are exchanged, tasks are assigned, commitments are made and brains are stormed. Aren’t they? Whether they’re face-to-face, virtual, or a combination of both, meetings are an opportunity to connect with your colleagues, discuss critical tasks and issues, determine the important next steps to get work done, and collaborate to achieve more.
At their best, meetings are productive, stimulating, and worthwhile—making them powerful team motivators. At worst, however, they can be distracting, boring, and pointless—making them big time wasters.
That’s why there’s a saying: “If you want to kill time, a meeting is the best weapon.” And when you look at the numbers, you can see how true this is. Of course every
meeting is different, but they all share a common currency: time. Every meeting takes the time of every employee that comes to the meeting.
So first we must accept that there’s no such thing as a one-hour meeting—unless there’s only one participant. In other words, a one-hour meeting that includes eight employees is, in effect, an eight-hour meeting. When you think of meetings in this way, it becomes easier to understand their true cost.
In addition to the time cost, there are other costs to consider: the meeting space itself, travel, supplies, and possibly food.
The Harvard Business Review did a study of one corporation and calculated that a single weekly executive committee meeting actually resulted in a total of 300,000 hours of time spent each year.
The executive meeting itself took 7,000 person-hours per year of the executives’ time. However, there were 11 separate unit heads who spent a total of 20,000 hours a year meeting up in order to prepare for the meeting. And to support the unit head meetings, 21 teams spent a total of 63,000 hours a year amalgamating the information from the preparatory meetings. The total annual time commitment was 300,000 hours.
In a recent Plantronics survey, 40% said that, on average, three to five minutes are lost at the start of meetings because of technical difficulties or connection issues. And 51% said more than six minutes are lost. In an eight-person meeting, that adds up to almost an hour of lost time.
Of course meetings are about bringing people together to communicate with each other. So there is a social cohesion element. Get the right mix of people in a meeting, and they can share a lot of valuable information or generate innovative ideas, together.
But we also need to consider that whilst some individuals bring certain strengths to a meeting, others unfortunately may also bring weaknesses. Either way, a person’s behavior can influence the agenda, and the outcome, of the proceedings, so thinking through the invitation list is equally important.
And as today’s office can no longer be defined only by its physical space, many more of these meetings become virtual.
Virtual meeting technology has quickly become an essential tool for distributed workgroups—and in many organisations, it is the primary means by which colleagues interact with each other. As a result, there are a number of considerations that will help ensure a virtual meeting environment is working effectively for its users.
Consider the number of participants and where they are located – bigger is not always better.
Know who’s driving and who’s participating – the most successful meetings have clearly defined roles: a leader, presenters, and participants.
Plan for all devices being used – some users may be calling from their desktop, while others might be calling from a laptop, tablet, smartphone, speakerphone, or desk phone.
Identify specific tech requirements in advance – all users should be aware of any technical requirements well in advance of the conference call.
Know what needs to be seen and who needs to be heard – do the meeting participants need to see one another?
True collaboration comes from a combination of sight and sound matched with the appropriate tools, but my advice: do not underestimate the importance of setting up meetings “smartly” from the start.
A copy of the Plantronics Smarter Meeting Guide is available to download from www.plantronics.com/uk/conference-calling/smarter-meetings.jsp
Simply Smarter Meetings
Subscribe
What’s next for Leesman?
As we pass our 135,567 respondent milestone, you can stay in touch with our data and the debate around it by subscribing to the Leesman Review digitally or in print at
leesmanindex.com
Philip Vanhoutte, Sr VP & MD EMEA of Plantronics and chair of Leesman’s Advisory Board
Comment | Philip Vanhoutte
Chances are, you had a meeting at work today. Or you’re about to have one. Or two. Or more.
In January Leesman landed in the US with a permanent home in New York City and a new North American business leader, Eleanor Forster. Elle will provide a vital bridgehead to our rapidly increasing work with major US corporates.
As part of this launch we are hosting our first knowledge exchange event on Wednesday 6th April to share the findings from our 100,000+ data report, outline our new two-year Project Henley initiative and preview our IFMA
“The Rise & Rise of Activity Based Working” study on the impact of employee mobility. To register your interest for the event please visit www.leesmanindex.com/NYC or email Elle.
“YES”
“JA”
1
+–
The dominatorThe wallflowerThe agreerThe derailer
1
2
3
4
The pessimistThe noisemakerThe multitasker
5
6
7
The bright lightThe volunteerThe DaVinciThe comic
1
2
3
4
The builderThe time keeperThe ball carrier
5
6
7
2
3 3
7
6
5
4
7
6
5
1
2
4
The seven worst participants The seven best meeting participants