Embed Size (px)
Citation preview

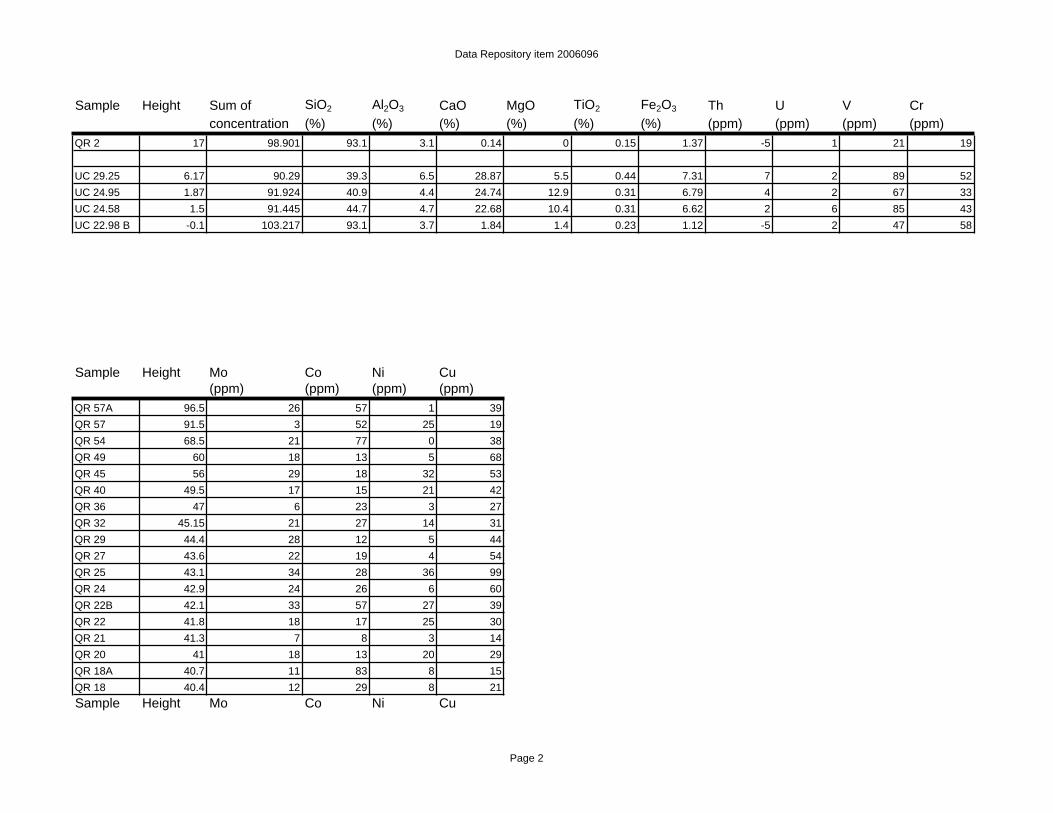
GSA Data Repository Table 1
Selected bulk-rock geochemical data for samples from the Quinn River Formation,Quinn River Crossing, Nevada and the Fantasque and Grayling Formations, Ursula Creek,British Columbia. Height for Quinn River samples refers to figure 3, height for UrsulaCreek samples refers to distance from Fantasque-Grayling contact.
Sample Height Sum of SiO2 Al2O3 CaO MgO TiO2 Fe2O3 Th U V Crconcentration (%) (%) (%) (%) (%) (%) (ppm) (ppm) (ppm) (ppm)
QR 57A 96.5 101.781 93 4.5 0.24 0.5 0.35 0.65 -2 8 104 25QR 57 91.5 86.546 25.4 1.4 33.77 20.6 0.1 2.32 1 -4 80 0QR 54 68.5 100.24 96.6 1.6 0.19 0.1 0.08 0.83 -5 4 179 11QR 49 60 97.641 82.1 7.6 0.82 0.7 0.48 2.58 1 13 187 42QR 45 56 100.543 83.6 8.4 0.57 0.7 0.45 3.59 -1 6 206 47QR 40 49.5 90.428 43.1 5.8 23.02 12.8 0.32 3.49 1 7 173 31QR 36 47 101.63 84.2 11.4 0.47 1 0.68 0.66 3 8 206 60QR 32 45.15 97.586 62.4 6.1 13.59 10 0.34 3.02 2 6 160 37QR 29 44.4 100.869 79.6 12.4 0.23 1 0.7 2.61 3 9 329 73QR 27 43.6 101.014 84 9.2 0.5 0.7 0.51 2.7 3 10 149 46QR 25 43.1 100.125 74.6 13.9 0.5 1 0.56 3.89 1 17 259 60QR 24 42.9 101.533 83.3 10.8 0.63 1 0.59 1.69 3 35 212 60QR 22B 42.1 103.324 81.1 8.9 3.95 3.1 0.44 3.3 2 9 179 45QR 22 41.8 96.439 61.1 7.9 12.85 8.8 0.43 3 3 5 111 40QR 21 41.3 101.122 84.2 11.1 0.29 0.9 0.62 0.92 4 5 161 59QR 20 41 95.345 56.2 7.6 15.21 9.9 0.42 3.5 2 8 92 54QR 18A 40.7 96.955 56.9 7.9 16.51 10.4 0.41 2.27 2 5 78 36QR 18 40.4 91.094 45.7 4.6 22.56 14.3 0.29 2.15 0 2 61 33QR 17 40.2 91.334 45.9 5.2 20.97 12.9 0.32 3.8 3 7 95 31QR 16A 40 93.703 49.7 5.3 20.74 13.7 0.32 2.14 1 3 82 36QR 16 39.8 92.839 50.1 6.6 18.42 10.6 0.39 2.48 2 4 131 52QR 15C 39.76 103.564 85 8.6 1.39 1 0.44 4.04 1 2 103 48QR 15B 39.64 104.297 90.8 7.8 0.17 1 0.44 2.25 3 4 73 63QR 15 39.4 96.942 94.6 0.8 0.15 0 0.06 0.73 -5 -1 3 -2QR 14A 38.9 103.304 98.5 1.9 0.34 0 0.09 1.28 -4 2 24 9QR 11 37.55 98.524 96.1 1.1 0.12 0 0.07 0.46 -5 0 4 3QR 6D 35 101.536 94.5 2.7 0.49 0.1 0.14 1.38 -5 1 33 27QR 5A 31.5 103.48 97.8 2.8 0.27 0 0.14 1.3 -5 0 30 4
Data Repository item 2006096
Page 1
Sample Height Sum of SiO2 Al2O3 CaO MgO TiO2 Fe2O3 Th U V Crconcentration (%) (%) (%) (%) (%) (%) (ppm) (ppm) (ppm) (ppm)
QR 2 17 98.901 93.1 3.1 0.14 0 0.15 1.37 -5 1 21 19
UC 29.25 6.17 90.29 39.3 6.5 28.87 5.5 0.44 7.31 7 2 89 52UC 24.95 1.87 91.924 40.9 4.4 24.74 12.9 0.31 6.79 4 2 67 33UC 24.58 1.5 91.445 44.7 4.7 22.68 10.4 0.31 6.62 2 6 85 43UC 22.98 B -0.1 103.217 93.1 3.7 1.84 1.4 0.23 1.12 -5 2 47 58
Sample Height Mo Co Ni Cu(ppm) (ppm) (ppm) (ppm)
QR 57A 96.5 26 57 1 39QR 57 91.5 3 52 25 19QR 54 68.5 21 77 0 38QR 49 60 18 13 5 68QR 45 56 29 18 32 53QR 40 49.5 17 15 21 42QR 36 47 6 23 3 27QR 32 45.15 21 27 14 31QR 29 44.4 28 12 5 44QR 27 43.6 22 19 4 54QR 25 43.1 34 28 36 99QR 24 42.9 24 26 6 60QR 22B 42.1 33 57 27 39QR 22 41.8 18 17 25 30QR 21 41.3 7 8 3 14QR 20 41 18 13 20 29QR 18A 40.7 11 83 8 15QR 18 40.4 12 29 8 21Sample Height Mo Co Ni Cu
Data Repository item 2006096
Page 2

(ppm) (ppm) (ppm) (ppm)QR 17 40.2 11 22 32 18QR 16A 40 10 90 12 19QR 16 39.8 9 28 31 24QR 15C 39.76 6 33 2 55QR 15B 39.64 4 102 3 46QR 15 39.4 4 220 -5 18QR 14A 38.9 5 158 -5 8QR 11 37.55 5 334 -6 6QR 6D 35 4 176 -1 10QR 5A 31.5 4 111 -2 13QR 2 17 4 118 -2 15
UC 29.25 6.17 9 22 20 20UC 24.95 1.87 6 33 16 20UC 24.58 1.5 6 55 23 20UC 22.98 B -0.1 4 36 13 16
The results reported as negative numbers are below the detection limitNegative numbers can occur at low concentrations when the calibration line(concentration vs corrected intensity) misses the origin (Teague, T., written comm. Sept. 2005).
Data Repository item 2006096
Page 3
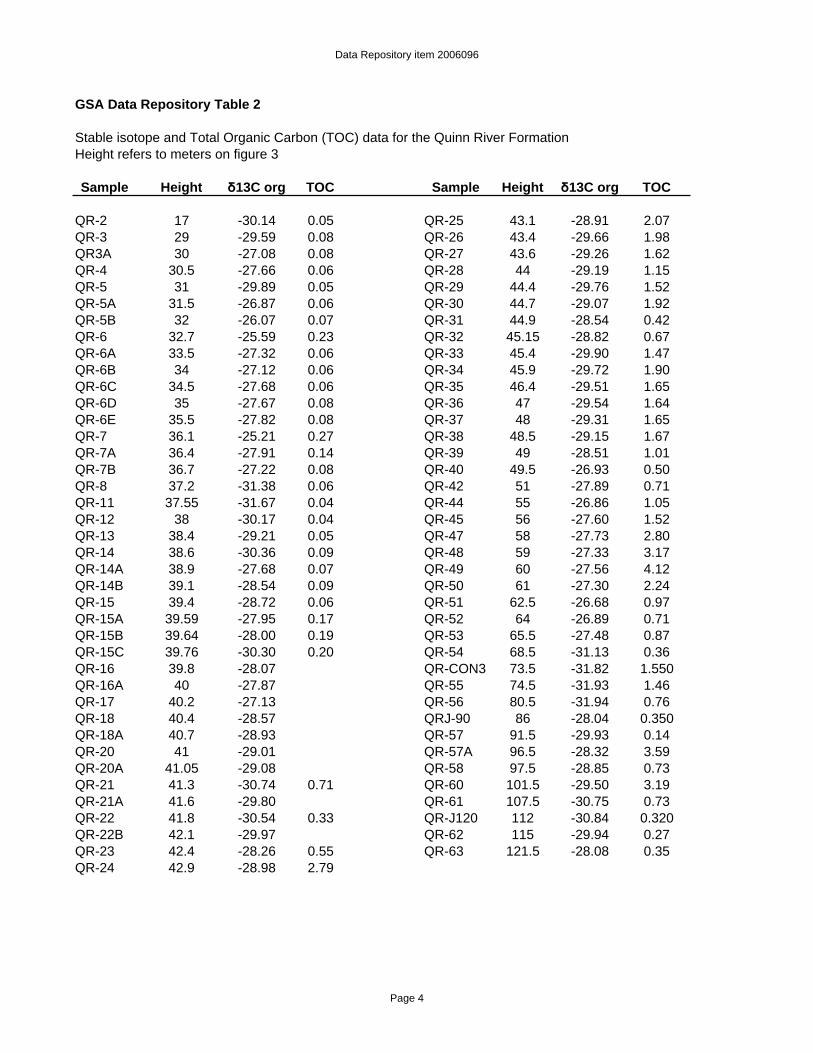
GSA Data Repository Table 2
Stable isotope and Total Organic Carbon (TOC) data for the Quinn River FormationHeight refers to meters on figure 3
Sample Height 13C org TOC Sample Height 13C org TOC
QR-2 17 -30.14 0.05 QR-25 43.1 -28.91 2.07QR-3 29 -29.59 0.08 QR-26 43.4 -29.66 1.98QR3A 30 -27.08 0.08 QR-27 43.6 -29.26 1.62QR-4 30.5 -27.66 0.06 QR-28 44 -29.19 1.15QR-5 31 -29.89 0.05 QR-29 44.4 -29.76 1.52QR-5A 31.5 -26.87 0.06 QR-30 44.7 -29.07 1.92QR-5B 32 -26.07 0.07 QR-31 44.9 -28.54 0.42QR-6 32.7 -25.59 0.23 QR-32 45.15 -28.82 0.67QR-6A 33.5 -27.32 0.06 QR-33 45.4 -29.90 1.47QR-6B 34 -27.12 0.06 QR-34 45.9 -29.72 1.90QR-6C 34.5 -27.68 0.06 QR-35 46.4 -29.51 1.65QR-6D 35 -27.67 0.08 QR-36 47 -29.54 1.64QR-6E 35.5 -27.82 0.08 QR-37 48 -29.31 1.65QR-7 36.1 -25.21 0.27 QR-38 48.5 -29.15 1.67QR-7A 36.4 -27.91 0.14 QR-39 49 -28.51 1.01QR-7B 36.7 -27.22 0.08 QR-40 49.5 -26.93 0.50QR-8 37.2 -31.38 0.06 QR-42 51 -27.89 0.71QR-11 37.55 -31.67 0.04 QR-44 55 -26.86 1.05QR-12 38 -30.17 0.04 QR-45 56 -27.60 1.52QR-13 38.4 -29.21 0.05 QR-47 58 -27.73 2.80QR-14 38.6 -30.36 0.09 QR-48 59 -27.33 3.17QR-14A 38.9 -27.68 0.07 QR-49 60 -27.56 4.12QR-14B 39.1 -28.54 0.09 QR-50 61 -27.30 2.24QR-15 39.4 -28.72 0.06 QR-51 62.5 -26.68 0.97QR-15A 39.59 -27.95 0.17 QR-52 64 -26.89 0.71QR-15B 39.64 -28.00 0.19 QR-53 65.5 -27.48 0.87QR-15C 39.76 -30.30 0.20 QR-54 68.5 -31.13 0.36QR-16 39.8 -28.07 QR-CON3 73.5 -31.82 1.550QR-16A 40 -27.87 QR-55 74.5 -31.93 1.46QR-17 40.2 -27.13 QR-56 80.5 -31.94 0.76QR-18 40.4 -28.57 QRJ-90 86 -28.04 0.350QR-18A 40.7 -28.93 QR-57 91.5 -29.93 0.14QR-20 41 -29.01 QR-57A 96.5 -28.32 3.59QR-20A 41.05 -29.08 QR-58 97.5 -28.85 0.73QR-21 41.3 -30.74 0.71 QR-60 101.5 -29.50 3.19QR-21A 41.6 -29.80 QR-61 107.5 -30.75 0.73QR-22 41.8 -30.54 0.33 QR-J120 112 -30.84 0.320QR-22B 42.1 -29.97 QR-62 115 -29.94 0.27QR-23 42.4 -28.26 0.55 QR-63 121.5 -28.08 0.35QR-24 42.9 -28.98 2.79
Data Repository item 2006096
Page 4

DR1


DR6


DR8

DR9

DR10

DR11

DR12
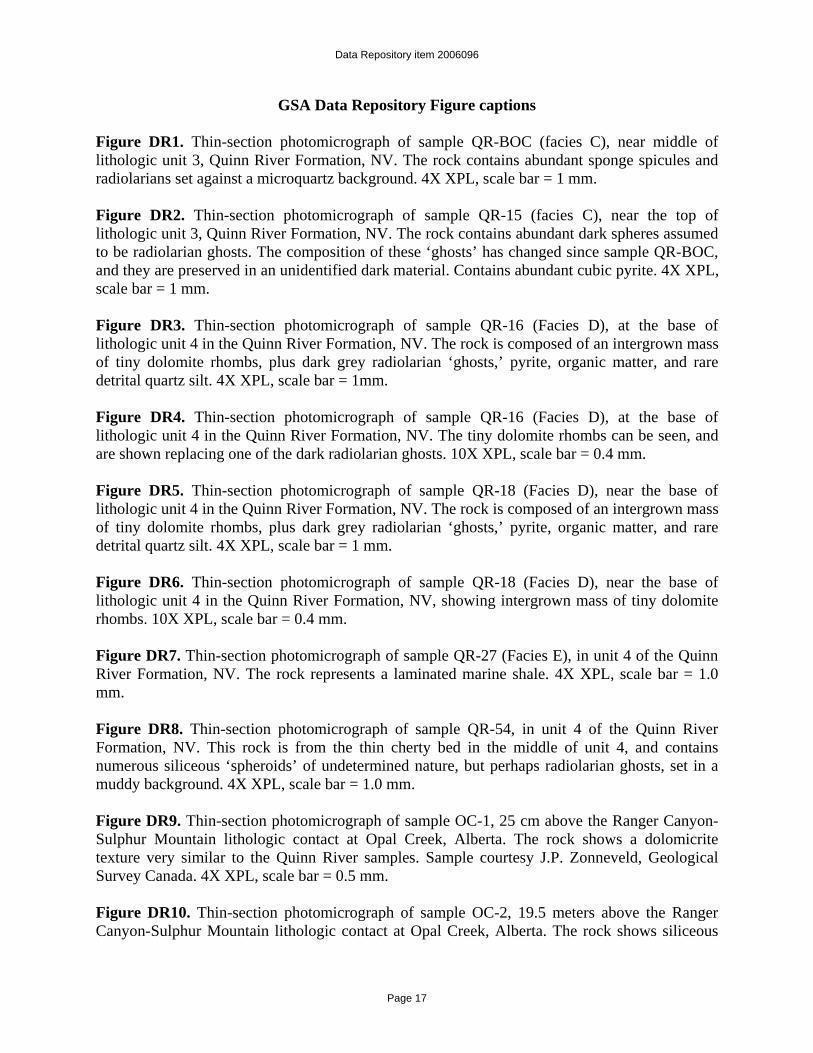
GSA Data Repository Figure captions
Figure DR1. Thin-section photomicrograph of sample QR-BOC (facies C), near middle of lithologic unit 3, Quinn River Formation, NV. The rock contains abundant sponge spicules and radiolarians set against a microquartz background. 4X XPL, scale bar = 1 mm.
Figure DR2. Thin-section photomicrograph of sample QR-15 (facies C), near the top of lithologic unit 3, Quinn River Formation, NV. The rock contains abundant dark spheres assumed to be radiolarian ghosts. The composition of these ‘ghosts’ has changed since sample QR-BOC, and they are preserved in an unidentified dark material. Contains abundant cubic pyrite. 4X XPL, scale bar = 1 mm.
Figure DR3. Thin-section photomicrograph of sample QR-16 (Facies D), at the base of lithologic unit 4 in the Quinn River Formation, NV. The rock is composed of an intergrown mass of tiny dolomite rhombs, plus dark grey radiolarian ‘ghosts,’ pyrite, organic matter, and rare detrital quartz silt. 4X XPL, scale bar = 1mm.
Figure DR4. Thin-section photomicrograph of sample QR-16 (Facies D), at the base of lithologic unit 4 in the Quinn River Formation, NV. The tiny dolomite rhombs can be seen, and are shown replacing one of the dark radiolarian ghosts. 10X XPL, scale bar = 0.4 mm.
Figure DR5. Thin-section photomicrograph of sample QR-18 (Facies D), near the base of lithologic unit 4 in the Quinn River Formation, NV. The rock is composed of an intergrown mass of tiny dolomite rhombs, plus dark grey radiolarian ‘ghosts,’ pyrite, organic matter, and rare detrital quartz silt. 4X XPL, scale bar = 1 mm.
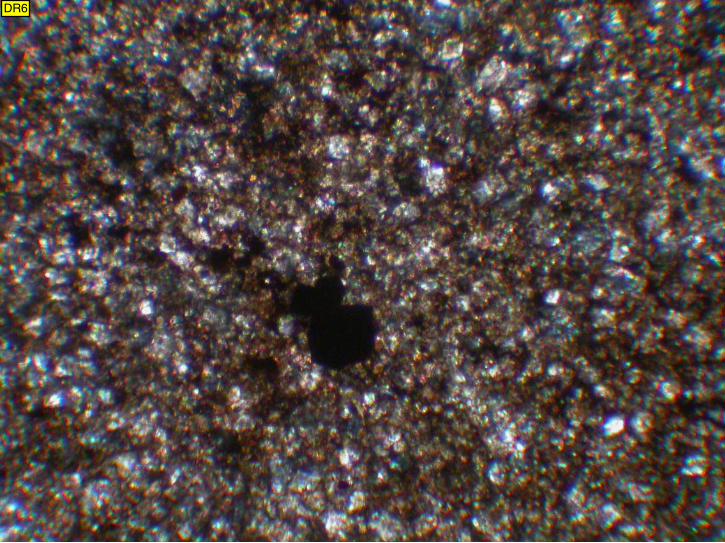
Figure DR6. Thin-section photomicrograph of sample QR-18 (Facies D), near the base of lithologic unit 4 in the Quinn River Formation, NV, showing intergrown mass of tiny dolomite rhombs. 10X XPL, scale bar = 0.4 mm.
Figure DR7. Thin-section photomicrograph of sample QR-27 (Facies E), in unit 4 of the Quinn River Formation, NV. The rock represents a laminated marine shale. 4X XPL, scale bar = 1.0 mm.
Figure DR8. Thin-section photomicrograph of sample QR-54, in unit 4 of the Quinn River Formation, NV. This rock is from the thin cherty bed in the middle of unit 4, and contains numerous siliceous ‘spheroids’ of undetermined nature, but perhaps radiolarian ghosts, set in a muddy background. 4X XPL, scale bar = 1.0 mm.
Figure DR9. Thin-section photomicrograph of sample OC-1, 25 cm above the Ranger Canyon-Sulphur Mountain lithologic contact at Opal Creek, Alberta. The rock shows a dolomicrite texture very similar to the Quinn River samples. Sample courtesy J.P. Zonneveld, Geological Survey Canada. 4X XPL, scale bar = 0.5 mm.
Figure DR10. Thin-section photomicrograph of sample OC-2, 19.5 meters above the Ranger Canyon-Sulphur Mountain lithologic contact at Opal Creek, Alberta. The rock shows siliceous
Data Repository item 2006096
Page 17

‘spheroids’ similar to sample QR-54 at Quinn River. The presence of these ‘spheroids’ in Griesbachian strata at Opal Creek questions their utility as a precise marker within the Lower Triassic. However, they have not been reported from the Middle Triassic, and therefore may still be useful as a Lower Triassic marker. Background matrix material not identified. Sample courtesy J.P. Zonneveld, Geological Survey Canada. 4X XPL, scale bar = 0.5 mm.
Figure DR11. Thin-section photomicrograph of sample UC 24.95, 1.87 meters above the Fantasque-Grayling lithologic contact at Ursula Creek, British Columbia. The rock shows a typical dolomicrite texture. Sample courtesy Tyler Beatty, University of Calgary. 8X XPL, scale bar = 0.25 mm.
Figure DR12. Radiolarians(?) extracted from a sample at the same horizon as QR-16 in the base of lithologic unit 4, Quinn River Formation, NV. Sample extraction courtesy Tyler Beatty, University of Calgary. Each box 3.5 mm.
Data Repository item 2006096
Page 18