Embed Size (px)
Citation preview
1
CS 112 Introduction to Programming
(Spring 2012)
Lecture #22: Case Study – Purple America
Zhong Shao
Department of Computer Science
Yale University Office: 314 Watson
http://flint.cs.yale.edu/cs112
Acknowledgements: some slides used in this class are taken directly or adapted from those accompanying the textbook: Introduction to Programming in Java: An Interdisciplinary Approach by Robert Sedgewick and Kevin Wayne (Copyright 2002-2010)
2
Data Visualization
Challenge. Visualize election results.
“ If I can't picture it, I can't understand it. ” — Albert Einstein
McCain
Obama
2008 Presidential election
3
Data Visualization
Approach. Gather data from data sources on the web; save in local files. Build a modular program that reads files and draws maps.
McCain
Obama
2008 Presidential election
Data Sources
2
5
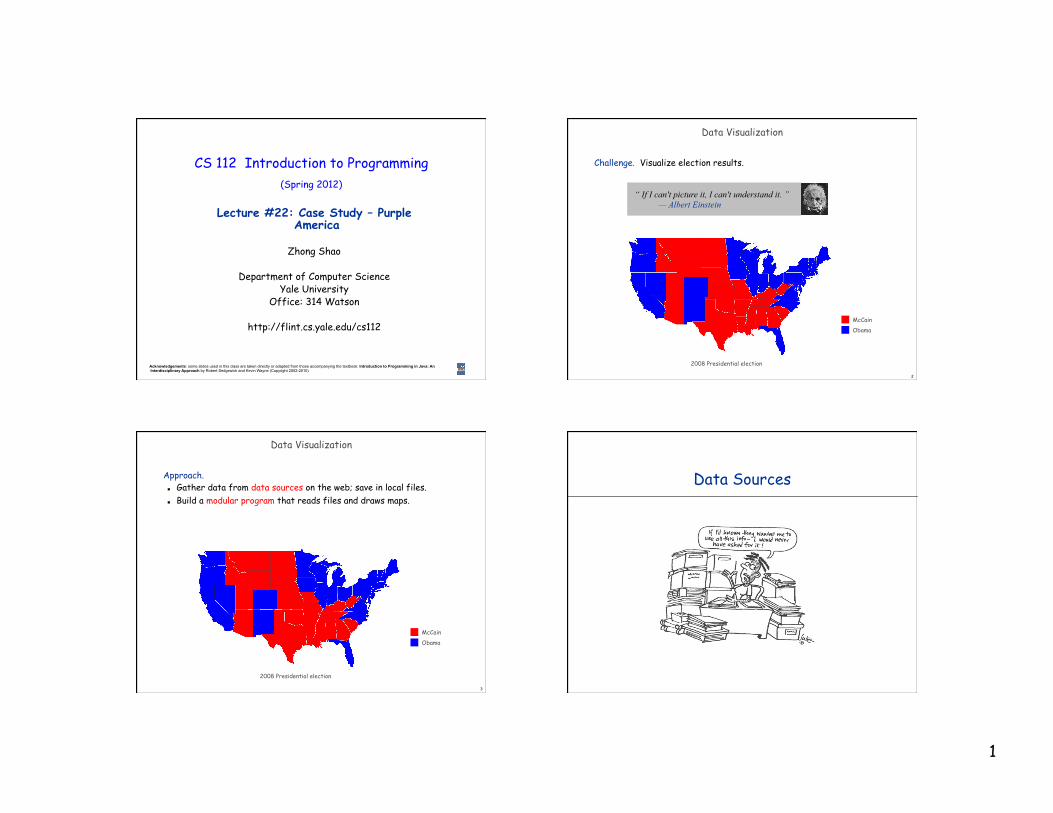
Locate the Data Sources
Geometric data. www.census.gov/tiger/boundary Text files have boundaries of every state and county.
(format useful for programmers) Election returns.
www.uselectionatlas.org Web site displays election results.
(need to screen scrape to extract raw data) Emerging standard. Publish data in text format on the web (like geometric data). Write mashup program to produce visuals (like we’re doing)!
6
Geometric Data: States within the Continental US
USA data file. State names and boundary points.
% more USA.txt -124.731216 24.544102 -66.980385 49.384365 104 Alabama 498 -88.200027 34.995548 -88.202919 35.007942 … New Jersey 368 -74.695305 41.357330 -74.461754 41.250000 -74.366302 41.202801 … -74.721313 41.347294 …
number of regions
bounding box
368 points (longitude, latitude)
(-124.73, 24.54)
(-66.98, 49.38)
region
7
Geometric Data: Counties within a State
State data files. County names and boundary points.
% more NJ.txt -75.560143 38.928589 -73.894402 41.35733 21 Atlantic 127 -74.877563 39.608414 -74.736694 39.729721 … Mercer 88 -74.748825 40.424248 -74.722702 40.375301 -74.674507 40.384399 … -74.808403 40.415401 …
88 points (longitude, latitude)
(-75.56, 38.92)
(-73.89, 41.35)
bounding box
number of regions
region
8
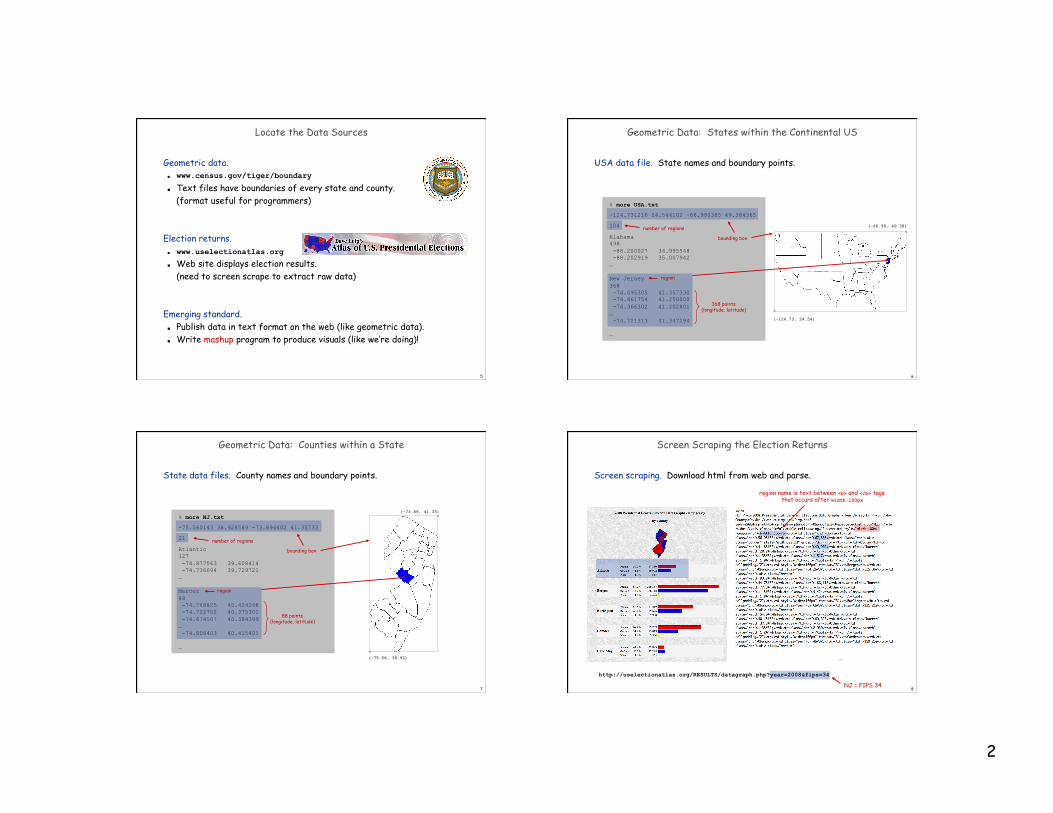
Screen Scraping the Election Returns
Screen scraping. Download html from web and parse.
…
http://uselectionatlas.org/RESULTS/datagraph.php?year=2008&fips=34
region name is text between <b> and </b> tags that occurs after width:100px
NJ = FIPS 34
3
9
Screen Scraping the Election Returns (Java sketch)
int year = 2008; // election year String whole = "NJ"; // region name for New Jersey int fips = 34; // FIPS code for New Jersey String url = "http://uselectionatlas.org/RESULTS/datagraph.php"; In in = new In(url + "?year=" + year + "&fips=" fips); Out file = new Out(whole + year + ".txt"); String input = in.readAll(); while (true) { // screen scrape region name int p = input.indexOf("width:100px", p); if (p == -1) break; int from = input.indexOf("<b>", p); int to = input.indexOf("</b>", from); String region = input.substring(from + 3, to); // screen scrape vote totals for each candidate // save results to file file.println(region + "," + mccain + "," + obama + "," + other + ","); }
extract text between <b> and </b> tags, that occurs after width:100px
NJ2008.txt
10
Election Returns: By County
Screen-scraped results. Votes for McCain, Obama, Other by region.
% more NJ2008.txt Atlantic,49902,67830,1517, Bergen,186118,225367,4424, Burlington,89626,131219,2930, Camden,73819,159259,3304, Cape May,27288,22893,802, Cumberland,22360,34919,915, Essex,74063,240306,2181, Gloucester,60315,77267,1848, Hudson,55360,154140,2116, Hunterdon,39092,29776,1147, Mercer,50223,107926,2229, Middlesex,123695,193812,4283, Monmouth,160433,148737,4244, Morris,132331,112275,2913, Ocean,160677,110189,4111, Passaic,72552,113257,1904, Salem,14816,16044,672, Somerset,70085,79321,1672, Sussex,44184,28840,1393, Union,78768,141417,2241, Warren,27500,20628,980,
50,223 McCain 107,926 Obama 2,229 Other
11
Election Returns: By State
Screen-scraped results. Votes for McCain, Obama, Other by region.
% more USA2008.txt Alabama,1266546,813479,19773, Alaska,193841,123594,8762, Arizona,1230111,1034707,39020, Arkansas,638017,422310,26290, California,5011781,8274473,289260, Colorado,1073584,1288568,39197, Connecticut,629428,997772,19592, Delaware,152374,255459,4579, District of Columbia,17367,245800,2686, Florida,4045624,4282074,82621, Georgia,2048744,1844137,39222, Hawaii,120566,325871,7131, Idaho,403012,236440,17978, Illinois,2031527,3419673,71851, … Virginia,1725005,1959532,38723, Washington,1229216,1750848,68820, West Virginia,398061,304127,12550, Wisconsin,1262393,1677211,43813, Wyoming,164958,82868,6832,
2,048744 McCain 1,84,4137 Obama 39,222 Other Northampton
Charlottesville
12
Real Data are Messy
Different data sources have different conventions. State names: NJ vs. New Jersey vs. FIPS 34. County names: LaSalle vs. La Salle, Kings County vs. Brooklyn.
Other annoyances. A state can be comprised of several disjoint polygons. A county can be entirely inside another county. County boundaries change over time. Write-in candidates. Unreported results. Alaska and Hawaii.
Bottom line. Must clean the data (but write a program to do most of it!)
4
13
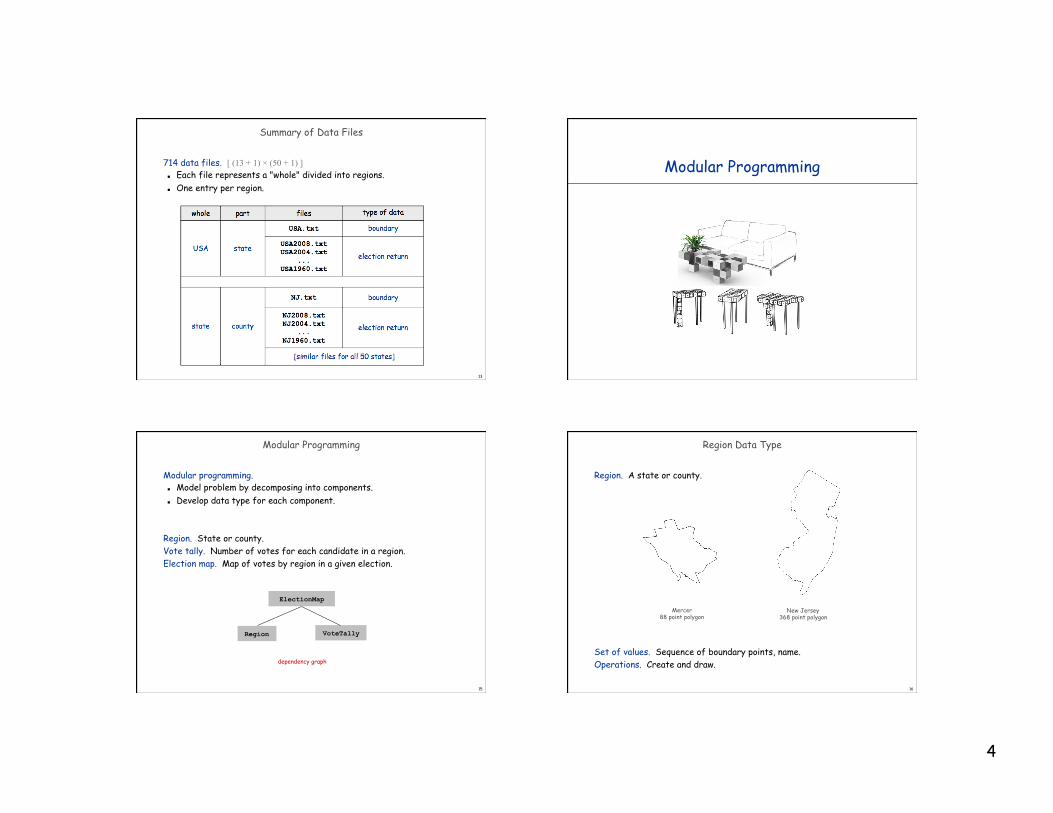
Summary of Data Files
714 data files. [ (13 + 1) × (50 + 1) ] Each file represents a "whole" divided into regions. One entry per region.
Modular Programming
15
Modular Programming
Modular programming. Model problem by decomposing into components. Develop data type for each component.
Region. State or county. Vote tally. Number of votes for each candidate in a region. Election map. Map of votes by region in a given election.
ElectionMap
Region VoteTally
dependency graph
16
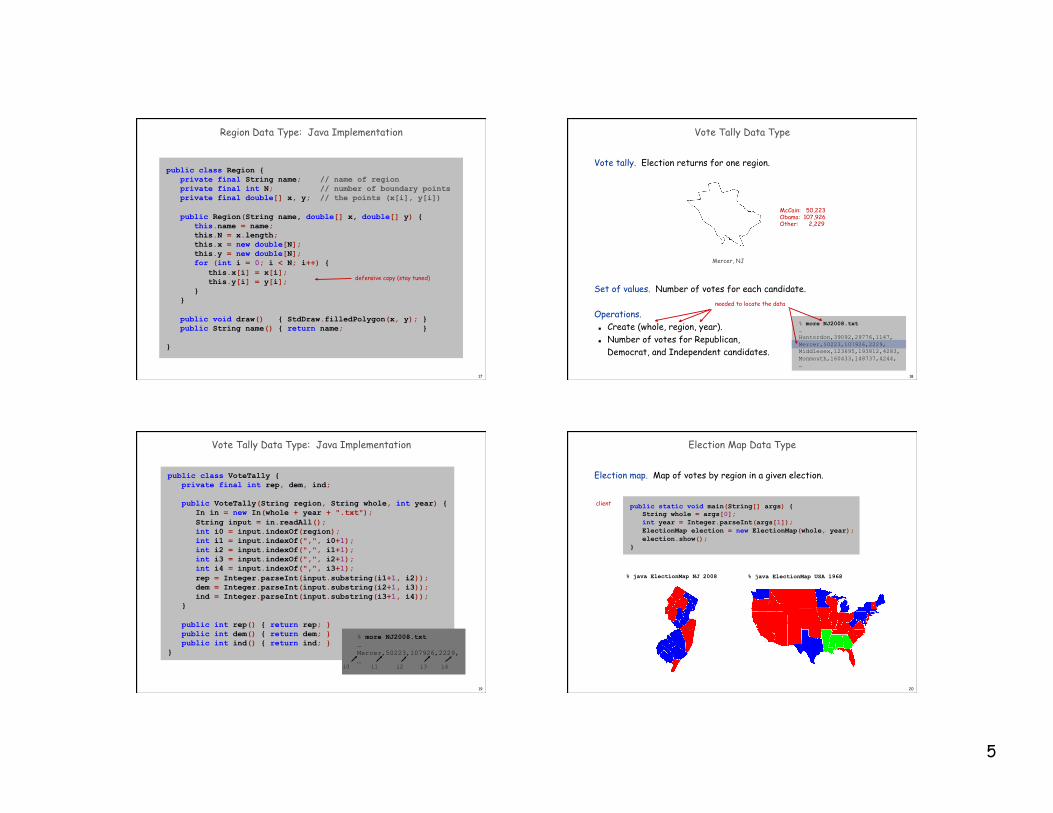
Region Data Type
Region. A state or county. Set of values. Sequence of boundary points, name. Operations. Create and draw.
New Jersey 368 point polygon
Mercer 88 point polygon
5
17
Region Data Type: Java Implementation
public class Region { private final String name; // name of region private final int N; // number of boundary points private final double[] x, y; // the points (x[i], y[i]) public Region(String name, double[] x, double[] y) { this.name = name; this.N = x.length; this.x = new double[N]; this.y = new double[N]; for (int i = 0; i < N; i++) { this.x[i] = x[i]; this.y[i] = y[i]; } } public void draw() { StdDraw.filledPolygon(x, y); } public String name() { return name; } }
defensive copy (stay tuned)
18
Vote Tally Data Type
Vote tally. Election returns for one region. Set of values. Number of votes for each candidate. Operations. Create (whole, region, year). Number of votes for Republican,
Democrat, and Independent candidates.
Mercer, NJ
needed to locate the data
% more NJ2008.txt … Hunterdon,39092,29776,1147, Mercer,50223,107926,2229, Middlesex,123695,193812,4283, Monmouth,160433,148737,4244, …
McCain: 50,223 Obama: 107,926 Other: 2,229
19
Vote Tally Data Type: Java Implementation
public class VoteTally { private final int rep, dem, ind; public VoteTally(String region, String whole, int year) { In in = new In(whole + year + ".txt"); String input = in.readAll(); int i0 = input.indexOf(region); int i1 = input.indexOf(",", i0+1); int i2 = input.indexOf(",", i1+1); int i3 = input.indexOf(",", i2+1); int i4 = input.indexOf(",", i3+1); rep = Integer.parseInt(input.substring(i1+1, i2)); dem = Integer.parseInt(input.substring(i2+1, i3)); ind = Integer.parseInt(input.substring(i3+1, i4)); } public int rep() { return rep; } public int dem() { return dem; } public int ind() { return ind; } }
% more NJ2008.txt … Mercer,50223,107926,2229, … i1 i2 i3 i4 i0
20
Election Map Data Type
Election map. Map of votes by region in a given election.
public static void main(String[] args) { String whole = args[0]; int year = Integer.parseInt(args[1]); ElectionMap election = new ElectionMap(whole, year); election.show(); }
% java ElectionMap USA 1968 % java ElectionMap NJ 2008
client
6
21
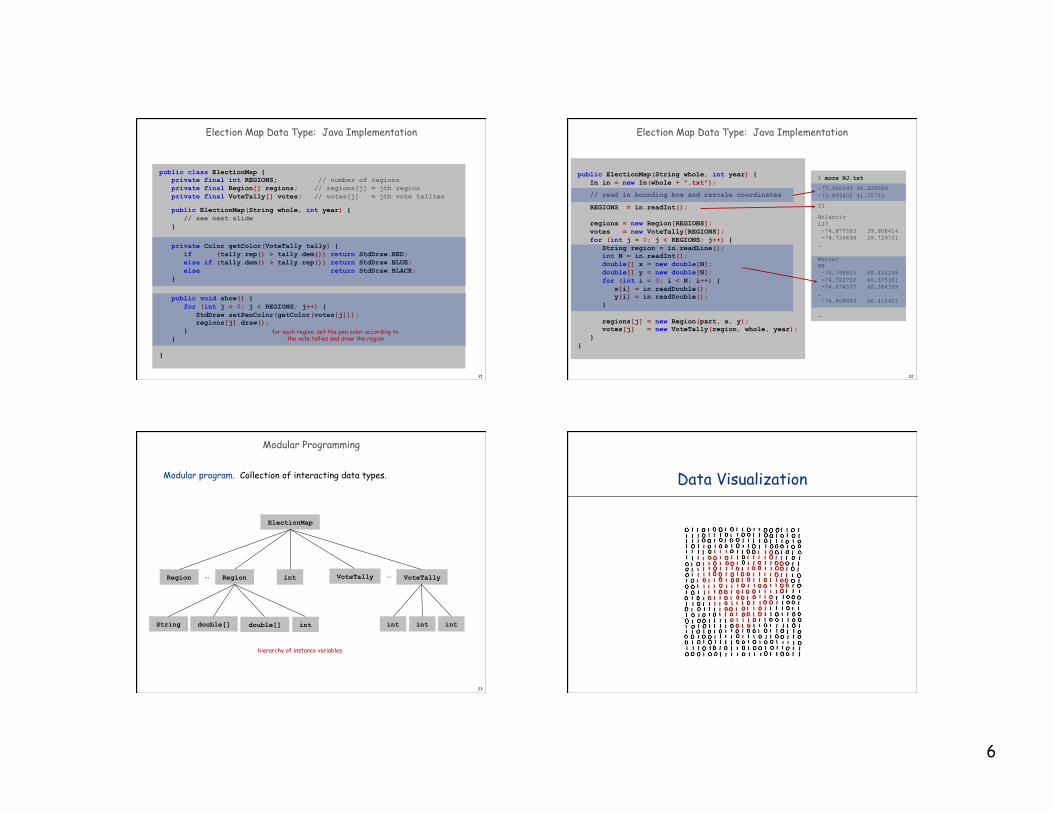
Election Map Data Type: Java Implementation
public class ElectionMap { private final int REGIONS; // number of regions private final Region[] regions; // regions[j] = jth region private final VoteTally[] votes; // votes[j] = jth vote tallies public ElectionMap(String whole, int year) { // see next slide } private Color getColor(VoteTally tally) { if (tally.rep() > tally.dem()) return StdDraw.RED; else if (tally.dem() > tally.rep()) return StdDraw.BLUE; else return StdDraw.BLACK; } public void show() { for (int j = 0; j < REGIONS; j++) { StdDraw.setPenColor(getColor(votes[j])); regions[j].draw(); } } }
for each region, set the pen color according to the vote tallies and draw the region
22
Election Map Data Type: Java Implementation
public ElectionMap(String whole, int year) { In in = new In(whole + ".txt"); // read in bounding box and rescale coordinates REGIONS = in.readInt(); regions = new Region[REGIONS]; votes = new VoteTally[REGIONS]; for (int j = 0; j < REGIONS; j++) { String region = in.readLine(); int N = in.readInt(); double[] x = new double[N]; double[] y = new double[N]; for (int i = 0; i < N; i++) { x[i] = in.readDouble(); y[i] = in.readDouble(); } regions[j] = new Region(part, x, y); votes[j] = new VoteTally(region, whole, year); } }
use polygon, region, and vote tally data types to build map
% more NJ.txt -75.560143 38.928589 -73.894402 41.35733 21 Atlantic 127 -74.877563 39.608414 -74.736694 39.729721 … Mercer 88 -74.748825 40.424248 -74.722702 40.375301 -74.674507 40.384399 … -74.808403 40.415401 …
23
Modular Programming
Modular program. Collection of interacting data types.
ElectionMap
Region int Region
String
VoteTally
int int int
… VoteTally …
int double[]
hierarchy of instance variables
double[]
Data Visualization
7
25
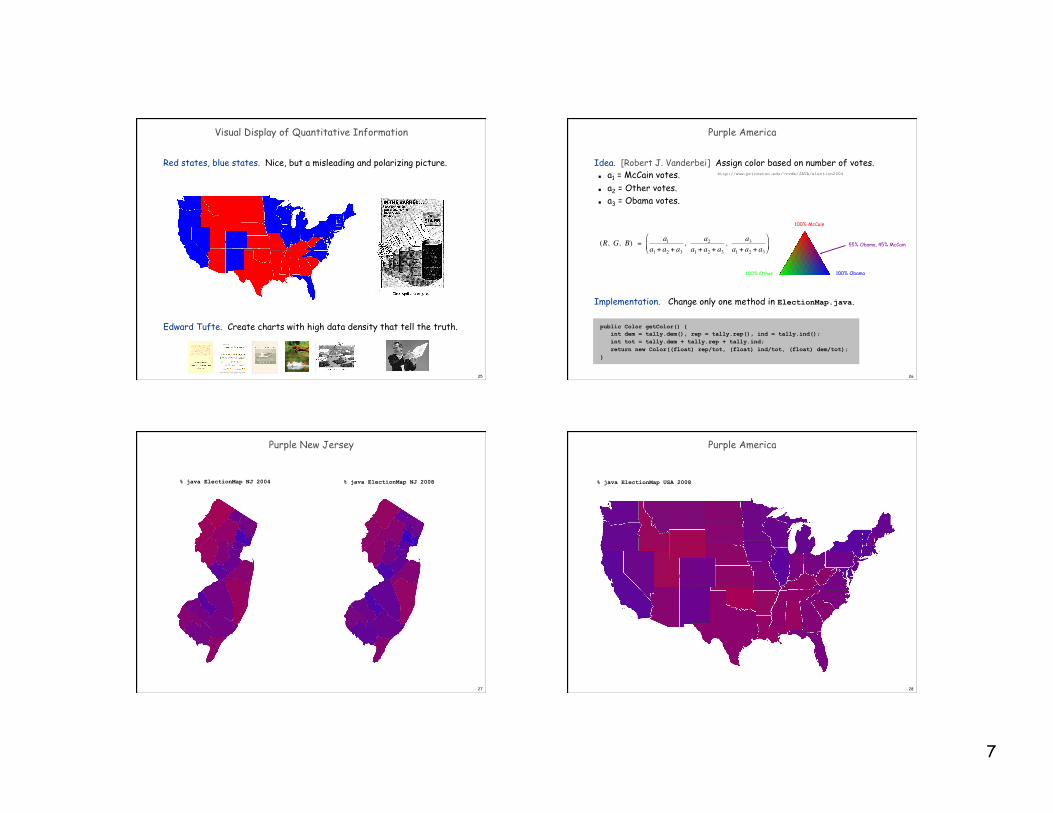
Visual Display of Quantitative Information
Red states, blue states. Nice, but a misleading and polarizing picture. Edward Tufte. Create charts with high data density that tell the truth.
26
Purple America
Idea. [Robert J. Vanderbei] Assign color based on number of votes. a1 = McCain votes. a2 = Other votes. a3 = Obama votes.
Implementation. Change only one method in ElectionMap.java.
100% Obama
100% McCain
100% Other
!
(R, G, B) = a1
a1 + a2 + a3
, a2
a1 + a2 + a3
, a3
a1 + a2 + a3
"
# $
%
& ' 55% Obama, 45% McCain
public Color getColor() { int dem = tally.dem(), rep = tally.rep(), ind = tally.ind(); int tot = tally.dem + tally.rep + tally.ind; return new Color((float) rep/tot, (float) ind/tot, (float) dem/tot); }
http://www.princeton.edu/~rvdb/JAVA/election2004
27
Purple New Jersey
% java ElectionMap NJ 2004 % java ElectionMap NJ 2008
28
Purple America
% java ElectionMap USA 2008
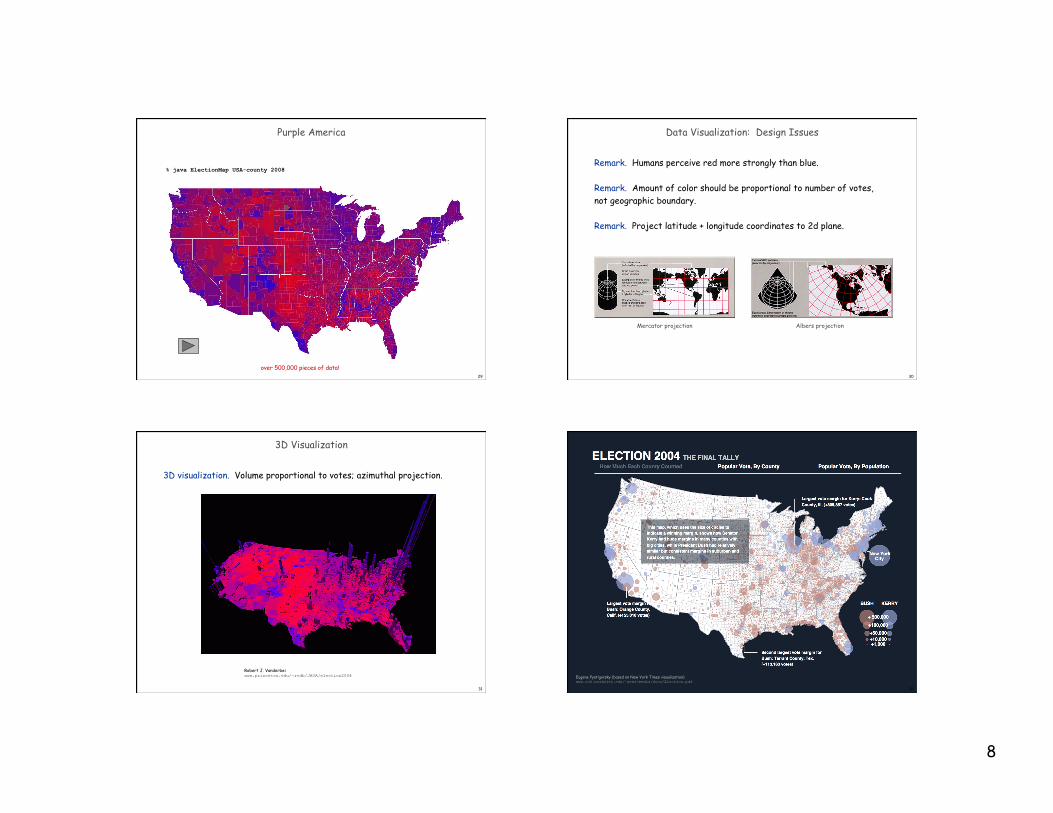
8
29
Purple America
% java ElectionMap USA-county 2008
over 500,000 pieces of data! 30
Data Visualization: Design Issues
Remark. Humans perceive red more strongly than blue. Remark. Amount of color should be proportional to number of votes, not geographic boundary. Remark. Project latitude + longitude coordinates to 2d plane.
Mercator projection Albers projection
31
3D Visualization
3D visualization. Volume proportional to votes; azimuthal projection.
Robert J. Vanderbei www.princeton.edu/~rvdb/JAVA/election2004
32 Eugene Pyatigorsky (based on New York Times visualization) www.ocf.berkeley.edu/~gene/media/docs/Election.pdf
9
33
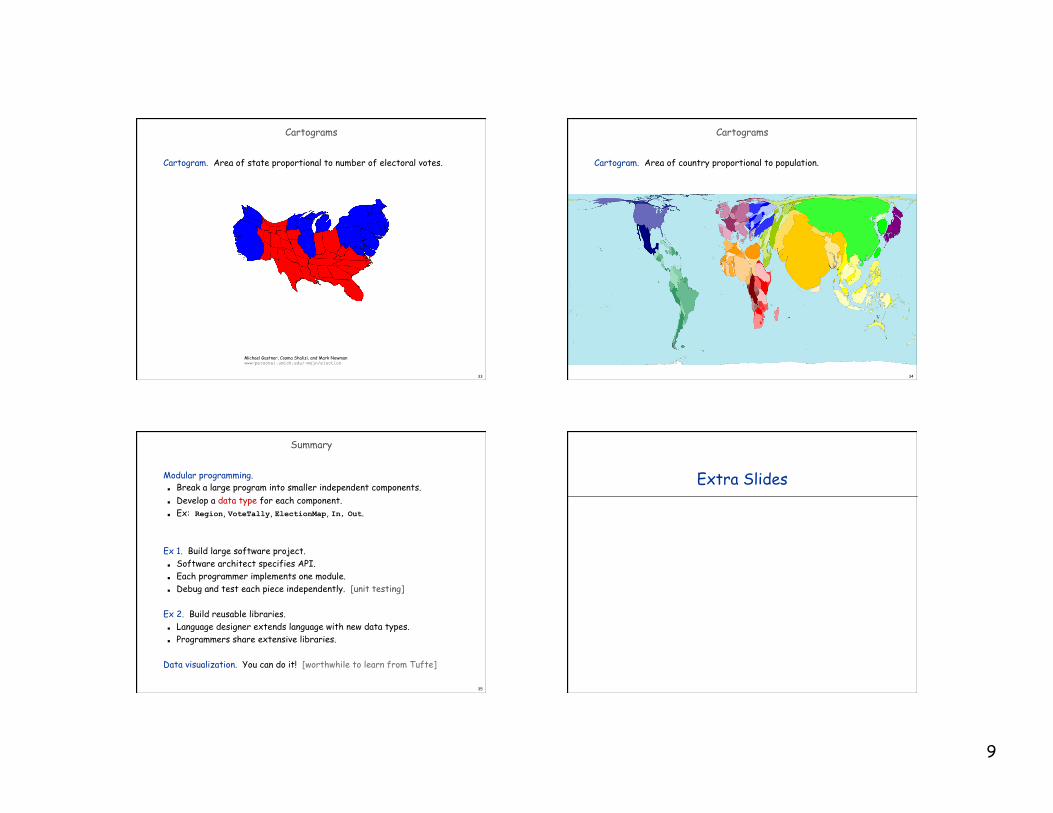
Cartograms
Cartogram. Area of state proportional to number of electoral votes.
Michael Gastner, Cosma Shalizi, and Mark Newman www-personal.umich.edu/~mejn/election
34
Cartograms
Cartogram. Area of country proportional to population.
35
Summary
Modular programming. Break a large program into smaller independent components. Develop a data type for each component. Ex: Region, VoteTally, ElectionMap, In, Out.
Ex 1. Build large software project. Software architect specifies API. Each programmer implements one module. Debug and test each piece independently. [unit testing]
Ex 2. Build reusable libraries. Language designer extends language with new data types. Programmers share extensive libraries.
Data visualization. You can do it! [worthwhile to learn from Tufte]
Extra Slides
10
Interactive Maps
38
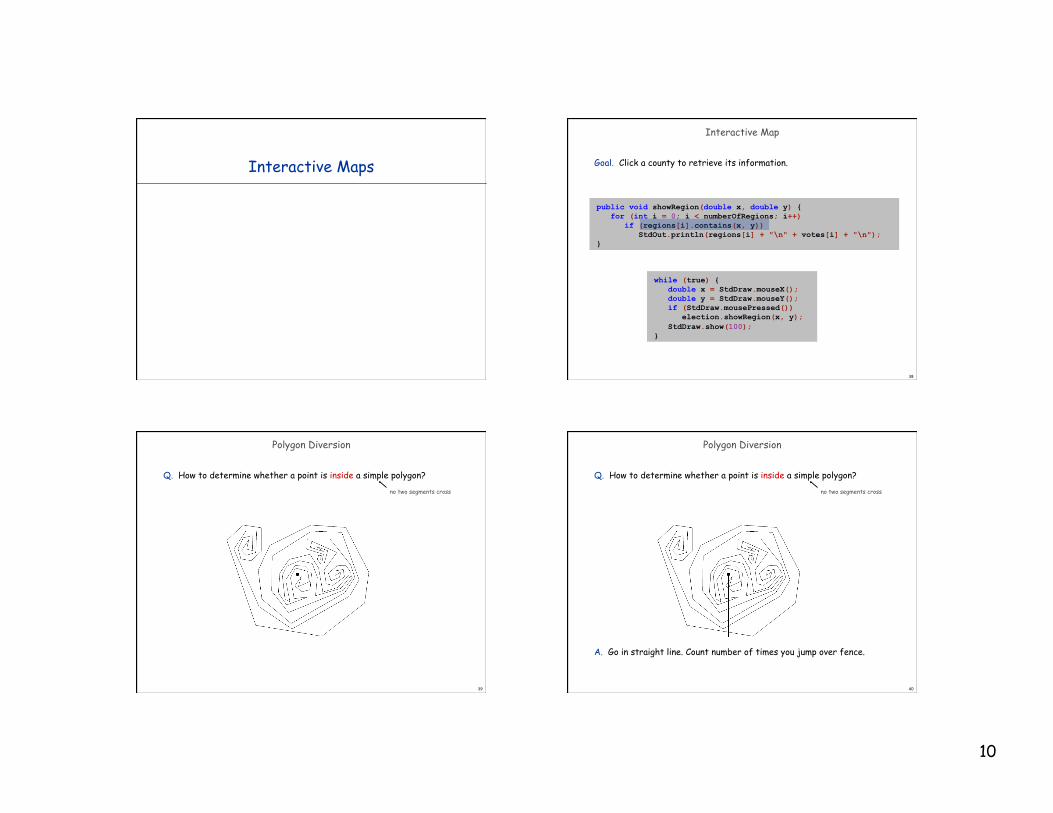
Interactive Map
Goal. Click a county to retrieve its information.
public void showRegion(double x, double y) { for (int i = 0; i < numberOfRegions; i++) if (regions[i].contains(x, y)) StdOut.println(regions[i] + "\n" + votes[i] + "\n"); }
while (true) { double x = StdDraw.mouseX(); double y = StdDraw.mouseY(); if (StdDraw.mousePressed()) election.showRegion(x, y); StdDraw.show(100); }
39
Polygon Diversion
Q. How to determine whether a point is inside a simple polygon? no two segments cross
40
Polygon Diversion
Q. How to determine whether a point is inside a simple polygon? A. Go in straight line. Count number of times you jump over fence.
no two segments cross
11
41
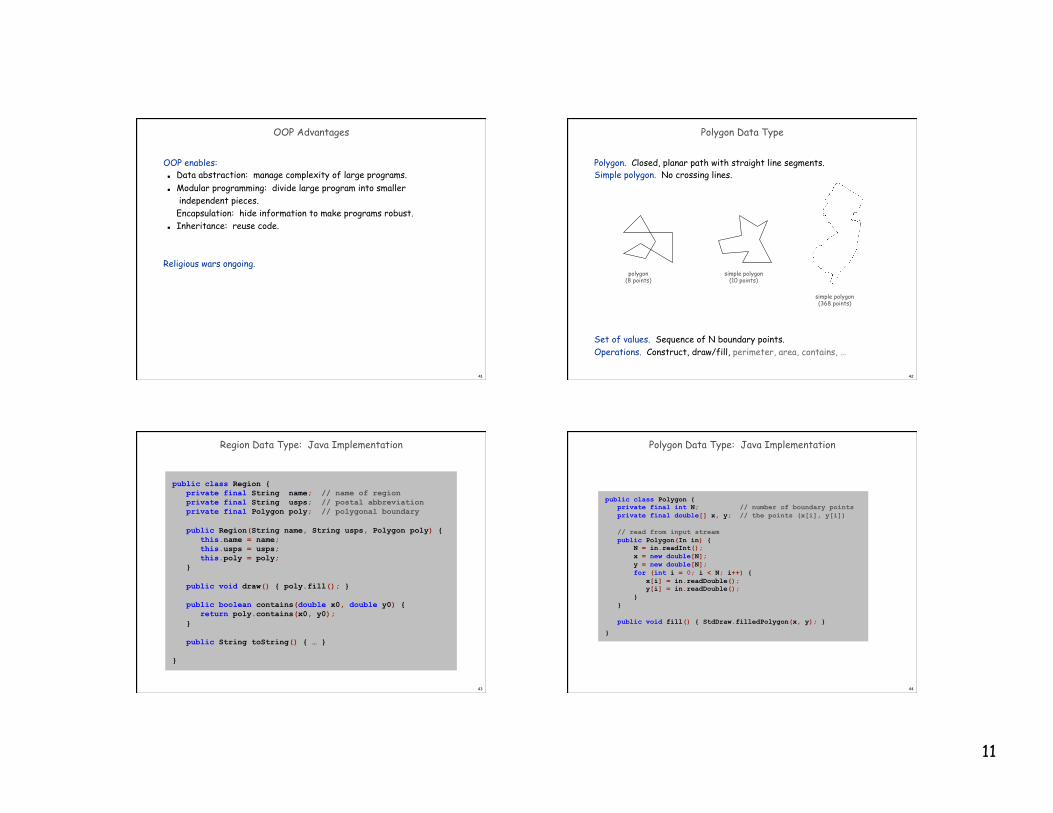
OOP Advantages
OOP enables: Data abstraction: manage complexity of large programs. Modular programming: divide large program into smaller
independent pieces. Encapsulation: hide information to make programs robust.
Inheritance: reuse code.
Religious wars ongoing.
42
Polygon Data Type
Polygon. Closed, planar path with straight line segments. Simple polygon. No crossing lines. Set of values. Sequence of N boundary points. Operations. Construct, draw/fill, perimeter, area, contains, …
polygon (8 points)
simple polygon (368 points)
simple polygon (10 points)
43
Region Data Type: Java Implementation
public class Region { private final String name; // name of region private final String usps; // postal abbreviation private final Polygon poly; // polygonal boundary public Region(String name, String usps, Polygon poly) { this.name = name; this.usps = usps; this.poly = poly; } public void draw() { poly.fill(); } public boolean contains(double x0, double y0) { return poly.contains(x0, y0); } public String toString() { … } }
44
Polygon Data Type: Java Implementation
public class Polygon { private final int N; // number of boundary points private final double[] x, y; // the points (x[i], y[i]) // read from input stream public Polygon(In in) { N = in.readInt(); x = new double[N]; y = new double[N]; for (int i = 0; i < N; i++) { x[i] = in.readDouble(); y[i] = in.readDouble(); } } public void fill() { StdDraw.filledPolygon(x, y); } }
12
45
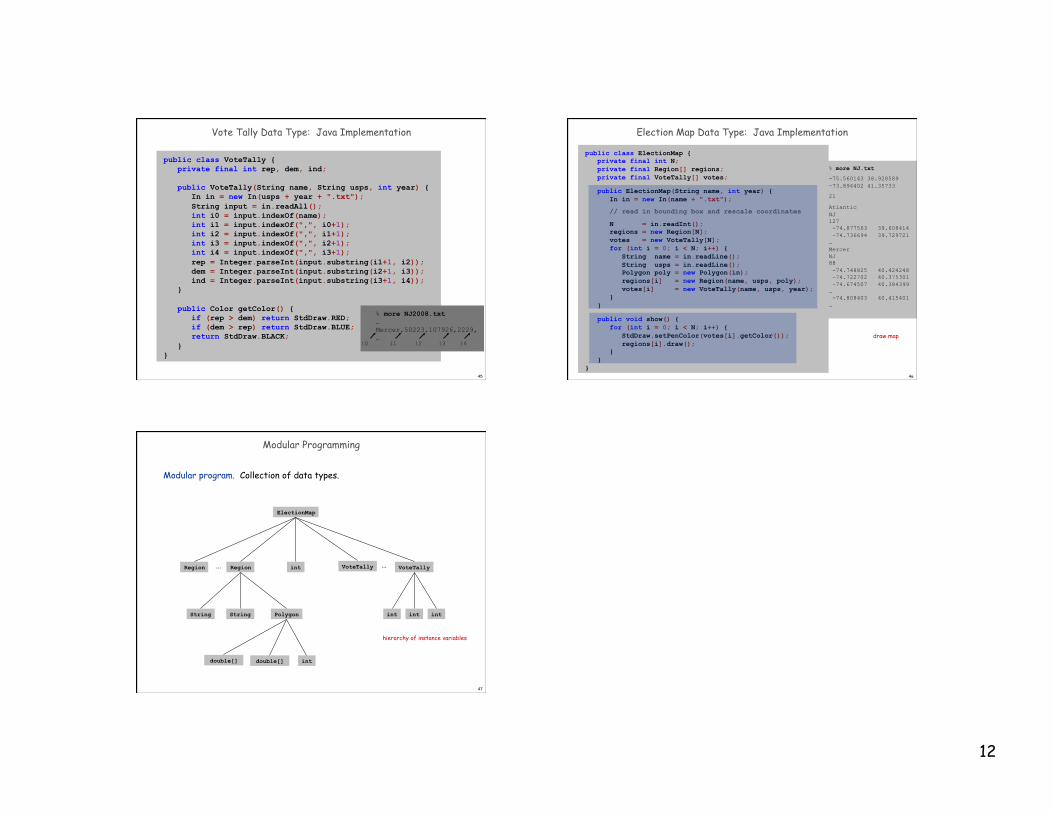
Vote Tally Data Type: Java Implementation
public class VoteTally { private final int rep, dem, ind; public VoteTally(String name, String usps, int year) { In in = new In(usps + year + ".txt"); String input = in.readAll(); int i0 = input.indexOf(name); int i1 = input.indexOf(",", i0+1); int i2 = input.indexOf(",", i1+1); int i3 = input.indexOf(",", i2+1); int i4 = input.indexOf(",", i3+1); rep = Integer.parseInt(input.substring(i1+1, i2)); dem = Integer.parseInt(input.substring(i2+1, i3)); ind = Integer.parseInt(input.substring(i3+1, i4)); } public Color getColor() { if (rep > dem) return StdDraw.RED; if (dem > rep) return StdDraw.BLUE; return StdDraw.BLACK; } }
% more NJ2008.txt … Mercer,50223,107926,2229, … i1 i2 i3 i4 i0
46
Election Map Data Type: Java Implementation
public class ElectionMap { private final int N; private final Region[] regions; private final VoteTally[] votes; public ElectionMap(String name, int year) { In in = new In(name + ".txt"); // read in bounding box and rescale coordinates N = in.readInt(); regions = new Region[N]; votes = new VoteTally[N]; for (int i = 0; i < N; i++) { String name = in.readLine(); String usps = in.readLine(); Polygon poly = new Polygon(in); regions[i] = new Region(name, usps, poly); votes[i] = new VoteTally(name, usps, year); } } public void show() { for (int i = 0; i < N; i++) { StdDraw.setPenColor(votes[i].getColor()); regions[i].draw(); } } }
draw map
use polygon, region, and vote tally data types to build map
% more NJ.txt -75.560143 38.928589 -73.894402 41.35733 21 Atlantic NJ 127 -74.877563 39.608414 -74.736694 39.729721 … Mercer NJ 88 -74.748825 40.424248 -74.722702 40.375301 -74.674507 40.384399 … -74.808403 40.415401 …
47
Modular Programming
Modular program. Collection of data types.
ElectionMap
Region int Region
Polygon String String
VoteTally
int int int
… VoteTally …
int double[]
hierarchy of instance variables
double[]