Embed Size (px)
Citation preview
Data that Walk and Talk
Presented by:
JSI/Boston Brown Bag
22 February 2008
Introduction on concepts and use of immunization data
3
Key Concepts
• Data should be useful to YOU
• Avoid collecting data that you will not use
• In most cases, unorganized data do not provide sufficient information for decision- making
• Collected and well-organized data provide a «snapshot » and/or message that can be used to make decisions
4
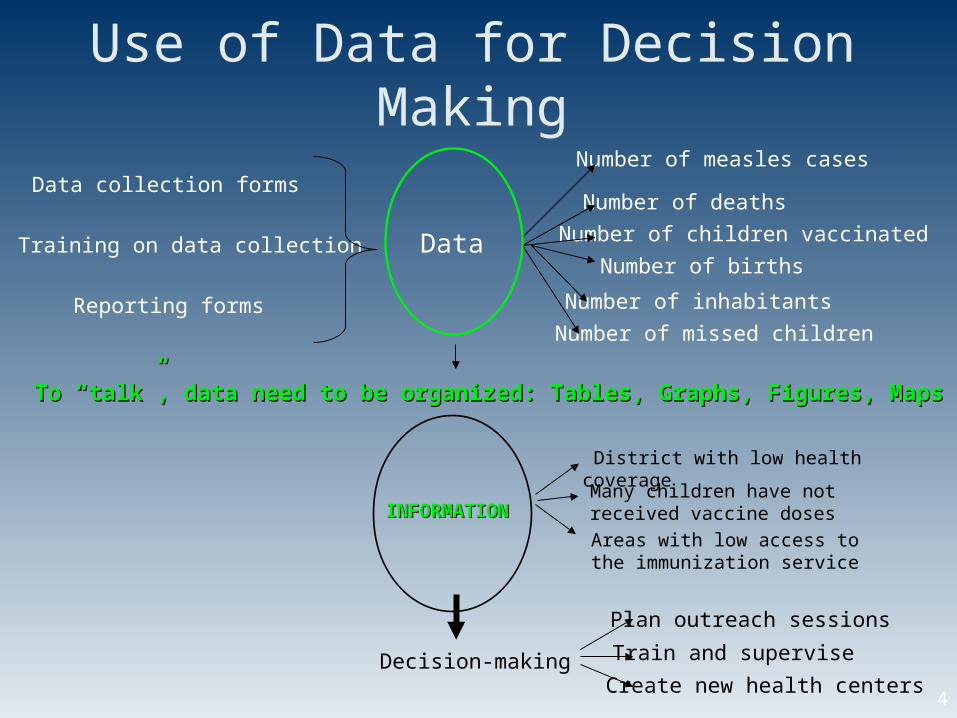
Use of Data for Decision Making
INFORMATIONINFORMATION
To “talk”, data need to be organized: Tables, Graphs, Figures, MapsTo “talk”, data need to be organized: Tables, Graphs, Figures, Maps
Data
Data collection forms
Training on data collection
Reporting forms
Number of measles cases
Number of deaths
Number of births
Number of inhabitants
Number of missed children
Number of children vaccinated
District with low health coverage
Areas with low access to the immunization service
Decision-making
Many children have not received vaccine doses
Plan outreach sessions
Train and supervise
Create new health centers
5
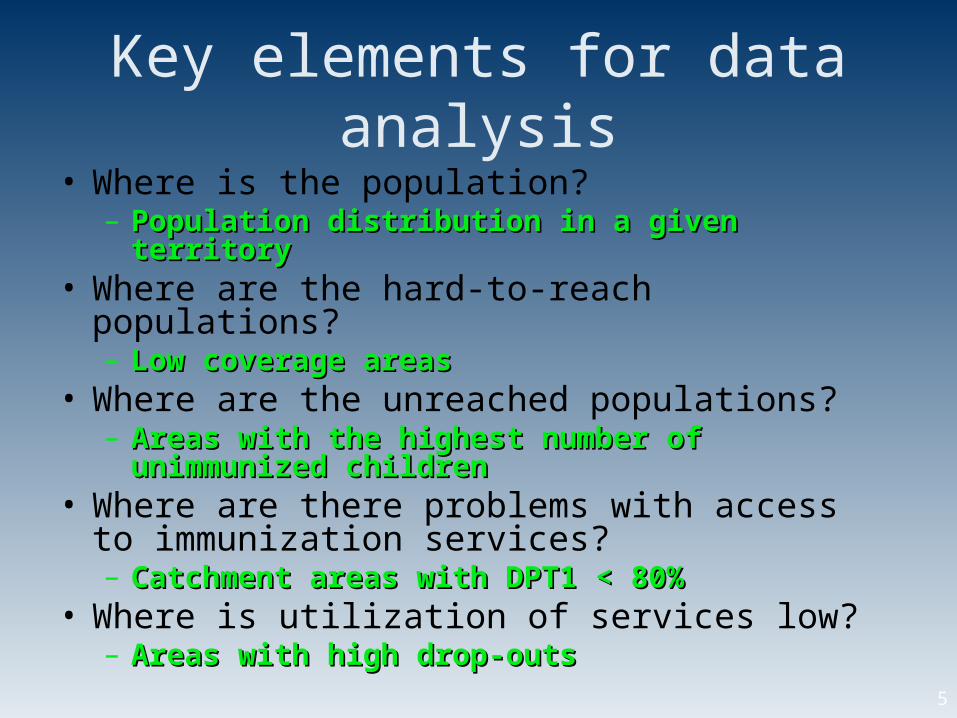
Key elements for data analysis
• Where is the population? – Population distribution in a given territoryPopulation distribution in a given territory
• Where are the hard-to-reach populations? – Low coverage areasLow coverage areas
• Where are the unreached populations? – Areas with the highest number of unimmunized Areas with the highest number of unimmunized
childrenchildren• Where are there problems with access to
immunization services? – Catchment areas with DPT1 < 80%Catchment areas with DPT1 < 80%
• Where is utilization of services low? – Areas with high drop-outsAreas with high drop-outs
6
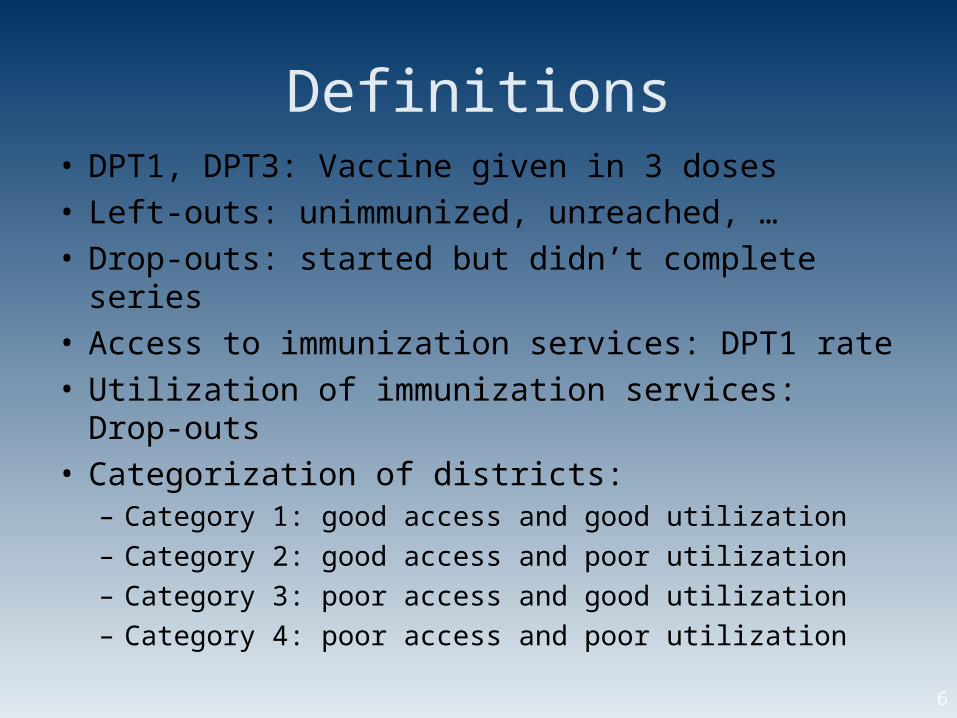
Definitions• DPT1, DPT3: Vaccine given in 3 doses• Left-outs: unimmunized, unreached, …• Drop-outs: started but didn’t complete series• Access to immunization services: DPT1 rate• Utilization of immunization services: Drop-outs• Categorization of districts:
– Category 1: good access and good utilization– Category 2: good access and poor utilization– Category 3: poor access and good utilization– Category 4: poor access and poor utilization
7
DR Congo’s experience on data use and decision-making
8
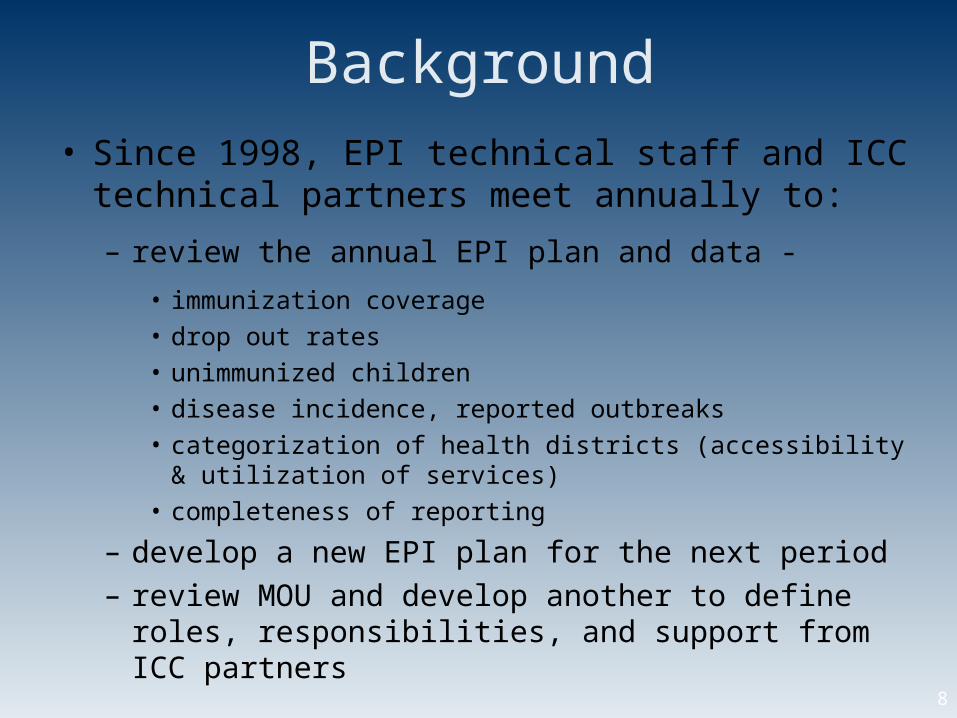
Background
• Since 1998, EPI technical staff and ICC technical partners meet annually to:
– review the annual EPI plan and data -
• immunization coverage• drop out rates • unimmunized children • disease incidence, reported outbreaks • categorization of health districts (accessibility & utilization of
services)• completeness of reporting
– develop a new EPI plan for the next period– review MOU and develop another to define roles,
responsibilities, and support from ICC partners
9
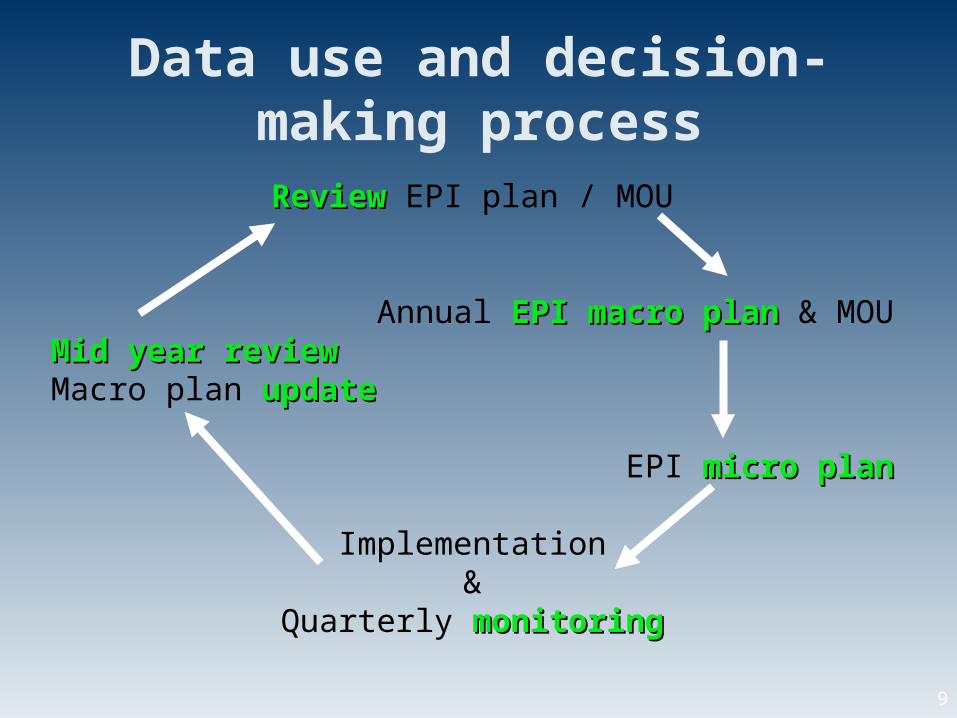
Data use and decision-making process
ReviewReview EPI plan / MOU
Annual EPI macro planEPI macro plan & MOUMid year reviewMid year reviewMacro plan updateupdate
EPI micro planmicro plan
Implementation&
Quarterly monitoringmonitoring
10
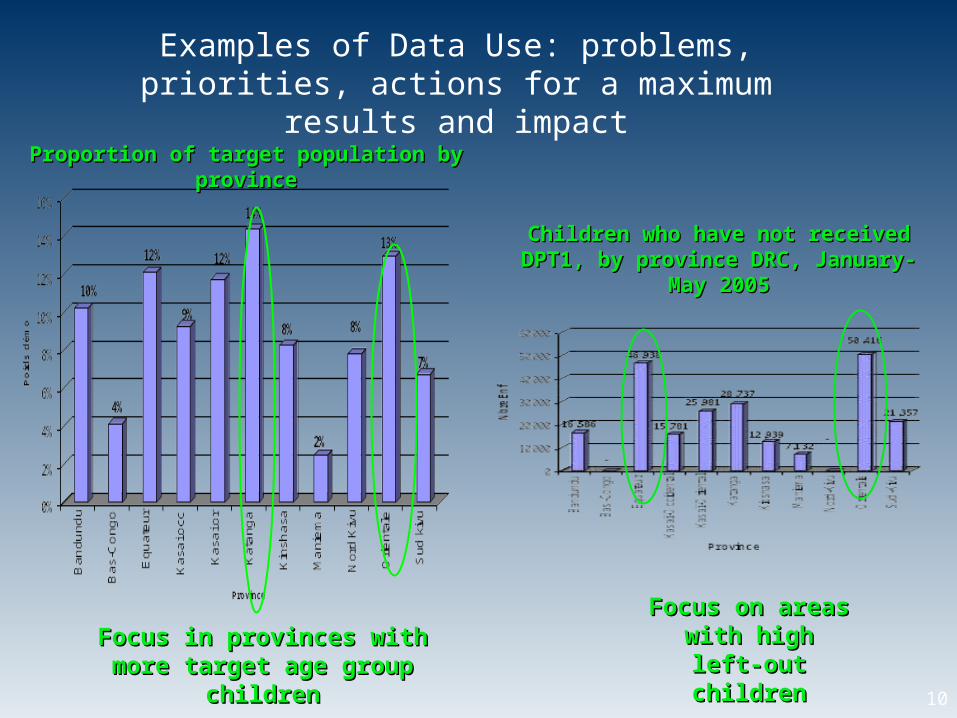
Examples of Data Use: problems, priorities, actions for a maximum results and impact
Focus in provinces with more Focus in provinces with more target age group childrentarget age group children
Focus on areas Focus on areas with high left-out with high left-out
childrenchildren
Children who have not received Children who have not received DPT1, by province DRC, January-DPT1, by province DRC, January-
May 2005May 2005
Proportion of target population by Proportion of target population by provinceprovince
11
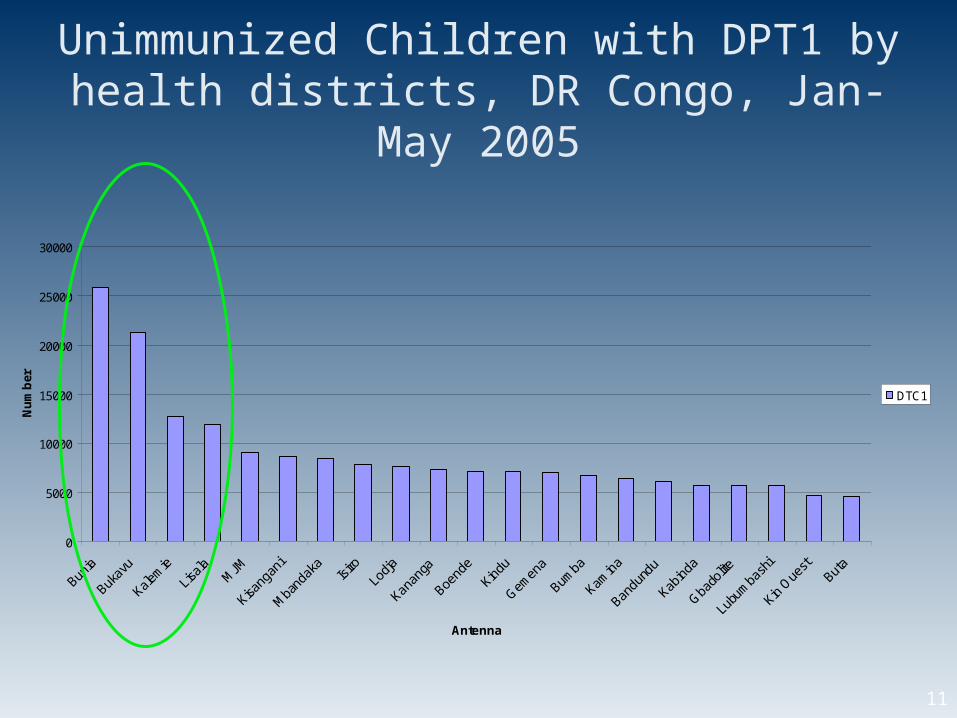
Unimmunized Children with DPT1 by health districts, DR Congo, Jan-May 2005
0
5000
10000
15000
20000
25000
30000
Bunia
Bukav
u
Kalem
ie
Lisala M
JM
Kisang
ani
Mba
ndak
aIsi
roLo
dja
Kanan
ga
Boend
e
Kindu
Gemen
a
Bumba
Kamin
a
Bandu
ndu
Kabind
a
Gbado
lite
Lubu
mba
shi
Kin O
uest
Buta
Antenna
Nu
mb
er
DTC1
12
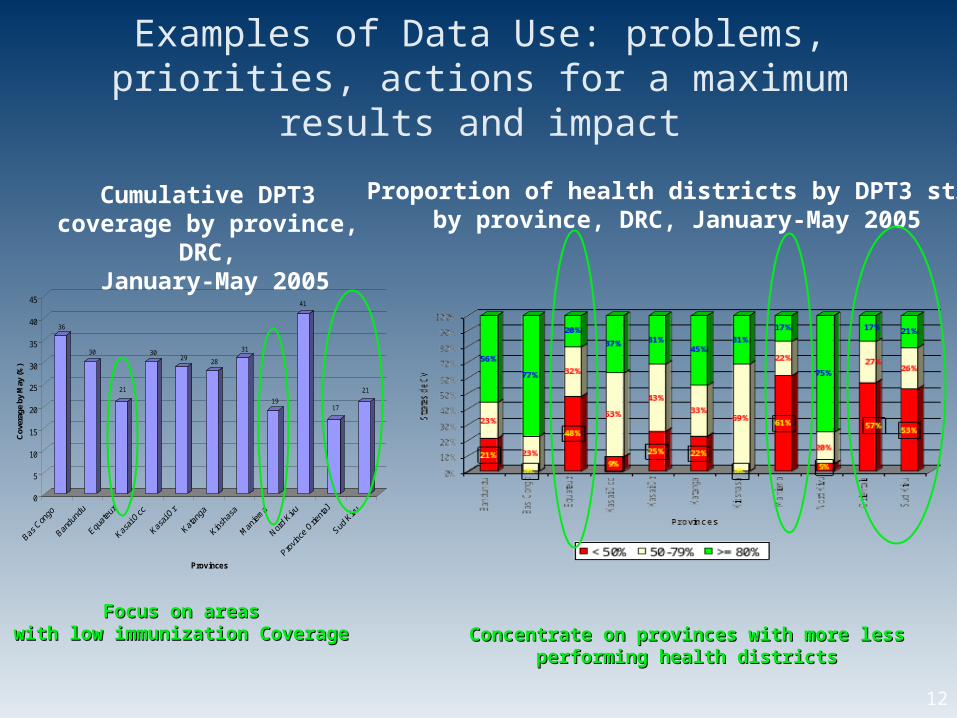
Concentrate on provinces with more less Concentrate on provinces with more less performing health districtsperforming health districts
Focus on areas Focus on areas with low immunization Coveragewith low immunization Coverage
Examples of Data Use: problems, priorities, actions for a maximum results and impact
36
30
21
3029
28
31
19
41
17
21
0
5
10
15
20
25
30
35
40
45
Cov
erag
e by
May
(%)
Provinces
Proportion of health districts by DPT3 strataby province, DRC, January-May 2005
Cumulative DPT3 coverage by province, DRC, January-May 2005
13
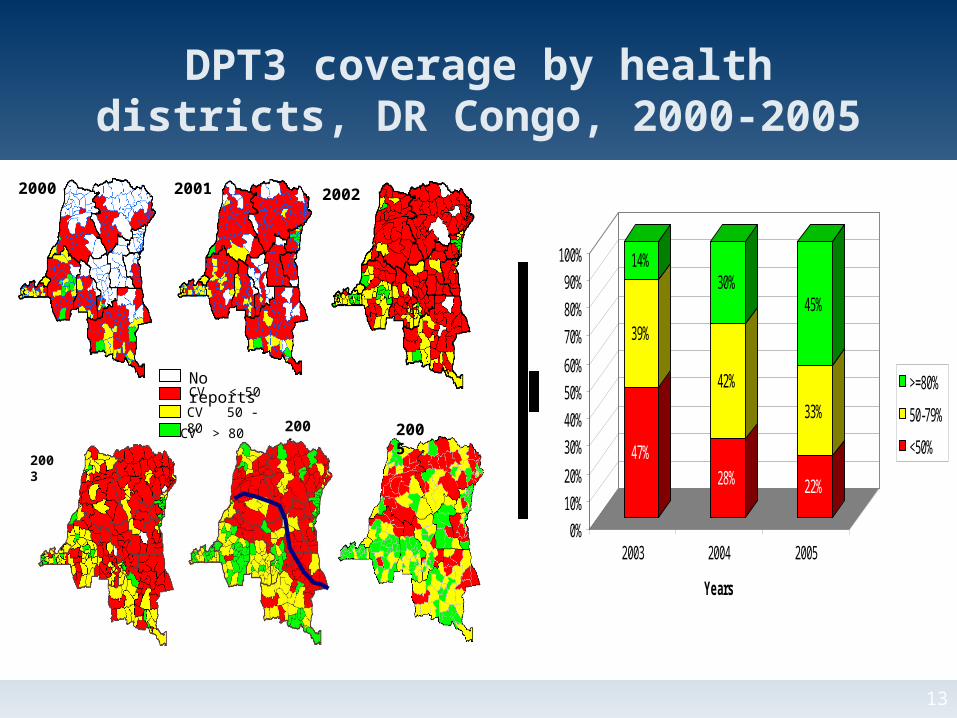
DPT3 coverage by health districts, DR Congo, 2000-2005
47%
39%
14%
28%
42%
30%
22%
33%
45%
0%
10%
20%
30%
40%
50%
60%
70%
80%
90%
100%
2003 2004 2005
Years
>=80%
50-79%
<50%
2000 2001 2002
No reportsCV < 50
CV 50 - 80
CV > 80
2003
2004 2005
14
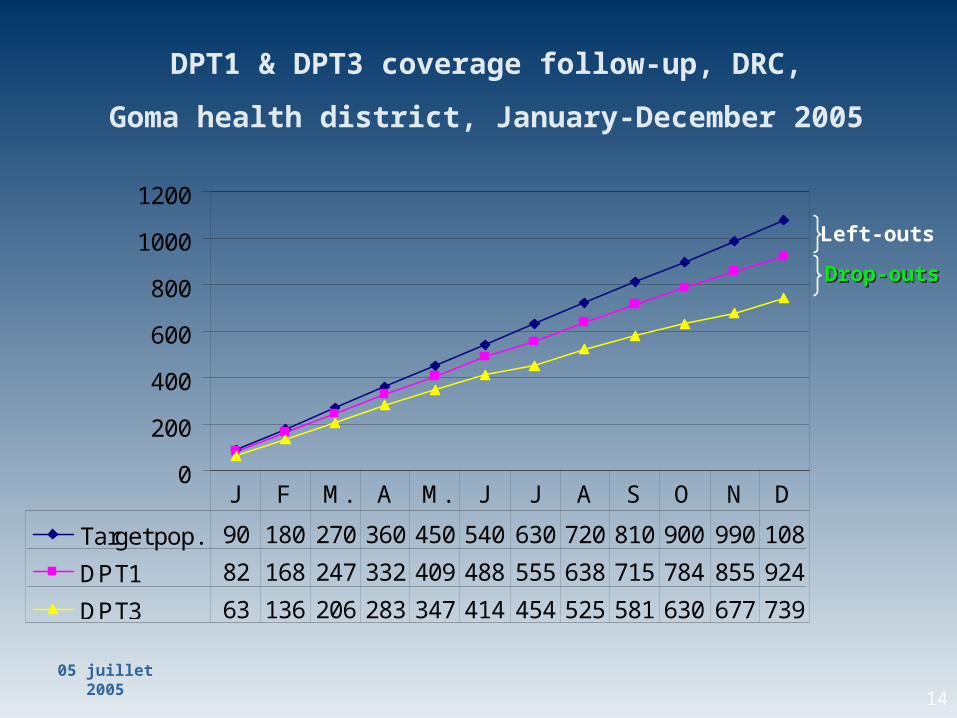
DPT1 & DPT3 coverage follow-up, DRC,
Goma health district, January-December 2005
05 juillet 2005
0
200
400
600
800
1000
1200
Target pop. 90 180 270 360 450 540 630 720 810 900 990 108
DPT1 82 168 247 332 409 488 555 638 715 784 855 924
DPT3 63 136 206 283 347 414 454 525 581 630 677 739
J F M. A M. J J A S O N D
Left-outs
Drop-outsDrop-outs
15
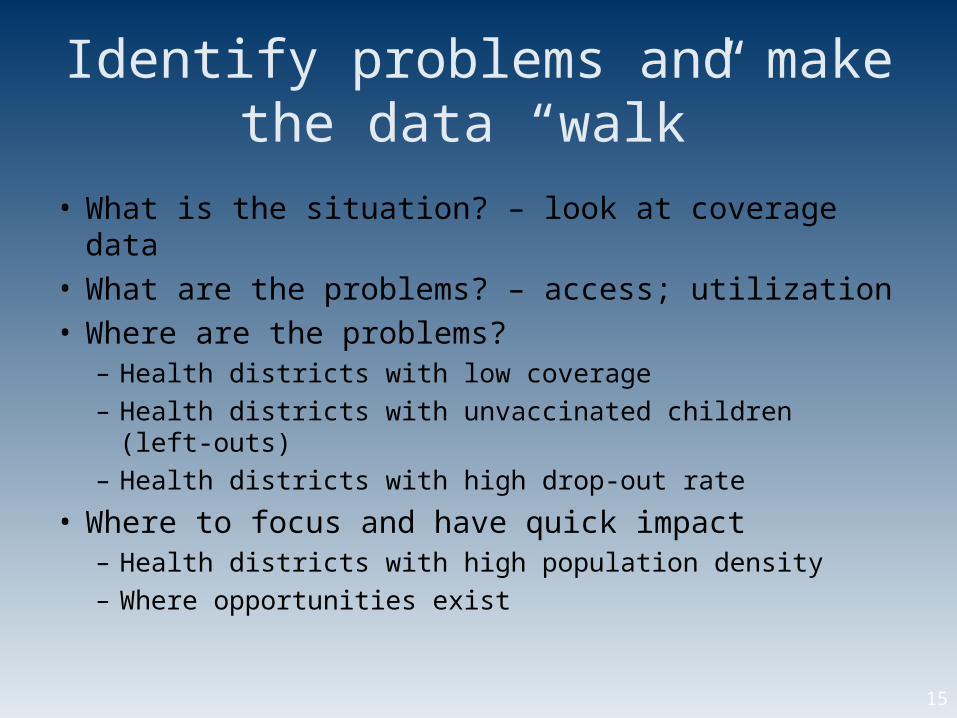
Identify problems and make the data “walk”
• What is the situation? – look at coverage data• What are the problems? – access; utilization• Where are the problems?
– Health districts with low coverage– Health districts with unvaccinated children (left-outs)– Health districts with high drop-out rate
• Where to focus and have quick impact– Health districts with high population density– Where opportunities exist
Use of data in program support – India example
17
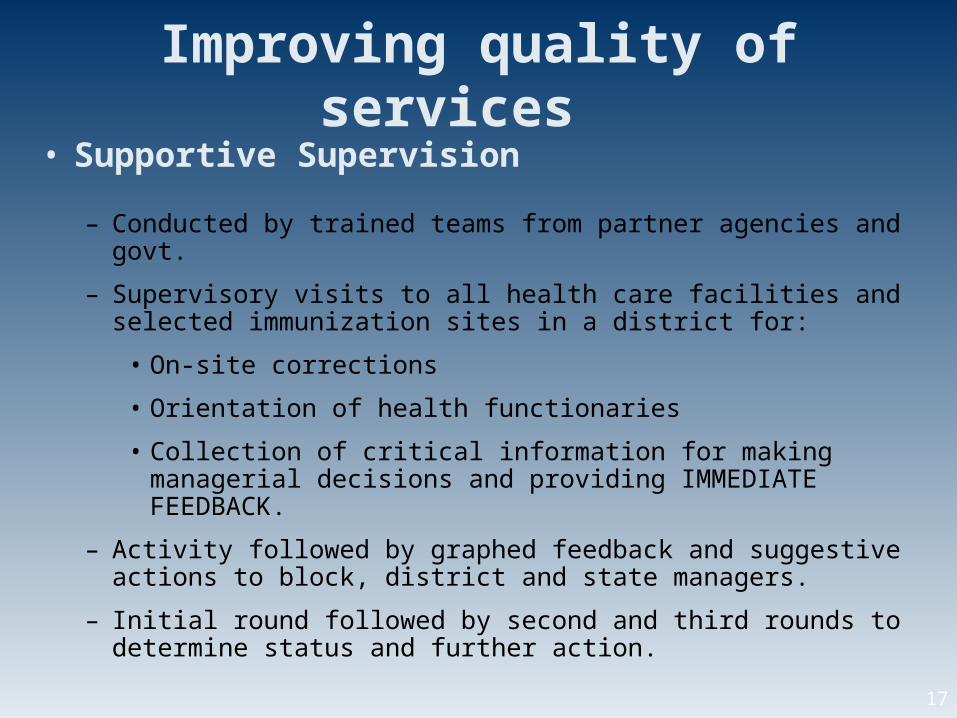
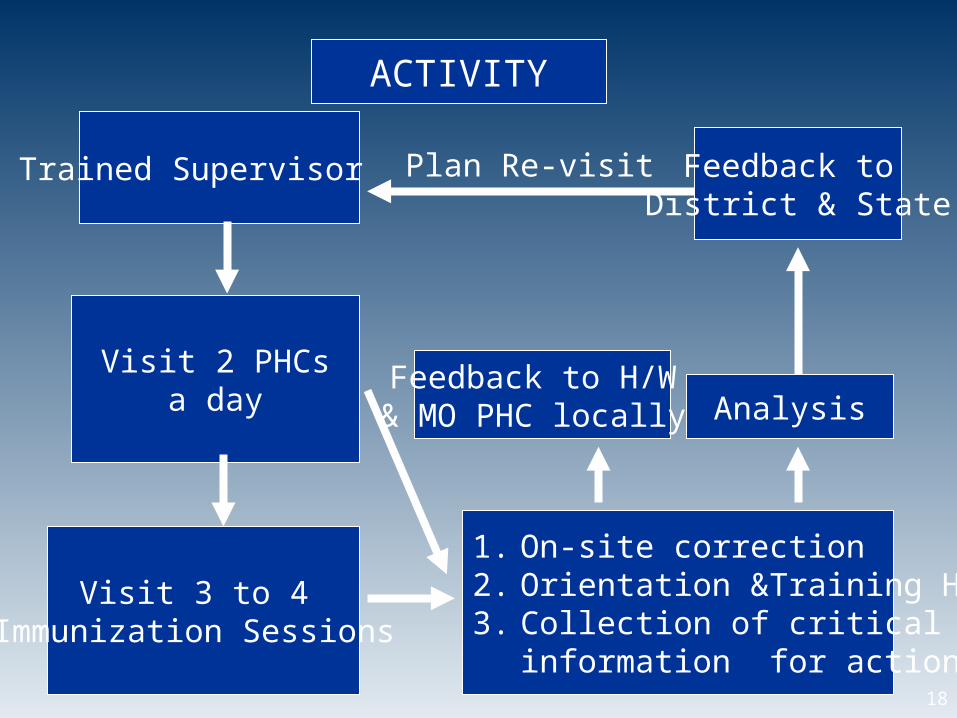
Improving quality of services • Supportive Supervision
– Conducted by trained teams from partner agencies and govt.
– Supervisory visits to all health care facilities and selected immunization sites in a district for:
• On-site corrections
• Orientation of health functionaries
• Collection of critical information for making managerial decisions and providing IMMEDIATE FEEDBACK.
– Activity followed by graphed feedback and suggestive actions to block, district and state managers.
– Initial round followed by second and third rounds to determine status and further action.
18
Trained Supervisor
Visit 2 PHCs a day
Visit 3 to 4 Immunization Sessions
1. On-site correction2. Orientation &Training H/W3. Collection of critical
information for action
Feedback to H/W & MO PHC locally Analysis
Feedback to District & State
Plan Re-visit
ACTIVITY
19
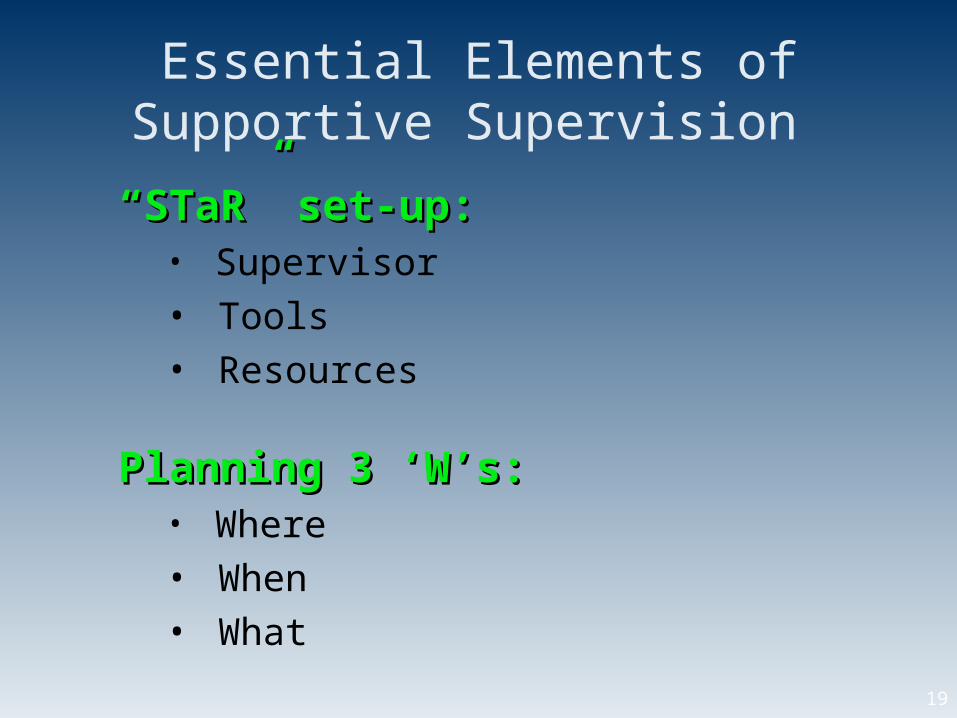
Essential Elements of Supportive Supervision
““STaR” set-up:STaR” set-up:• Supervisor• Tools • Resources
Planning 3 ‘W’s:Planning 3 ‘W’s: • Where• When • What
20
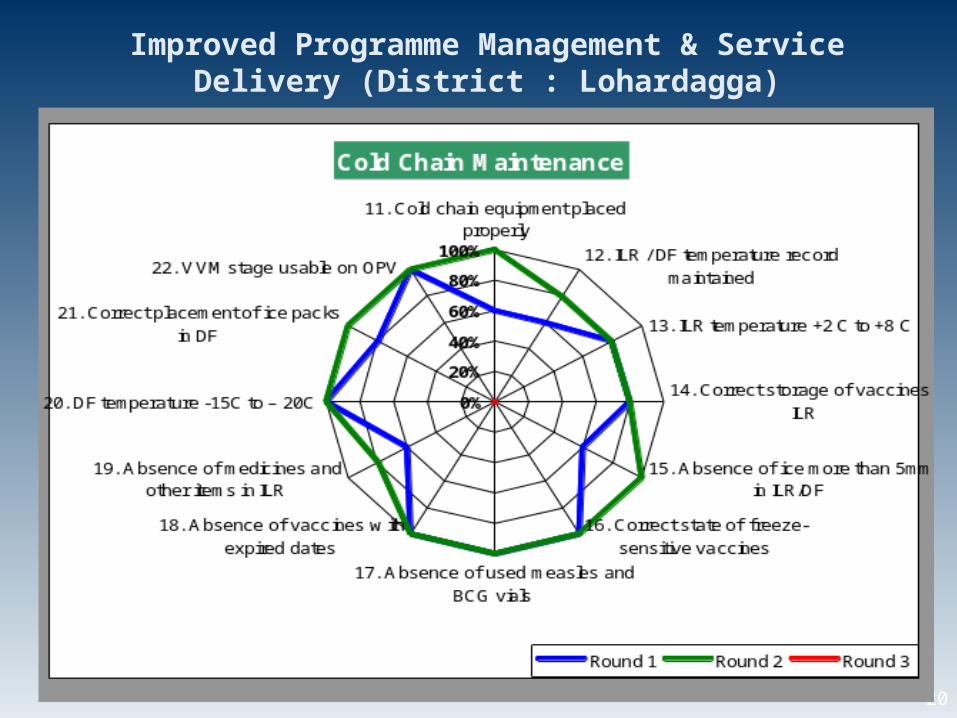
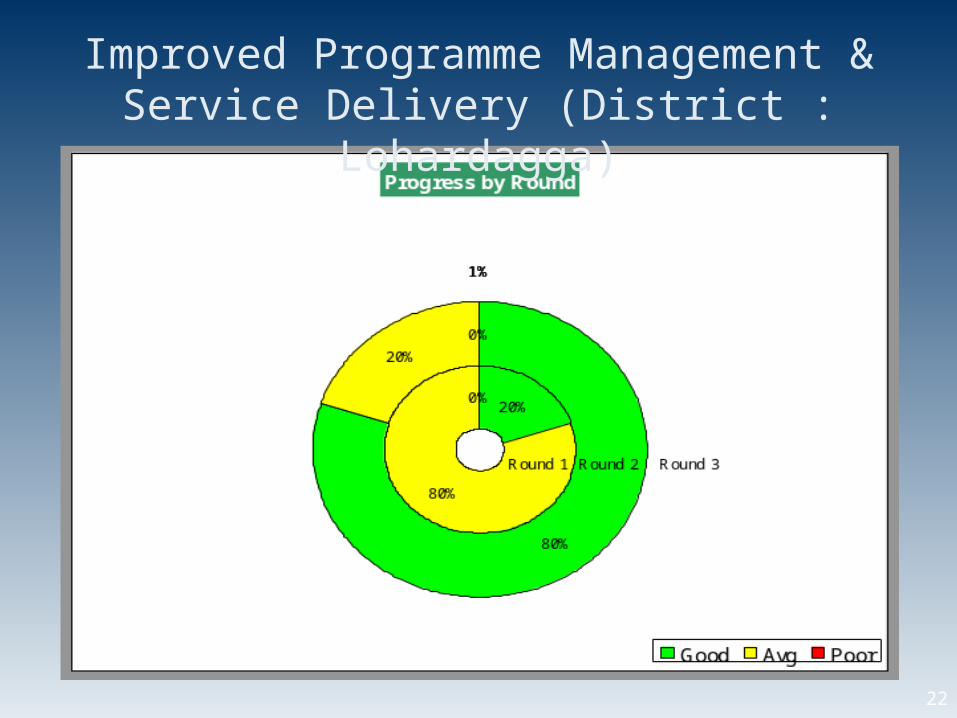
Improved Programme Management & Service Delivery (District : Lohardagga)
21
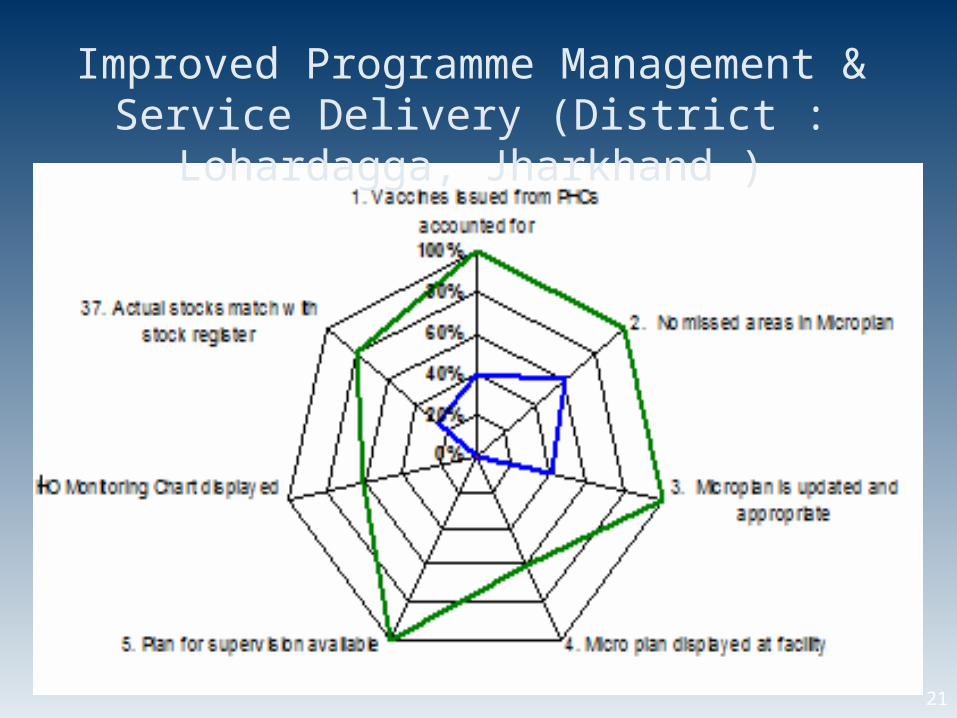
Improved Programme Management & Service Delivery (District : Lohardagga, Jharkhand )
22
Improved Programme Management & Service Delivery (District : Lohardagga)
23
Supportive Supervision – Impact
• Completed in selected districts of 3 States by IMMUNIZATIONbasics (IB) India team and partners.
• Improvement seen in subsequent visits, which were shared with MOH officials
• Further support through development of standardized supervisory checklists and tool for data entry with ready analysis & graphs.
• Results have motivated both National & State Govts. to include the activity as part of Programme Implementation Plans for the years 2007-2008.
24
COMBINING DATA: Supplemental & Routine DataExample: Diphtheria Pertussis Tetanus (DPT) vaccine
• DPT given at 6 weeks (DPT1), 10 wks (DPT2), 14 wks (DPT3) in a routine immunization schedule (children under 1 yr)
• DPT3 coverage may indicate continuity of use by parents, client satisfaction with services, and capability of the system to deliver a series of vaccinations
• DPT1-3 dropout may indicate perceived quality of service and quality of communication between parents and health workers — this is the classic drop-out indicator (DPT1 - DPT3 / DPT1 x 100)
NIGERIA case study
25
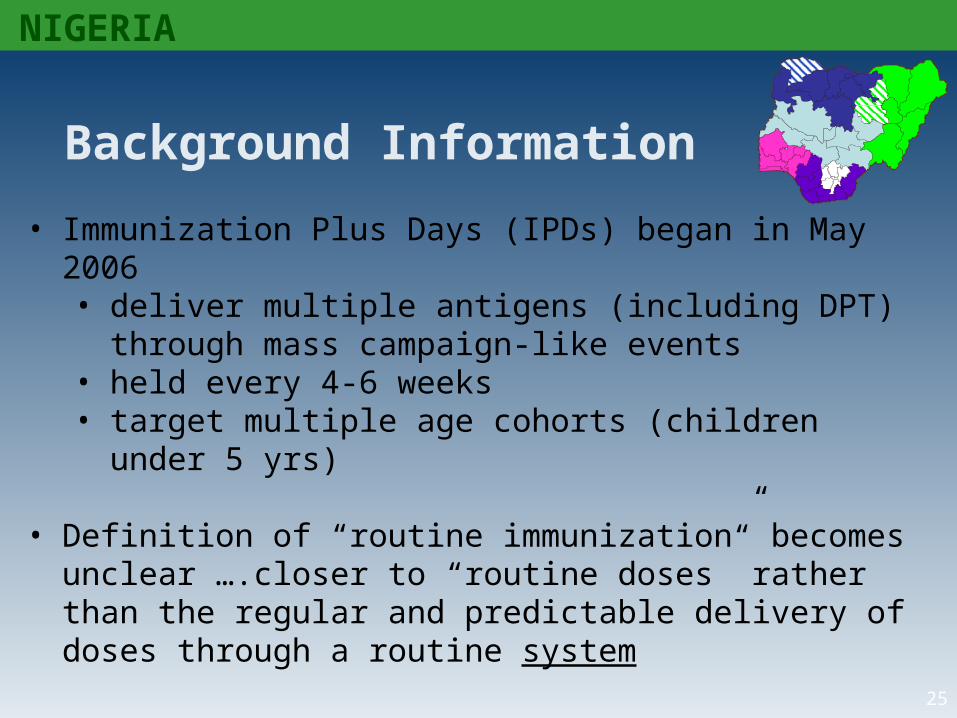
Background Information
NIGERIA
• Immunization Plus Days (IPDs) began in May 2006• deliver multiple antigens (including DPT) through mass
campaign-like events• held every 4-6 weeks• target multiple age cohorts (children under 5 yrs)
• Definition of “routine immunization” becomes unclear ….closer to “routine doses” rather than the regular and predictable delivery of doses through a routine system
• IPD (supplemental immunization activity or SIA) and RI (routine immunization) data are combined or aggregated in records and reports
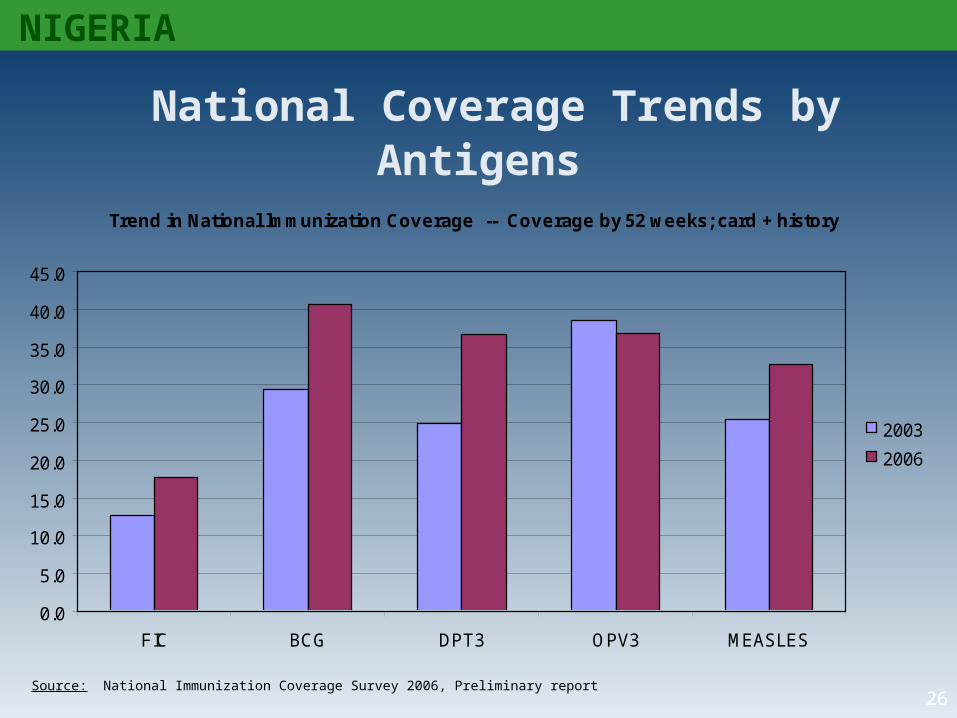
26Source: National Immunization Coverage Survey 2006, Preliminary report
National Coverage Trends by Antigens
NIGERIA
Trend in National lmmunization Coverage -- Coverage by 52 weeks; card + history
0.0
5.0
10.0
15.0
20.0
25.0
30.0
35.0
40.0
45.0
FIC BCG DPT3 OPV3 MEASLES
2003
2006
27
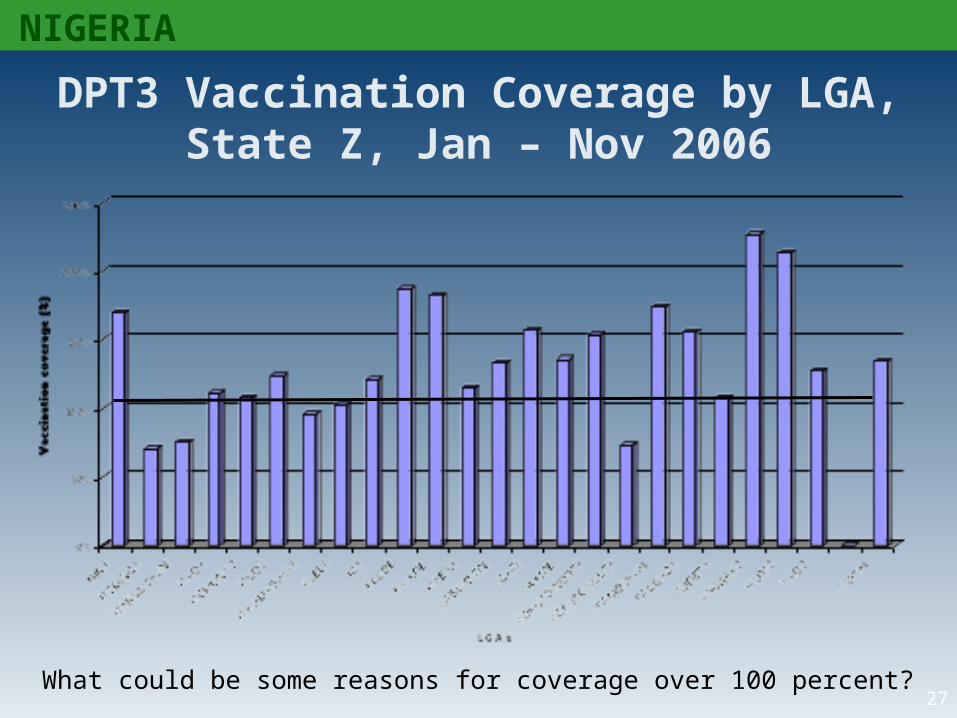
NIGERIA
DPT3 Vaccination Coverage by LGA, State Z, Jan – Nov 2006
What could be some reasons for coverage over 100 percent?
28
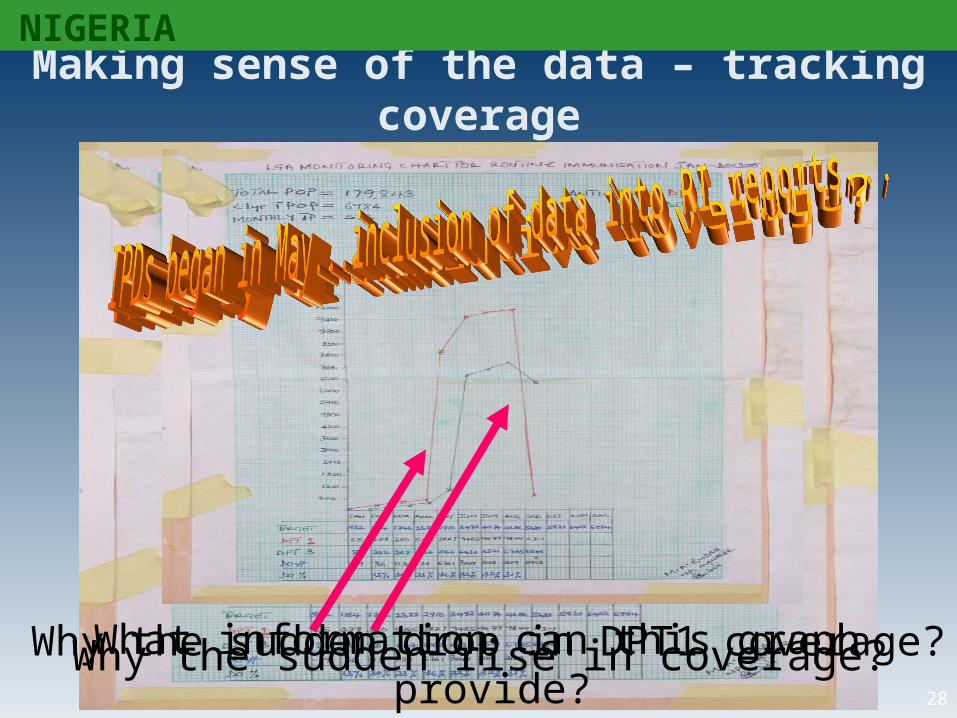
Making sense of the data – tracking coverage
Why the sudden rise in coverage?Why the sudden drop in DPT1 coverage?What information can this graph provide?
NIGERIA
29
-140%
-120%
-100%
-80%
-60%
-40%
-20%
0%
20%
40%
60%
LGAs
Dro
p-ou
t rat
es (%
)
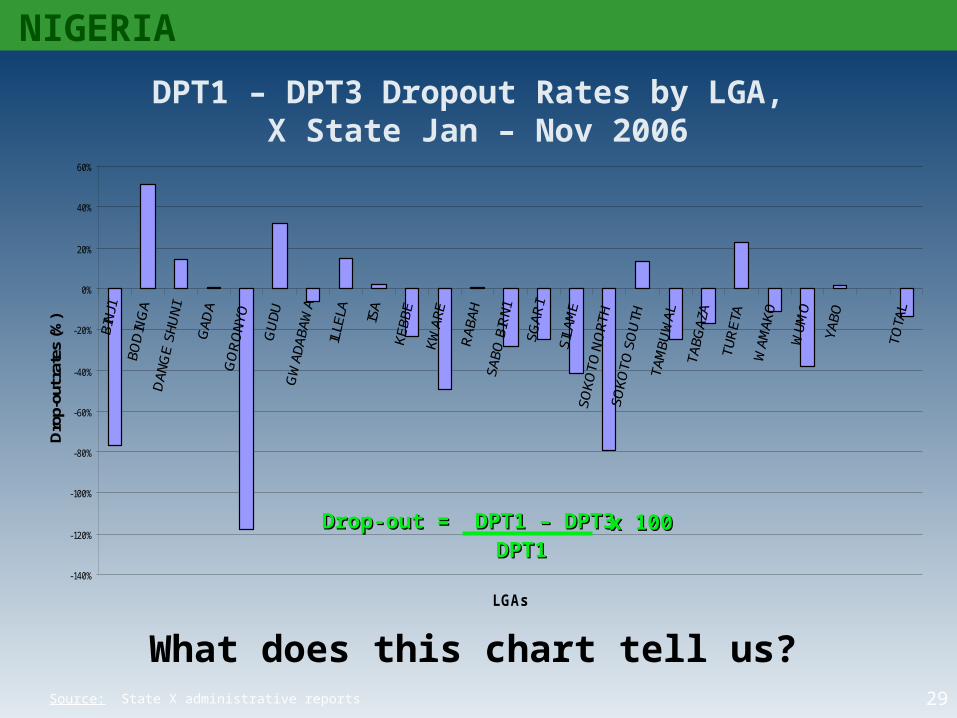
DPT1 – DPT3 Dropout Rates by LGA, X State Jan – Nov 2006
What does this chart tell us?Source: State X administrative reports
NIGERIA
Drop-out = DPT1 – DPT3Drop-out = DPT1 – DPT3 x 100x 100DPT1DPT1
30
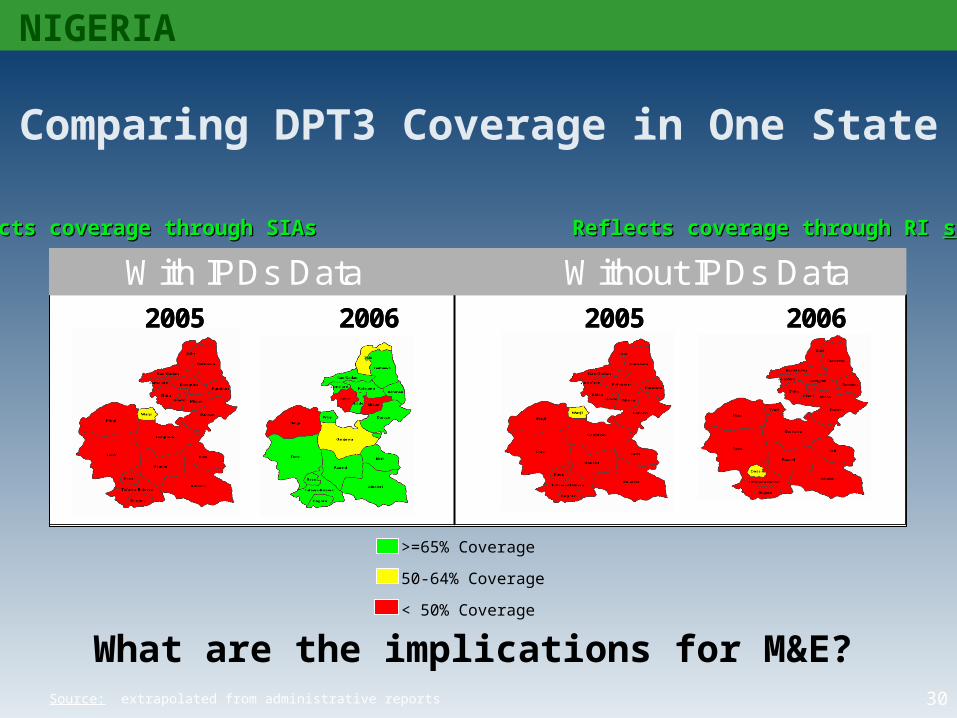
With IPDs Data Without IPDs Data2005 2006 2005 2006
With IPDs Data Without IPDs Data2005 2006 2005 2006
Comparing DPT3 Coverage in One State
>=65% Coverage
50-64% Coverage
< 50% Coverage
Reflects coverage through SIAs Reflects coverage through RI Reflects coverage through SIAs Reflects coverage through RI systemsystem
NIGERIA
Source: extrapolated from administrative reports
What are the implications for M&E?
31
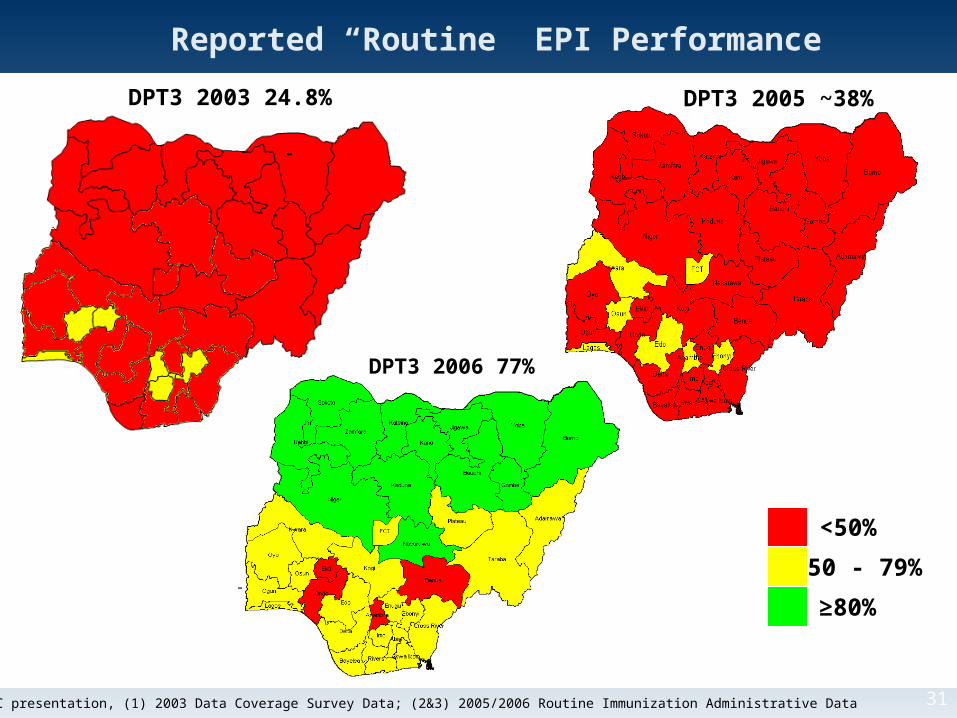
Reported “Routine” EPI Performance
DPT3 2003 24.8%
-
DPT3 2005 ~38%
- -
Source: ERC presentation, (1) 2003 Data Coverage Survey Data; (2&3) 2005/2006 Routine Immunization Administrative Data
<50%
50 - 79%
≥80%
DPT3 2006 77%
32
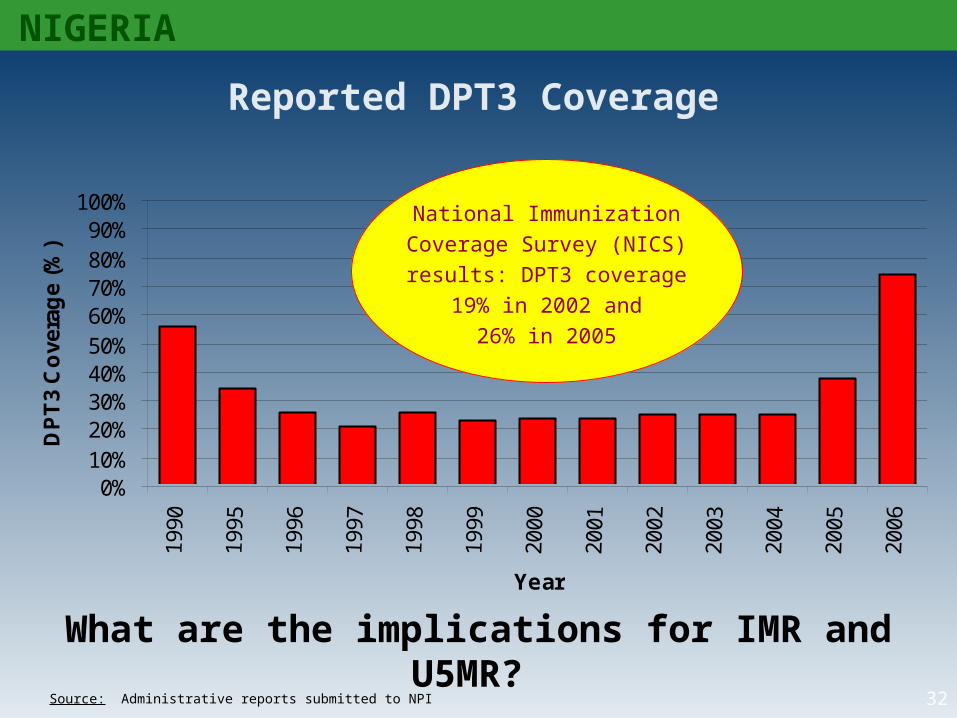
Reported DPT3 Coverage
0%10%20%30%40%50%60%70%80%90%
100%19
90
1995
1996
1997
1998
1999
2000
2001
2002
2003
2004
2005
2006
Year
DP
T3
Co
vera
ge
(%)
Source: Administrative reports submitted to NPI
National ImmunizationCoverage Survey (NICS)results: DPT3 coverage
19% in 2002 and 26% in 2005
NIGERIA
What are the implications for IMR and U5MR?
33
NIGERIA
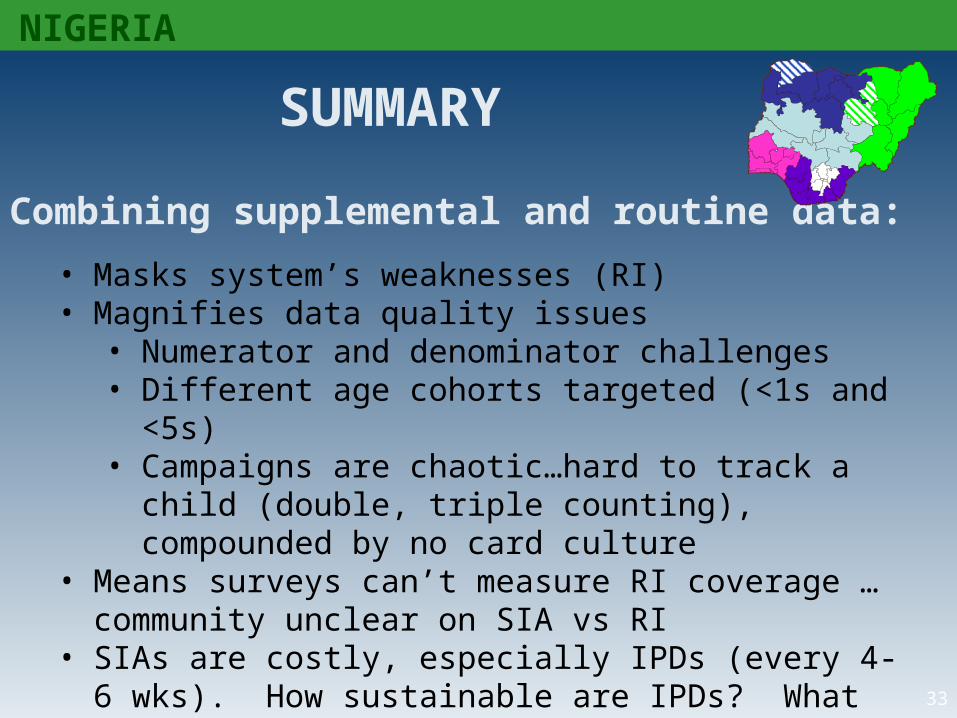
SUMMARY
Combining supplemental and routine data:
• Masks system’s weaknesses (RI)• Magnifies data quality issues
• Numerator and denominator challenges• Different age cohorts targeted (<1s and <5s)• Campaigns are chaotic…hard to track a child (double,
triple counting), compounded by no card culture• Means surveys can’t measure RI coverage …community
unclear on SIA vs RI• SIAs are costly, especially IPDs (every 4-6 wks). How
sustainable are IPDs? What happens when they stop?• Other M&E implications ???
Remember….
• Data should be useful to YOU
• Avoid collecting data that you will not use
• In most cases, unorganized data do not provide sufficient information for decision- making
• Collected and well-organized data provide a «snapshot » and/or message that can be used to make decisions
THANK YOU