Embed Size (px)
Citation preview
Data to Support Transportation Agency Business Needs: A Self-Assessment Guide May 26, 2016
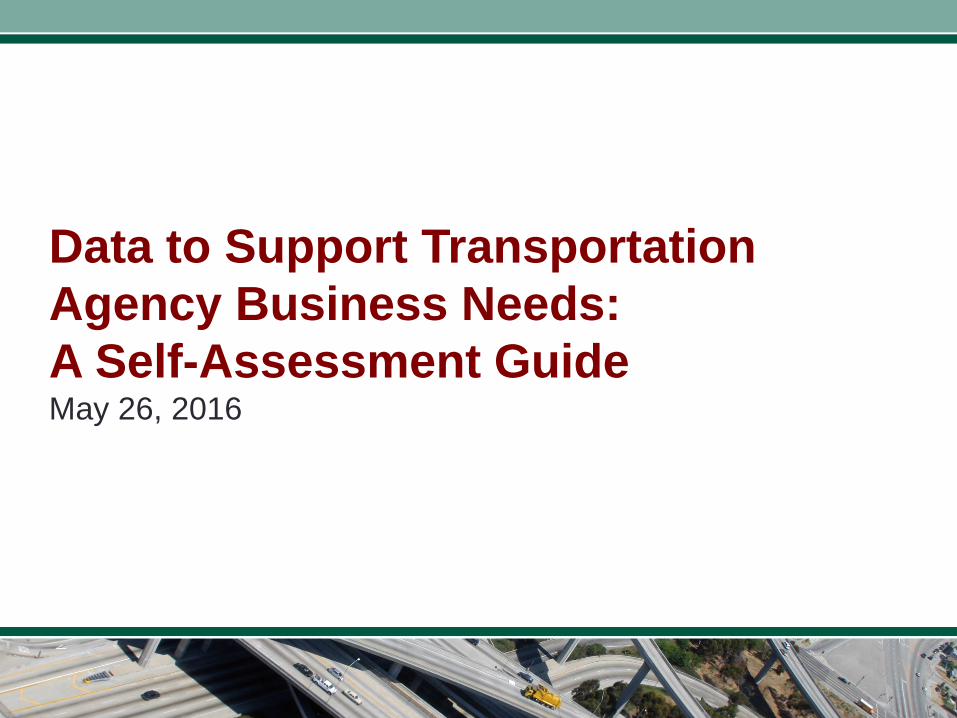
Today’s Presenters • Moderator
Johanna Zmud, Texas A&M Transportation Institute
• Implementing a Transportation Agency Data Program Self-Assessment Frances Harrison, Spy Pond Partners
• Test Application at Utah DOT Stan Burns, Integrated Inventory
• Tool Customization for Freight Data Application Birat Pandey, FHWA and Jeff Trombly, Leidos
• AASHTO Efforts to Further Pilot Tools Penelope Weinberger, AASHTO

NCHRP is...
A state-driven national program
• The state DOTs, through AASHTO’s Standing Committee on Research... – Are core sponsors of NCHRP
– Suggest research topics and select final projects
– Help select investigators and guide their work through oversight panels
NCHRP delivers...
Practical, ready-to-use results • Applied research aimed at state
DOT practitioners • Often become AASHTO
standards, specifications, guides, manuals
• Can be directly applied across the spectrum of highway concerns: planning, design, construction, operation, maintenance, safety
A range of approaches and products • Traditional NCHRP reports • Syntheses of highway practice • IDEA Program • Domestic Scan Program • Quick-Response Research for
AASHTO • Other products to foster
implementation: – Research Results Digests – Legal Research Digests – Web-Only Documents and CD-ROMs
NCHRP Webinar Series • Part of TRB’s larger webinar
program • Opportunity to interact with
investigators and apply research findings.

Today’s First Presenter
• Implementing a Transportation Agency Data Program Self-Assessment Frances Harrison, Spy Pond Partners
NCHRP 8-92: Implementing A Transportation Agency Data Program Self-Assessment
TRB Webinar: Data to Support Transportation Agency Business Needs: A Self-Assessment Guide
Frances D. Harrison, Spy Pond Partners, LLC
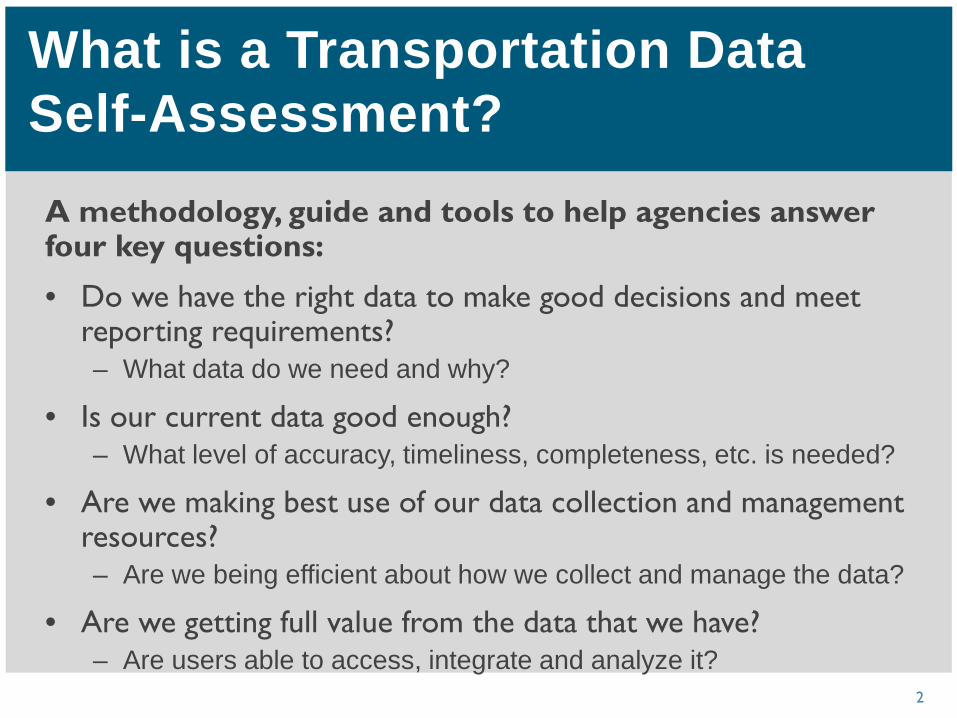
A methodology, guide and tools to help agencies answer four key questions:
• Do we have the right data to make good decisions and meet reporting requirements? – What data do we need and why?
• Is our current data good enough? – What level of accuracy, timeliness, completeness, etc. is needed?
• Are we making best use of our data collection and management resources? – Are we being efficient about how we collect and manage the data?
• Are we getting full value from the data that we have? – Are users able to access, integrate and analyze it?
What is a Transportation Data Self-Assessment?
2
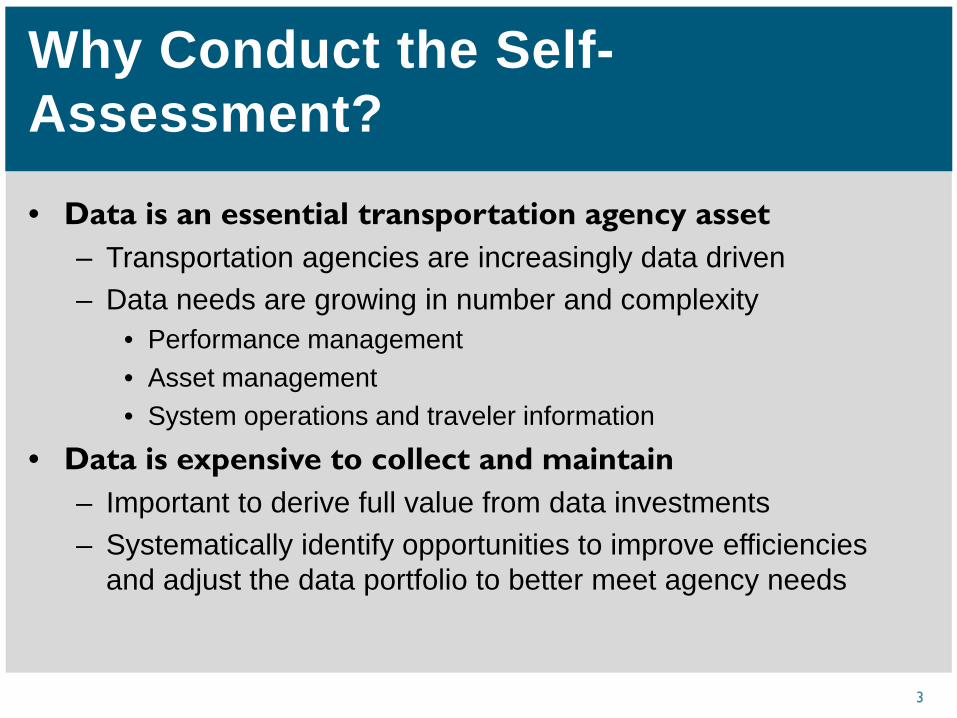
• Data is an essential transportation agency asset – Transportation agencies are increasingly data driven – Data needs are growing in number and complexity
• Performance management • Asset management • System operations and traveler information
• Data is expensive to collect and maintain – Important to derive full value from data investments – Systematically identify opportunities to improve efficiencies
and adjust the data portfolio to better meet agency needs
Why Conduct the Self-Assessment?
3

Data Principle
1. VALUABLE: Data is an asset 2. AVAILABLE: Data is open, accessible, transparent and shared
3. RELIABLE: Data quality and extent is fit for a variety of applications 4. AUTHORIZED: Data is secure and compliant with regulations 5. CLEAR: There is a common vocabulary and data definition 6. EFFICIENT: Data is not duplicated 7. ACCOUNTABLE: Decisions maximize the benefit of the data
Operationalizing AASHTO’s Data Principles
4
Transportation agencies adopting these principles – and putting them into action – should realize steady improvements to data value, and an increased return on their data investments.
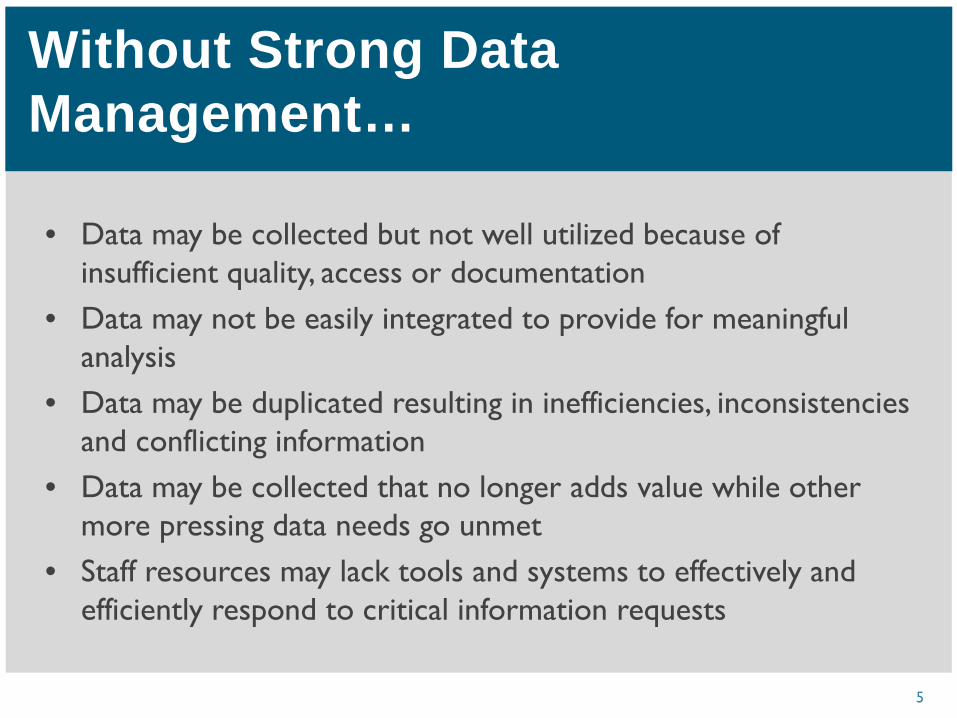
• Data may be collected but not well utilized because of insufficient quality, access or documentation
• Data may not be easily integrated to provide for meaningful analysis
• Data may be duplicated resulting in inefficiencies, inconsistencies and conflicting information
• Data may be collected that no longer adds value while other more pressing data needs go unmet
• Staff resources may lack tools and systems to effectively and efficiently respond to critical information requests
Without Strong Data Management…
5
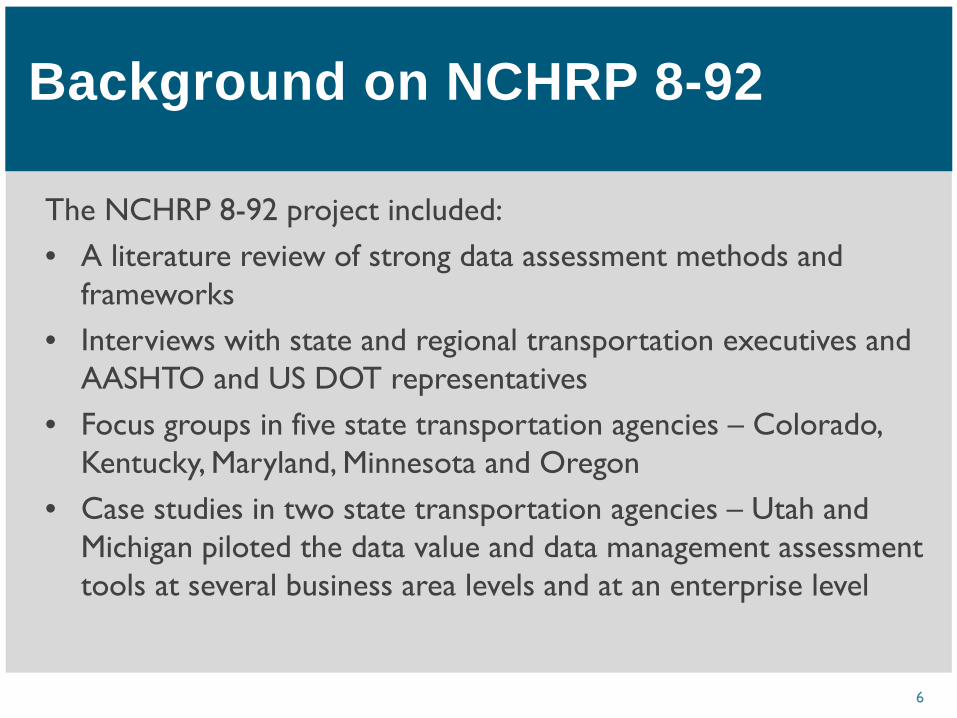
The NCHRP 8-92 project included: • A literature review of strong data assessment methods and
frameworks • Interviews with state and regional transportation executives and
AASHTO and US DOT representatives • Focus groups in five state transportation agencies – Colorado,
Kentucky, Maryland, Minnesota and Oregon • Case studies in two state transportation agencies – Utah and
Michigan piloted the data value and data management assessment tools at several business area levels and at an enterprise level
Background on NCHRP 8-92
6
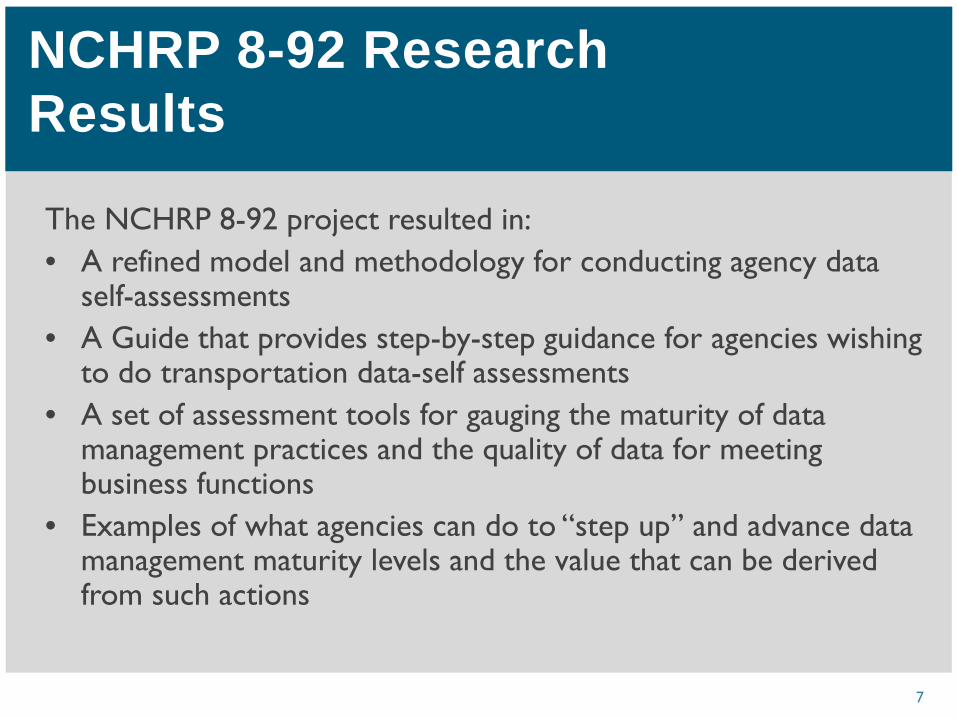
The NCHRP 8-92 project resulted in: • A refined model and methodology for conducting agency data
self-assessments • A Guide that provides step-by-step guidance for agencies wishing
to do transportation data-self assessments • A set of assessment tools for gauging the maturity of data
management practices and the quality of data for meeting business functions
• Examples of what agencies can do to “step up” and advance data management maturity levels and the value that can be derived from such actions
NCHRP 8-92 Research Results
7
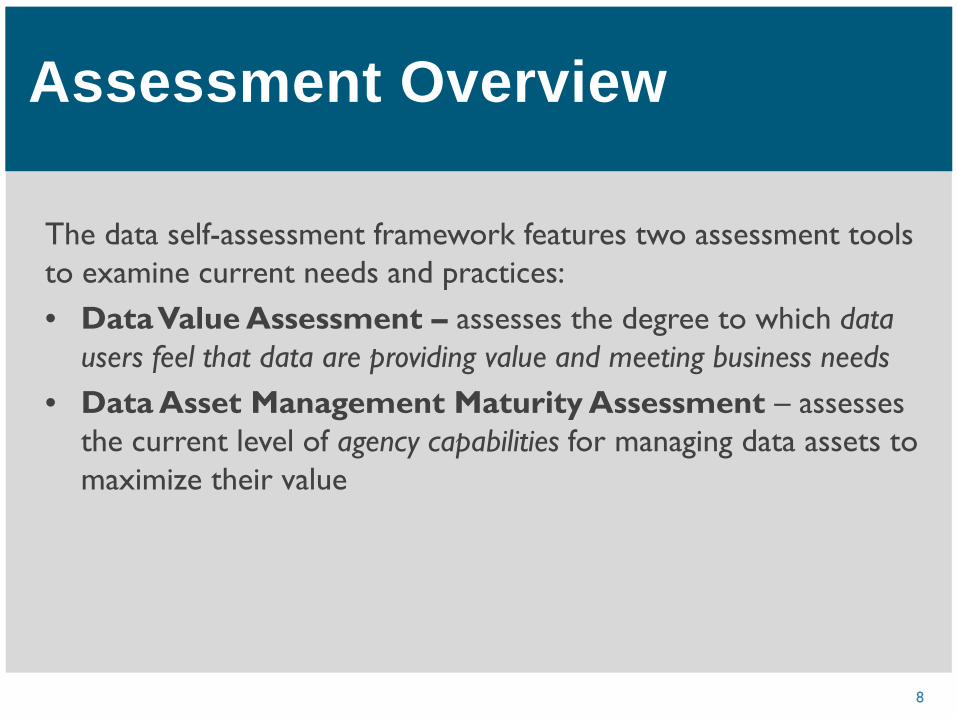
The data self-assessment framework features two assessment tools to examine current needs and practices: • Data Value Assessment – assesses the degree to which data
users feel that data are providing value and meeting business needs • Data Asset Management Maturity Assessment – assesses
the current level of agency capabilities for managing data assets to maximize their value
Assessment Overview
8

Assessment Process
9
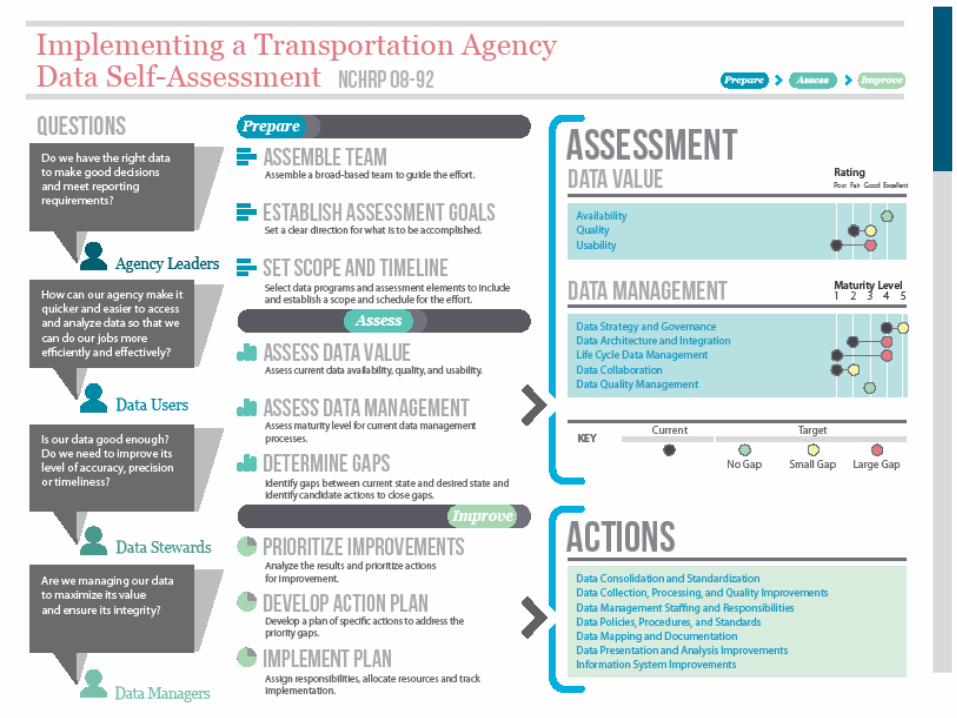
Prepare • Assemble Team • Establish Goals • Set Scope and Timeline
Assess • Data value • Business area assessments
• Data management • Agency wide assessment • Data-specific assessments
Improve and Monitor • Consolidate list of
initiatives and recommendations
• Prioritize improvements • Update action plan • Track progress
10
Data Value Elements
11
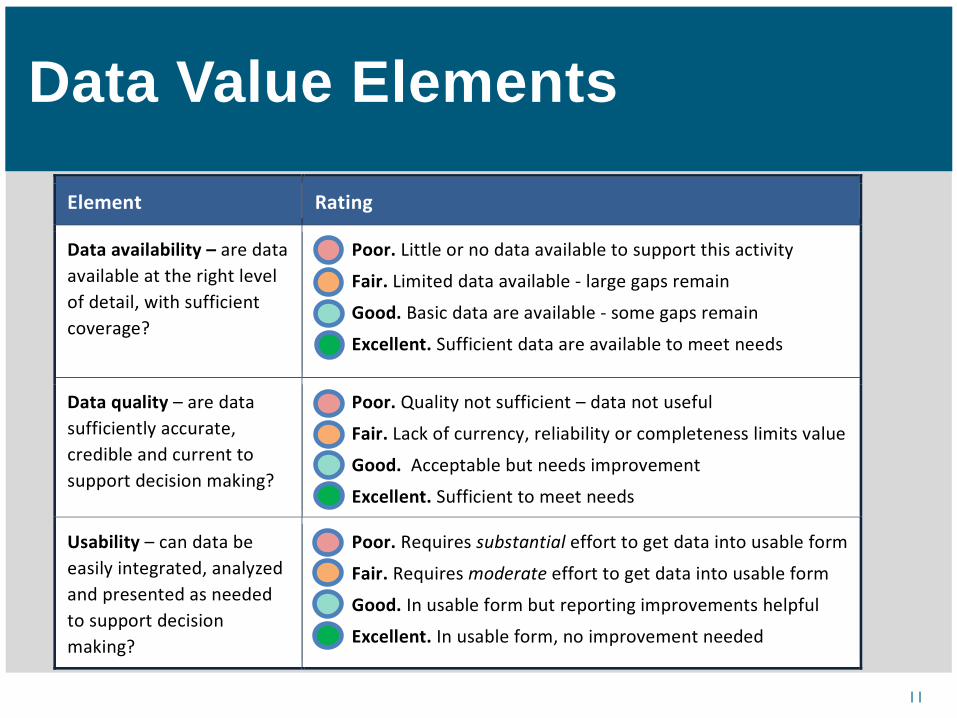
Element Rating
Data availability – are data available at the right level of detail, with sufficient coverage?
Poor. Little or no data available to support this activity
Fair. Limited data available - large gaps remain
Good. Basic data are available - some gaps remain
Excellent. Sufficient data are available to meet needs
Data quality – are data sufficiently accurate, credible and current to support decision making?
Poor. Quality not sufficient – data not useful
Fair. Lack of currency, reliability or completeness limits value
Good. Acceptable but needs improvement
Excellent. Sufficient to meet needs
Usability – can data be easily integrated, analyzed and presented as needed to support decision making?
Poor. Requires substantial effort to get data into usable form
Fair. Requires moderate effort to get data into usable form
Good. In usable form but reporting improvements helpful
Excellent. In usable form, no improvement needed
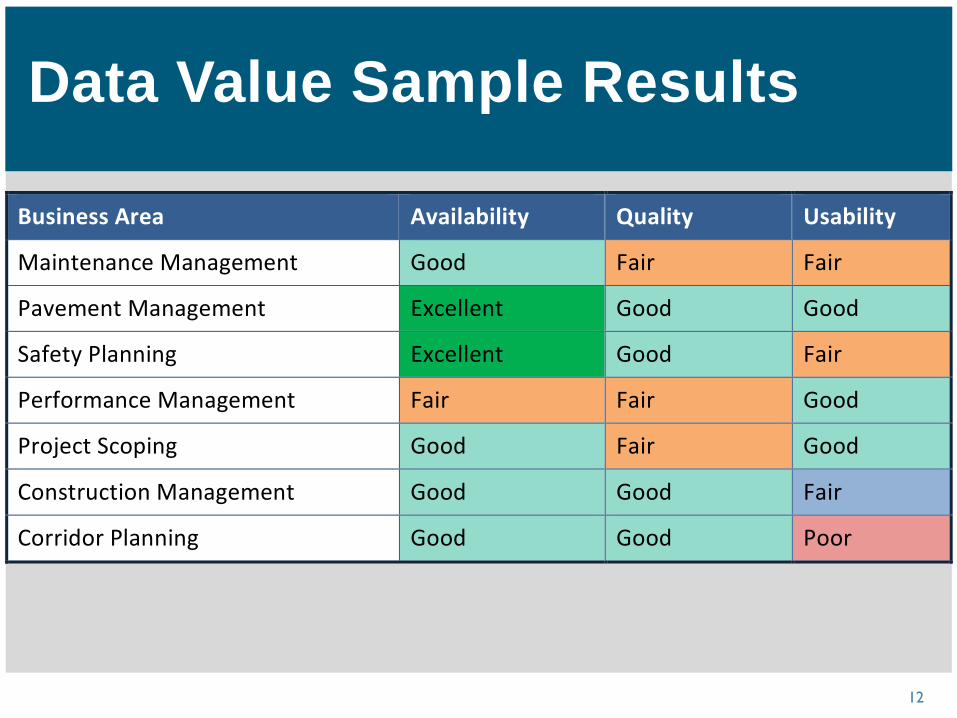
Data Value Sample Results
12
Business Area Availability Quality Usability
Maintenance Management Good Fair Fair
Pavement Management Excellent Good Good
Safety Planning Excellent Good Fair
Performance Management Fair Fair Good
Project Scoping Good Fair Good
Construction Management Good Good Fair
Corridor Planning Good Good Poor
13
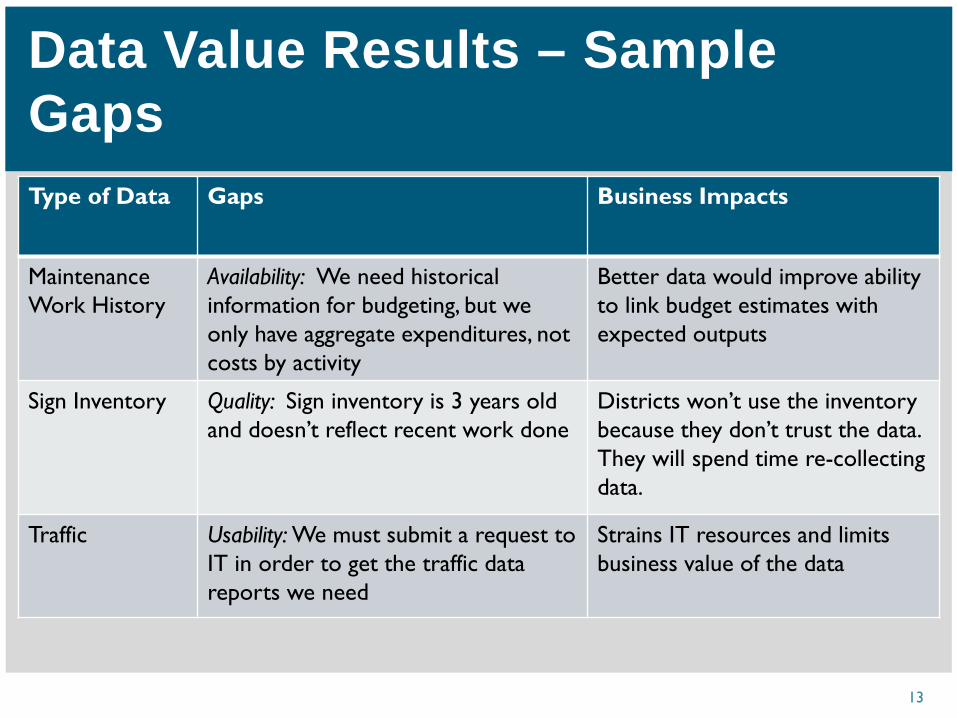
Type of Data Gaps Business Impacts
Maintenance Work History
Availability: We need historical information for budgeting, but we only have aggregate expenditures, not costs by activity
Better data would improve ability to link budget estimates with expected outputs
Sign Inventory Quality: Sign inventory is 3 years old and doesn’t reflect recent work done
Districts won’t use the inventory because they don’t trust the data. They will spend time re-collecting data.
Traffic Usability: We must submit a request to IT in order to get the traffic data reports we need
Strains IT resources and limits business value of the data
Data Value Results – Sample Gaps
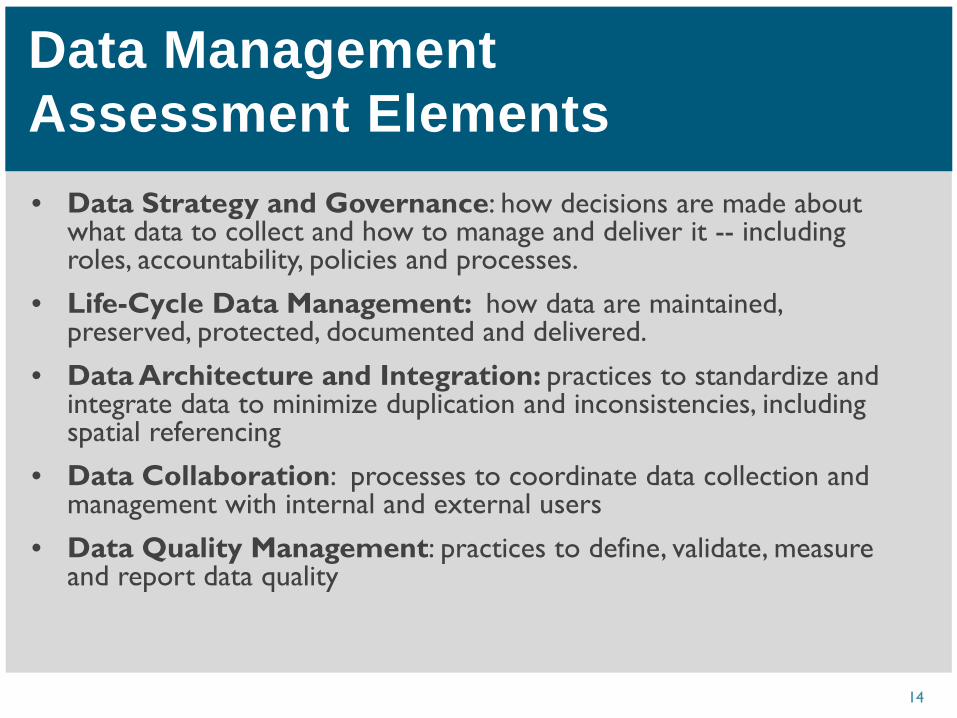
• Data Strategy and Governance: how decisions are made about what data to collect and how to manage and deliver it -- including roles, accountability, policies and processes.
• Life-Cycle Data Management: how data are maintained, preserved, protected, documented and delivered.
• Data Architecture and Integration: practices to standardize and integrate data to minimize duplication and inconsistencies, including spatial referencing
• Data Collaboration: processes to coordinate data collection and management with internal and external users
• Data Quality Management: practices to define, validate, measure and report data quality
Data Management Assessment Elements
14
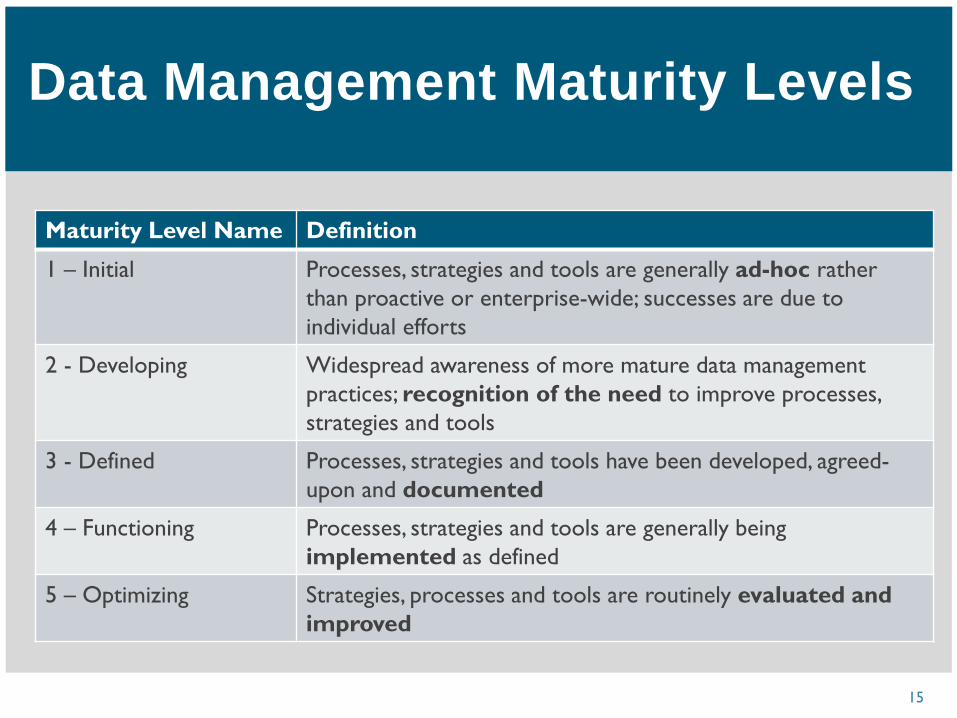
Maturity Level Name Definition
1 – Initial Processes, strategies and tools are generally ad-hoc rather than proactive or enterprise-wide; successes are due to individual efforts
2 - Developing Widespread awareness of more mature data management practices; recognition of the need to improve processes, strategies and tools
3 - Defined Processes, strategies and tools have been developed, agreed-upon and documented
4 – Functioning Processes, strategies and tools are generally being implemented as defined
5 – Optimizing Strategies, processes and tools are routinely evaluated and improved
Data Management Maturity Levels
15

Benefits of Moving Up the Maturity Scale (Data Quality)
16
• Agency data can be used as intended and can be used to produce reliable information that is valuable for decision making – because: – Data quality is addressed proactively, using standard quality control
and quality assurance processes – Data are validated based on established business rules – Data cleansing processes are automated – Efficient error reporting and correction processes are in place
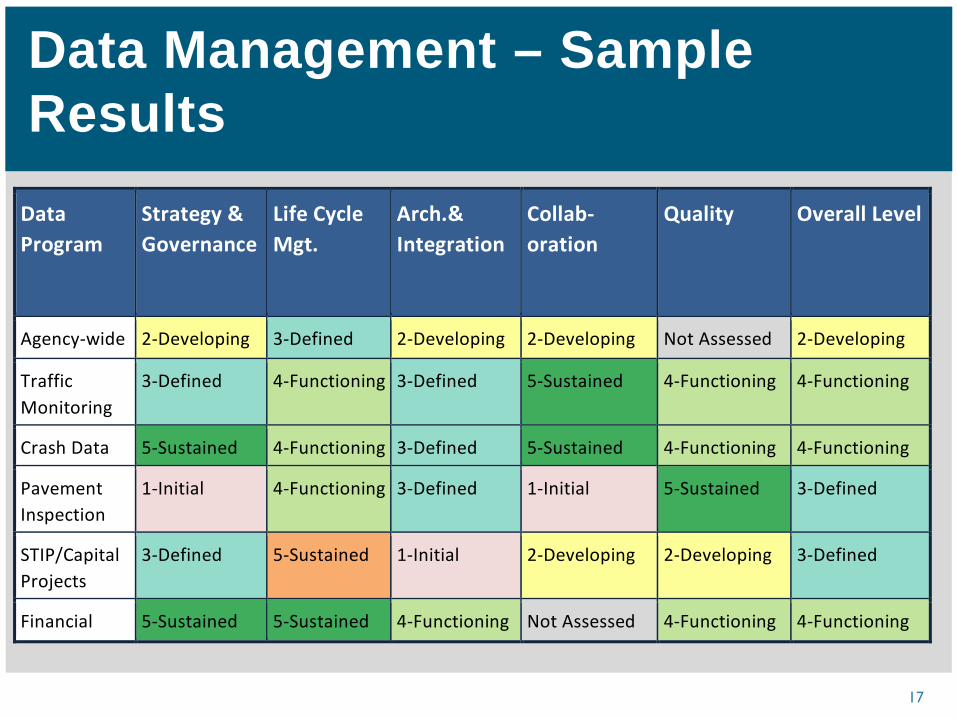
Data Management – Sample Results
17
Data Program
Strategy & Governance
Life Cycle Mgt.
Arch.& Integration
Collab-oration
Quality Overall Level
Agency-wide 2-Developing 3-Defined 2-Developing 2-Developing Not Assessed 2-Developing
Traffic Monitoring
3-Defined 4-Functioning 3-Defined 5-Sustained 4-Functioning 4-Functioning
Crash Data 5-Sustained 4-Functioning 3-Defined 5-Sustained 4-Functioning 4-Functioning
Pavement Inspection
1-Initial 4-Functioning 3-Defined 1-Initial 5-Sustained 3-Defined
STIP/Capital Projects
3-Defined 5-Sustained 1-Initial 2-Developing 2-Developing 3-Defined
Financial 5-Sustained 5-Sustained 4-Functioning Not Assessed 4-Functioning 4-Functioning
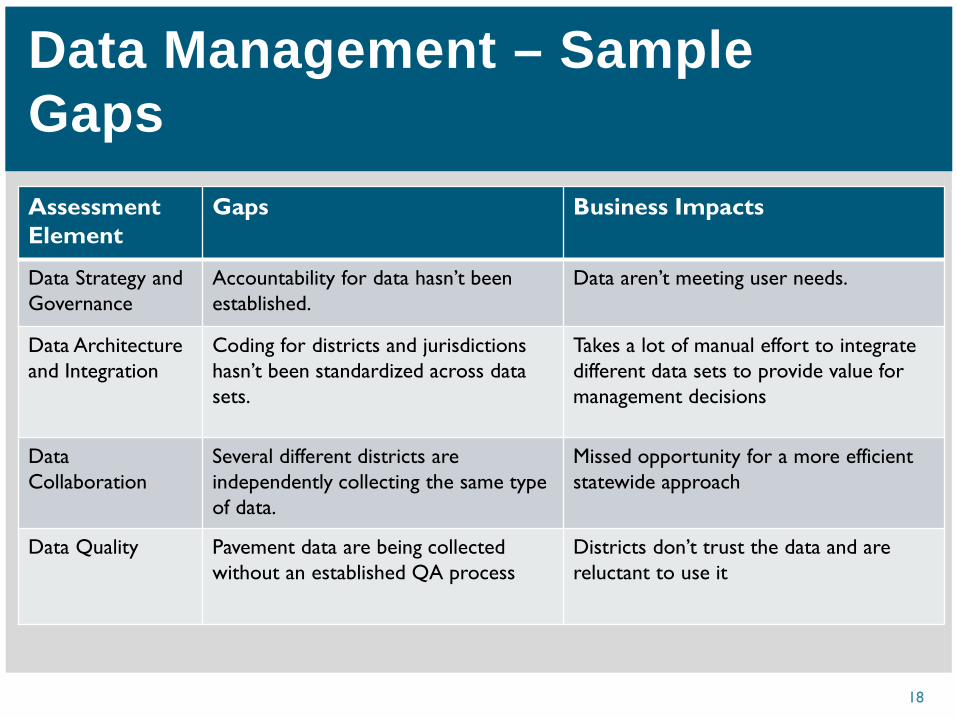
Data Management – Sample Gaps
18
Assessment Element
Gaps Business Impacts
Data Strategy and Governance
Accountability for data hasn’t been established.
Data aren’t meeting user needs.
Data Architecture and Integration
Coding for districts and jurisdictions hasn’t been standardized across data sets.
Takes a lot of manual effort to integrate different data sets to provide value for management decisions
Data Collaboration
Several different districts are independently collecting the same type of data.
Missed opportunity for a more efficient statewide approach
Data Quality Pavement data are being collected without an established QA process
Districts don’t trust the data and are reluctant to use it
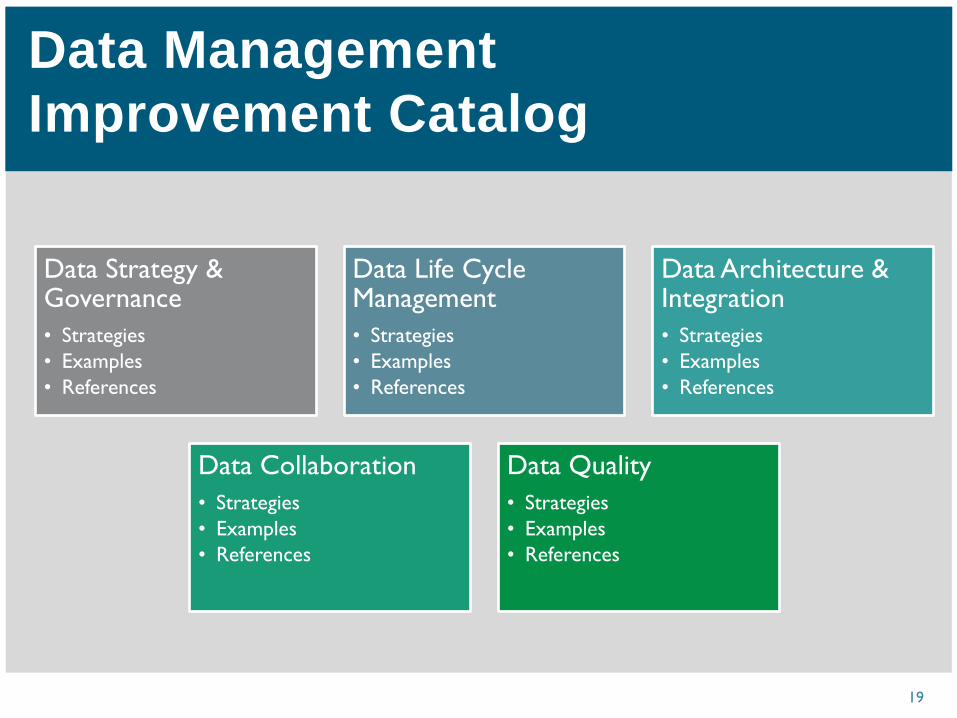
Data Management Improvement Catalog
19
Data Strategy & Governance • Strategies • Examples • References
Data Life Cycle Management • Strategies • Examples • References
Data Architecture & Integration • Strategies • Examples • References
Data Collaboration • Strategies • Examples • References
Data Quality • Strategies • Examples • References
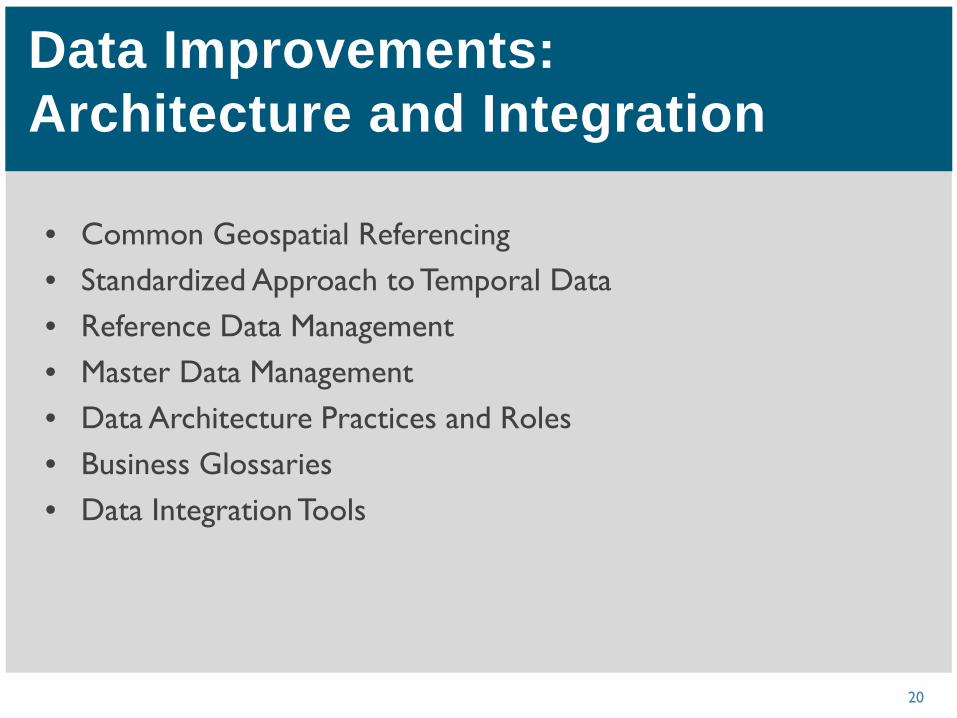
• Common Geospatial Referencing • Standardized Approach to Temporal Data • Reference Data Management • Master Data Management • Data Architecture Practices and Roles • Business Glossaries • Data Integration Tools
Data Improvements: Architecture and Integration
20
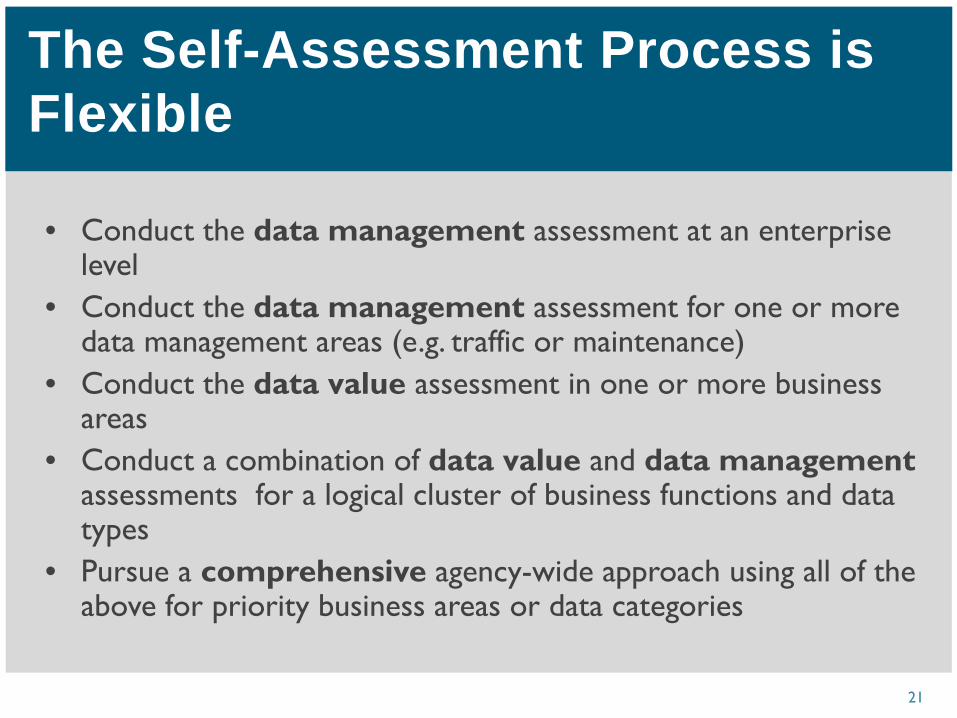
• Conduct the data management assessment at an enterprise level
• Conduct the data management assessment for one or more data management areas (e.g. traffic or maintenance)
• Conduct the data value assessment in one or more business areas
• Conduct a combination of data value and data management assessments for a logical cluster of business functions and data types
• Pursue a comprehensive agency-wide approach using all of the above for priority business areas or data categories
The Self-Assessment Process is Flexible
21
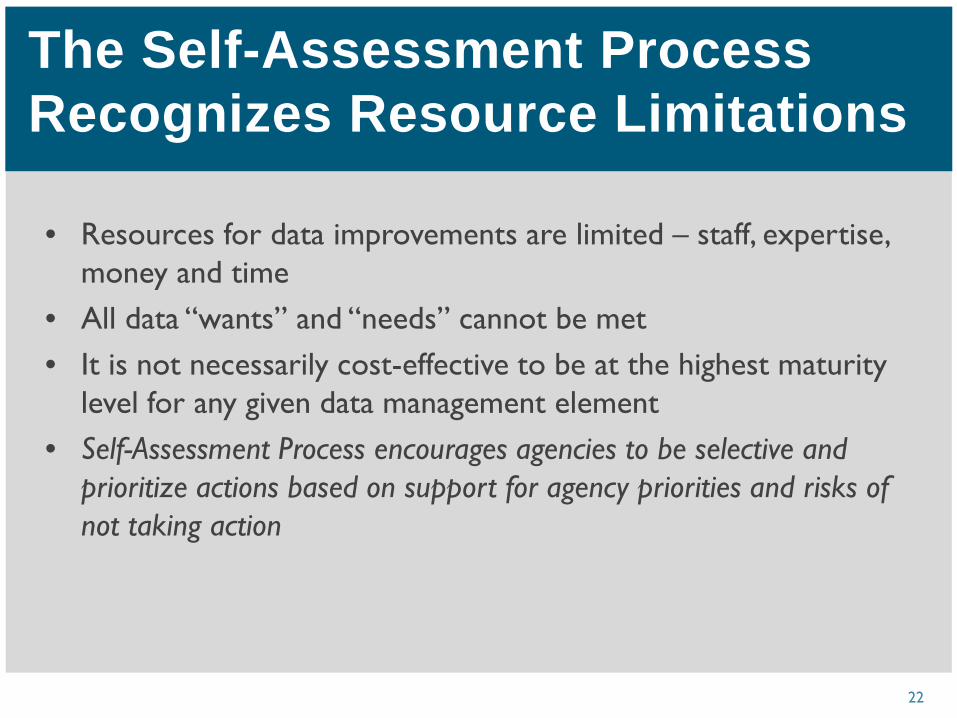
• Resources for data improvements are limited – staff, expertise, money and time
• All data “wants” and “needs” cannot be met • It is not necessarily cost-effective to be at the highest maturity
level for any given data management element • Self-Assessment Process encourages agencies to be selective and
prioritize actions based on support for agency priorities and risks of not taking action
The Self-Assessment Process Recognizes Resource Limitations
22

The Transportation Data Self-Assessment can help agencies to: • Understand how well their data is working for them • Understand what investments in data are not paying off – and
why • Make strategic investments to get data programs in alignment
with current and future agency priorities • Focus and strengthen data management roles, structures, policies,
practices and processes to minimize risks and improve efficiencies
• Periodically check on the progress of improvements – and readjust as needed
Conclusion
23
TRB Webinar: Data to Support Transportation Agency Business Needs: A Self-Assessment Guide
Stan Burns, Integrated Inventory, LLC
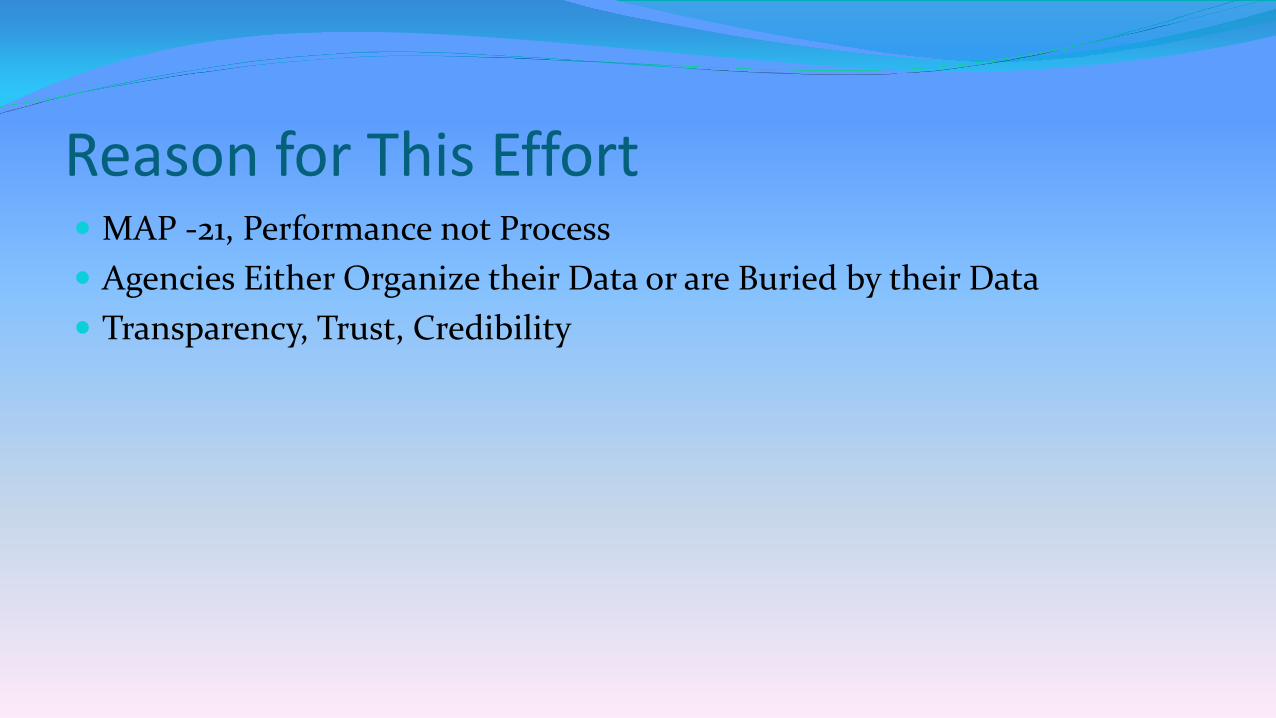
Reason for This Effort MAP -21, Performance not Process Agencies Either Organize their Data or are Buried by their Data Transparency, Trust, Credibility
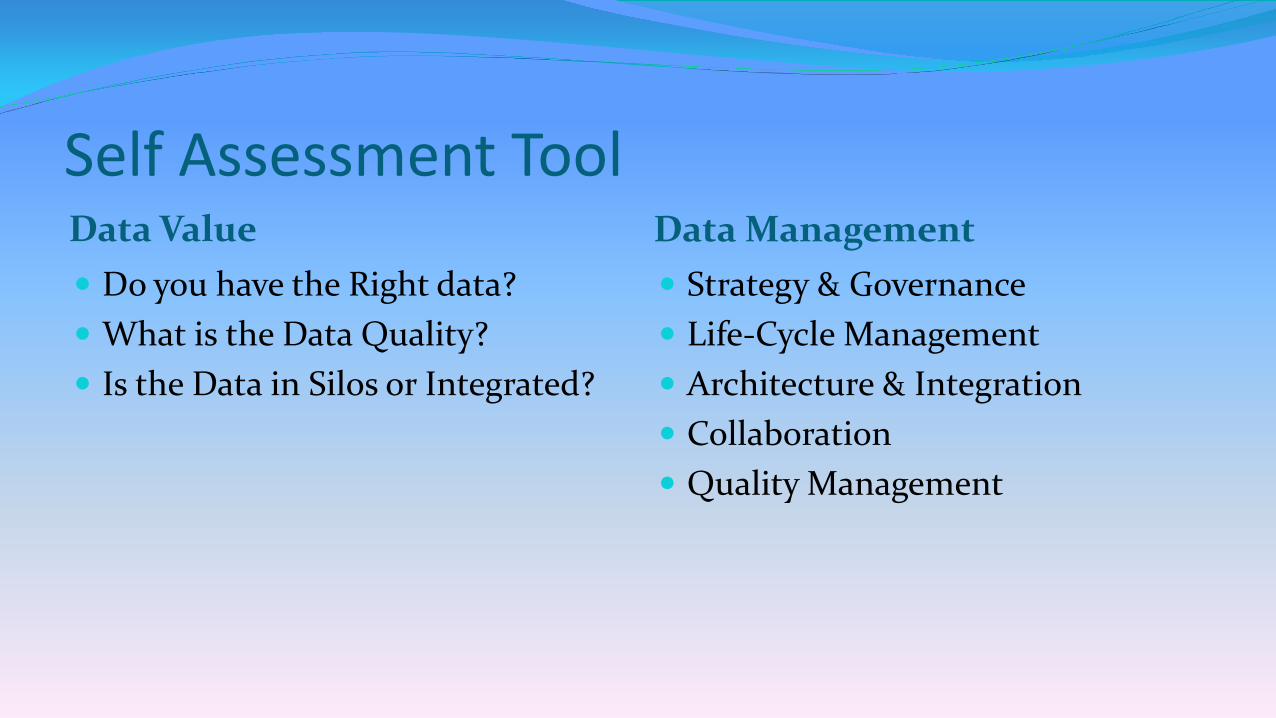
Self Assessment Tool Data Value Do you have the Right data? What is the Data Quality? Is the Data in Silos or Integrated?
Data Management Strategy & Governance Life-Cycle Management Architecture & Integration Collaboration Quality Management

Maturity Level “Processes, Strategies, Tools” Initial – Ad-Hoc, Rather than Proactive or Enterprise-wide Developing – Widespread Awareness but Recognize need for Improvement Defined – Has been Developed and Documented Functioning – Generally been Implemented Optimizing – Routinely Evaluated and Improved

Business Databases
Dashboards
Data Warehouse
Data Governance Board
Data Governance Board Analytics
Data Standards, Policies, Procedures
GIS, Mapping Semantic Layer
Dat
a V
isua
lizat
ion
Correct Errors
ETL
Data Community
Responsible Individuals
Business Definitions
Error Report

Sample Results
Data Program
Strategy & Governance
Life Cycle Mgt.
Arch.& Integration
Collab-oration
Quality Overall Level
Agency-wide 2-Developing 3-Defined 2-Developing 2-Developing Not Assessed 2-Developing
Traffic Monitoring
3-Defined 4-Functioning 3-Defined 5-Sustained 4-Functioning 4-Functioning
Crash Data 5-Sustained 4-Functioning 3-Defined 5-Sustained 4-Functioning 4-Functioning
Pavement Inspection
1-Initial 4-Functioning 3-Defined 1-Initial 5-Sustained 3-Defined
STIP/Capital Projects
3-Defined 5-Sustained 1-Initial 2-Developing 2-Developing 3-Defined
Financial 5-Sustained 5-Sustained 4-Functioning Not Assessed 4-Functioning 4-Functioning
Business Area Availability Quality Usability
Maintenance Management Good Fair Fair
Pavement Management Excellent Good Good
Safety Planning Excellent Good Fair
Performance Management Fair Fair Good
Project Scoping Good Fair Good
Construction Management Good Good Fair
Corridor Planning Good Good Poor
Data Value Data Management
Freight Demand Modeling and Data Improvement Self Assessment Tool
Tool Customization for Freight Data Application
1
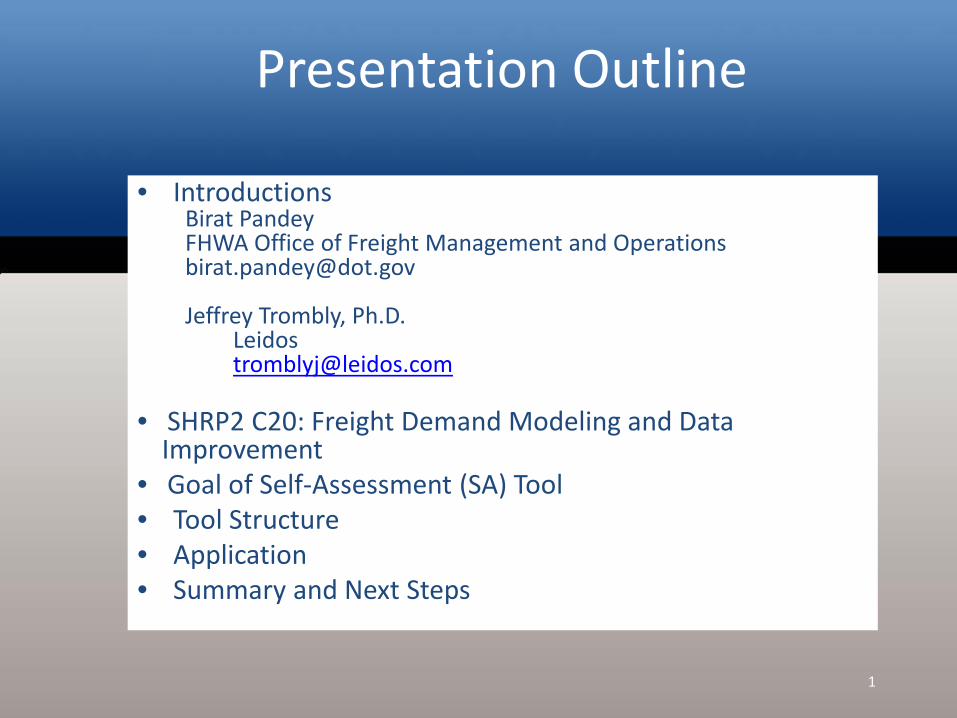
Presentation Outline
• Introductions Birat Pandey FHWA Office of Freight Management and Operations [email protected] Jeffrey Trombly, Ph.D.
Leidos [email protected] • SHRP2 C20: Freight Demand Modeling and Data
Improvement • Goal of Self-Assessment (SA) Tool • Tool Structure • Application • Summary and Next Steps
1
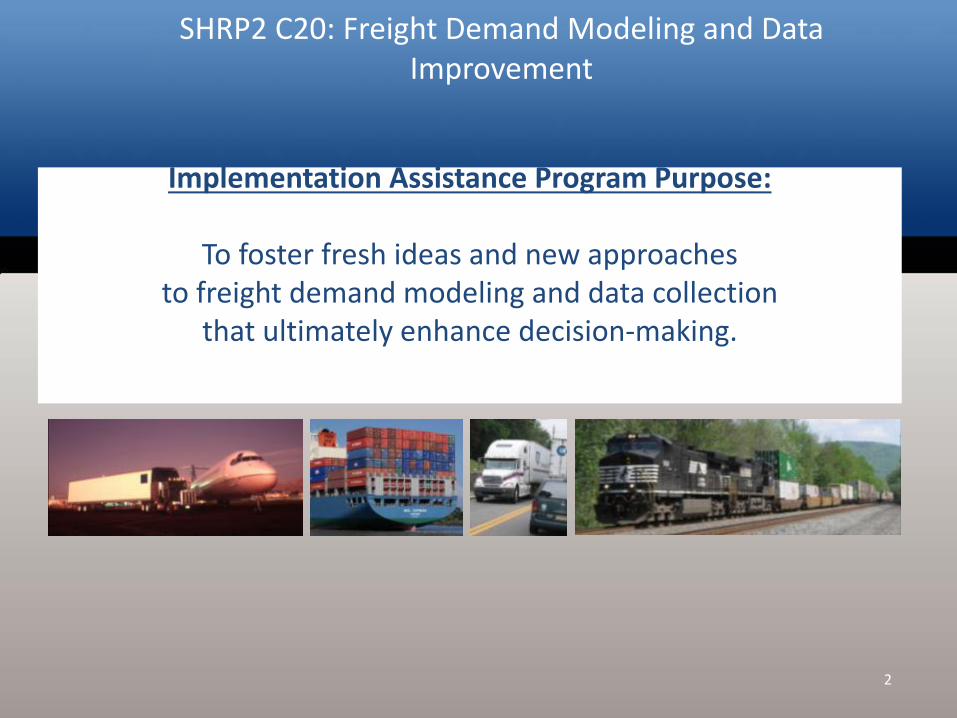
SHRP2 C20: Freight Demand Modeling and Data Improvement
Implementation Assistance Program Purpose:
To foster fresh ideas and new approaches to freight demand modeling and data collection
that ultimately enhance decision-making.
2
Goals of Freight Data Self-Assessment Tool
• Foster understanding of freight data sources and applications.
• Engage users in evaluating the suitability of available data sources to support freight related applications
• Guide users to projects or strategies developed through the SHRP2 C20 effort that may be applicable to their situation.
3
Importance of Freight Data
• Improve decision making process • Inform the judicious use of public fiscal
resources • Assist in effective planning for freight projects
and programs • Support evaluating and monitoring impacts of
freight policies • Meet transportation performance
management requirements
4

Freight Data Uses
• Strategy, Policy and Development • Needs Identification,
Project/Program Selection, Prioritization, and Evaluation
• System Management and Operations
• Performance Management
5
Freight Analytical Applications
• Applied to characterize, understand, and plan for freight transportation
• Analyze freight trend analysis • Project freight demand • Conduct impact analysis
6
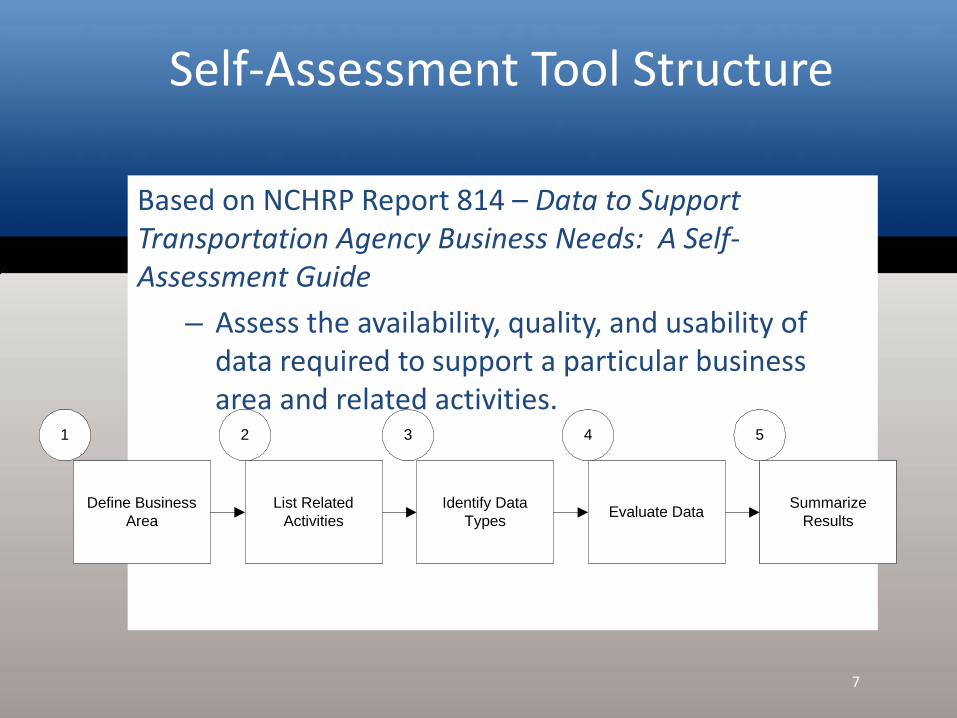
Self-Assessment Tool Structure
Based on NCHRP Report 814 – Data to Support Transportation Agency Business Needs: A Self-Assessment Guide
– Assess the availability, quality, and usability of data required to support a particular business area and related activities.
7
Define Business Area
List Related Activities
Identify Data Types Evaluate Data Summarize
Results
1 2 3 4 5
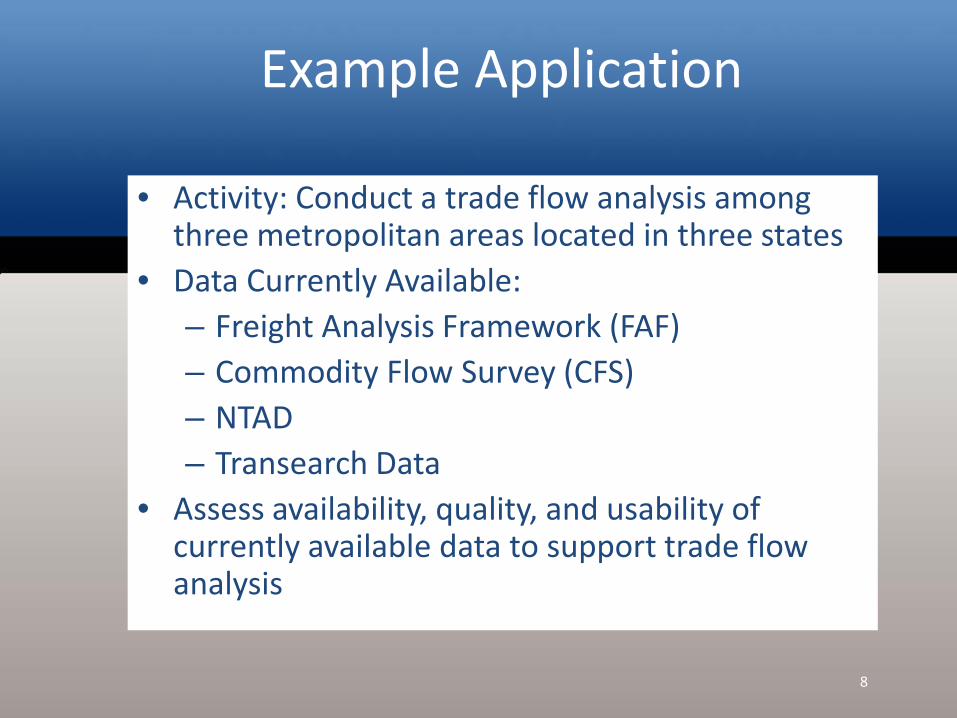
Example Application
• Activity: Conduct a trade flow analysis among three metropolitan areas located in three states
• Data Currently Available: – Freight Analysis Framework (FAF) – Commodity Flow Survey (CFS) – NTAD – Transearch Data
• Assess availability, quality, and usability of currently available data to support trade flow analysis
8
Step 1: Identify Business Area
Example: Freight Planning
9
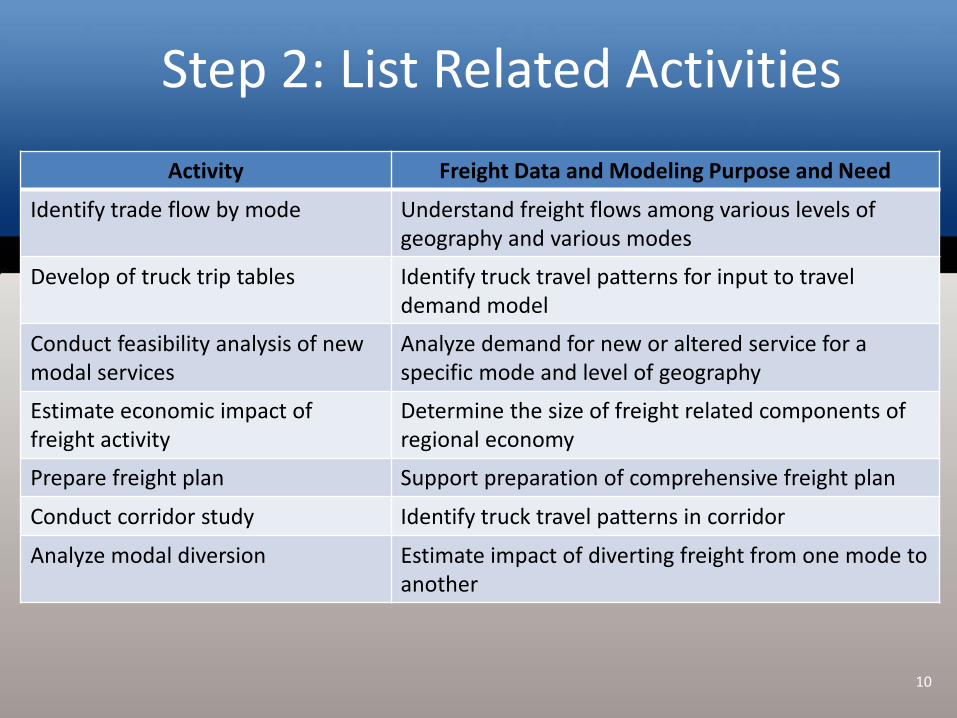
Step 2: List Related Activities Activity Freight Data and Modeling Purpose and Need
Identify trade flow by mode Understand freight flows among various levels of geography and various modes
Develop of truck trip tables Identify truck travel patterns for input to travel demand model
Conduct feasibility analysis of new modal services
Analyze demand for new or altered service for a specific mode and level of geography
Estimate economic impact of freight activity
Determine the size of freight related components of regional economy
Prepare freight plan Support preparation of comprehensive freight plan
Conduct corridor study Identify truck travel patterns in corridor
Analyze modal diversion Estimate impact of diverting freight from one mode to another
10

Step 3: Identify Data Sources
• Freight Analysis Framework (FAF) • Commodity Flow Survey (CFS) • National Transportation Atlas Database (NTAD) • Transearch Data • Other Federal Sources • Private Sector Data • Establishment Surveys • Roadside Truck Intercept Surveys • Supplemental Sources of Local Economic Activity • Local Data Sources
11

Step 4: Evaluate Data
Takes the assessment team through a process of rating the availability, quality, and usability of data required to support user defined freight activities:
– Data Availability – addresses whether the agency has the data in place, at the right level of detail, with sufficient coverage to support specific activities
– Data Quality – addresses whether data are current, accurate, and complete for performing activities
– Data Usability – addresses whether the data can be accessed, in a convenient form, to execute activities
12
Data Importance
13
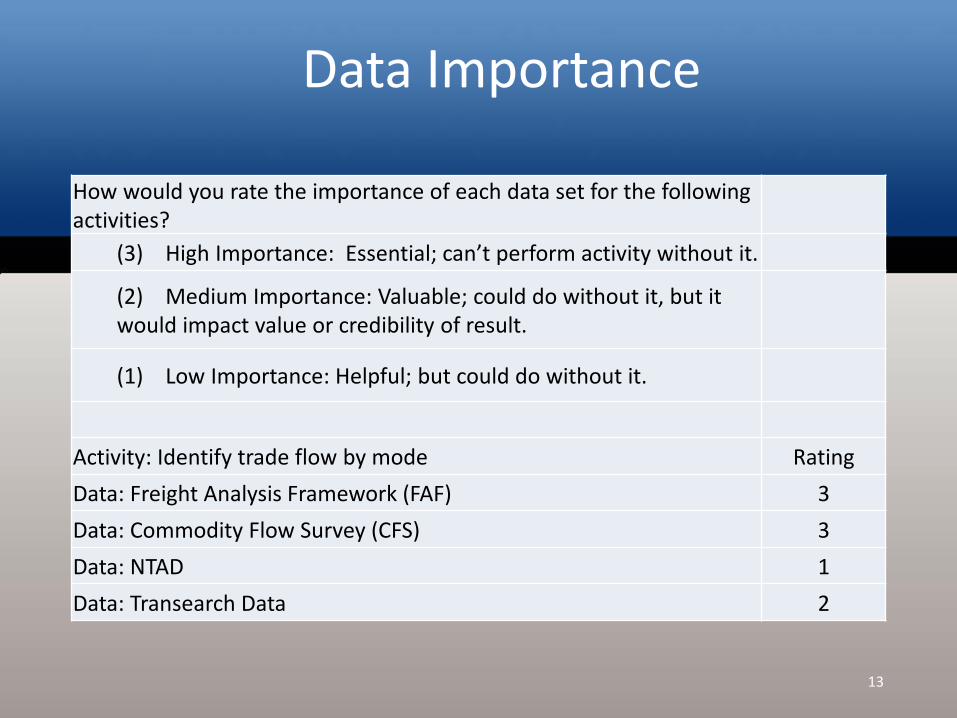
How would you rate the importance of each data set for the following activities?
(3) High Importance: Essential; can’t perform activity without it.
(2) Medium Importance: Valuable; could do without it, but it would impact value or credibility of result.
(1) Low Importance: Helpful; but could do without it.
Activity: Identify trade flow by mode Rating Data: Freight Analysis Framework (FAF) 3 Data: Commodity Flow Survey (CFS) 3 Data: NTAD 1 Data: Transearch Data 2

Data Availability
14
Data Availability Rating How would you rate the quality of each data set for the following activities:
(1) Poor: Data are available but require substantial effort to translate into usable form. (2) Fair: Data are available but require moderate efforts to translate into usable form. (3) Good: Data are available in a usable form but improvements to reporting capabilities would be helpful
(4) Excellent: Data are available in a usable form – no improvements are needed
Activity: Identify trade flow by mode Rating Data: Freight Analysis Framework (FAF) 4 Data: Commodity Flow Survey (CFS) 3 Data: NTAD 1 Data: Transearch Data 4
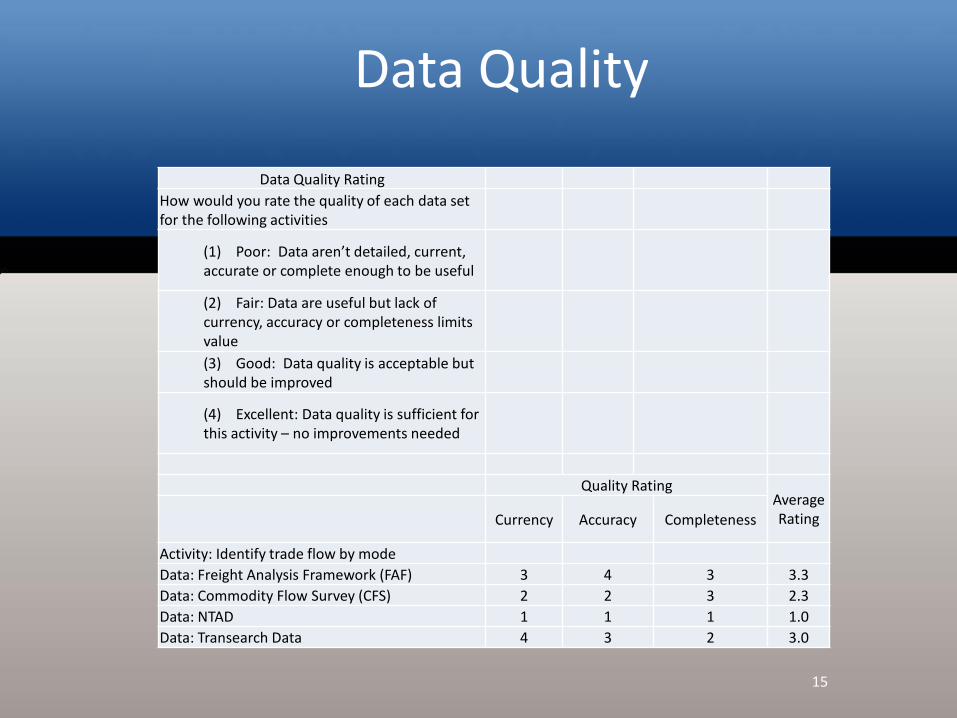
Data Quality
15
Data Quality Rating How would you rate the quality of each data set for the following activities
(1) Poor: Data aren’t detailed, current, accurate or complete enough to be useful
(2) Fair: Data are useful but lack of currency, accuracy or completeness limits value (3) Good: Data quality is acceptable but should be improved
(4) Excellent: Data quality is sufficient for this activity – no improvements needed
Quality Rating Average Rating Currency Accuracy Completeness
Activity: Identify trade flow by mode Data: Freight Analysis Framework (FAF) 3 4 3 3.3 Data: Commodity Flow Survey (CFS) 2 2 3 2.3 Data: NTAD 1 1 1 1.0 Data: Transearch Data 4 3 2 3.0
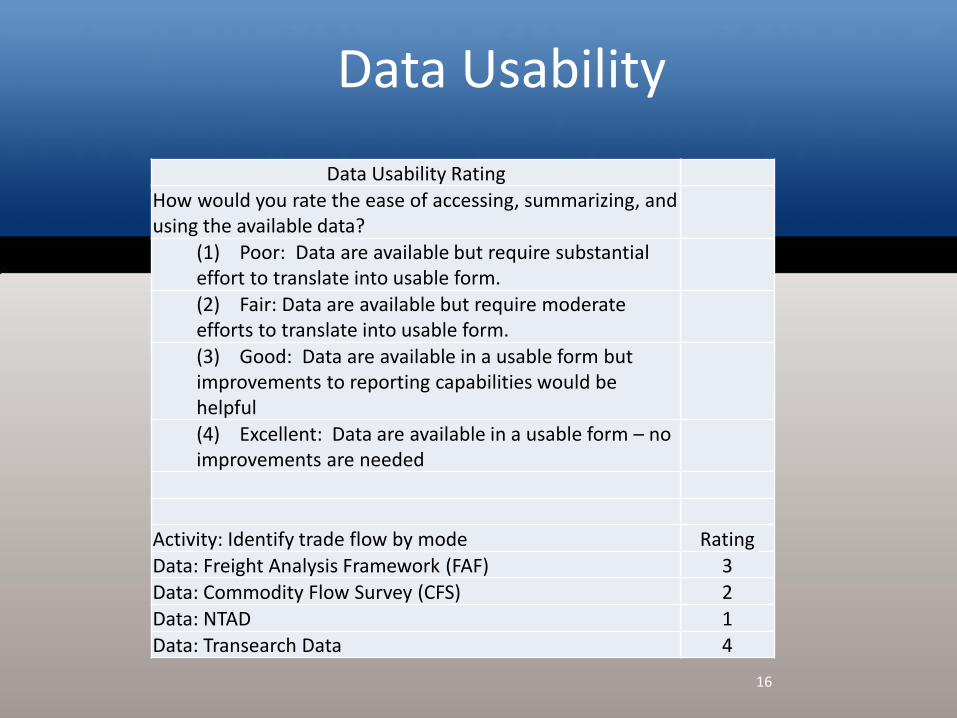
Data Usability
16
Data Usability Rating How would you rate the ease of accessing, summarizing, and using the available data?
(1) Poor: Data are available but require substantial effort to translate into usable form. (2) Fair: Data are available but require moderate efforts to translate into usable form. (3) Good: Data are available in a usable form but improvements to reporting capabilities would be helpful (4) Excellent: Data are available in a usable form – no improvements are needed
Activity: Identify trade flow by mode Rating Data: Freight Analysis Framework (FAF) 3 Data: Commodity Flow Survey (CFS) 2 Data: NTAD 1 Data: Transearch Data 4
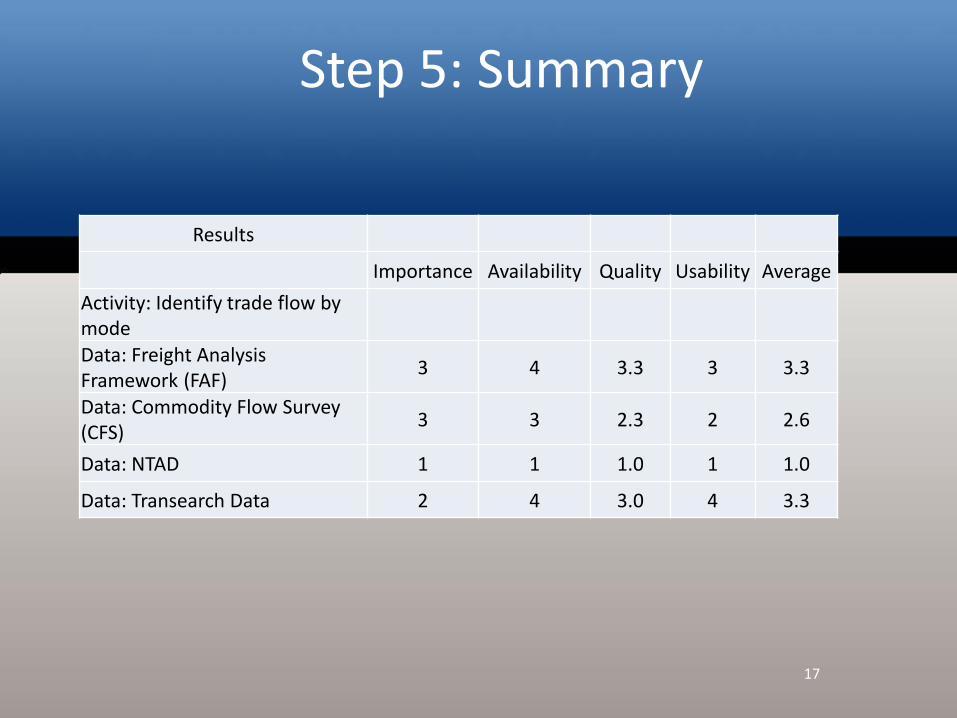
Step 5: Summary
17
Results
Importance Availability Quality Usability Average Activity: Identify trade flow by mode
Data: Freight Analysis Framework (FAF) 3 4 3.3 3 3.3
Data: Commodity Flow Survey (CFS) 3 3 2.3 2 2.6
Data: NTAD 1 1 1.0 1 1.0
Data: Transearch Data 2 4 3.0 4 3.3
Next Steps
• Develop final tool • Document approach
18

Next Steps
• Develop final tool • Document approach
19
AASHTO’s Approach
Penelope Weinberger AASHTO CTPP and Transportation Related Data Program Manager
Wholeheartedly Support
• NCHRP 8-36 Task 100 (2010) – through current • Data Self-Assessment Workshop at AASHTO
annual in Chicago (2015) • SCOP Subcommittee on Data and SCOP
Subcommittee on Capacity Building coordinated effort
• 2016 Capacity Building tasks: Two regional data self-assessment workshops – Goal of developing pilot projects – Desire to pilot a full agency implementation – Partial implementations work due to tool
scalability • 2017 Capacity Building tasks: Data Self-
assessment peer exchange – Review, refine, apply