Embed Size (px)
Citation preview

MAP, October 2014 1 mmsd.org/datause
Data Use Guide:
Measures of Academic Progress
(MAP)
For Teachers and Teacher Teams
October 2014

MAP, October 2014 2 mmsd.org/datause
Use the links or page numbers below to navigate easily between sections. Or press CTRL+F to search
for any text.
Understand the Data (page 2)
Understanding RIT Scores
Understanding Benchmark Scores
Understanding Growth Targets
Access the Data (page 4)
Finding Reports on the Data Dashboard
Finding Reports in NWEA
Analyze the Data (page 12)
Looking at Class Breakdown by Overall RIT
Looking at Class Breakdown by Goal and Using the Learning Continuum
Setting a Team SLO with the MAP by Strand Dashboard and the NWEA Class Report
Communicate the Data (page 15)
Setting Goals with Classes
Setting Goals with Students
Sharing MAP Data in Parent-Teacher Conferences
Understand the Data Understanding MAP
MAP stands for Measures of Academic Progress, a series of three assessments. These computerized
tests are adaptive and offered in Reading, Language Usage, and Mathematics. When taking a MAP
test, the difficulty of each question is based on how well a student answers all the previous
questions. As the student answers correctly, questions become more difficult. If the student answers
incorrectly, the questions become easier. Each student answers the same total number of
questions. In an optimal test, a student answers approximately half the items correctly and half
incorrectly. The final score is an estimate of the student’s achievement level.
Understanding RIT Scores
The unit of measure on the MAP test is a RIT scale (short for Rasch unIT). The RIT scale is an equal-
interval scale much like feet and inches on a yardstick. This RIT scoring system helps teachers to
pinpoint what students have learned and what students are now ready to learn. No matter which
grade they’re in, students receive scores on the same scale.

MAP, October 2014 3 mmsd.org/datause
It is helpful to remember that all test scores contain some degree of error. To convey this concept,
we use a confidence band around the obtained score to reflect this error. That is, if the student took
the test again, we would expect his/her score to fall within the score range most of the time.
Useful Measurement Concepts
Mean is the average score.
Median is the middle value of the group.
Standard deviation is a measure of how spread out the scores are. A higher standard deviation
indicates a greater range of scores.
Normative score is a student’s relative standing within a group (e.g., United States, District, School).
These are expressed in terms of percentiles. A student scoring at the 70th percentile has a score that
is equal to or greater than 70% of students in their grade level who took the test. It does not mean the
student got 70% of the items correct. Data Dashboard uses three percentile ranges for scores, while
NWEA reports use five.
Percentile scores for MAP goal strands
MAP goal strands in Data Dashboard: MAP goal strands in NWEA reports:
Low = bottom third (less than 33rd percentile) Low = less than 20th percentile
Average = middle third (between 33rd and Low Average = 21st-40th percentile
66th percentile) Average = 41st-60th percentile
High = top third (above 66th percentile) High Average = 61st-80th percentile
High = above 80th percentile
Understanding Benchmark Scores
MAP scores by themselves do not indicate proficiency in the student’s current curriculum. Scores that
predict proficiency are called benchmarks (or cut scores). These benchmark scores should be used
to determine whether students are on track for proficiency on state accountability tests (e.g. WKCE
or Smarter Balanced). Because the categories “Minimal,” “Basic,” “Proficient,” and “Advanced” are
very broad, do not use these categories to identify students for additional supports and interventions.
Instead, use percentile scores when making student-specific intervention decisions.
Understanding Growth Targets
Because RIT is an equal interval scale, it can show growth from one year to the next. The system
predicts a student’s growth for the year. This is called a growth target. At the end of the year you
can see whether a student met his/her growth target.
Schools set SIP goals for both “proficiency” and “growth.” The “proficiency” goal is really a
benchmark goal. Goals for “proficiency” refer to the number of students meeting or exceeding the
benchmark for their grade level at that time of year. Goals for growth refer to the number of students
who meet their growth goals from Fall to Spring.
Questions and Contacts
For questions about how to use MAP data as part of SIP or teacher team planning, contact your
School Improvement Partner or Data Strategist.

MAP, October 2014 4 mmsd.org/datause
Access the Data
Finding MAP Reports on the Data Dashboard
Data from MAP assessments becomes available approximately 1-2 weeks after the district test
window closes.
There are multiple MAP reports available on the Data Dashboard on the Basic tab. To access the
Data Dashboard, go to mmsd.org and click “Staff Only.” Log in using your b number and password
and then click on the “Data Dashboard” icon under “Logon Pages for Staff.”
Or, you can click on this link: dashboard.mmsd.org
Once you have logged on to the Data
Dashboard, click the “Assessment” link under the
Basic tab (1). Then, click “MAP” (2).
This link will take you to a page with a series of filters, one of which is highlighted in red (3). You must
select a test subject (Reading, Math, or Language Arts) using this filter to move forward.
This will take you to the default MAP dashboard, which is called MAP Benchmark. This dashboard
focuses on proficiency rates. You can switch between MAP dashboards by clicking the links under
the “Related Dashboards” header on the left side of your screen (4). This Data Use Guide focuses on
the MAP Benchmark dashboard, the MAP Growth dashboard, and the MAP by Strand dashboard.
MAP “Proficiency” and Growth are the
measures used for setting achievement goals
each school’s SIP. Other available MAP
dashboards include MAP Normative
Performance, MAP Participation, and MAP
Cut Scores.

MAP, October 2014 5 mmsd.org/datause
Filters
At the top of each Dashboard is a series of filters (5). These filters allow you to select a test subject,
school year, test period, school, grade, team, program, and a variety of demographic
characteristics.
Graphs
The MAP Benchmark dashboard features eight graphs and the MAP Growth dashboard features 18
graphs. These graphs are designed to help you answer who, what, where, and when questions
around MAP proficiency and growth. These graphs cannot answer why you are getting the results
you see; answering why is part of analyzing the data. All of these graphs are modified by the filters
above.
Some graphs pertain to your current active students while others pertain to all students tested at a
certain time whether or not they are still in your school or MMSD. Be sure to read the text above each
graph so you know which group of students you are looking at.
For the MAP Benchmark dashboard, most graphs show the percent of students projected to
score as minimal, basic, proficient, or advanced, with each result represented by a different
color (6). Proficiency rates can be calculated simply by adding the percent proficient and the
percent advanced.

MAP, October 2014 6 mmsd.org/datause
For the MAP Growth dashboard, the first eight
graphs show the percent of students meeting
their growth targets over the four possible
periods for MAP growth: fall to fall, fall to winter,
fall to spring, and spring to spring. Each graph
shows the percent of students who met their
target (7). There are two graphs for each
possible growth period, one showing data
disaggregated by race/ethnicity and the other
showing data disaggregated by other
demographic characteristics.
The next eight graphs illustrate average RIT score
changes compared to average expected RIT
score changes. The orange bars show average
actual RIT score gain while the small blue boxes
show the average expected RIT score gain, so a
bar that is higher than the blue box means that
a group of students grew more than expected
on average. The final two graphs show average
RIT scores throughout the year.
For the MAP by Strand dashboard, you can use a special filter set (8) to choose year tested, test
subject, and strand.
The first graph (9) shows current active students’ performance on that strand (low, average, and
high) disaggregated by grade. The second graph shows the same information for all current active
students together.

MAP, October 2014 7 mmsd.org/datause
Drilling Down
For most of the graphs above, you can click on the column or bar to show the list of students that
constitute the number shown on the graph. For example, clicking on the blue portion of a proficiency
graph on the MAP Benchmark dashboard would show you a list of all students scoring advanced.
After you drill down, you can continue to modify the data using filters. You also can export the data
to Excel for further analysis by clicking on the button that shows a small floppy disk and graph (10).

MAP, October 2014 8 mmsd.org/datause
Finding Reports in NWEA
Reports update overnight and are available in NWEA accounts the day after testing. If creating
reports before the testing window is complete, be aware that scores may not include students who
need to take make-up tests. District averages also are not calculated until the end of testing.
Note: NWEA does not display scores for small groups of fewer than ten students. If there fewer than
ten students in a subgroup, their average scores will not display.
To access the NWEA reports, log in at https://madisonk12-admin.mapnwea.org/admin with your e-mail address
and password. Use the Forgot User Name/Password link if you do not know your password.
Once you have logged on to NWEA, click “View Reports & Instructional
Resources.” The menu will expand (1). Click “MAP Reports.” The types of
reports available to you will vary based on your role. This guide includes
reports visible to teachers, including the Class Report, Class Breakdown
Reports, and the Student Goal Setting Worksheet.
Class Report
From the MAP reports screen, click “Class Report.” Select the term that students were rostered and
tested. If necessary, choose school and teacher. Select your class(es) using the checkboxes (2) and
the test subject(s) you wish to analyze.
If desired, choose optional grouping by gender
or ethnicity. Sort students by name or by RIT
score.
Student Detail display produces a list of student
scores. Goal performance display further breaks
down the information by goal area.
Click “Create Report.” Depending on the length
of the report, it may take a few minutes to
generate. Click View/Print to open the report (3).
You can save the report as a .pdf file and/or
print it.

MAP, October 2014 9 mmsd.org/datause
Class Report, continued
Scroll through the entire report.
If you checked “Goal Performance,” the second page will look like the sample below, with a
summary table of the class mean, median, and standard deviation (4). The bar graph shows the
distribution of scores within national percentile rankings (5). In the example class below, five students,
or 25% scored between the 61st and 80th percentile (which is considered high average) in the
statistics and probability goal area (6). The section on the right shows the mean, median, and
standard deviation of RIT scores for each goal area (7).
Bonus: Grade Reports
A person at your school with an Administrator or Assessment Coordinator role within the NWEA system
can print the same type of report for all students at a given grade level. It is called the “Grade
Report.” Contact your principal to find out who has those roles at your school. Prepare for your team
meeting by generating, saving, and sharing those reports in advance.

MAP, October 2014 10 mmsd.org/datause
Class Breakdown Reports
From the MAP Reports screen, click “Class Breakdown Reports.” Select the term that students were
rostered and tested. If necessary, choose school and teacher. Select your class using the dropdown
menu. Under Report Options, choose “by RIT.” Click the blue “Create Report” button.
This report places each student in the class within a RIT score band. In the Class Breakdown by RIT
report, the scores are for each test subject. In the example below, math scores in this class range
from 173 (8) to 221 (9). Note that math cut scores are higher than Reading and Language Arts cut
scores, so use caution in comparing rows on this chart.
To jump to a Class Breakdown by Goal report, use the dropdown menu (10) to change the report
type to “Goal.”
You can switch between subjects using the dropdown menu for Subject (11).
Use the scroll bar at the bottom of the report if the class has many score ranges.
Scores in parentheses are the student’s overall RIT score for that subject. For example, the students in
the 181-190 band below for writing (12) scored lower for Writing than their overall RIT score in the low
200s.
Navigate to the Learning Continuum from this report by clicking on the strand name (13).
1
13
MAP, October 2014 11 mmsd.org/datause
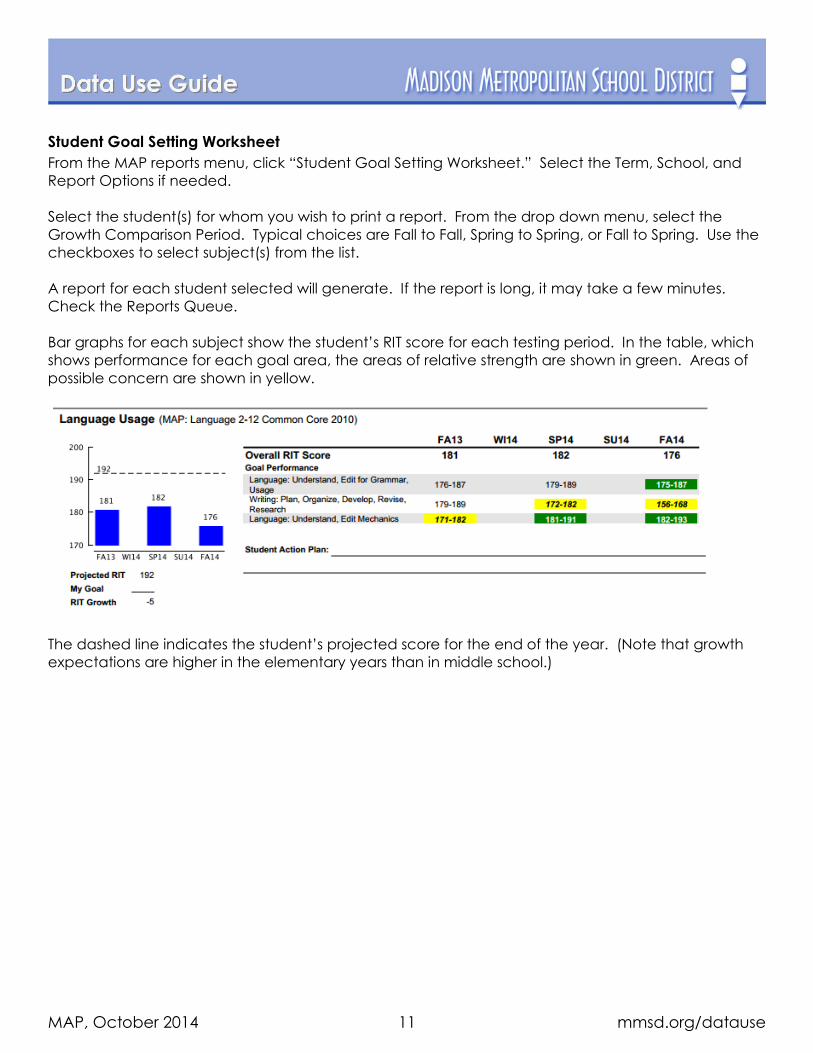
Student Goal Setting Worksheet
From the MAP reports menu, click “Student Goal Setting Worksheet.” Select the Term, School, and
Report Options if needed.
Select the student(s) for whom you wish to print a report. From the drop down menu, select the
Growth Comparison Period. Typical choices are Fall to Fall, Spring to Spring, or Fall to Spring. Use the
checkboxes to select subject(s) from the list.
A report for each student selected will generate. If the report is long, it may take a few minutes.
Check the Reports Queue.
Bar graphs for each subject show the student’s RIT score for each testing period. In the table, which
shows performance for each goal area, the areas of relative strength are shown in green. Areas of
possible concern are shown in yellow.
The dashed line indicates the student’s projected score for the end of the year. (Note that growth
expectations are higher in the elementary years than in middle school.)

MAP, October 2014 12 mmsd.org/datause
Analyze the Data
MAP results can be analyzed for different purposes. The district and the school, typically the SBLT,
can analyze MAP results on an annual basis for summative purposes. Here, we would ask, “how are
we doing as a school district or an individual school on hitting our benchmarks? How have we done
over time? Do we need to consider making systems level adjustments within our core instruction?”
MAP results can also be used as an interim assessment to assess growth over a shorter period of time
(e.g., fall to fall, spring to spring, fall to spring). Teacher teams will likely analyze the results from this
perspective. They will use Fall MAP results in combination with other screening results to understand
what instructional levels their students are performing at within the domains of Reading, Math, and
Language usage. A teacher’s use of day to day formative assessments, interim common
assessments, and/or other progress monitoring measures will help teachers to know if their students
are on-track for meeting year-end growth goals.
The Data Analysis Protocol (located in the SBLT Toolkit and Teacher Team Toolkit) provides an
excellent structure to analyze any data, including MAP. Here, you identify your purpose for analysis.
Questions on the Data Analysis Protocol will help guide your problem solving, action planning, and
follow-up steps.
Consider the supplemental questions below as needed as you review your data. These questions,
which are specific to the type of data discussed in this Data Use Guide, are designed to be paired
with the questions in the Data Analysis Protocol to help you dig deeper into your data.
Purpose
A teacher would want to look at class breakdown reports to understand how all the students in
his/her class performed. This will allow the teacher to estimate the level of differentiation needed
within a group of learners.
Preparing for a Team Meeting Bring printed copies of your Class Breakdown by Overall RIT and Class Breakdown by Goal reports.
And/or bring your laptop to access the reports in a live format. Know your NWEA login information.
If the team wishes to begin with grade level data, access Data Dashboard or ask a person with
school-level access to print a Grade Report (see page 9).
Looking at Class Breakdown by Overall RIT Review the Data
1. Review key terms in the Understanding the Data section as needed.
2. Notice: Student RIT scores are grouped into score bands. Depending on the students in your
class, your report may start or end with different bands than those of your colleagues.
3. Find the benchmarks for your grade level and time of year on the MAP Cut Scores Dashboard
(grades 2-8). These are also within the Benchmark Document at the bottom of this site:
https://accountability.madison.k12.wi.us/finding-using-and-understanding-data-elementary-
grades.
4. Briefly find your way around the data: Which student has the highest score? Which student
has the lowest score? Which student has the median score? How do those scores compare
to the benchmarks?

MAP, October 2014 13 mmsd.org/datause
Analyze the Data
1. How many RIT bands are represented in your class? The more bands shown (and the higher
the standard deviation), the greater the academic diversity of the group.
2. Where are students clustered? Are there outliers or clusters of students who seem to be at the
upper end or the lower end of the score distribution?
3. Which groups of students might need additional support?
Discuss Root Causes What within the school’s curriculum, instruction, and/or environment may be contributing to your
current results?
Consider Actions 1. Consider creating flexible small groups based on student strengths and needs.
2. Would it be helpful to create cross-class groupings to address student needs and strengths
more specifically?
3. What other data (Beginning of Year assessments, formative assessments, teacher- or team-
created assessments, other student work) complements this information?
4. How can teachers in all subject areas reinforce disciplinary literacy and mathematical
reasoning?
Looking at Class Breakdown by Goal Review the Data
1. Review key terms in the Understanding the Data section as needed.
2. Notice: Numbers in parentheses for each student indicate that student’s overall RIT score for
the subject area (Reading, Math, or Language Use). Again, depending on the students in
your class, your report may start or end with different bands than those of your colleagues.
3. Briefly find your way around the data: Which student has the highest score? Which student
has the lowest score? Which student has the median score?
Analyze the Data
1. Compare students’ RIT scores for each goal area to their overall RIT score (in parentheses) for
that subject. For example, a student with an overall RIT score of 205 in Math and a 190 in
Measurement and Data may need additional support for that goal area.
2. Which areas are relative strengths for your class? Which are areas of need?
Discuss Root Causes 1. What within the school’s curriculum, instruction, and/or environment may be contributing to
your current results?
2. How do students’ needs and strengths align with your curricular expectations?
Consider Actions 1. For which goal area will whole-class instruction be most effective? (Hint: Where are the
students least spread out over multiple RIT ranges, indicating less variability?)
2. For which goal area will use of flexible groups be most helpful? (Hint: Where are students most
spread out across RIT ranges?)
3. Use the Learning Continuum (formerly DesCartes) to align curriculum with student strengths
and needs. New features this year allow you to display learning statements by grade level.
For an example of how to use the Learning Continuum . . .

MAP, October 2014 14 mmsd.org/datause
o Under View Reports & Instructional Resources on the NWEA site, click “Learning
Continuum.” Then scroll down to the Information Center. The Learning Continuum
Overview shows how one middle school math teacher uses it.
o See the handout from NWEA on 4 Ways to Use the Learning Continuum at
accountability.madison.k12.wi.us/map.
4. What other data (Beginning of Year assessments, formative assessments, teacher- or team-
created assessments, other student work) complements this information?
Setting a Team SLO with the MAP by Strand Dashboard and the NWEA Class
Report Preparing for a Team Meeting
Invite a person with school level access (principal, instructional coach, IRT, etc.) to the meeting, or
ask them to create and send you a Grade Report for your grade (see page 9).
Bring your laptop to access Data Dashboard. NWEA data is available in Data Dashboard
approximately one week after testing ends. It is available within NWEA the day after testing.
Review the Data
1. Project the Grade Report on screen. Scroll down to the Goal Area section of the report.
2. Find the benchmarks for your grade level and time of year on the MAP Cut Scores Dashboard
(grades 3-8).
3. Review key terms in the Understanding the Data section as needed, especially the definitions
of Low, Average, and High. These are based on percentile rankings.
4. Open Data Dashboard to the MAP by Strand Dashboard. Apply filters for your grade, year
tested, and test period.
Analyze the Data
1. In which goal area do students have the most room for improvement? Is this goal most
appropriate for your team? Does this goal intersect with district focus standards and/or
strategies outlined in your SIP?
2. How does this data complement data from other assessments (Beginning of Year assessments,
formative assessments, teacher- or team-created assessments, other student work)? Does it
confirm or disconfirm your other observations?
3. In Data Dashboard, choose that goal area. Drill down to the list of your students by clicking on
the red, yellow, and green bars in the graph.
Discuss Root Causes 1. What within the school’s curriculum, instruction, and/or environment may be contributing to
student performance in that goal area?
2. What specific teacher actions contribute to student success in this goal area?
Consider Actions 1. Which Culturally and Linguistically Responsive Strategies from the Great Teaching Framework
will help you to meet your SLO?
2. Which other Professional Practice Goals would best complement your SLO?
3. How will you measure your SLO at year end? MAP data will be available the day after testing
is completed in NWEA. Data will be available in Data Dashboard approximately one week
after the test window closes. (2015 Spring window closes 5/29)
4. How will focusing on this as a goal area require re-prioritization of other goals?

MAP, October 2014 15 mmsd.org/datause
Communicate the Data
The importance of feedback and student expectations When used thoughtfully and in combination with other data, MAP reports can be a useful source of
feedback to students about their progress. In Visible Learning for Teachers, John Hattie (2011) reports
that of all the many strategies he analyzed, the most effective was asking students to set
expectations for their learning and then encouraging them to surpass those expectations.
Setting Goals with Classes Consider sharing the class median or average for a selected goal area.
Use the Learning Continuum to unpack selected standards related to that goal area.
Share learning targets related to the standards within that goal area.
Make the connection explicit when designing and implementing instruction for that goal area.
Invite students to brainstorm ways the class can improve in the selected goal area.
Setting Goals with Students Use the Student Goal Setting Worksheet report.
Invite students to reflect on their performance, including areas of strength and possible areas
of concern.
Help students to set a goal that is related to areas for improvement.
Sharing MAP Data in Parent-Teacher Conferences The district prints and distributes to schools a copy of each student’s Student Progress Report.
This shows all of a student’s scores since they began taking the test, with line graphs
comparing the district and national norms to the student’s scores.
Spend less than 5 minutes talking about MAP scores in a 20-30 minute conference. Be
prepared to discuss student reports. Understand report terms like RIT score, mean, median,
and projected growth.
Let parents know how the student is performing in relation to district scores for their grade level.
For example, you could say, “Your student is performing slightly below district benchmarks for a
typical 6th grader.”
For students with multiple years of MAP results, talk about the student’s growth over time.
If you have set class or student goals related to MAP, share those with parents, and suggest a
couple of ways they can help their child at home. Make sure they are simple, effective
strategies.
See our Data Use Resource for Sharing Data at Parent-Teacher Conferences at
mmsd.org/datause, including a brief Power Point with Facilitator Guide and Handouts.