Embed Size (px)
Citation preview

Assembling Validated Water Audit Data for Reliable Utility Benchmarking
1
DATA VALIDITY IN THE WATER AUDIT - IMPROVING ACCURACY FOR TARGET SETTING AND NRW REDUCTION Lead Authorship: William J. Jernigan, P.E. Co-Authorship: AWWA WLCC Software Subcommittee Members; Andrew Chastain-Howley, Michael Cobb, David Goff, George Kunkel, Alain Lalonde, David Sayers
Abstract
The Water Loss Control Committee of the American Water Works Association is very active in promoting best practices in water auditing by drinking water utilities. In 2011, the committee embarked upon an effort to collect and validate an initial pool of water utility water audit data. Data validation is an integral part of the IWA/AWWA Water Audit employed as the best practice tool for data collection. It is important to input accurate and meaningful data into the Water Audit, in order to yield accurate and meaningful performance indicators. Accuracy of information promotes effectiveness in water loss management and revenue recovery in utility systems. Inaccuracy of information promotes misalignment of resources and utility system inefficiencies. This paper describes AWWA’s data collection efforts and outlines the data validation process and where utility systems should generally focus initial efforts for improvement of data validity. The utility-specific dataset from a group of utility systems in North America was compiled by using the AWWA Free Water Audit Software© (latest version, 4.2, June 2010) which was created by the AWWA Water Loss Control Committee. Each Water Audit in this dataset was peer reviewed for analysis of data validity. Results and discussion of this analysis are presented herein.
Introduction
The American Water Works Association’s (AWWA) Water Loss Control Committee (WLCC) assembled in 2011 an initial dataset of Water Audit data from 26 water systems from the United States and Canada. This effort represents the initial phase of a project that ultimately aims to establish North American water industry benchmarks for water loss control, while promoting the use of standardized water loss accounting practices. A list of the participating utilities, as well as the members of the WLCC who participated in the project is included in the Acknowledgements section. The routine compilation of standardized water audits by water utilities is a relatively new practice in North America. As a water utility sets out to compile the water audit for the first time (and perhaps for several subsequent years) the data available to input into the water audit may be relatively crude. An example might be the use of a rough estimate of the amount of water lost due to customer metering inaccuracies. In the absence of any meter testing, the auditor might “ballpark” the quantity of this loss to 3% of billed metered consumption. In subsequent years – during which meter testing is conducted on a representative sample of meters – the auditor may come to find that this loss is 2.2% of billed metered consumption. The latter quantity is therefore given a higher grading than the earlier quantity since it is based upon actual test data, a more valid approach than a rough approximation. Knowing the relative validity of the components of a water audit is therefore crucial to the level of credibility of the audit performance indicators. The major emphases of this paper are 1) the validity of the data reported by the water utilities and 2) the range of operational and financial performance indicators calculated from the input data. Data Validity is a measure of the accuracy of the audit. There are many terms that may be interchanged, including data confidence, integrity, correctness, accuracy, quality and reliability. All of these terms are synonymous with Data Validity. AWWA

Assembling Validated Water Audit Data for Reliable Utility Benchmarking
2
developed and published a means for quantifying Data Validity as part of the AWWA Free Water Audit Software© (software). Each data input is assigned a grading value of 1 – 10, based on how a utility’s policies and practices match up to a set of grading criteria for a particular data input. An example grading criteria is shown in Figure 1.
The Water Audit Data Validity Score (DV) is calculated based upon the gradings of all of the entered components and this value it displayed near the bottom of the Reporting Worksheet of the software. For data inputs that do not apply, a grading of “n/a” is assigned, and the data input is removed from the calculation of the DV. The DV is then rebased such that the maximum possible score is always 100. In the context of the water utility’s water supply and customer billing operations, certain quantities have greater impact on the water audit than others. Water Supplied (Volume from Own Sources, imported and exported water), Billed Metered Consumption, and Customer Metering Inaccuracies are significant inputs, as any degree of error in these three inputs will more heavily skew accuracy of the Water Audit results versus an equal degree of error in other data inputs. As a result, the most effective efforts for improvement of Data Validity often involve one or more of these three inputs. The software includes a mechanism to recognize the importance of the above components.
The importance of Data Validity is that water audit data provide the basis upon which water utility managers and governing boards make decisions for investment or deferment of resources for the management of nonrevenue water. Accuracy of information promotes effectiveness in water loss management and revenue recovery in utility systems. Inaccuracy of information promotes misalignment of resources and utility system inefficiencies.
Figure 1. Screenshot of Example DV Scoring Criteria from Free Water Audit Software©.
Methodology
The WLCC Water Audit Software Subcommittee (WASS) requested Water Audit (audit) data from 26 utilities in the United States and Canada. Twenty-three utilities replied with data, and the WASS conducted validation interviews within a scheduled timeline for 21 of those utilities. Data was provided by the utilities for a recent

Assembling Validated Water Audit Data for Reliable Utility Benchmarking
3
fiscal year (2009 or newer) in the latest version of the software (Version 4.2, June 2010). Each utility also completed a Water System Practices Survey which provided system background information. A matrix of reviewers was developed to assign two committee members to each audit. A validation checklist was developed to guide review of the audits (Figure 2).
Figure 2. Excerpt from Validation Checklist.
Committee reviewers first evaluated the data inputs and their corresponding gradings, looking for abnormalities or inconsistencies in the data. Telephone interviews were then conducted, ranging from 45 minutes to 90 minutes, with one or more representatives from each utility to further discuss and scrutinize the data submitted. The primary focus of each telephone interview was scrutiny of data sources and grading values, with review of data inputs to determine consistency of reporting. Interviewers questioned the specific policies and practices of the water utility in order to gain a fuller understanding of how data are collected and what quality control measures are in place. Any resulting amendments to data values or their gradings were documented and incorporated into a revised water audit. Once this process was completed for a given audit, the audit was considered ‘validated’. Pre and post validation audits were physically assembled for comparison and analysis via a database compiler which was also developed by the WASS for the purpose of facilitating water audit data management. Out of the 26 audits submitted, 21 of them had been validated at the time of publication of this paper. Key performance indicators (KPIs) were statistically reviewed and trends analyzed. The basis for trend analysis included the following:
1. Total system size – KPIs were compared between systems with < and > 50,000 connections. 2. Climate_temperature – KPIs were compared between systems with < and > an average annual
temperature of 50°F. 3. Climate_rainfall – KPIs were compared between systems with < and > an average annual rainfall of 30”. 4. System footprint – KPIs were compared between systems with < and > a connection density of 60
connections / mile of main.
Results
A map of locations of utilities with validated water audits is provided below (Figure 3). The DV scores for the water utilities in the validated dataset ranged from 52 to 90, and are shown in Figure 4. In addition to the assessment of the composite DV scores for the water utilities, gradings for individual components can be compared. Gradings for the component ‘Volume from Own Sources’ ranged from 2 to 10 (Figure 5).

Assembling Validated Water Audit Data for Reliable Utility Benchmarking
4
Figure 3. Map of Validated Audits.
Figure 4. Validated DV Scores.

Assembling Validated Water Audit Data for Reliable Utility Benchmarking
5
Figure 5. Validated Gradings – Volume from Own Sources. (Systems with no value shown import their entire water supply)
Figure 6. Histogram of Validated Gradings - Volume from Own Sources.

Assembling Validated Water Audit Data for Reliable Utility Benchmarking
6
Utilities who import all water do not enter an input for ‘Volume from Own Sources’ and these appear as a “0” on Figure 5. A histogram of gradings for ‘Volume from Own Sources’ is presented as Figure 6. Table 1 presents overall data input statistics as they were originally submitted by the 26 participating Utilities.
Data Input Number Average Range
Volume from own sources 23 8.39 2 - 10
Master meter error adjustment 21 6.33 1 - 10
Water imported 15 8.33 2 - 10
Water exported 13 8.85 7 - 10
Billed metered 26 8.35 3 - 10
Billed unmetered 11 8.91 3 - 10
Unbilled metered 18 7.94 1 - 10
Unbilled unmetered 26 6.58 3 - 10
Unauthorized consumption 26 5.58 5 - 8
Customer metering inaccuracies 26 7.08 3 - 10
Systematic data handling errors 26 6.00 3 - 10
Length of mains 26 8.38 3 - 10
Number of active AND inactive service connections 26 8.38 5 - 10
Average length of customer service line 26 8.15 3 - 10
Average operating pressure 26 7.38 2 - 10
Total annual cost of operating water system 26 8.62 3 - 10
Customer retail unit cost (applied to Apparent Losses) 26 8.69 6 - 10
Variable production cost (applied to Real Losses) 26 8.31 4 - 10
Water Audit DV Score* 26 78.41 52 - 94 Table 1. Pre-Validation Data Inputs. (*The DV score is not the simple sum of all of the gradings in the water audit)
Table 2 presents pre- vs. post-validation data input statistics (21 of the above 26 audits were validated). Pre-Validation Post-Validation Change
Data Input Utilities (n)
Average Range Average Range
Volume from own sources 16 8.39 2 - 10 7.44 2 - 10 (0.95)
Master meter error adjustment 16 6.33 1 - 10 5.81 2 - 10 (0.52)
Water imported 12 8.33 2 - 10 7.75 2 - 10 (0.58)
Water exported 10 8.85 7 - 10 8.60 6 - 10 (0.25)
Billed metered 21 8.35 3 - 10 8.24 4 - 10 (0.11)
Billed unmetered 7 8.91 3 - 10 9.29 6 - 10 0.38
Unbilled metered 16 7.94 1 - 10 7.88 1 - 10 (0.07)
Unbilled unmetered 21 6.58 3 - 10 6.24 3 - 9 (0.34)
Unauthorized consumption 21 5.58 5 - 8 5.43 5 - 8 (0.15)
Customer metering inaccuracies 21 7.08 3 - 10 6.81 3 - 10 (0.27)
Systematic data handling errors 21 6.00 3 - 10 6.05 3 - 10 0.05
Length of mains 21 8.38 3 - 10 8.33 3 - 10 (0.05)
Number of active AND inactive service connections 21 8.38 5 - 10 7.95 5 - 10 (0.43)
Average length of customer service line 21 8.15 3 - 10 9.00 5 - 10 0.85
Average operating pressure 21 7.38 2 - 10 7.05 2 - 10 (0.34)
Total annual cost of operating water system 21 8.62 3 - 10 8.71 5 - 10 0.10
Customer retail unit cost (applied to Apparent Losses) 21 8.69 6 - 10 8.52 6 - 10 (0.17)
Variable production cost (applied to Real Losses) 21 8.31 4 - 10 8.05 4 - 10 (0.26)
Water Audit DV Score 21 78.41 52 - 94 74.97 52 - 90 (3.44) Table 2. Pre- vs. Post-Validation Data Inputs.

Assembling Validated Water Audit Data for Reliable Utility Benchmarking
7
Table 3 presents the calculated Key Performance Indicators and Cost Data from the overall validated dataset.
Key Performance Indicator # Average Range
NRW as a % by Volume 21 22.6% 6.8% - 45.5%
NRW as a % by Cost 21 10.0% 1.7% - 23.0%
NRW - Total Annual Cost (Million $) 21 5.81 0.04 - 42.97
Apparent Losses (gals/conn/day) 21 14.95 2.36 - 65.89
Real Losses (gals/conn/day) 18 63.32 17.07 - 149.71
Real Losses (gals/mile of main/day) 3 1,821.15 645.42 - 3,496.21
Infrastructure Leakage Index (ILI) 21 3.57 1.15 - 12.68
Water Audit Data Validity Score 21 74.97 52.28 - 89.72
Cost Data # Average Range
Annual operating cost (Million $) 21 51.22 1.36 - 224.43
Annual operating cost ($/1,000 gal of Water Supplied) 21 $ 3.32 $ 1.15 - $ 8.14
Customer retail unit cost ($/1,000 gal) 21 $ 4.57 $ 1.10 - $ 8.38
Variable production (or import) cost ($/1,000 gal) 21 $ 0.73 $ 0.18 - $ 2.16 Table 3. Calculated Key Performance Indicators - Overall.
A comparison of Key Performance Indicators and Cost Data based on system size is presented in Table 4.
# connections <50,000 # connections >50,000
Key Performance Indicator # Avg Range # Avg Range
NRW as a % by Volume 10 24.1% 12.2% - 45.5% 11 21.4% 6.8% - 39.6%
NRW as a % by Cost 10 9.3% 3.1% - 17.5% 11 10.6% 1.7% - 23.0%
Apparent Losses (gals/conn/day) 10 10.38 2.36 - 20.64 11 19.11 6.45 - 65.89
Real Losses (gals/conn/day) 7 58.71 26.08 - 149.71 11 66.24 17.07 - 124.36
Real Losses (gals/mile of main/day) 3 1,821 645 - 3,496 0 -
Infrastructure Leakage Index (ILI) 10 3.51 1.24 - 12.68 11 3.62 1.15 - 9.89
Water Audit Data Validity Score 10 70.44 52.28 - 84.79 11 79.08 61.92 - 89.72
Cost Data # Avg Range # Avg Range
Annual operating cost (Million $) 10 9.16 1.36 - 29.08 11 89.45 24.77 - 224.43
Annual operating cost ($/1,000 gal Water Supplied) 10 4.25 1.87 - 8.14 11 2.47 1.15 - 4.34
Customer retail unit cost ($/1,000 gal) 10 5.09 3.19 - 8.38 11 4.09 1.10 - 7.89
Variable production (or import) cost ($/1,000 gal) 10 0.98 0.33 - 2.16 11 0.49 0.18 - 1.80
Table 4. Comparison of Key Performance Indicators among systems with < and > 50,000 connections.
Assembling Validated Water Audit Data for Reliable Utility Benchmarking
8
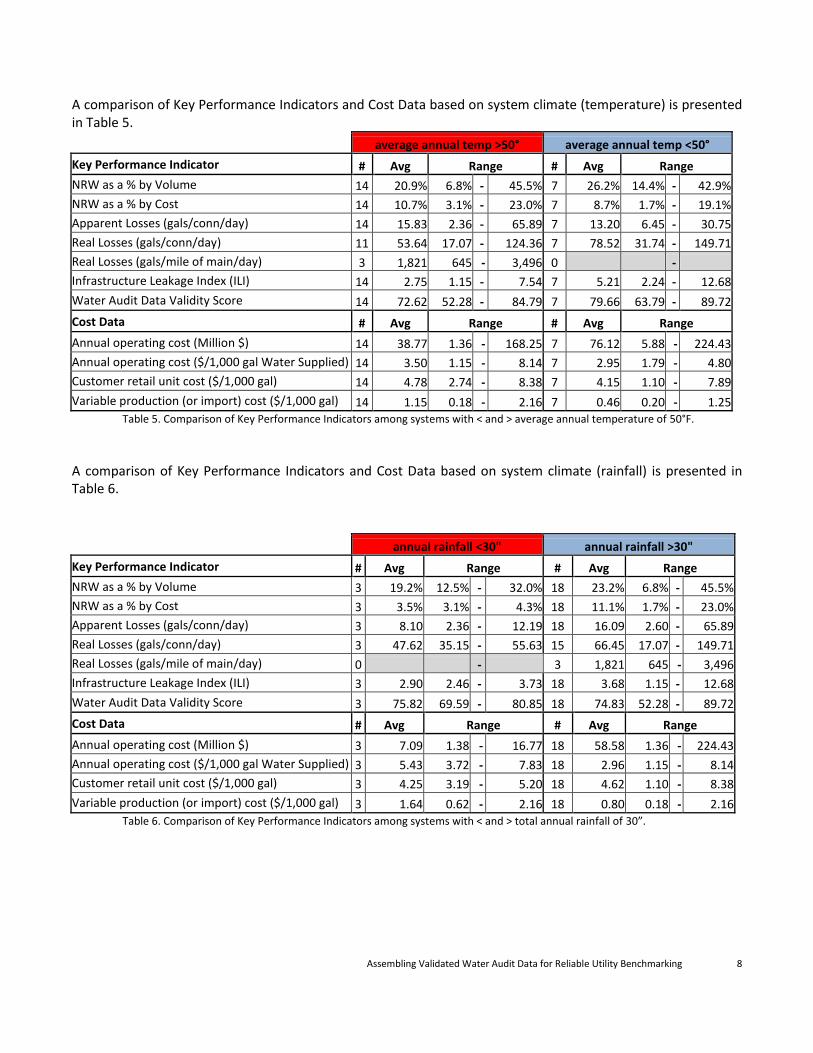
A comparison of Key Performance Indicators and Cost Data based on system climate (temperature) is presented in Table 5.
average annual temp >50° average annual temp <50°
Key Performance Indicator # Avg Range # Avg Range
NRW as a % by Volume 14 20.9% 6.8% - 45.5% 7 26.2% 14.4% - 42.9%
NRW as a % by Cost 14 10.7% 3.1% - 23.0% 7 8.7% 1.7% - 19.1%
Apparent Losses (gals/conn/day) 14 15.83 2.36 - 65.89 7 13.20 6.45 - 30.75
Real Losses (gals/conn/day) 11 53.64 17.07 - 124.36 7 78.52 31.74 - 149.71
Real Losses (gals/mile of main/day) 3 1,821 645 - 3,496 0 -
Infrastructure Leakage Index (ILI) 14 2.75 1.15 - 7.54 7 5.21 2.24 - 12.68
Water Audit Data Validity Score 14 72.62 52.28 - 84.79 7 79.66 63.79 - 89.72
Cost Data # Avg Range # Avg Range
Annual operating cost (Million $) 14 38.77 1.36 - 168.25 7 76.12 5.88 - 224.43
Annual operating cost ($/1,000 gal Water Supplied) 14 3.50 1.15 - 8.14 7 2.95 1.79 - 4.80
Customer retail unit cost ($/1,000 gal) 14 4.78 2.74 - 8.38 7 4.15 1.10 - 7.89
Variable production (or import) cost ($/1,000 gal) 14 1.15 0.18 - 2.16 7 0.46 0.20 - 1.25 Table 5. Comparison of Key Performance Indicators among systems with < and > average annual temperature of 50°F.
A comparison of Key Performance Indicators and Cost Data based on system climate (rainfall) is presented in Table 6.
annual rainfall <30" annual rainfall >30"
Key Performance Indicator # Avg Range # Avg Range
NRW as a % by Volume 3 19.2% 12.5% - 32.0% 18 23.2% 6.8% - 45.5%
NRW as a % by Cost 3 3.5% 3.1% - 4.3% 18 11.1% 1.7% - 23.0%
Apparent Losses (gals/conn/day) 3 8.10 2.36 - 12.19 18 16.09 2.60 - 65.89
Real Losses (gals/conn/day) 3 47.62 35.15 - 55.63 15 66.45 17.07 - 149.71
Real Losses (gals/mile of main/day) 0 - 3 1,821 645 - 3,496
Infrastructure Leakage Index (ILI) 3 2.90 2.46 - 3.73 18 3.68 1.15 - 12.68
Water Audit Data Validity Score 3 75.82 69.59 - 80.85 18 74.83 52.28 - 89.72
Cost Data # Avg Range # Avg Range
Annual operating cost (Million $) 3 7.09 1.38 - 16.77 18 58.58 1.36 - 224.43
Annual operating cost ($/1,000 gal Water Supplied) 3 5.43 3.72 - 7.83 18 2.96 1.15 - 8.14
Customer retail unit cost ($/1,000 gal) 3 4.25 3.19 - 5.20 18 4.62 1.10 - 8.38
Variable production (or import) cost ($/1,000 gal) 3 1.64 0.62 - 2.16 18 0.80 0.18 - 2.16 Table 6. Comparison of Key Performance Indicators among systems with < and > total annual rainfall of 30”.

Assembling Validated Water Audit Data for Reliable Utility Benchmarking
9
A comparison of Key Performance Indicators and Cost Data based on system connection density is presented in Table 7.
connection density <60/mile connection density >60/mile
Key Performance Indicator # Avg Range # Avg Range
NRW as a % by Volume 9 20.9% 6.8% - 45.5% 12 24.0% 12.5% - 42.9%
NRW as a % by Cost 9 11.0% 3.2% - 17.5% 12 9.3% 1.7% - 23.0%
Apparent Losses (gals/conn/day) 9 11.30 2.60 - 23.20 12 17.69 2.36 - 65.89
Real Losses (gals/conn/day) 6 50.09 17.07 - 124.36 12 69.93 29.93 - 149.71
Real Losses (gals/mile of main/day) 3 1,821 645 - 3,496 0 -
Infrastructure Leakage Index (ILI) 9 2.28 1.15 - 4.27 12 4.53 1.70 - 12.68
Water Audit Data Validity Score 9 69.98 52.28 - 84.79 12 78.71 63.79 - 89.72
Cost Data # Avg Range # Avg Range
Annual operating cost (Million $) 9 43.82 1.36 - 168.25 12 56.77 1.38 - 224.43
Annual operating cost ($/1,000 gal Water Supplied) 9 3.29 1.15 - 8.14 12 3.34 1.33 - 7.83
Customer retail unit cost ($/1,000 gal) 9 5.34 3.83 - 8.38 12 3.99 1.10 - 7.89
Variable production (or import) cost ($/1,000 gal) 9 0.99 0.23 - 2.16 12 0.88 0.18 - 2.16 Table 7. Comparison of Key Performance Indicators among systems with < and > connection density of 60 connections/mile.
A comparison of Cost Data based on systems who produce some or all of their water and systems who import all of their water is presented in Table 8.
part or all from own sources all from import
Cost Data # Avg Range # Avg Range
Annual operating cost (Million $) 16 57.03 1.36 - 224.43 5 2.64 1.38
- 84.64
Annual operating cost ($/1,000 gal Water Supplied) 16 2.76 1.15 - 4.80 5 5.10 1.76
- 8.14
Customer retail unit cost ($/1,000 gal) 16 4.46 1.10 - 7.89 5 4.92 3.30
- 8.38
Variable production (or import) cost ($/1,000 gal) 16 0.55 0.18 - 2.16 5 1.29 0.60
- 2.11 Table 8. Comparison of Cost Data between systems with part or all Water Supplied from “own sources” and those who import 100% of their water.
Discussion Analysis of DV Scores in Dataset The DV scores for the initial dataset largely fall into Levels III and IV of the water loss control planning guide within the AWWA Free Water Audit Software© (Figure 6); utilities with a DV score in the range of Level III and above represent those with at least basic data collection policies and procedures in place, and have sufficient validity to begin short- and long-term loss control efforts, set long-term reduction targets and utilize the relevant performance indicators.

Assembling Validated Water Audit Data for Reliable Utility Benchmarking
10
Figure 6. Planning Guide for Ranges of DV Scores.
Average gradings for ‘Volume from Own Sources’, ‘Billed Metered Consumption’, and ‘Customer Metering Inaccuracies’ for the initial data set were strong. This may stem from the fact that the utilities willing to participate in the initial phase of the project were inherently early adopters of the Water Audit method, and more likely to have already made headway on these three most important aspects of water utility operations. Those utilities in the dataset with lower gradings in these three categories, such as Asheboro and Belmont, reported during the audit interviews about specific improvements to finished-water metering and testing that will result in a significant increase in their grading for ‘Volume from Own Sources’, and accordingly the DV score in the coming year’s audit, which will be included in the next phase of the WLCC data initiative. On premise that a given utility’s DV score is at its minimum with the first audit, and improves with subsequent audits as the collection of data improves, there are two possible trends to reasonably anticipate with the updating and expansion of the initial dataset. The first is that utilities currently in the dataset, which provide a strong starting average DV score of 75, will only improve from there and push the overall dataset average up. The second trend that may be observed is that as more utilities join the dataset as first time audits, it may pull the overall DV average down.
Average gradings for ‘Customer Metering Inaccuracies’ were slightly below those of ‘Volume from Own Sources’ and ‘Billed Metered Consumption’, with over 1/3 of the participating utilities at a score of 5 or less for this category. This may be a reflection on the variability of meter testing and replacement programs among utilities in general. Some of the utilities in the dataset had regular testing or replacement programs, but few had both.

Assembling Validated Water Audit Data for Reliable Utility Benchmarking
11
Pre- vs Post-Validation DV Scores Twenty-one of the 26 submitted audits were validated at the time of publication of this paper. The remaining audits will be incorporated into the next phase of data initiative, which will be in 2012. It is the intention of the WLCC to update the audits currently in the database on an annual basis, as well as to add new utilities to the database each year. The greatest positive and negative adjustments to gradings were observed for ‘Volume from Own Sources’ (-0.95 points on average) and ‘Average Length of Service Line’ (+0.85 points on average). For ‘Volume from Own Sources’, the driving cause for utilities to overstate Data Validity for this input was a general misconception that accuracy testing for finished water meters need only test electronic registration. In many of the utilities, flow verification is not performed in conjunction with testing electronic registration. Both flow and electronics testing must be conducted in order to achieve the highest degree of confidence in finished water meter output, and therefore the highest grading for same. For ‘Average Length of Service Line’, the driving cause for utilities to under-grade this input was a general misconception of the basis for how this distance is measured. For systems who locate customer meters inside the customer’s building line (typically for colder climates), this distance is calculated from curb stop to meter. For the majority of the systems in the initial dataset, however, customer meters are typically located at the customer’s property line. The distance is therefore “0”, and a grading of 10 is assigned by the software. The averages of the utility DV scores saw a -3.44 point decrease after validation. The fact that there was any change indicates that general understanding of the Data Validity scoring process is still gaining traction, even among those utilities who are early-adopters. Trend Review Comparisons can be made among systems in the dataset, on the basis of certain operational and environmental conditions. These comparisons are discussed below, with the caveat that the initial validated dataset is comprised of only 21 utilities, and future expansion of this dataset will more soundly reveal trends among different utilities based on different factors. On the basis of system size, smaller systems (those with <50,000 connections) showed a slightly higher nonrevenue water (NRW) as a % by volume (24.1%) as compared to larger systems (21.4%). This is to be expected given smaller systems will have lower system inputs than larger systems. Smaller systems, however, showed a lower actual volume of loss, both real and apparent, on a normalized basis (gal/connection/day). This shows why percentages should not be used to measure water losses. The larger utilities generally have higher use per connection and so any loss percentage appears to be lower than a smaller system. The gallons per connection indicator appears to be much more reliable as a benchmark indicator. Interestingly, the average ILI for smaller and larger systems were very similar, or 3.51 and 3.62, respectively. Since this indicator is determined by the internal dynamics of the individual systems (connections, pressure and miles of main) it is not as susceptible to changes in usage characteristics. It can therefore be used across all systems (although it is not generally used for systems under 3,000 connections). Data Validity scores for smaller systems averaged about 70, as compared to about 79 for larger systems, which may reflect the trend of advanced data collection and management systems in larger utilities. On the basis of system climate, specifically temperature, warmer climates (those with average annual temperature of >50°F) showed a slightly lower NRW as a % by volume (20.9%) as compared to colder climates

Assembling Validated Water Audit Data for Reliable Utility Benchmarking
12
(26.2%). Apparent Losses were comparable between the two, but Real Losses were higher among colder climates (78.52 gal/connection/day) as compared to warmer climates (53.64 gal/connection/day). Likewise, the ILI for colder climates (5.21) was almost double that of warmer climates (2.75). This may be a reflection of harsher ambient ground conditions in colder climates and the propensity for system breaks and leaks. Also, utilities in warmer climates generally put greater emphasis on water conservation which often leads to more proactive leak detection and water loss reduction programs. On the basis of system climate, specifically rainfall, drier climates (those with total annual rainfall of <30”) showed a slightly lower NRW as a % by volume (19.2%) as compared to wetter climates (23.2%). Apparent Losses were about half the amount and Real Losses were about 2/3 the amount in drier climates as compared to wetter climates. All these data differences are probably due to the propensity of water conservation efforts in the drier climates and the need for water loss reductions to balance out the fact that these utilities are also asking their customers to reduce water usage. ILI and Data Validity scores were comparable between these two climates. On the basis of system footprint, specifically connection density, less dense systems (those with connection density of less than 60 connections/mile) showed slightly less NRW as % by volume (20.9%) as compared to more dense systems (24.0%). Since one of the main locations for real water losses are at the service connection, this appears logical. Normalized Apparent Losses (gal/connection/day) were about 57% higher and normalized Real Losses were about 40% higher in more dense systems, as compared to less dense systems. This is probably due to the same reasons as mentioned for the NRW percentage Less dense systems showed an ILI of about half (2.28) that of more dense systems (4.53). Data Validity score was about 12% higher in more dense systems. A review of cost data reveals, as expected, a notably higher average variable production cost ($1.29/1,000 gal) among systems who purchase (import) 100% of water supplied, versus those who produce some or all of their water supplied ($0.55/1,000 gal). Average customer retail unit cost between these 2 groups was comparable ($4.46 and $4.92/1,000 gal). Total annual operating cost, on basis of $/1000 gal of water supplied, was 85% higher among purchasing systems ($5.10) as compared to producing systems. The Cost of Bad Data The implications of poor Data Validity can be severe. When error exists in the data, any of the following three things happen. First, the amount of total Water Loss in the system becomes distorted, presenting the overall system inefficiency as either better or worse than actual conditions. Second, the segregation of total Water Loss between Real Loss (leakage) and Apparent Loss (paper) becomes distorted, resulting in the misdirection of resources for loss recovery. Third, the financial calculation of Nonrevenue Water, which is a function of total Water Loss and how it is segregated into Real and Apparent Loss, becomes distorted, either understating or overstating the business case for revenue recovery.
One example is a utility that underestimates its customer meter inaccuracies, causing an overestimation of Real Loss, driving them to spend undue resources on leak detection and repair. A converse example is a utility that overestimates its customer meter inaccuracies, causing them to underestimate Real Loss, driving them to spend undue resources on large scale meter changeout. A third example is a utility that does not use best-practices for Water Loss accounting. The utility in the third example remains unaware of its total Water Loss and how it is segregated into Real and Apparent Loss. This system bears the ongoing cost of producing more water than is necessary to operate the system, and the ongoing reduction in revenues that result from metering inaccuracies, billing system errors and unauthorized consumption.
Assembling Validated Water Audit Data for Reliable Utility Benchmarking
13
The implications of strong Data Validity are compelling. Beyond having good data upon which to make sound resource management decisions, strong Data Validity is essential when formulating the business case for raising utility rates, one that is both defensible and transparent. Valid data also allows for reliable performance comparisons with other water utilities and benchmarking to discern leading practices. Improving Data Validity Improving Data Validity must come by a combination of top-down (records analysis and calculations) and bottom-up (field measurement) efforts. Ultimately, the reliability of the top-down Water Audit is improved by incrementally incorporating bottom-up approaches to field-verify assumptions and estimations.1 As mentioned above, certain components exert a stronger effect that others in the water audit. Initial bottom-up efforts for improving Data Validity should be focused on these significant components. For ‘Volume from Own Sources’, focus should first be that all finished-water inputs to the distribution system are metered with meter readings digitally archived, and second that those meters are tested for accuracy of both flow measurement and electronic registration at least annually. Data should be reviewed regularly and adjusted to account for any data gaps that can occur if instruments are out of service for periods of time. For ‘Billed Metered Consumption’ and ‘Customer Metering Inaccuracies’, focus should be on the minimization of estimated billings, utilization of billing software that can be electronically queried for meter data, and the development of a routine testing program that dictates a meter replacement protocol based on cumulative consumption and meter age. Top-down efforts for improving Data Validity often require considerably less capital than bottom-up efforts. It begins with adoption of the IWA/AWWA Water Audit Method as the standard business practice for Water Loss accounting. As a business practice a formal audit must be conducted annually, but general data should also be compiled and reviewed on the same frequency as a utility’s billing cycle, typically on a monthly basis. The annual water audit and monthly review are essential and complementary. A monthly review can compare 12-month rolling average values of the ‘Water Supplied’ and ‘Authorized Consumption’ values to obtain the approximate monthly quantity of ‘Water Losses’. This process provides near real-time data for trending and analysis and faster implementation of corrective actions. An annual audit provides a comparison of performance to targets and benchmarks, a broader quality control review of the monthly data, an annual renewal of the Data Validity score, and an annual recalculation of variable production and retail cost data. In support of monthly data collection, clear written procedures should be established for which data is to be collected, how, and by whom. This must also include the development of clear written policies and procedures for safely supplying and estimating all unbilled, unmetered but authorized consumption, such as fire department consumption and operational flushing. Unmetered consumption estimates should be formulae based (typical flowrate x typical time), and should be bottom-up validated by sample metering to confirm typical flowrates. Many utilities find that as these best-practices become routine, they not only enjoy improved Data Validity, but see an inherent supply-side conservation that occurs due to increased utility staff awareness, which leads to reduction in total nonrevenue water. Because the inputs required to complete the IWA/AWWA water audit are derived from multiple functions within a utility’s operations, careful consideration and planning should be given to forming a multidisciplinary team to provide the necessary data and data validity scores. The water audit requires information from functions such as water distribution system operations and maintenance, customer metering, customer billing, infrastructure management, water rates setting and finance and may even require data to be obtained from other utilities in the case of imported and exported water. As no individual is likely to have full knowledge of all required inputs, a team approach is required. All audit team members should be familiar with the purpose of the audit and

Assembling Validated Water Audit Data for Reliable Utility Benchmarking
14
understand the context of the data being requested. This was reinforced by some of the validation interviews in the following examples: An input value for ‘variable production cost’ was initially graded at 10 (highest possible confidence) but was subsequently found to be incorrect (underestimated by a factor of three). In another example, the ‘imported water’ value was graded at 9, but could not be substantiated as the metering policies of the selling utility could not be verified with confidence. Both these examples demonstrate the need for a multidisciplinary team effort in the development of a water audit that can be trusted on to direct efforts to minimize water losses and maximize utility revenues.
Conclusions Ranges and averages for Data Validity as presented in this paper can be utilized for reference; however this is an initial dataset intended for annual updating. It is also expected that the initial dataset will be expanded with additional participating utilities. At least three years of data compilation and analysis will be needed to represent a robust data set for stronger benchmarking. More utilities will be invited to participate in future phases, but only to the extent that the reported utility data can be validated. Data Validity scores are generally strong in this initial dataset, but the dataset represents early-adopters so the effect of expanding the dataset on the average Data Validity Score may be difficult to predict. This paper is the second of two evaluating and analyzing this data. The first paper was presented at the AWWA ACE event in Washington DC in June, 2011. This data initiative is considered a pilot project that will be repeated annually to cultivate and grow the dataset, strengthen the basis for industry benchmarking, and continue to promote the AWWA best practices for water loss accounting and control. The AWWA Water Loss Control Committee would like to thank all the utilities who submitted water audits and participated in the validation interviews leading to the first published and validated dataset of water audit data in the IWA/AWWA format.

Assembling Validated Water Audit Data for Reliable Utility Benchmarking
15
References 1. Thornton, Julian et al. Manual of Water Supply Practices - M36, Water Audits and Loss Control
Programs. 2009. 3rd Edition. American Water Works Association, Denver CO. 2. Chastain-Howley, A., Goff, D., Kunkel, G., Lalonde, A., Sayers, D. AWWA Free Water Audit Software©,
version 4.2, June 2010.
Acknowledgements 1. Members of the WLCC Software Subcommittee: Andrew Chastain-Howley (chair), Mike Cobb, David
Goff, Will Jernigan, George Kunkel, Alain Lalonde, David Sayers 2. Participating Utilities & Staff Contacts:
a. City of Asheboro, NC; Michael Rhoney b. Austin Water Utility, TX; Dan Strub c. City of Belmont, NC; Chuck Flowers d. Birmingham Water Works Board, AL; Ray Sloan e. City of Calgary, Alberta, Canada; Chris Huston f. Cherokee County Water & Sewer Authority, GA; Clint Blackwell g. Greater Cincinnati Water Works, OH; Mark Ginty h. Cobb County Water System, GA; Kathy Nguyen i. Dalton Utilities, GA; David Oxford j. DC Water & Sewer Authority; Syad Khalil k. Golden State Water Company – Clearlake, CA; John Turner l. Golden State Water Company – Ojai, CA; John Turner m. Halifax Regional Water Commission, Nova Scotia, Canada; Graham McDonald n. Indianapolis Water, IN; VWI Asset Management o. Louisville Water Company, KY; Tonya Taylor p. Orange County Utilities Department, FL; Bob Dudas q. Region of Peel, Ontario; Mike Bechard r. Philadelphia Water Department, PA; George Kunkel s. Pennsylvania American Water - Pittsburgh, Pittsburgh, PA; Anthony Emanuelle t. City of Rio Rancho, NM; Marian Wrage u. San Antonio Water System, TX; Elliot Fry v. Washington County Service Authority, VA; Robbie Cornett w. City of Wauwatosa Water Utility, WI; James Wojcehowicz x. City of Wilmington, DE; Colleen Arnold y. Water & Wastewater Authority of Wilson County, TN; Chris Leauber z. City of Yreka, CA; Rob Taylor