Embed Size (px)
Citation preview
SQL access and visualization of mainframe data within IBM technologies
Data Virtualization and Visualization
Rob Parker [email protected]
AgendaVirtualizing VSAM, DBMS, IDMS, IMS and other data sources
Accessing virtualized mainframe data via IBM Db2 technologies
SQL Access to Mainframe data
Review Log Analysis and DevOps dashboards
Dashboard Auto generation
Considerations for virtualization
• Why move the data off the mainframe or restructure it?
• What does it cost for MSU? z13 or z14 (Tailored fit pricing)
• Are there security risks? Does the DBA own the security credentials once it’s moved? Who’s ensuring that the data is secure?
• No matter how fast the data is collected and moved, it will never be as fast as real-time, in place virtual access.
SQL Access to Mainframe data using IBM Db2 technologies• Mainframe-resident data virtualization happens in real-time and data remains
under z/OS control.
• Utilizing server-side processing and z Systems Integrated Information Processors (zIIP up to 99%) making the queries cheaper to run (Minimizing MSU).
• Only one set of credentials required.
• Virtualization of ADABAS, DBMS, IDMS, IMS, MQ, Sequential, VSAM and zFS• Only stores the metadata definitions and retrieves the data on demand.• On the z System, the data is loaded into memory and then the results are
returned to the client.• Multiple versions of the same table across different Db2’s in parallel.
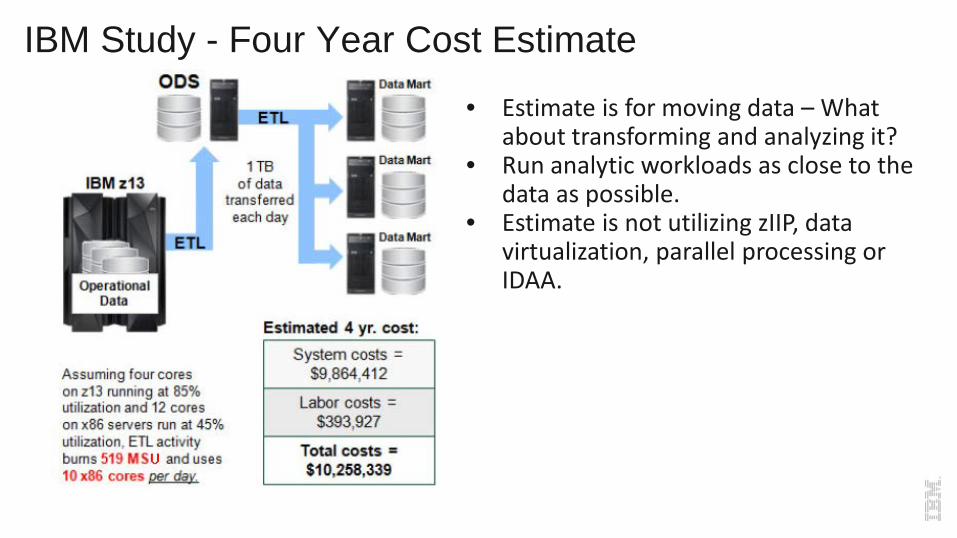
IBM Study - Four Year Cost Estimate
• Estimate is for moving data – What about transforming and analyzing it?
• Run analytic workloads as close to the data as possible.
• Estimate is not utilizing zIIP, data virtualization, parallel processing or IDAA.
Adabas
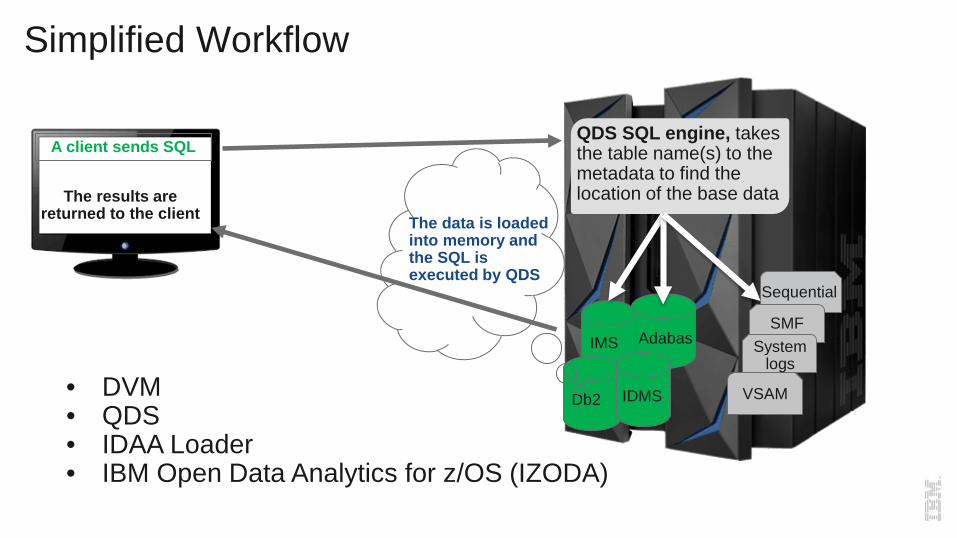
Simplified Workflow
A client sends SQL
The results are returned to the client
QDS SQL engine, takes the table name(s) to the metadata to find the location of the base data
Db2
IMS
VSAM
Sequential
IDMS
SMFSystem
logs
The data is loaded into memory and the SQL is executed by QDS
• DVM• QDS• IDAA Loader• IBM Open Data Analytics for z/OS (IZODA)
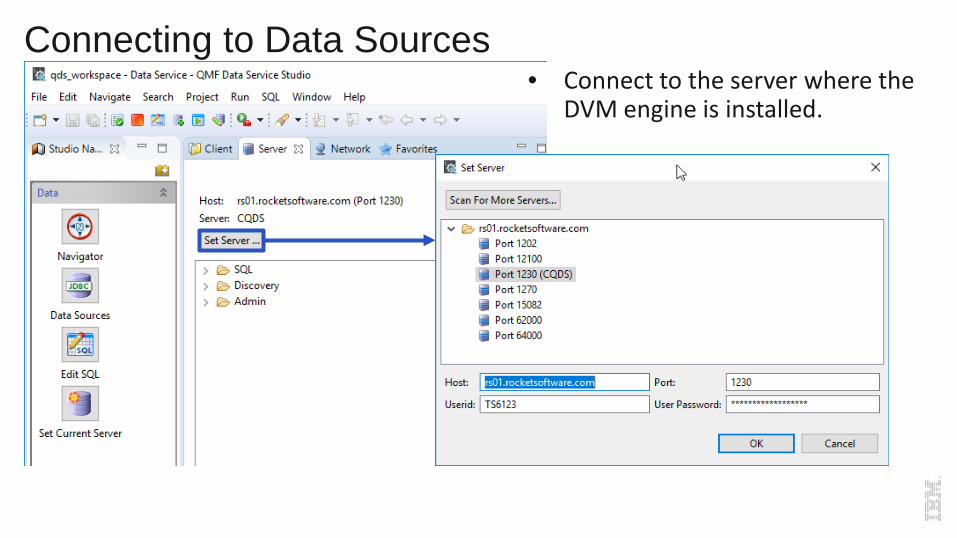
Connecting to Data Sources• Connect to the server where the
DVM engine is installed.
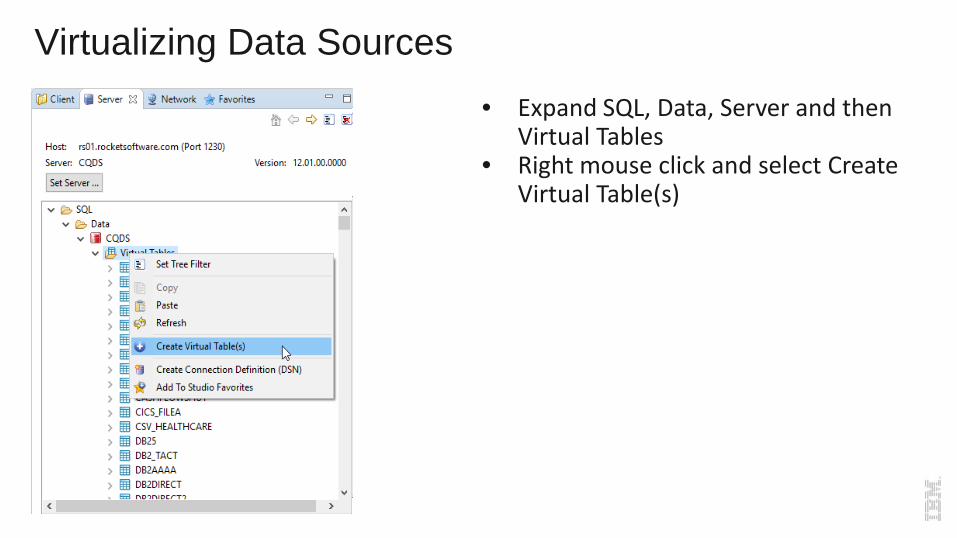
Virtualizing Data Sources• Expand SQL, Data, Server and then
Virtual Tables• Right mouse click and select Create
Virtual Table(s)
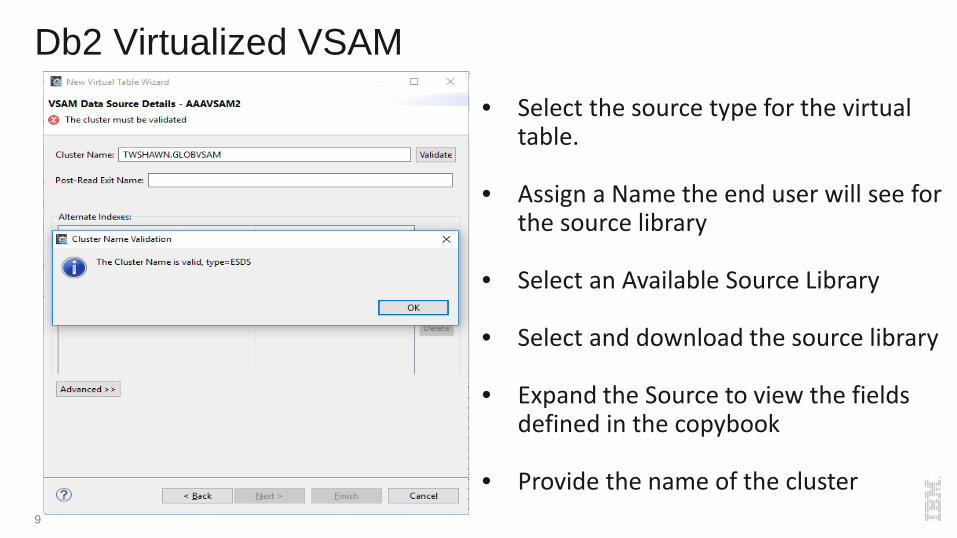
Db2 Virtualized VSAM
9
• Select the source type for the virtual table.
• Assign a Name the end user will see for the source library
• Select an Available Source Library
• Select and download the source library
• Expand the Source to view the fields defined in the copybook
• Provide the name of the cluster
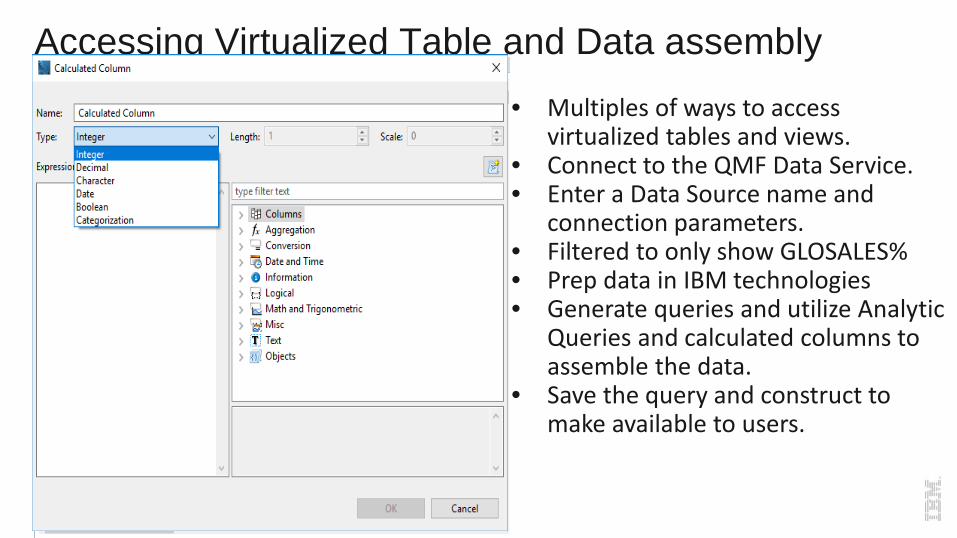
Accessing Virtualized Table and Data assembly
10
SO Measurements
• Multiples of ways to access virtualized tables and views.
• Connect to the QMF Data Service.• Enter a Data Source name and
connection parameters.• Filtered to only show GLOSALES%• Prep data in IBM technologies• Generate queries and utilize Analytic
Queries and calculated columns to assemble the data.
• Save the query and construct to make available to users.
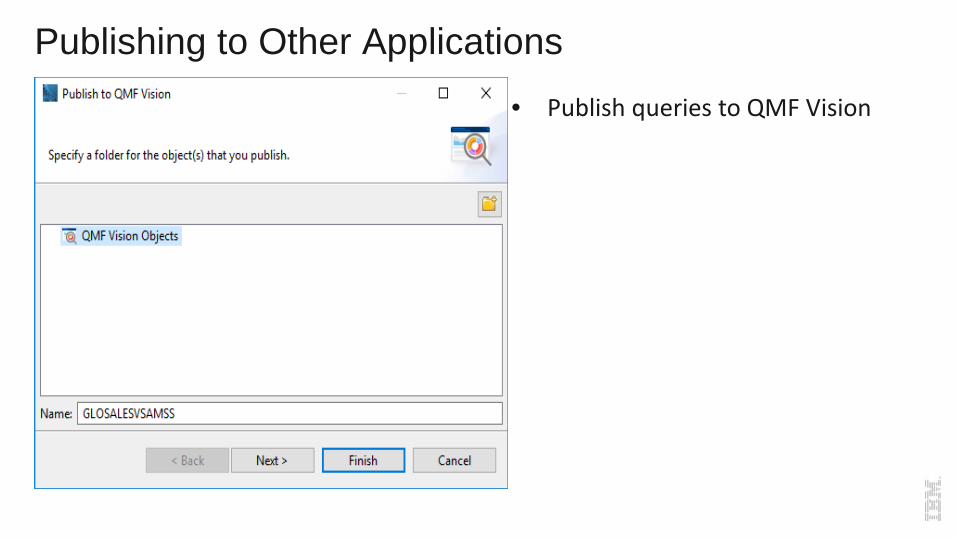
Publishing to Other Applications• Publish queries to QMF Vision
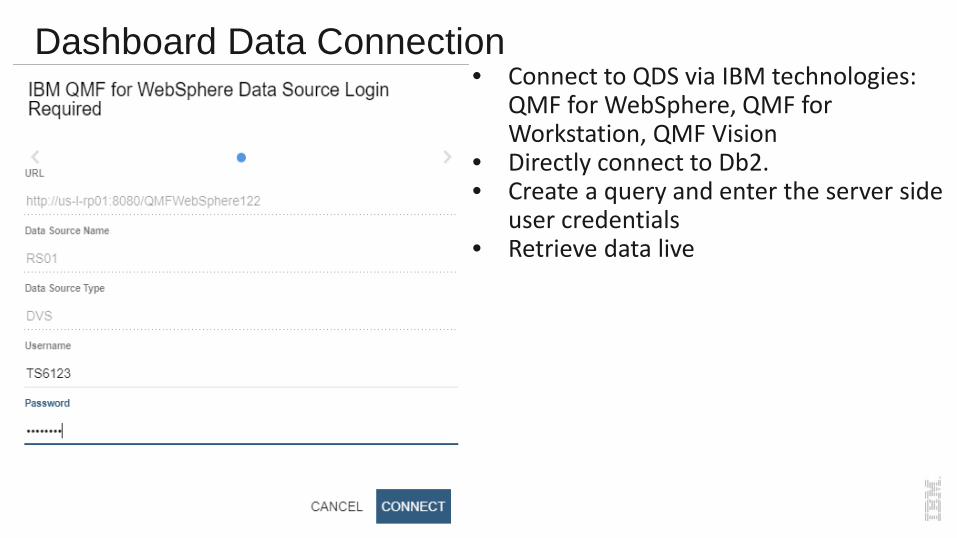
Dashboard Data Connection• Connect to QDS via IBM technologies:
QMF for WebSphere, QMF for Workstation, QMF Vision
• Directly connect to Db2.• Create a query and enter the server side
user credentials• Retrieve data live

Viewing the virtualized data set
13
Dashboards for DBA’s
14
• Data for the Lines of Business are not of interest. Why do I want to see Profit or Sales of product?
• I want to see what’s occurring on my server, what process are happening and utilization.
• How is my system performing? Inserts, updates, deletes and commits per second.
• How are log files being consumed?
• What dataset is important to capture?
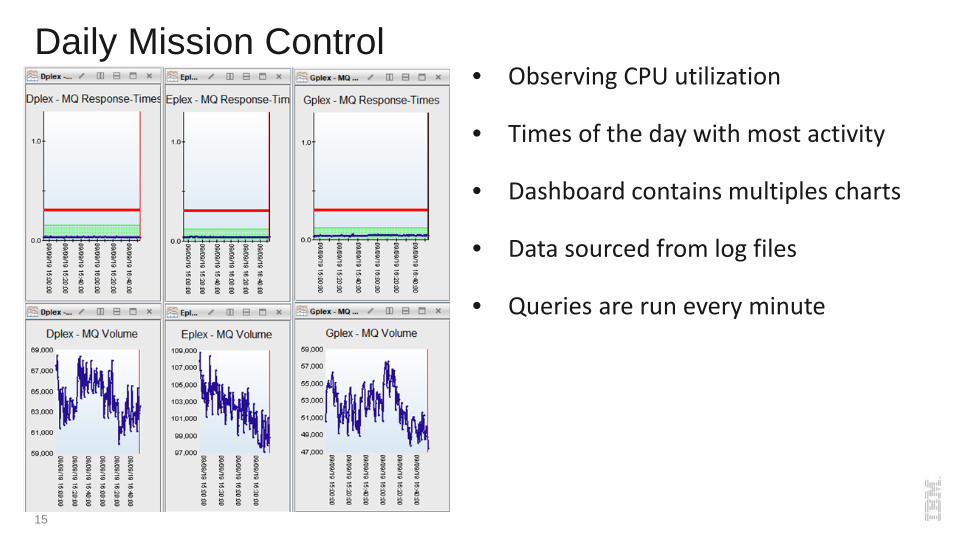
Daily Mission Control
15
• Observing CPU utilization
• Times of the day with most activity
• Dashboard contains multiples charts
• Data sourced from log files
• Queries are run every minute
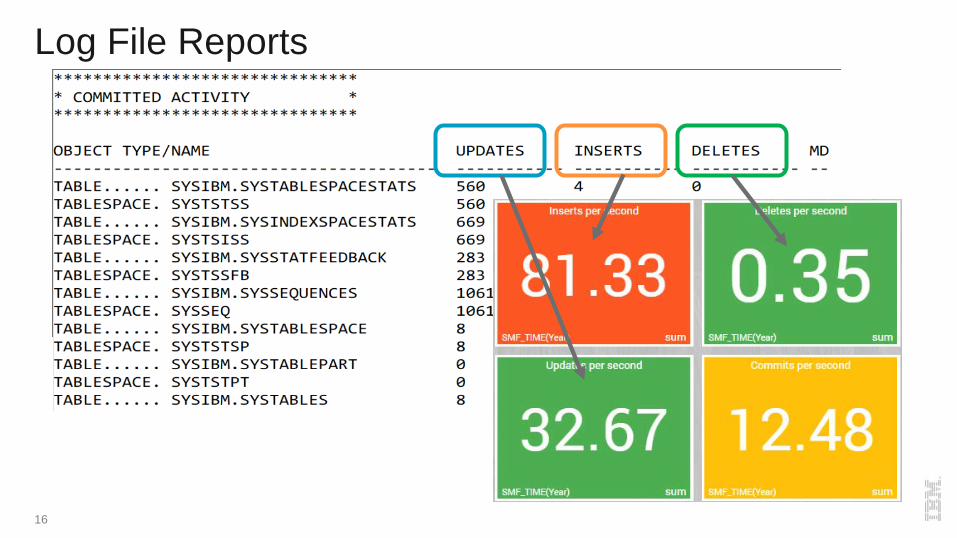
Log File Reports
16
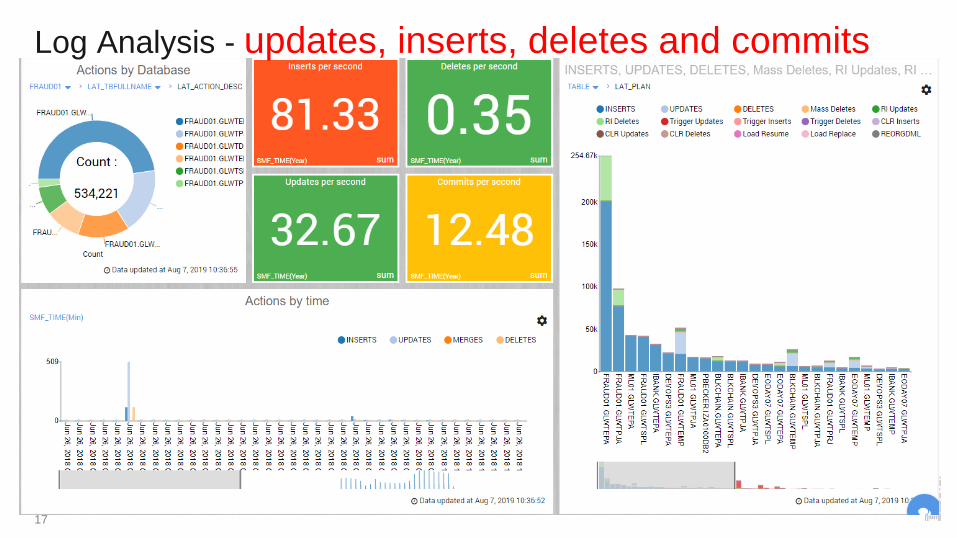
Log Analysis - updates, inserts, deletes and commits
17
18
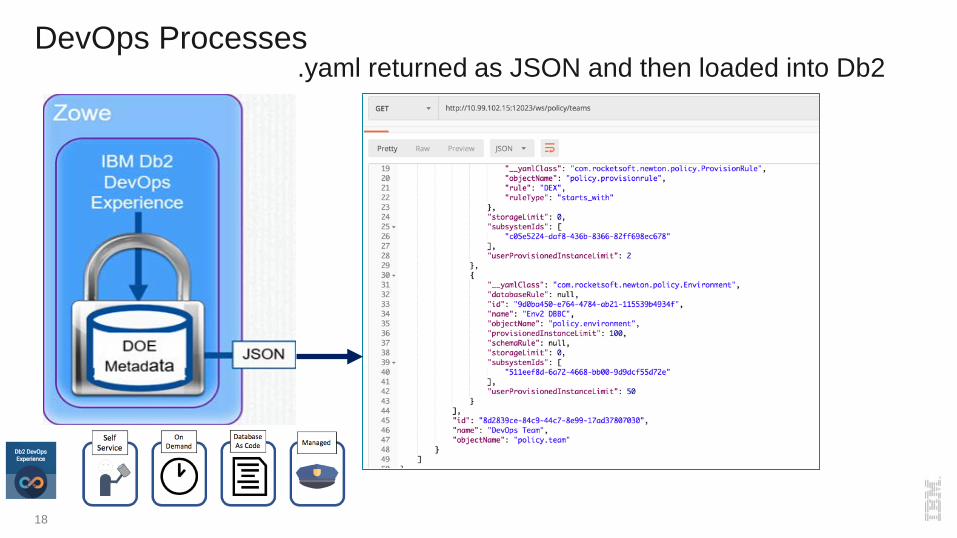
DevOps Processes .yaml returned as JSON and then loaded into Db2
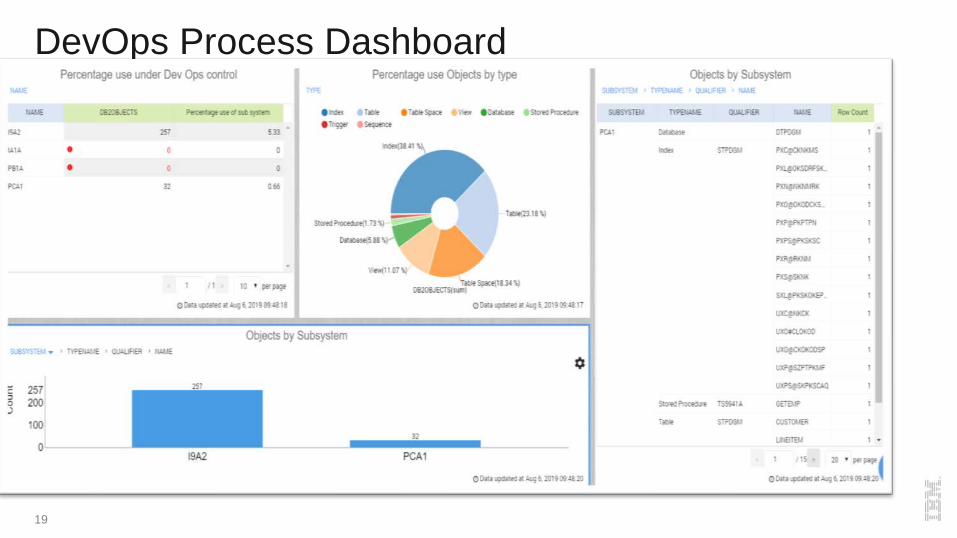
DevOps Process Dashboard
19
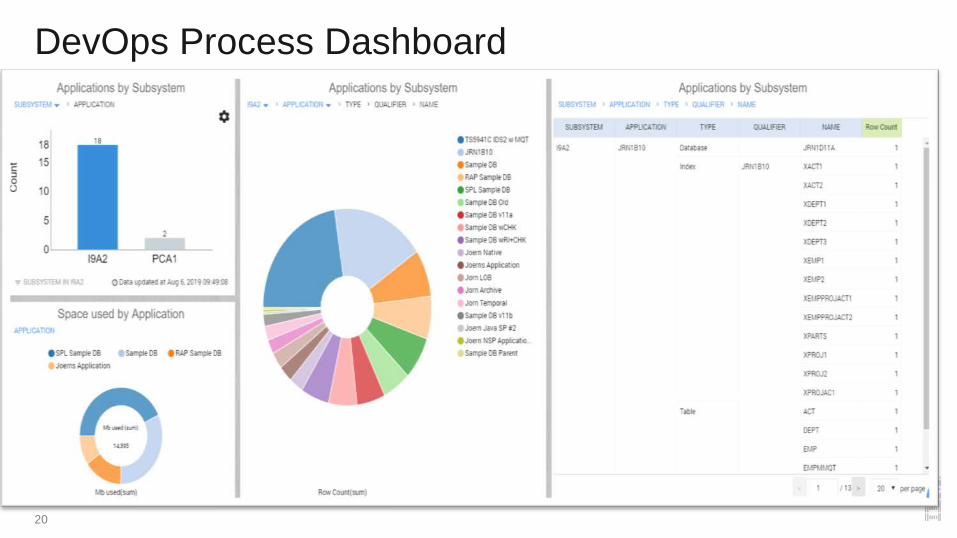
DevOps Process Dashboard
20
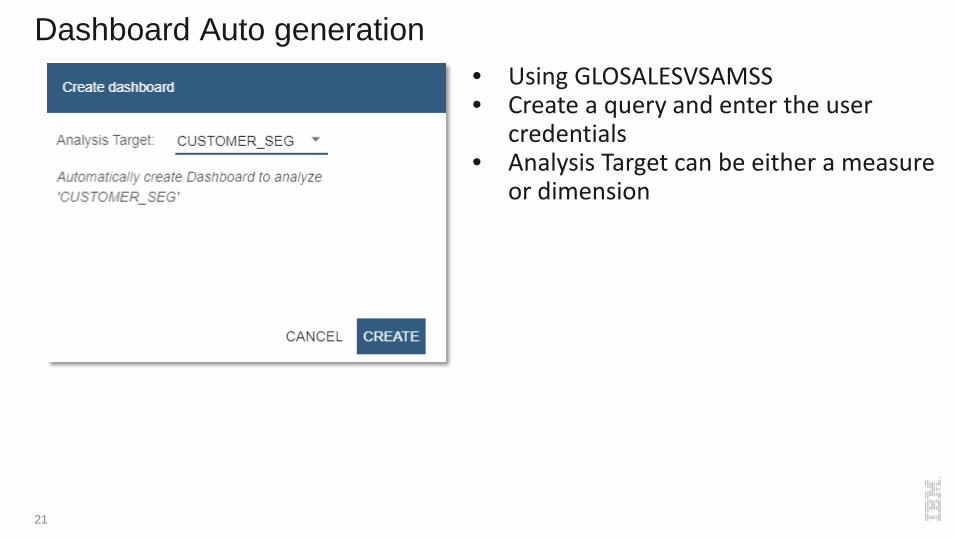
Dashboard Auto generation
21
• Using GLOSALESVSAMSS• Create a query and enter the user
credentials• Analysis Target can be either a measure
or dimension
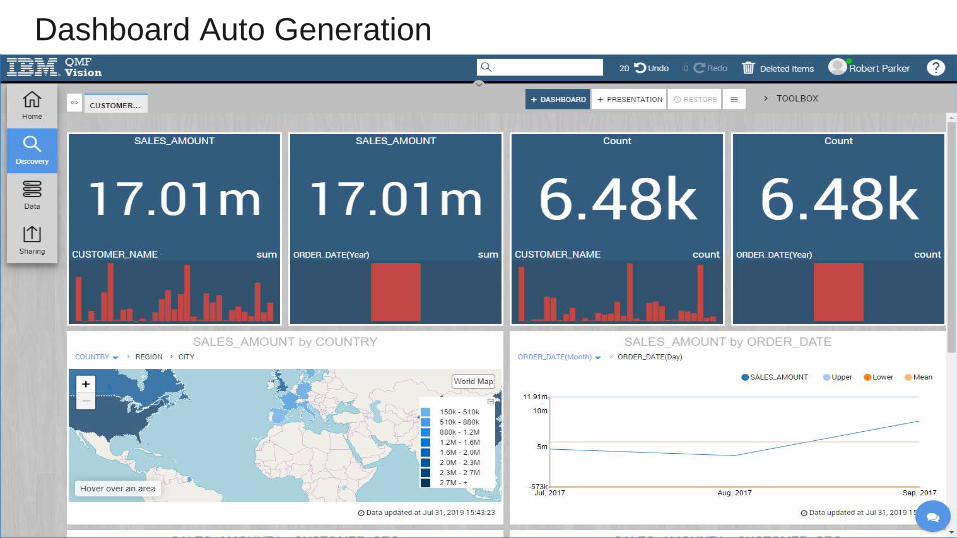
Dashboard Auto Generation
22
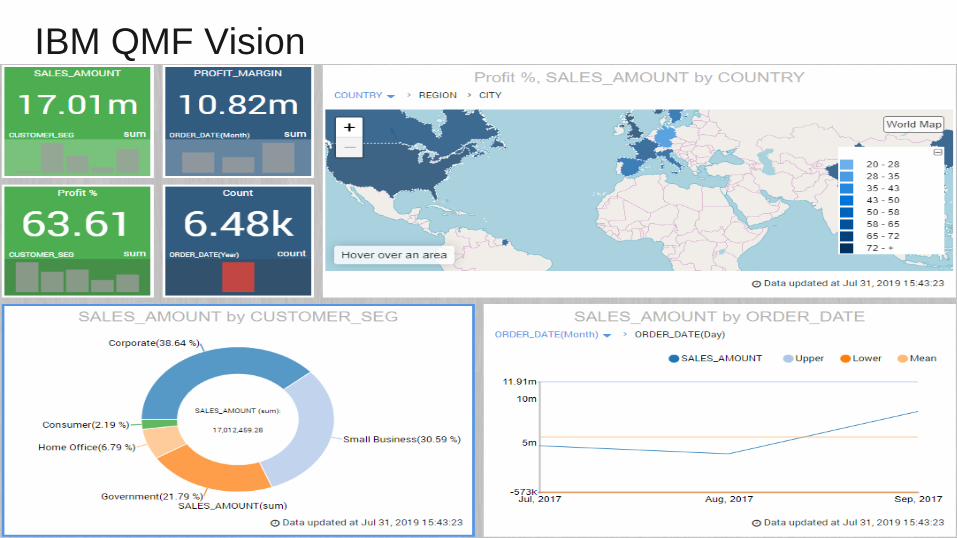
IBM QMF Vision
23
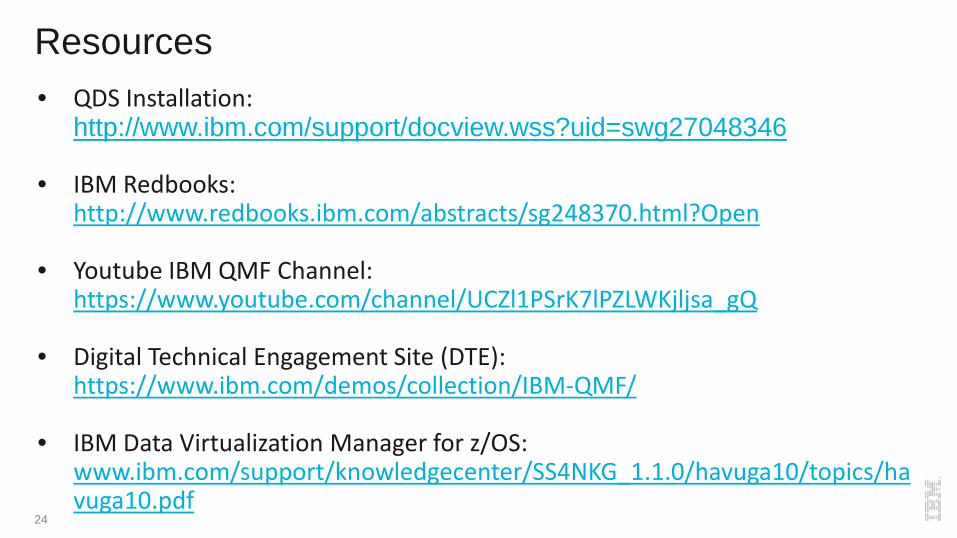
Resources
24
• QDS Installation: http://www.ibm.com/support/docview.wss?uid=swg27048346
• IBM Redbooks: http://www.redbooks.ibm.com/abstracts/sg248370.html?Open
• Youtube IBM QMF Channel: https://www.youtube.com/channel/UCZl1PSrK7lPZLWKjljsa_gQ
• Digital Technical Engagement Site (DTE): https://www.ibm.com/demos/collection/IBM-QMF/
• IBM Data Virtualization Manager for z/OS: www.ibm.com/support/knowledgecenter/SS4NKG_1.1.0/havuga10/topics/havuga10.pdf
25