Embed Size (px)
Citation preview
DATA WAREHOUSING ANDDATA MINING
S. SudarshanKrithi Ramamritham
IIT Bombay
[email protected]@cse.iitb.ernet.in
2
Course OverviewThe course: what and
how
0. IntroductionI. Data WarehousingII. Decision Support and
OLAPIII. Data MiningIV. Looking Ahead
Demos and Labs
3
0. IntroductionData Warehousing,
OLAP and data mining: what and why (now)?
Relation to OLTPA case study
demos, labs
4
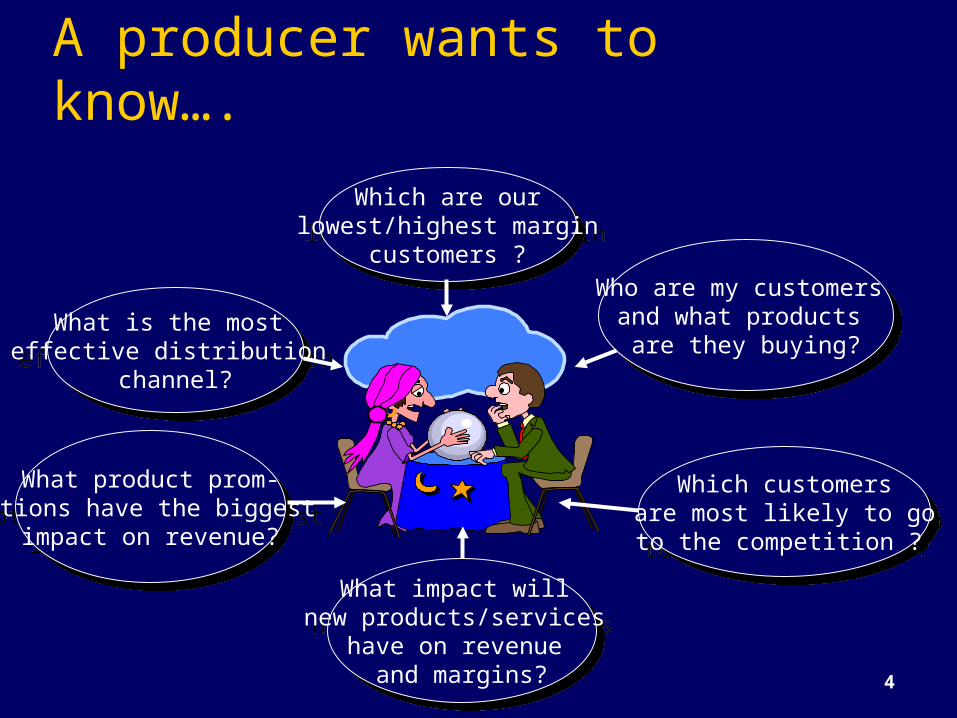
Which are our lowest/highest margin
customers ?Who are my customers
and what products are they buying?
Which customers are most likely to go to the competition ?
What impact will new products/services
have on revenue and margins?
What product prom--otions have the biggest
impact on revenue?
What is the most effective distribution
channel?
A producer wants to know….
5
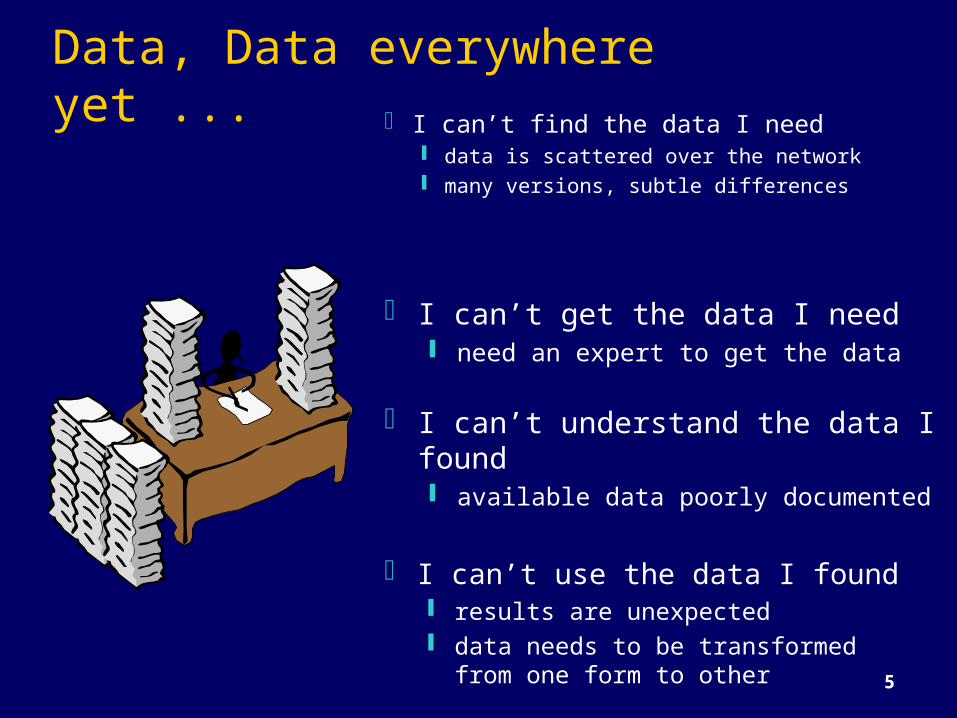
Data, Data everywhereyet ... I can’t find the data I need
data is scattered over the network many versions, subtle differences
I can’t get the data I need need an expert to get the data
I can’t understand the data I found available data poorly documented
I can’t use the data I found results are unexpected data needs to be transformed
from one form to other
6
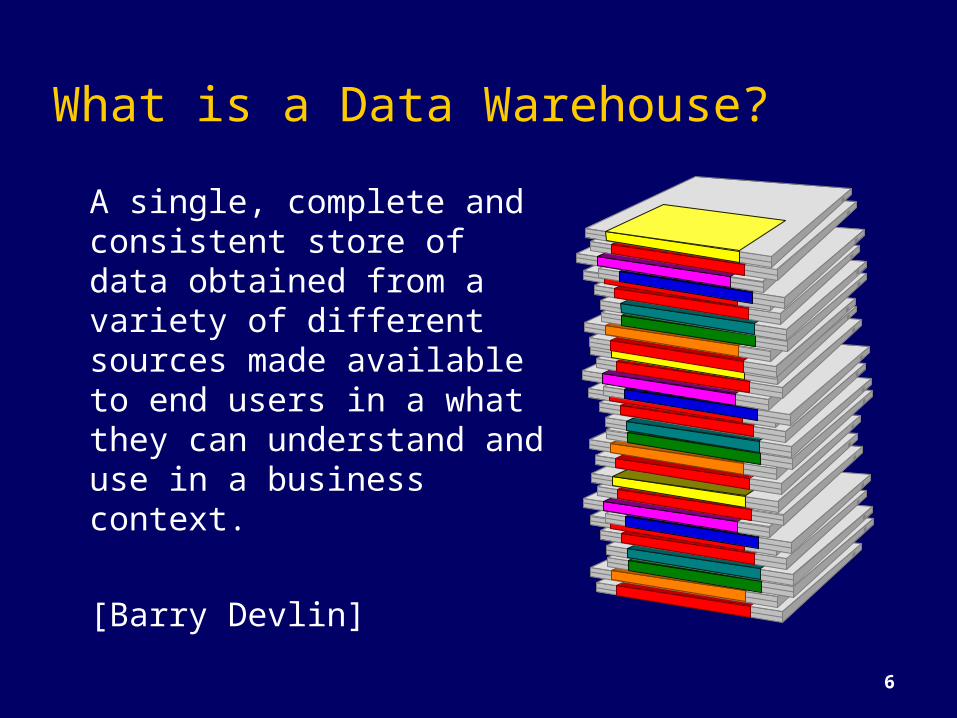
What is a Data Warehouse? A single, complete and
consistent store of data obtained from a variety of different sources made available to end users in a what they can understand and use in a business context.
[Barry Devlin]
7
What are the users saying...Data should be integrated
across the enterpriseSummary data has a real
value to the organizationHistorical data holds the
key to understanding data over time
What-if capabilities are required
8
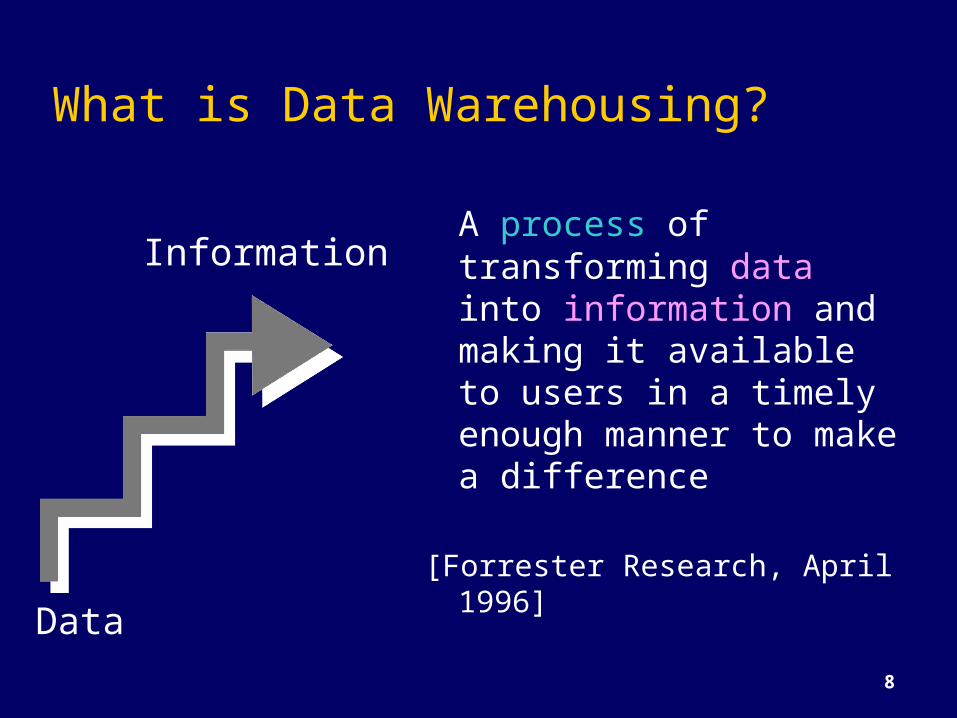
What is Data Warehousing?
A process of transforming data into information and making it available to users in a timely enough manner to make a difference
[Forrester Research, April 1996]
Data
Information
9
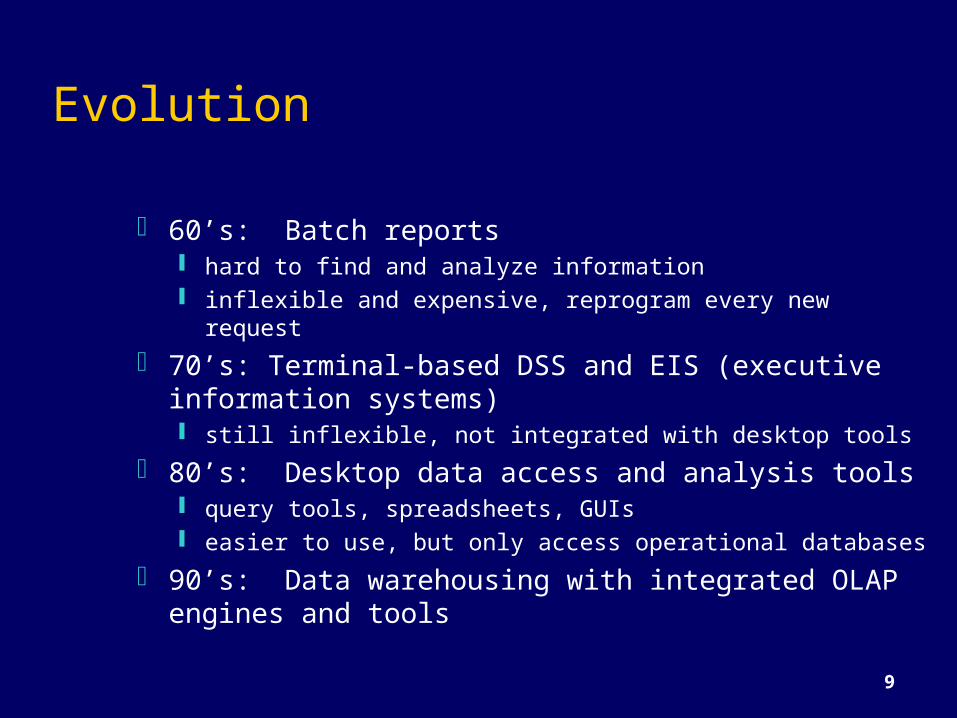
Evolution
60’s: Batch reports hard to find and analyze information inflexible and expensive, reprogram every new request
70’s: Terminal-based DSS and EIS (executive information systems) still inflexible, not integrated with desktop tools
80’s: Desktop data access and analysis tools query tools, spreadsheets, GUIs easier to use, but only access operational databases
90’s: Data warehousing with integrated OLAP engines and tools
10
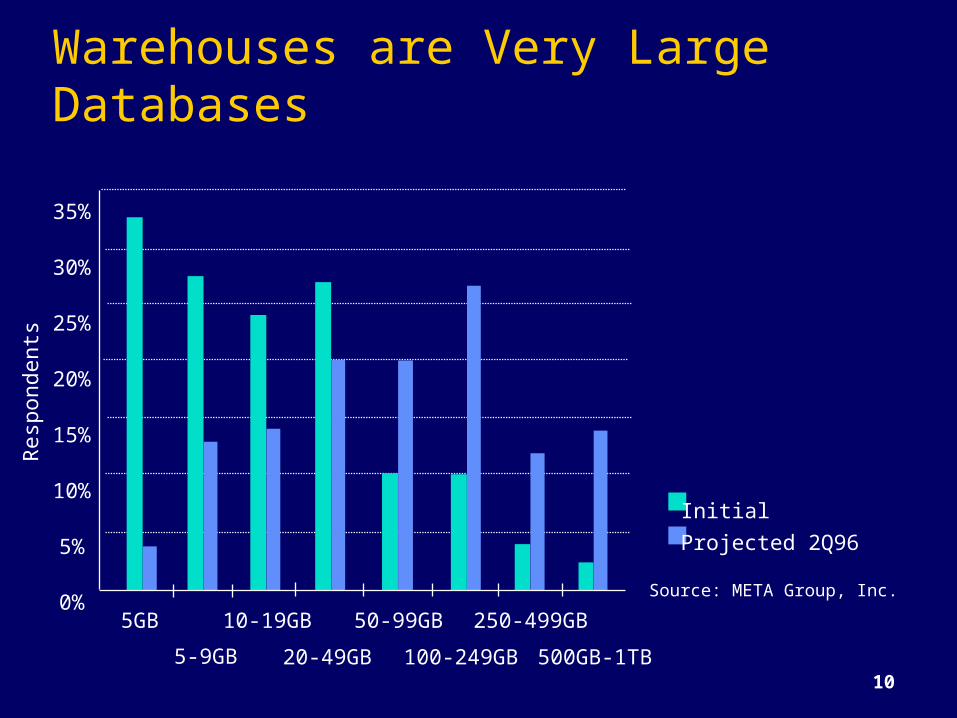
Warehouses are Very Large Databases35%
30%
25%
20%
15%
10%
5%
0%5GB
5-9GB
10-19GB 50-99GB 250-499GB
20-49GB 100-249GB 500GB-1TB
InitialProjected 2Q96
Source: META Group, Inc.
Res
pond
ents
11
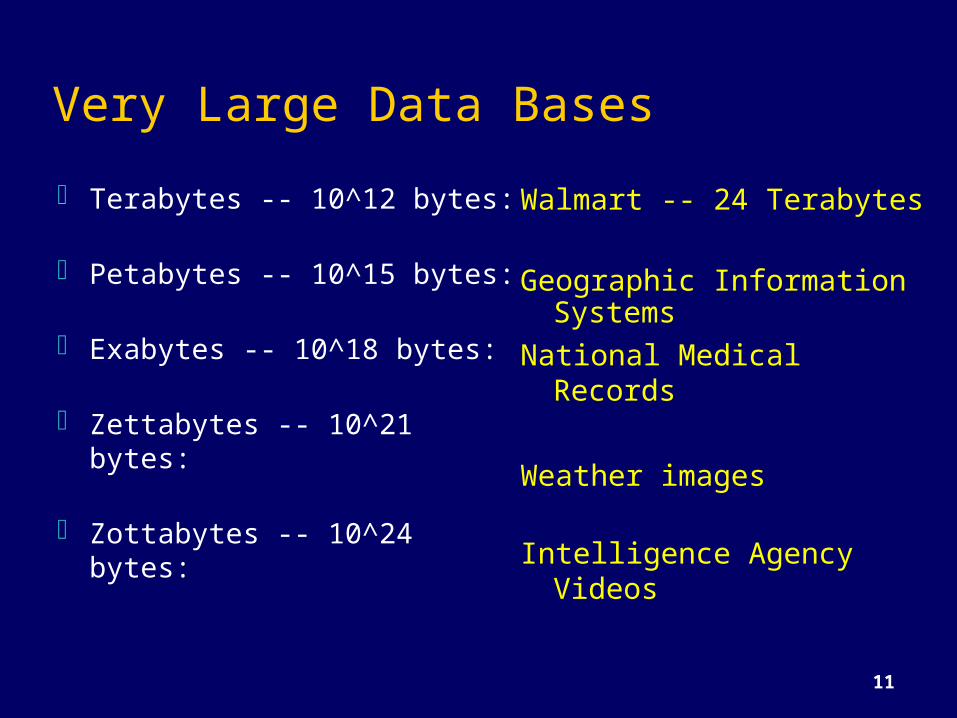
Very Large Data Bases Terabytes -- 10^12 bytes:
Petabytes -- 10^15 bytes:
Exabytes -- 10^18 bytes:
Zettabytes -- 10^21 bytes:
Zottabytes -- 10^24 bytes:
Walmart -- 24 Terabytes
Geographic Information Systems
National Medical Records
Weather images
Intelligence Agency Videos
12
Data Warehousing -- It is a process
Technique for assembling and managing data from various sources for the purpose of answering business questions. Thus making decisions that were not previous possible
A decision support database maintained separately from the organization’s operational database
13
Data WarehouseA data warehouse is a
subject-oriented integrated time-varying non-volatile
collection of data that is used primarily in organizational decision making.
-- Bill Inmon, Building the Data Warehouse 1996
14
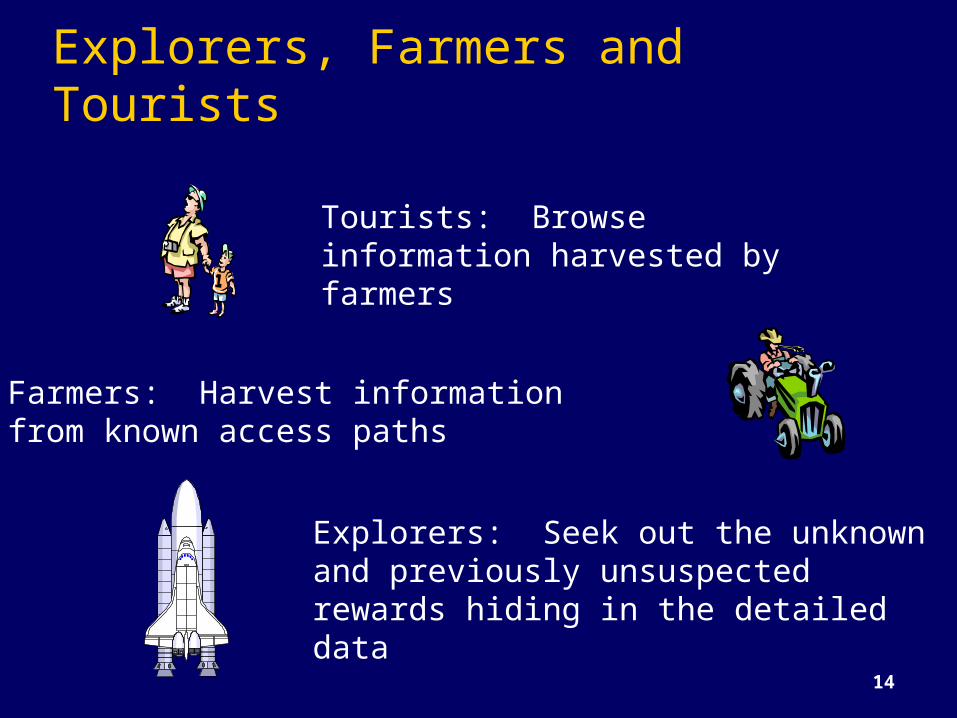
Explorers, Farmers and Tourists
Explorers: Seek out the unknown and previously unsuspected rewards hiding in the detailed data
Farmers: Harvest informationfrom known access paths
Tourists: Browse information harvested by farmers

15
Data Warehouse Architecture
Data Warehouse Engine
Optimized Loader
ExtractionCleansing
AnalyzeQuery
Metadata Repository
RelationalDatabases
LegacyData
Purchased Data
ERPSystems
16
Data Warehouse for Decision Support & OLAPPutting Information technology to help the
knowledge worker make faster and better decisions Which of my customers are most likely to go to
the competition? What product promotions have the biggest
impact on revenue? How did the share price of software companies
correlate with profits over last 10 years?
17
Decision SupportUsed to manage and control businessData is historical or point-in-timeOptimized for inquiry rather than updateUse of the system is loosely defined and
can be ad-hocUsed by managers and end-users to
understand the business and make judgements
18
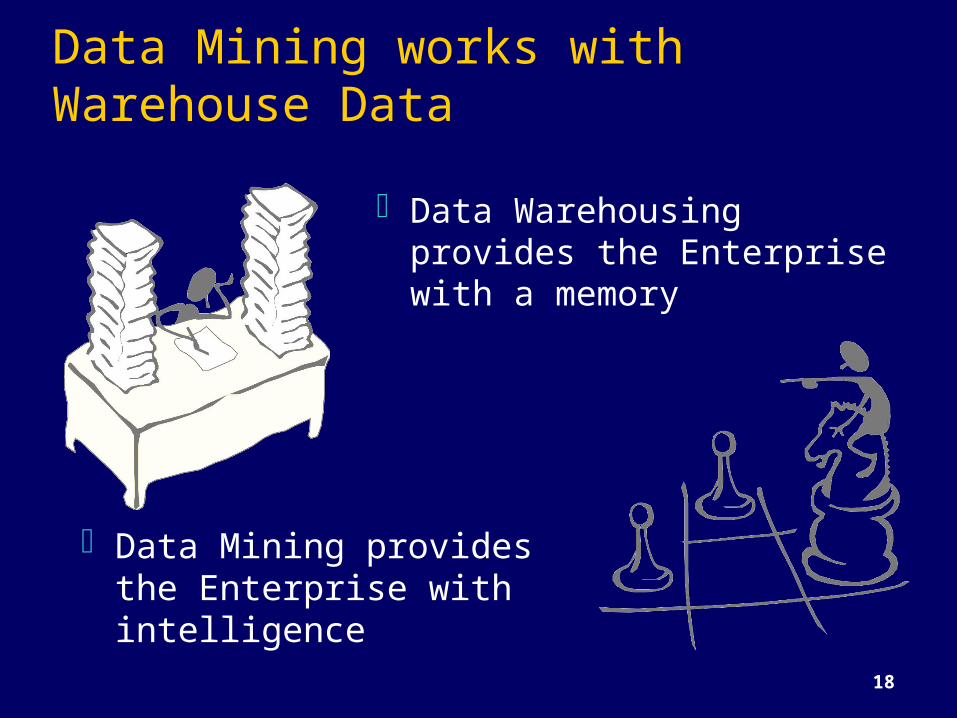
Data Mining works with Warehouse Data
Data Warehousing provides the Enterprise with a memory
Data Mining provides the Enterprise with intelligence
19
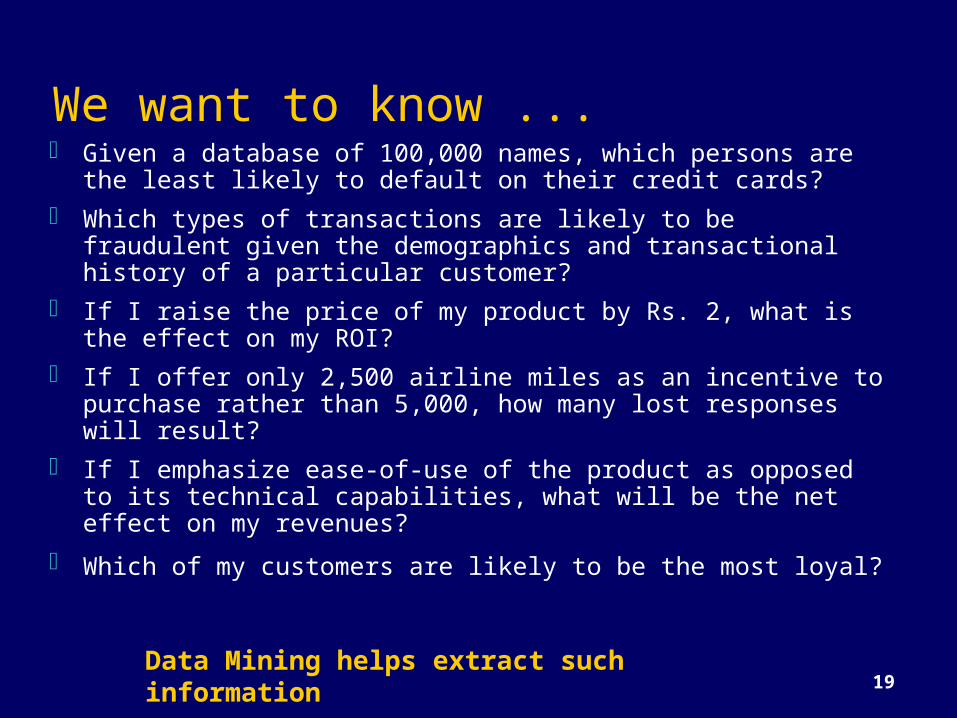
We want to know ... Given a database of 100,000 names, which persons are the
least likely to default on their credit cards? Which types of transactions are likely to be fraudulent
given the demographics and transactional history of a particular customer?
If I raise the price of my product by Rs. 2, what is the effect on my ROI?
If I offer only 2,500 airline miles as an incentive to purchase rather than 5,000, how many lost responses will result?
If I emphasize ease-of-use of the product as opposed to its technical capabilities, what will be the net effect on my revenues?
Which of my customers are likely to be the most loyal?
Data Mining helps extract such information
20
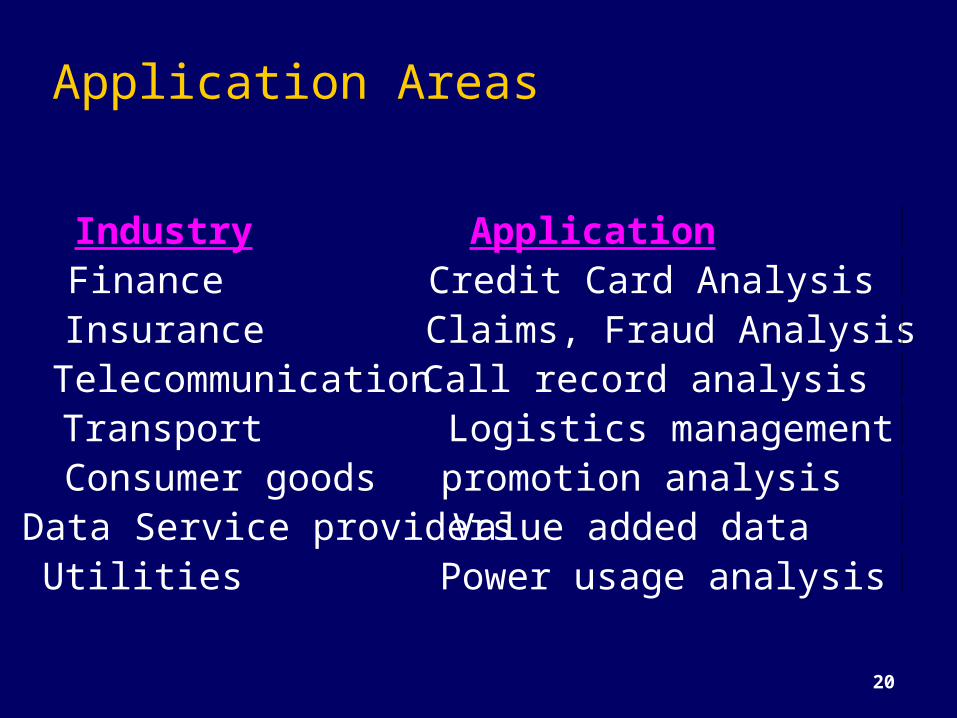
Application Areas
Industry ApplicationFinance Credit Card AnalysisInsurance Claims, Fraud Analysis
Telecommunication Call record analysisTransport Logistics managementConsumer goods promotion analysisData Service providersValue added dataUtilities Power usage analysis
21
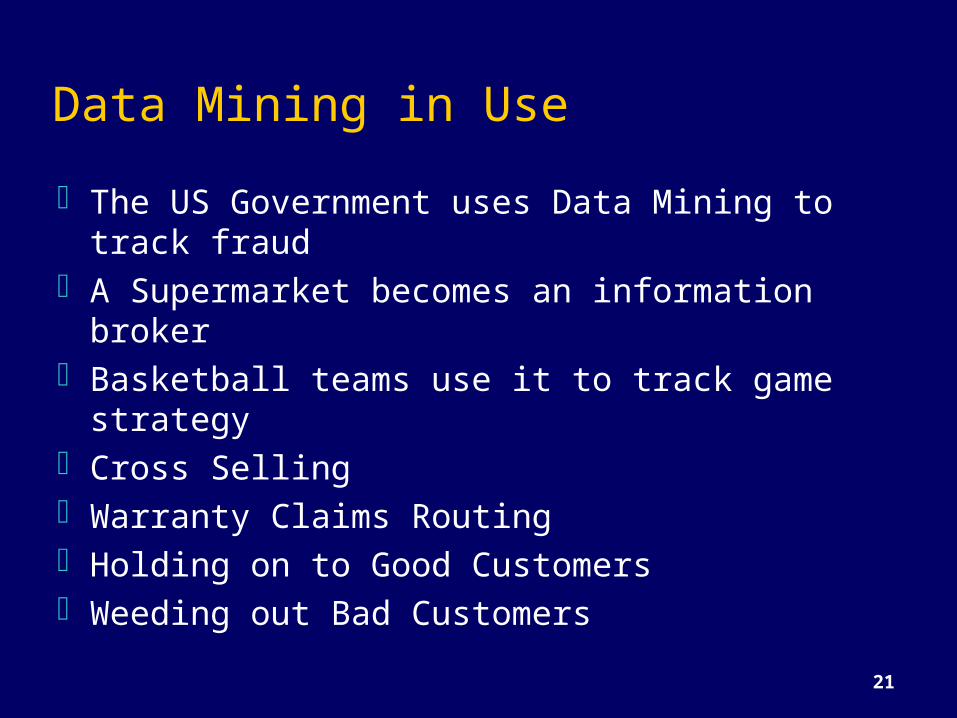
Data Mining in UseThe US Government uses Data Mining to track
fraudA Supermarket becomes an information
brokerBasketball teams use it to track game strategyCross SellingWarranty Claims RoutingHolding on to Good CustomersWeeding out Bad Customers
22
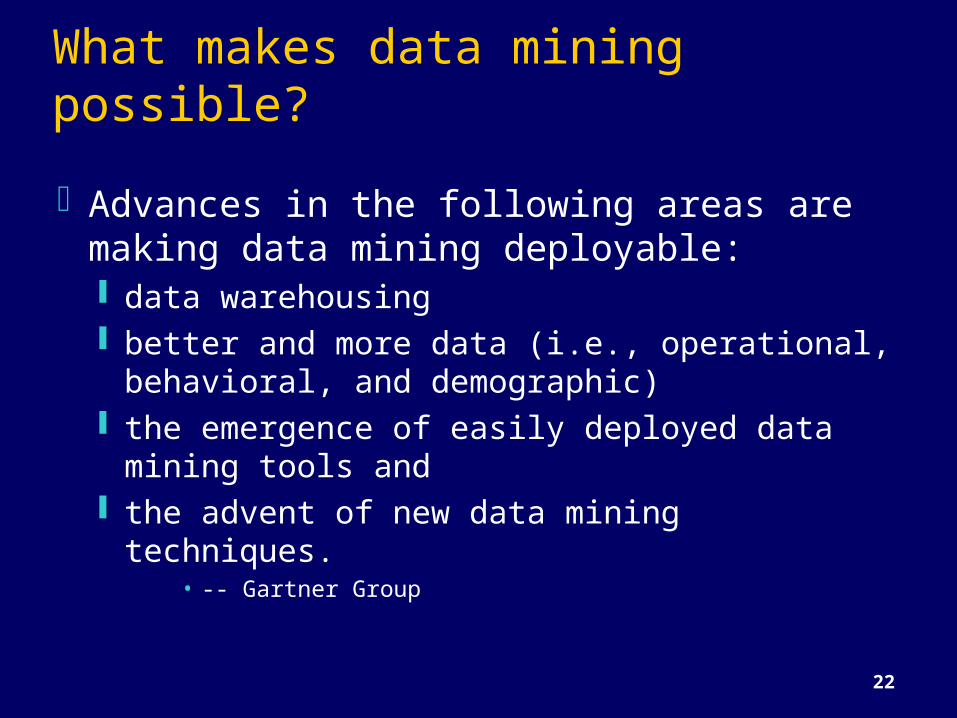
What makes data mining possible?Advances in the following areas are
making data mining deployable: data warehousing better and more data (i.e., operational,
behavioral, and demographic) the emergence of easily deployed data
mining tools and the advent of new data mining techniques.
• -- Gartner Group
23
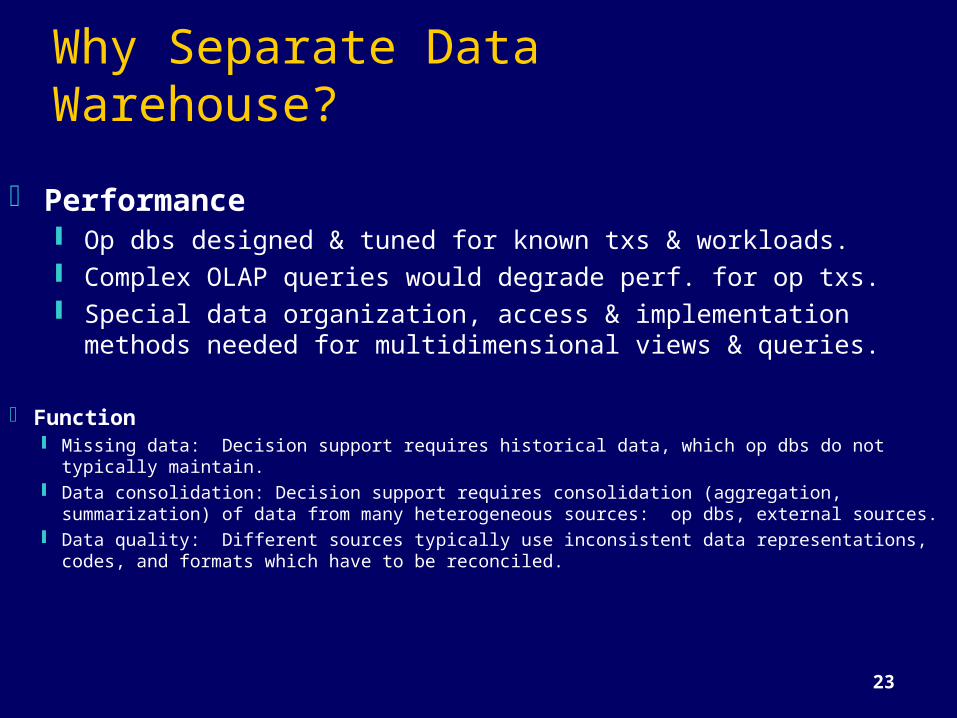
Why Separate Data Warehouse? Performance
Op dbs designed & tuned for known txs & workloads. Complex OLAP queries would degrade perf. for op txs. Special data organization, access & implementation
methods needed for multidimensional views & queries.
Function Missing data: Decision support requires historical data, which op dbs do not typically
maintain. Data consolidation: Decision support requires consolidation (aggregation, summarization)
of data from many heterogeneous sources: op dbs, external sources. Data quality: Different sources typically use inconsistent data representations, codes,
and formats which have to be reconciled.
24
What are Operational Systems?They are OLTP systemsRun mission critical
applicationsNeed to work with
stringent performance requirements for routine tasks
Used to run a business!
25
RDBMS used for OLTP
Database Systems have been used traditionally for OLTP clerical data processing tasks detailed, up to date data structured repetitive tasks read/update a few records isolation, recovery and integrity are
critical
26
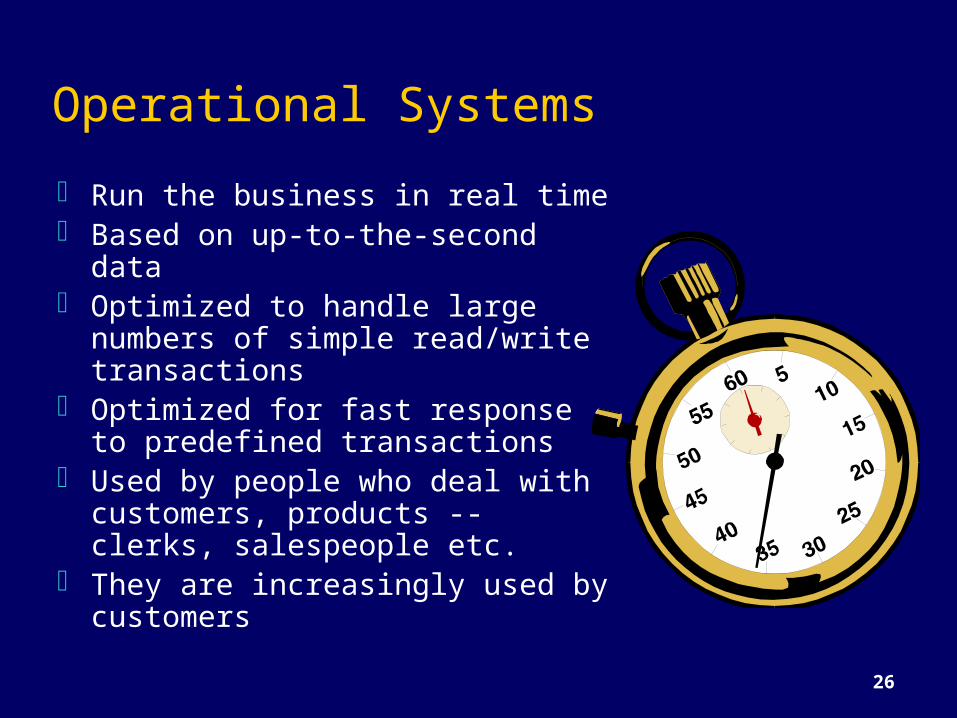
Operational Systems Run the business in real time Based on up-to-the-second data Optimized to handle large
numbers of simple read/write transactions
Optimized for fast response to predefined transactions
Used by people who deal with customers, products -- clerks, salespeople etc.
They are increasingly used by customers
27
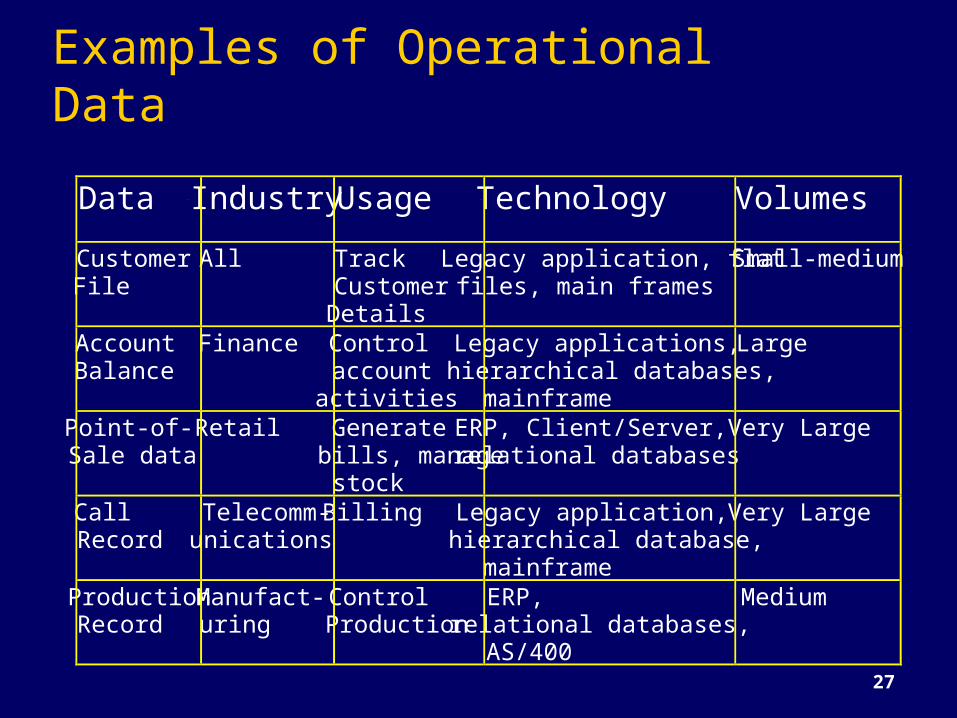
Examples of Operational DataData IndustryUsage Technology VolumesCustomerFile
All TrackCustomerDetails
Legacy application, flatfiles, main frames
Small-medium
AccountBalance
Finance Controlaccountactivities
Legacy applications,hierarchical databases,mainframe
Large
Point-of-Sale data
Retail Generatebills, managestock
ERP, Client/Server,relational databases
Very Large
CallRecord
Telecomm-unications
Billing Legacy application,hierarchical database,mainframe
Very Large
ProductionRecord
Manufact-uring
ControlProduction
ERP,relational databases,AS/400
Medium

So, what’s different?
29
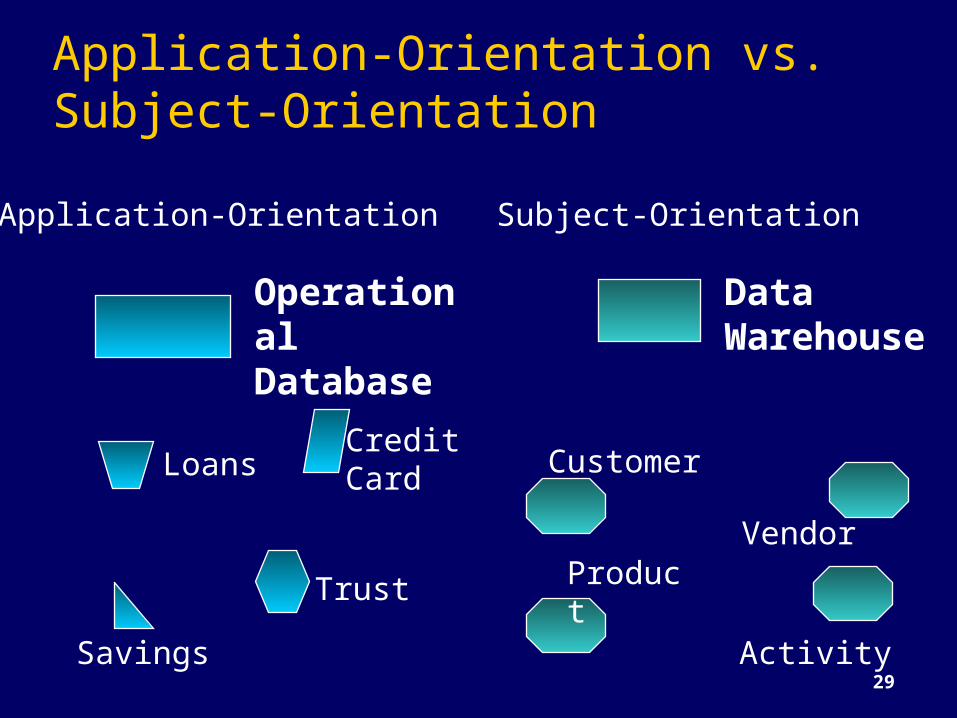
Application-Orientation vs. Subject-Orientation
Application-Orientation
Operational Database
Loans Credit Card
TrustSavings
Subject-Orientation
DataWarehouse
Customer
VendorProduct
Activity
30
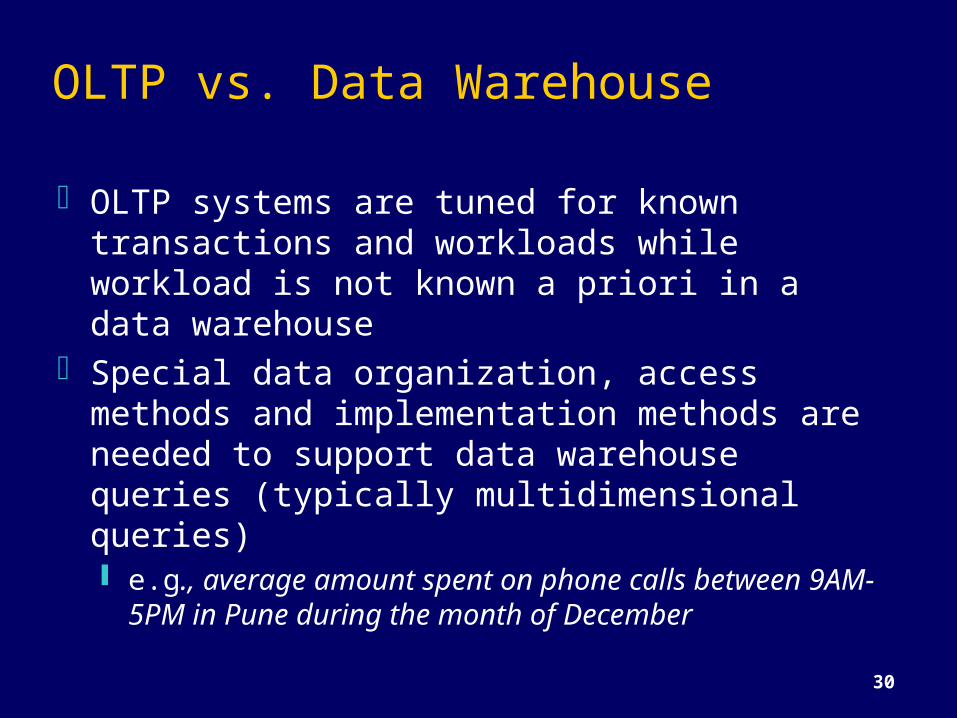
OLTP vs. Data Warehouse
OLTP systems are tuned for known transactions and workloads while workload is not known a priori in a data warehouse
Special data organization, access methods and implementation methods are needed to support data warehouse queries (typically multidimensional queries) e.g., average amount spent on phone calls
between 9AM-5PM in Pune during the month of December
31
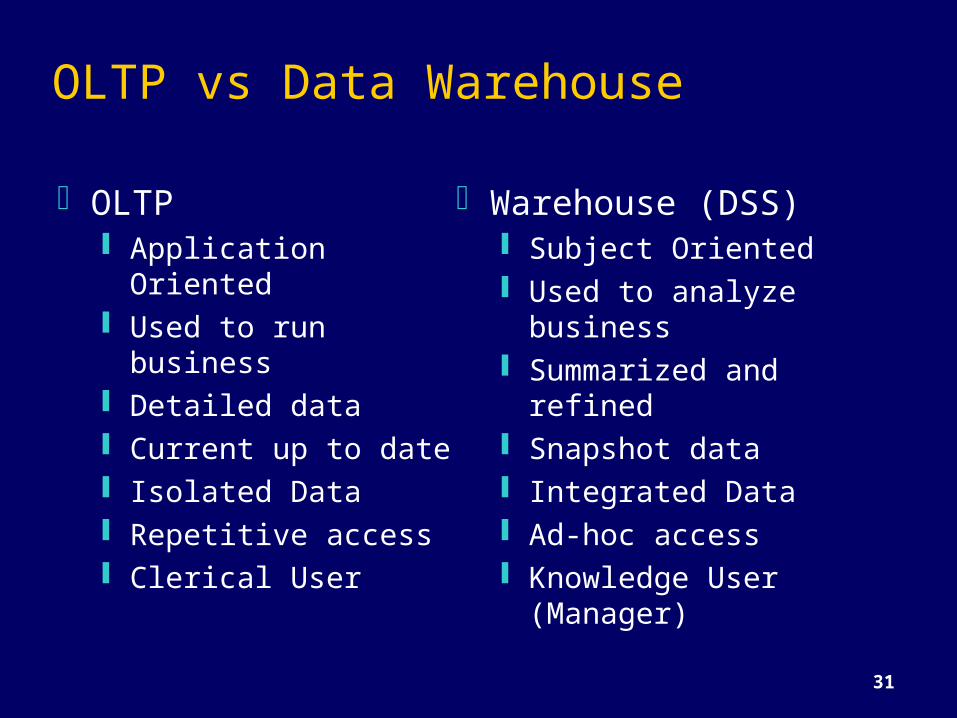
OLTP vs Data Warehouse
OLTP Application
Oriented Used to run
business Detailed data Current up to date Isolated Data Repetitive access Clerical User
Warehouse (DSS) Subject Oriented Used to analyze
business Summarized and refined Snapshot data Integrated Data Ad-hoc access Knowledge User
(Manager)
32
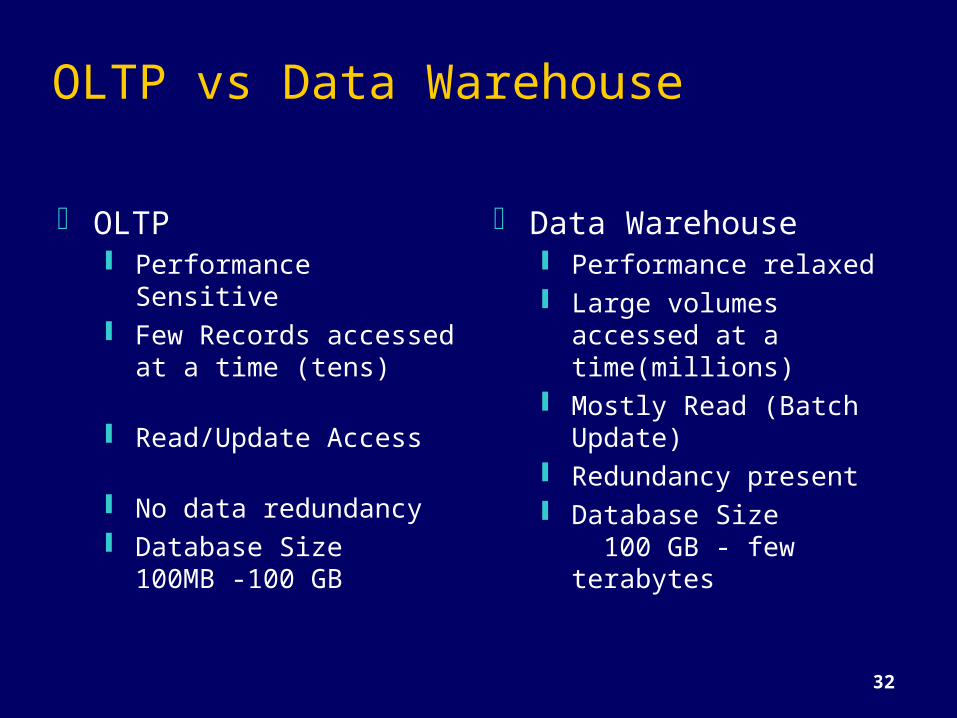
OLTP vs Data Warehouse
OLTP Performance Sensitive Few Records accessed
at a time (tens)
Read/Update Access
No data redundancy Database Size 100MB
-100 GB
Data Warehouse Performance relaxed Large volumes accessed
at a time(millions) Mostly Read (Batch
Update) Redundancy present Database Size 100
GB - few terabytes
33
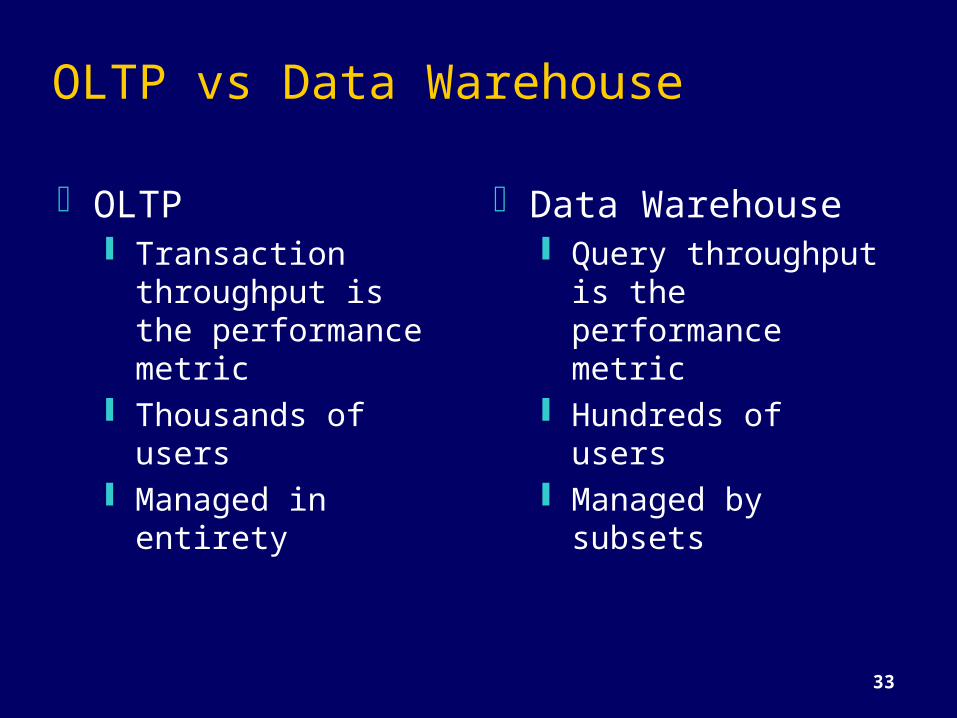
OLTP vs Data Warehouse
OLTP Transaction
throughput is the performance metric
Thousands of users Managed in entirety
Data Warehouse Query throughput is
the performance metric
Hundreds of users Managed by
subsets
34
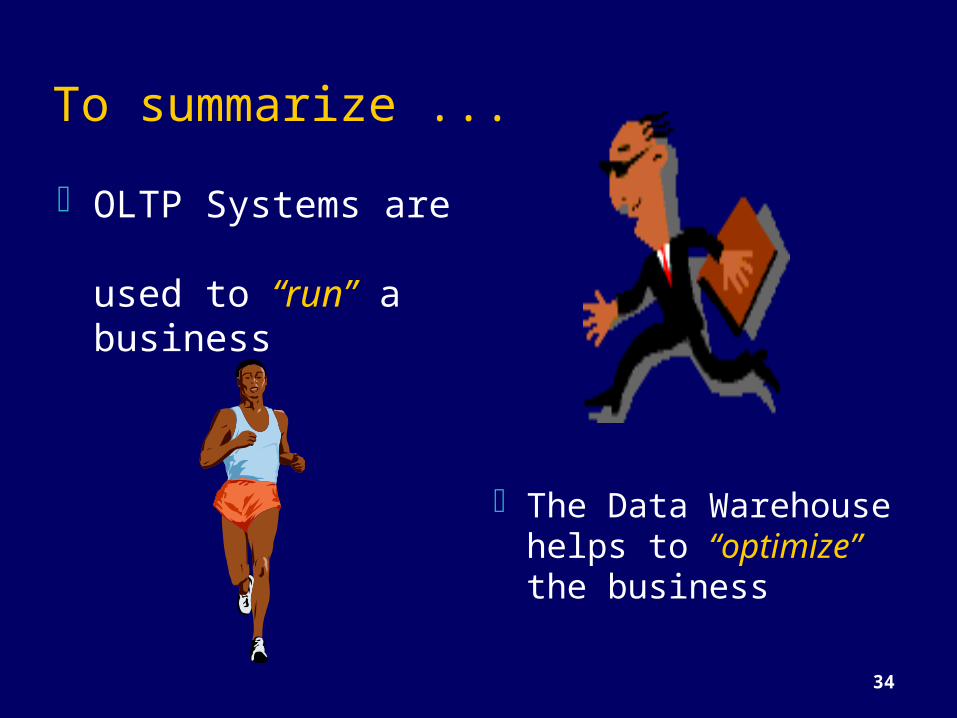
To summarize ...OLTP Systems are
used to “run” a business
The Data Warehouse helps to “optimize” the business
35
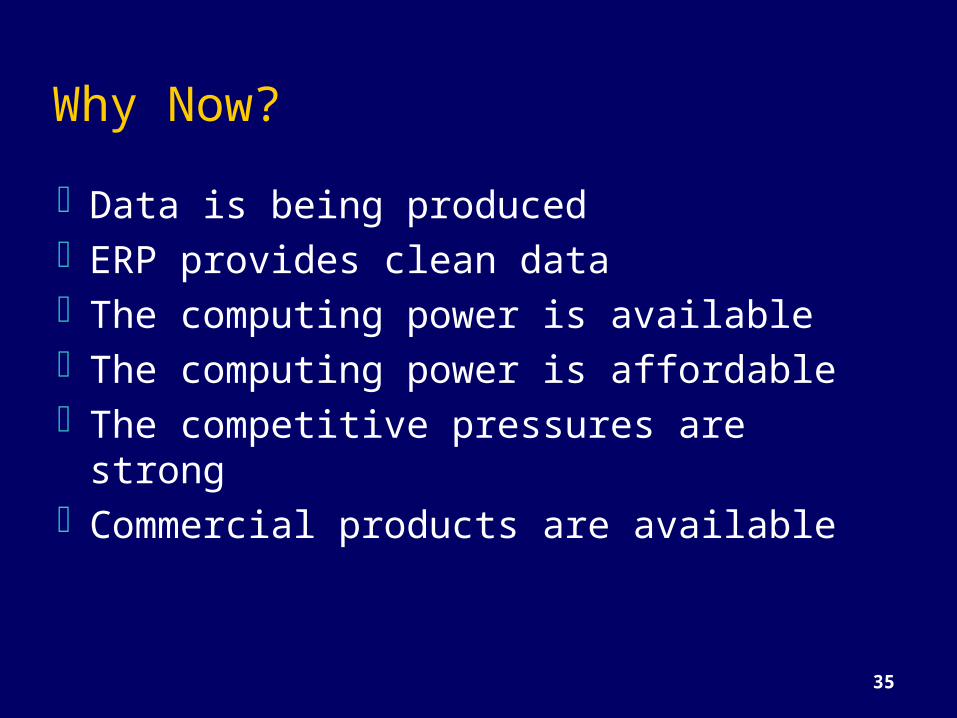
Why Now?Data is being producedERP provides clean dataThe computing power is availableThe computing power is affordableThe competitive pressures are strongCommercial products are available
36
Myths surrounding OLAP Servers and Data Marts Data marts and OLAP servers are departmental
solutions supporting a handful of users Million dollar massively parallel hardware is needed
to deliver fast time for complex queries OLAP servers require massive and unwieldy indices Complex OLAP queries clog the network with data Data warehouses must be at least 100 GB to be
effective– Source -- Arbor Software Home Page
37
Wal*Mart Case StudyFounded by Sam WaltonOne the largest Super Market Chains
in the US
Wal*Mart: 2000+ Retail Stores SAM's Clubs 100+Wholesalers Stores
This case study is from Felipe Carino’s (NCR Teradata) presentation made at Stanford Database Seminar
38
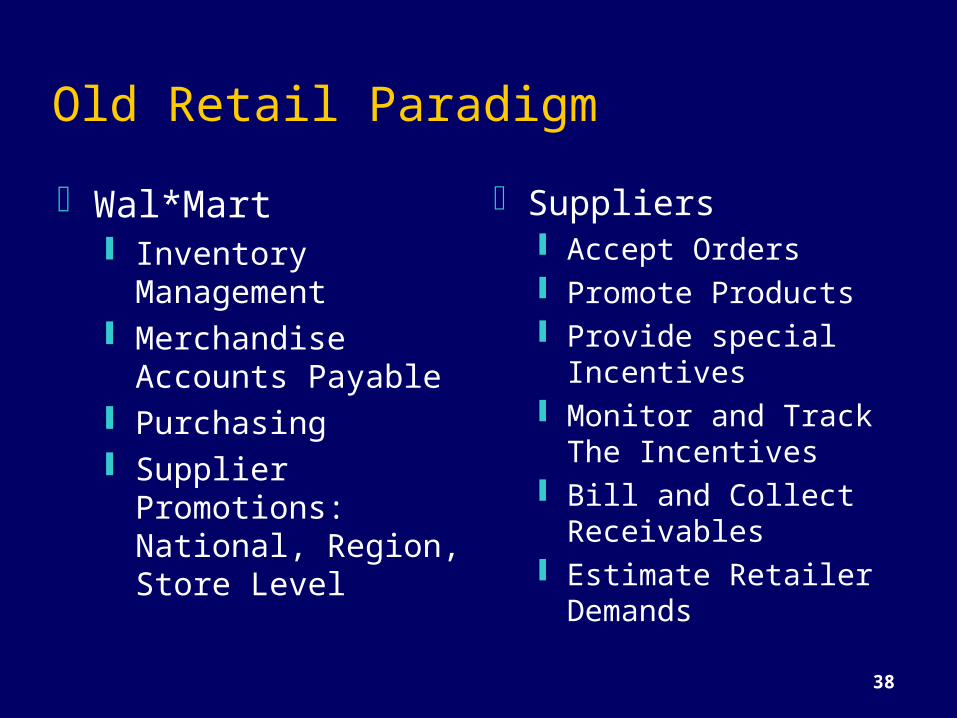
Old Retail ParadigmWal*Mart
Inventory Management Merchandise Accounts
Payable Purchasing Supplier Promotions:
National, Region, Store Level
Suppliers Accept Orders Promote Products Provide special
Incentives Monitor and Track
The Incentives Bill and Collect
Receivables Estimate Retailer
Demands
39
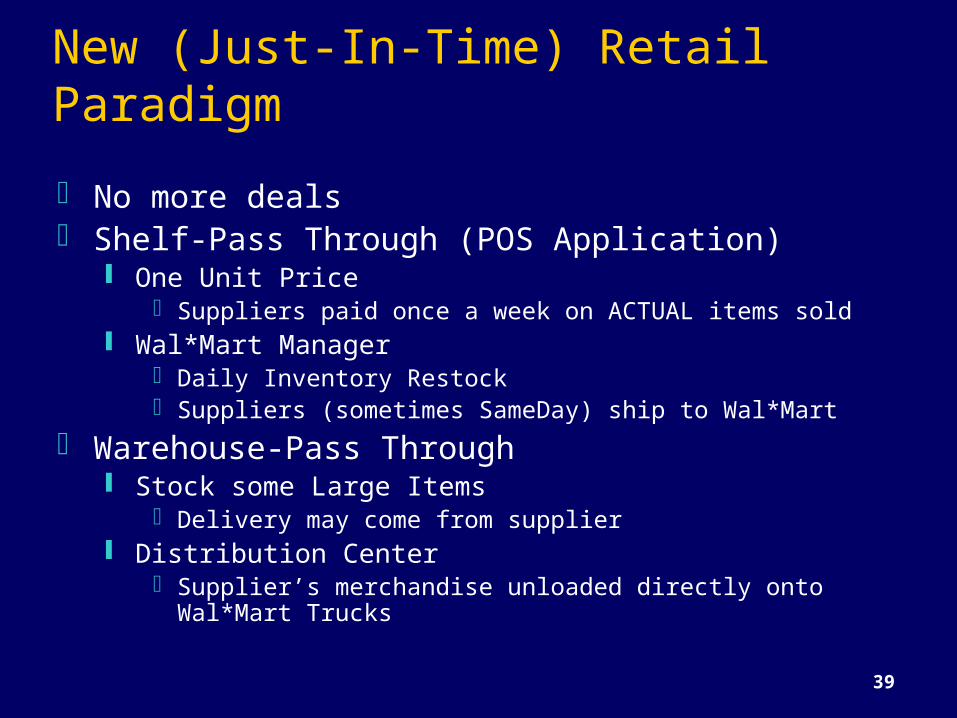
New (Just-In-Time) Retail Paradigm No more deals Shelf-Pass Through (POS Application)
One Unit Price Suppliers paid once a week on ACTUAL items sold
Wal*Mart Manager Daily Inventory Restock Suppliers (sometimes SameDay) ship to Wal*Mart
Warehouse-Pass Through Stock some Large Items
Delivery may come from supplier Distribution Center
Supplier’s merchandise unloaded directly onto Wal*Mart Trucks
40
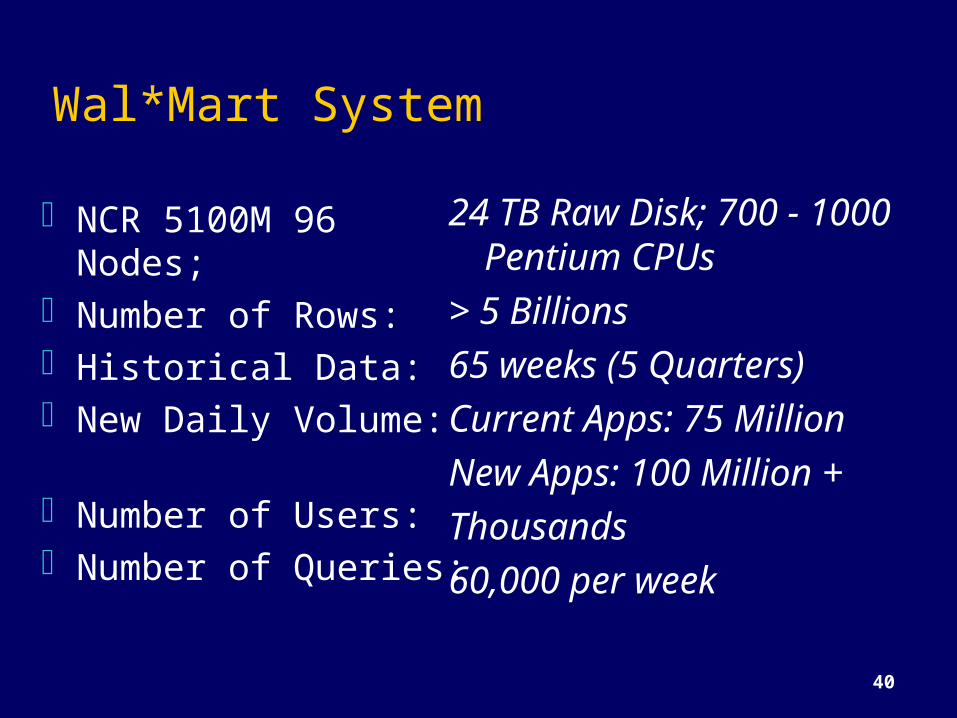
Wal*Mart System
NCR 5100M 96 Nodes;
Number of Rows:Historical Data:New Daily Volume:
Number of Users:Number of Queries:
24 TB Raw Disk; 700 - 1000 Pentium CPUs
> 5 Billions65 weeks (5 Quarters)Current Apps: 75 MillionNew Apps: 100 Million +Thousands60,000 per week
41
Course Overview
0. IntroductionI. Data WarehousingII. Decision Support and
OLAPIII. Data MiningIV. Looking Ahead
Demos and Labs
42
I. Data Warehouses:Architecture, Design & ConstructionDW ArchitectureLoading, refreshingStructuring/ModelingDWs and Data MartsQuery Processing
demos, labs
43
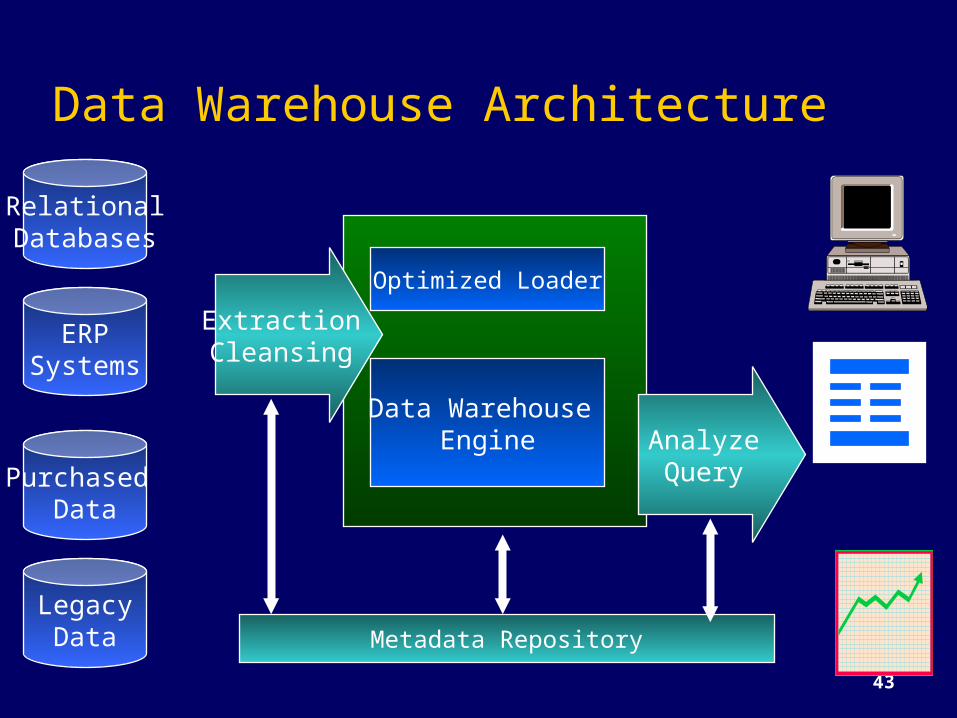
Data Warehouse Architecture
Data Warehouse Engine
Optimized Loader
ExtractionCleansing
AnalyzeQuery
Metadata Repository
RelationalDatabases
LegacyData
Purchased Data
ERPSystems
44
Components of the WarehouseData Extraction and LoadingThe Warehouse Analyze and Query -- OLAP ToolsMetadata
Data Mining tools
Loading the Warehouse
Cleaning the data before it is loaded
46
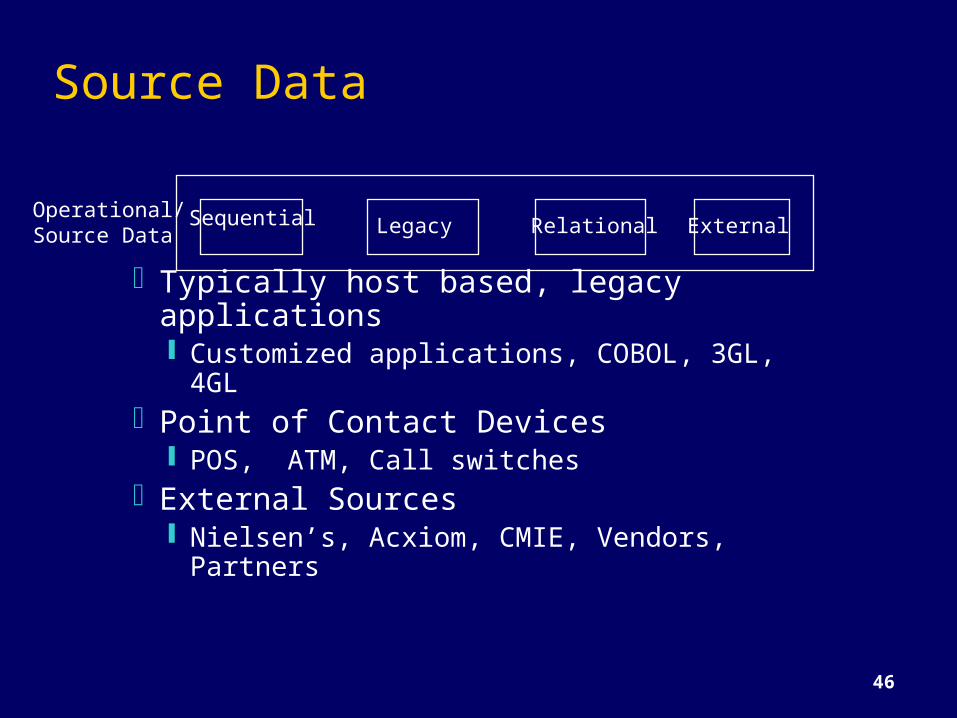
Source Data
Typically host based, legacy applications Customized applications, COBOL, 3GL,
4GLPoint of Contact Devices
POS, ATM, Call switchesExternal Sources
Nielsen’s, Acxiom, CMIE, Vendors, Partners
Sequential Legacy Relational ExternalOperational/Source Data
47
Data Quality - The Reality
Tempting to think creating a data warehouse is simply extracting operational data and entering into a data warehouse
Nothing could be farther from the truthWarehouse data comes from disparate
questionable sources
48
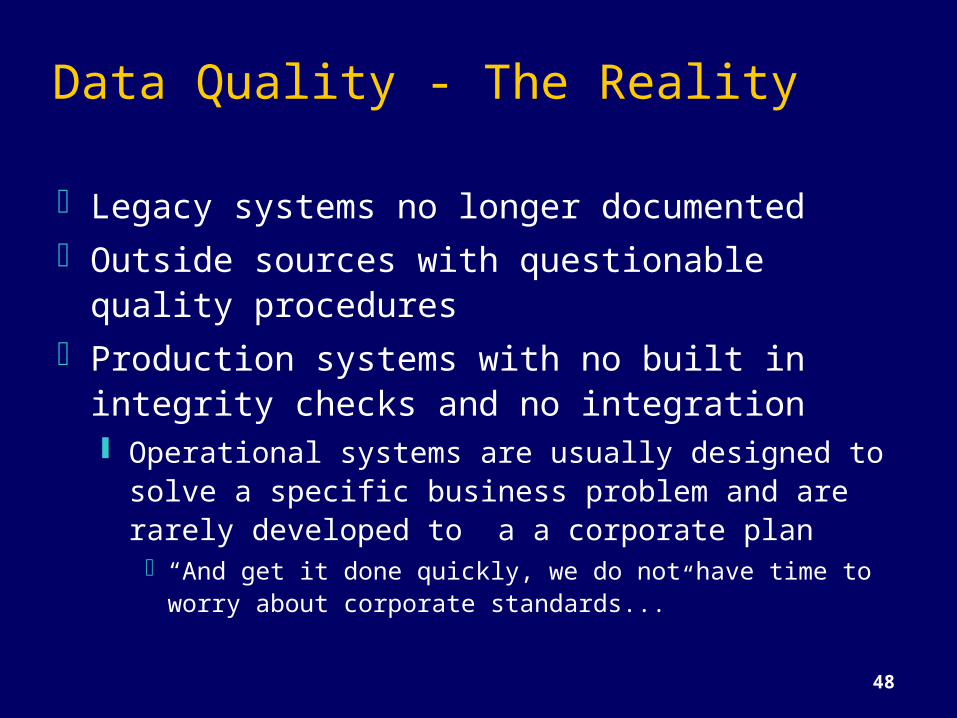
Data Quality - The Reality
Legacy systems no longer documentedOutside sources with questionable quality
proceduresProduction systems with no built in integrity
checks and no integration Operational systems are usually designed to
solve a specific business problem and are rarely developed to a a corporate plan
“And get it done quickly, we do not have time to worry about corporate standards...”
49
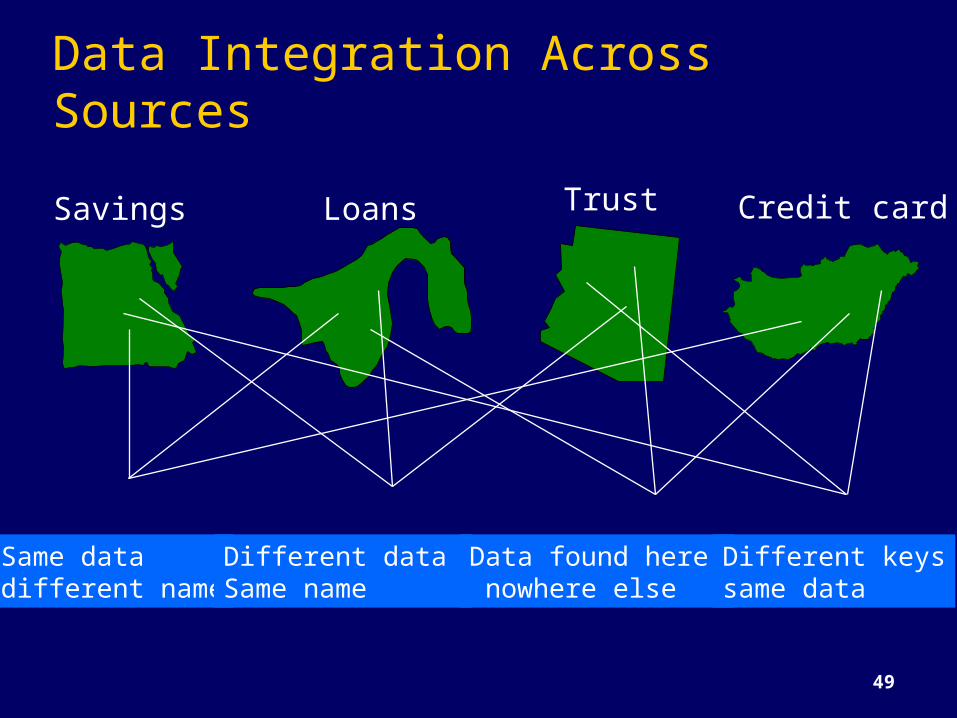
Data Integration Across Sources
Trust Credit cardSavings Loans
Same data different name
Different data Same name
Data found here nowhere else
Different keyssame data
50
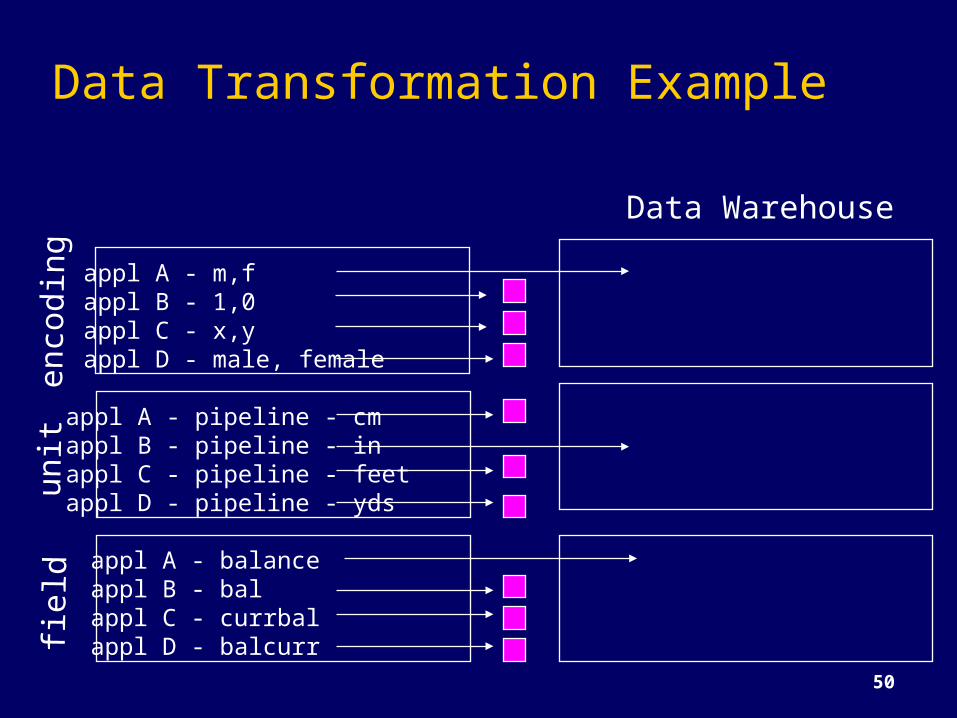
Data Transformation Exampleen
codi
ngun
itfie
ld
appl A - balanceappl B - balappl C - currbalappl D - balcurr
appl A - pipeline - cmappl B - pipeline - inappl C - pipeline - feetappl D - pipeline - yds
appl A - m,fappl B - 1,0appl C - x,yappl D - male, female
Data Warehouse
51
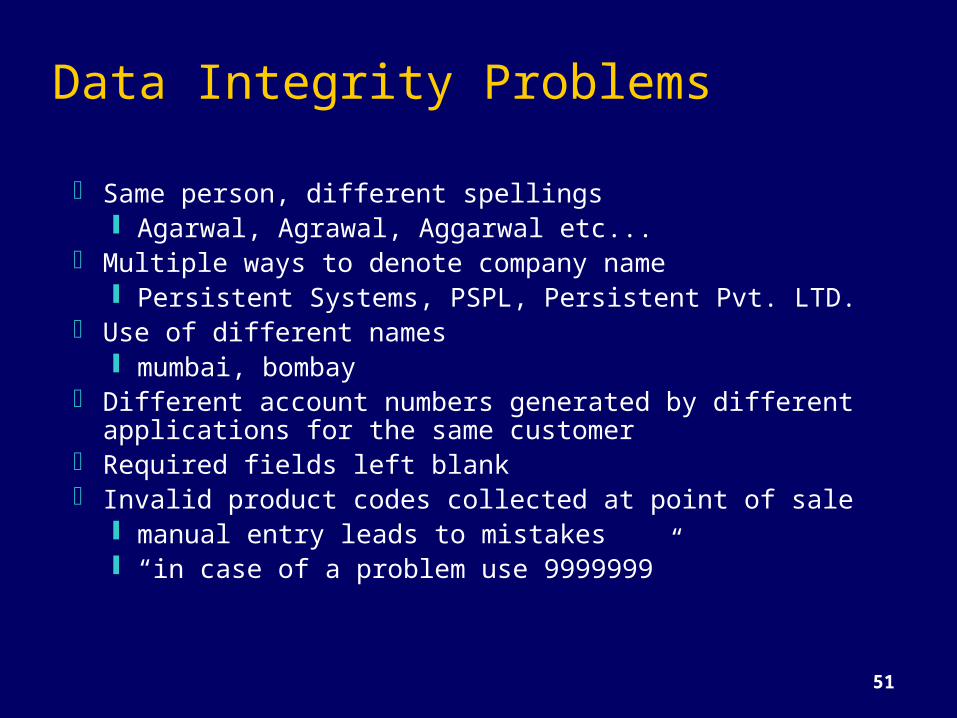
Data Integrity Problems
Same person, different spellings Agarwal, Agrawal, Aggarwal etc...
Multiple ways to denote company name Persistent Systems, PSPL, Persistent Pvt. LTD.
Use of different names mumbai, bombay
Different account numbers generated by different applications for the same customer
Required fields left blank Invalid product codes collected at point of sale
manual entry leads to mistakes “in case of a problem use 9999999”
52
Data Transformation Terms
ExtractingConditioningScrubbingMergingHouseholding
EnrichmentScoringLoadingValidatingDelta Updating
53
Data Transformation Terms
Extracting Capture of data from operational source in “as
is” status Sources for data generally in legacy
mainframes in VSAM, IMS, IDMS, DB2; more data today in relational databases on Unix
Conditioning The conversion of data types from the source to
the target data store (warehouse) -- always a relational database
54
Data Transformation Terms
Householding Identifying all members of a household
(living at the same address) Ensures only one mail is sent to a
household Can result in substantial savings: 1 lakh
catalogues at Rs. 50 each costs Rs. 50 lakhs. A 2% savings would save Rs. 1 lakh.
55
Data Transformation Terms
Enrichment Bring data from external sources to
augment/enrich operational data. Data sources include Dunn and Bradstreet, A. C. Nielsen, CMIE, IMRA etc...
Scoring computation of a probability of an event.
e.g..., chance that a customer will defect to AT&T from MCI, chance that a customer is likely to buy a new product
56
Loads
After extracting, scrubbing, cleaning, validating etc. need to load the data into the warehouse
Issues huge volumes of data to be loaded small time window available when warehouse can be
taken off line (usually nights) when to build index and summary tables allow system administrators to monitor, cancel, resume,
change load rates Recover gracefully -- restart after failure from where you
were and without loss of data integrity
57
Load Techniques
Use SQL to append or insert new data record at a time interface will lead to random disk I/O’s
Use batch load utility
58
Load Taxonomy
Incremental versus Full loadsOnline versus Offline loads
59
Refresh
Propagate updates on source data to the warehouse
Issues: when to refresh how to refresh -- refresh techniques
60
When to Refresh?periodically (e.g., every night, every week)
or after significant eventson every update: not warranted unless
warehouse data require current data (up to the minute stock quotes)
refresh policy set by administrator based on user needs and traffic
possibly different policies for different sources
61
Refresh Techniques
Full Extract from base tables read entire source table: too expensive maybe the only choice for legacy
systems
62
How To Detect Changes
Create a snapshot log table to record ids of updated rows of source data and timestamp
Detect changes by: Defining after row triggers to update
snapshot log when source table changes Using regular transaction log to detect
changes to source data
63
Data Extraction and CleansingExtract data from existing
operational and legacy dataIssues:
Sources of data for the warehouse Data quality at the sources Merging different data sources Data Transformation How to propagate updates (on the sources) to
the warehouse Terabytes of data to be loaded
64
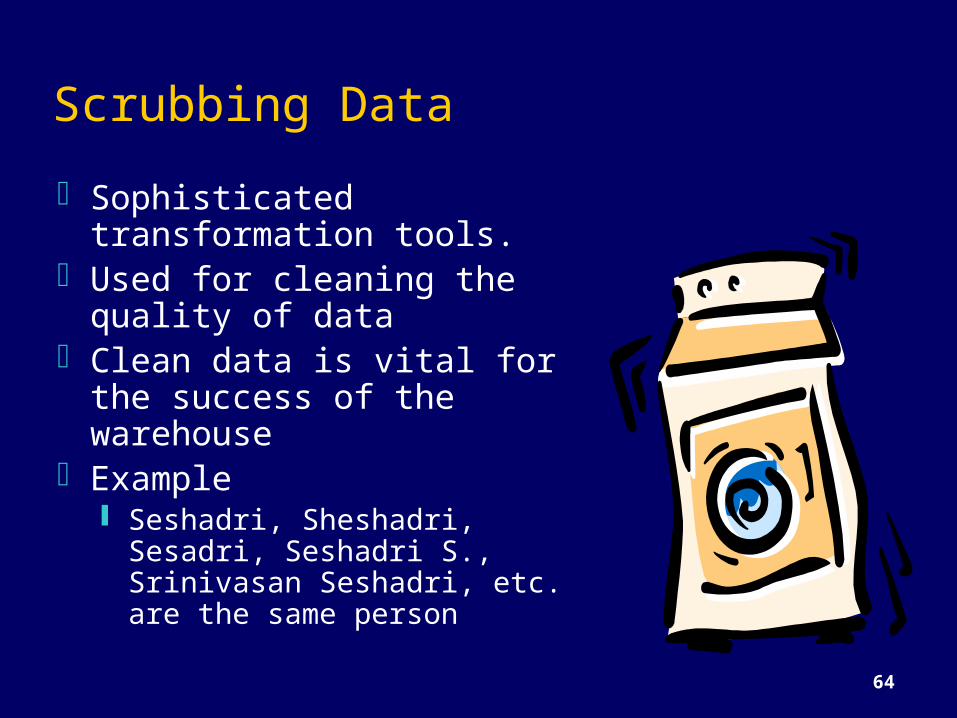
Scrubbing DataSophisticated
transformation tools.Used for cleaning the
quality of dataClean data is vital for the
success of the warehouseExample
Seshadri, Sheshadri, Sesadri, Seshadri S., Srinivasan Seshadri, etc. are the same person
65
Scrubbing ToolsApertus -- Enterprise/Integrator Vality -- IPEPostal Soft
Structuring/Modeling Issues
67
Data -- Heart of the Data WarehouseHeart of the data warehouse is the
data itself!Single version of the truthCorporate memoryData is organized in a way that
represents business -- subject orientation
68
Data Warehouse Structure
Subject Orientation -- customer, product, policy, account etc... A subject may be implemented as a set of related tables. E.g., customer may be five tables
69
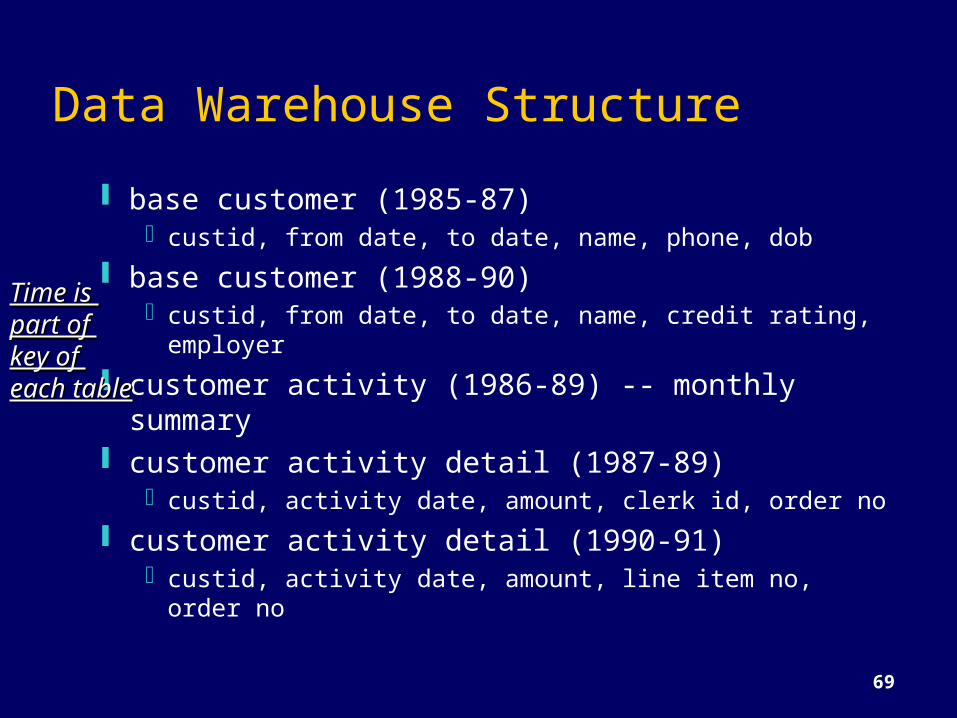
Data Warehouse Structure base customer (1985-87)
custid, from date, to date, name, phone, dob base customer (1988-90)
custid, from date, to date, name, credit rating, employer
customer activity (1986-89) -- monthly summary
customer activity detail (1987-89)custid, activity date, amount, clerk id, order no
customer activity detail (1990-91)custid, activity date, amount, line item no, order no
Time is Time is part of part of key of key of each tableeach table
70
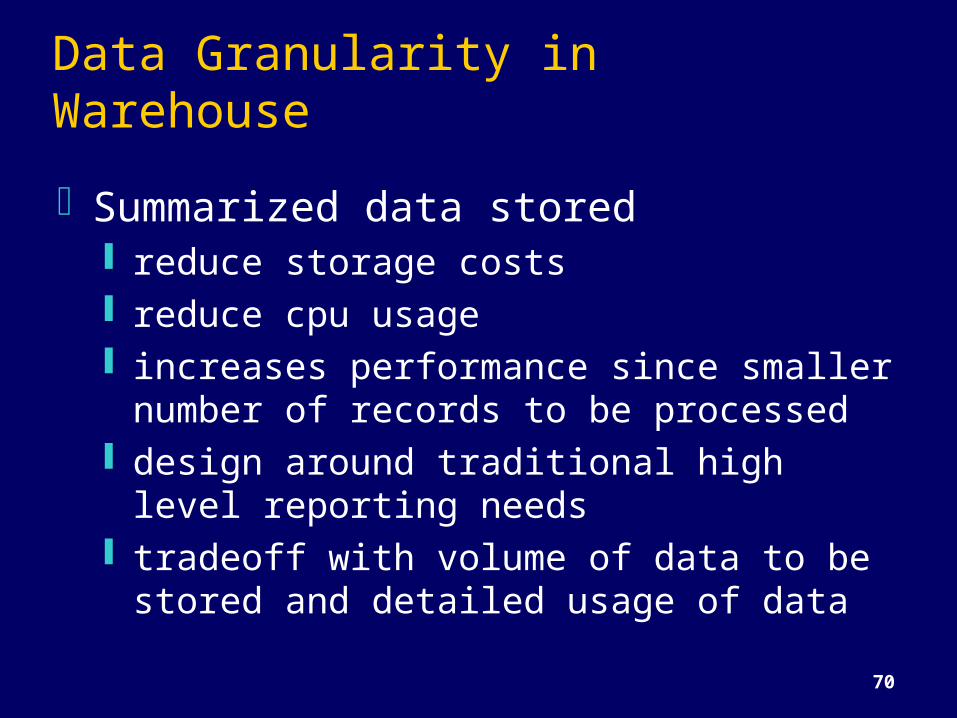
Data Granularity in Warehouse
Summarized data stored reduce storage costs reduce cpu usage increases performance since smaller
number of records to be processed design around traditional high level
reporting needs tradeoff with volume of data to be
stored and detailed usage of data
71
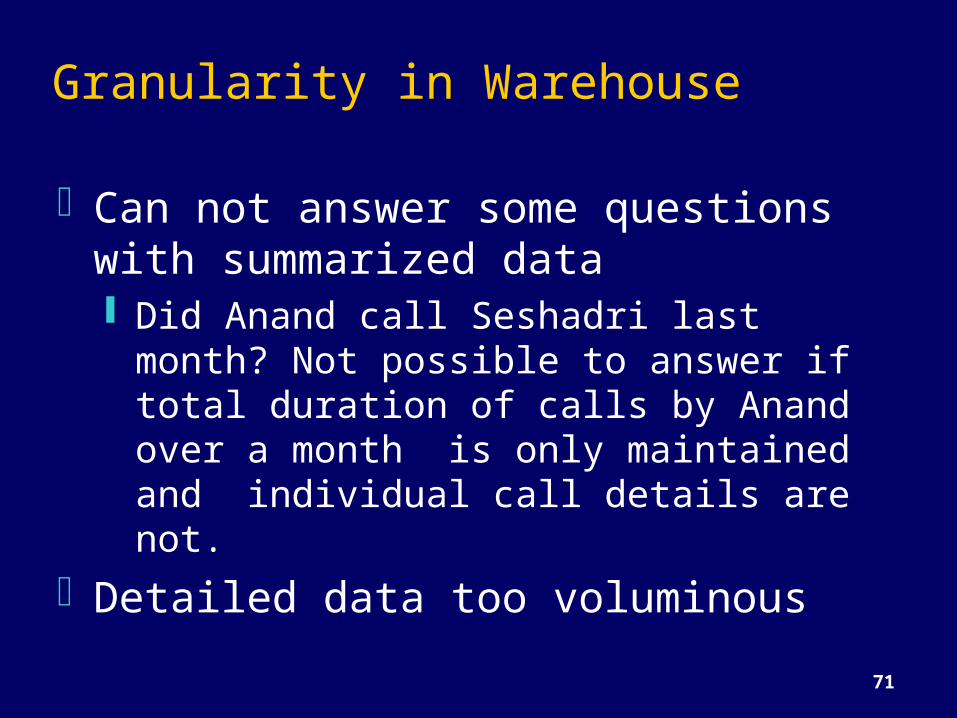
Granularity in Warehouse
Can not answer some questions with summarized data Did Anand call Seshadri last month? Not
possible to answer if total duration of calls by Anand over a month is only maintained and individual call details are not.
Detailed data too voluminous
72
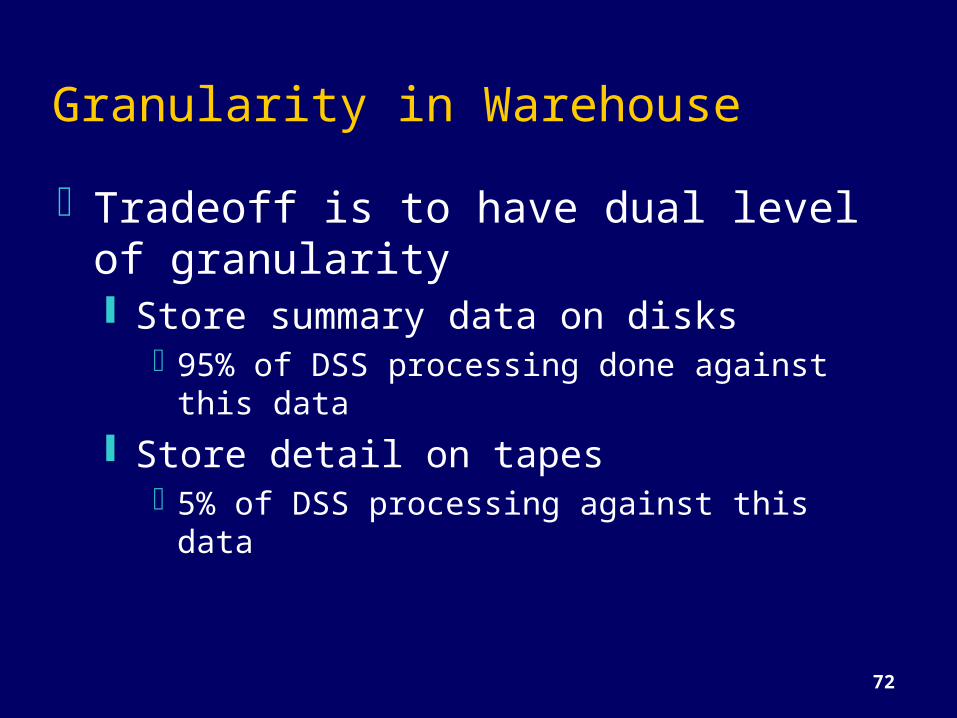
Granularity in WarehouseTradeoff is to have dual level of
granularity Store summary data on disks
95% of DSS processing done against this data
Store detail on tapes5% of DSS processing against this data
73
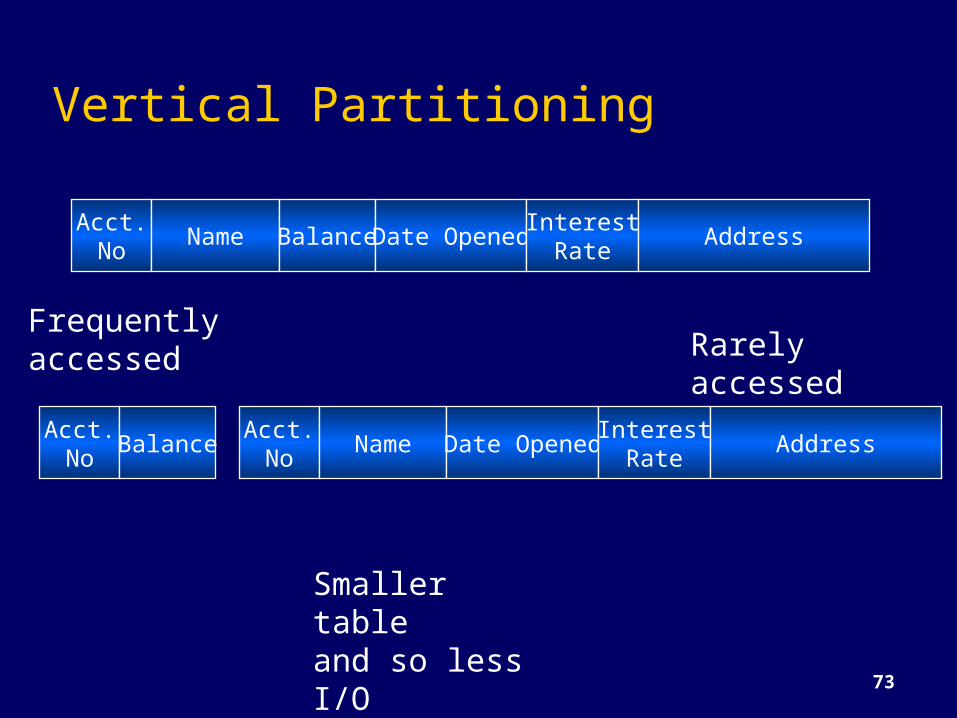
Vertical Partitioning
Frequentlyaccessed Rarely
accessed
Smaller tableand so less I/O
Acct.No Name BalanceDate Opened Interest
Rate Address
Acct.No Balance Acct.
No Name Date Opened InterestRate Address
74
Derived DataIntroduction of derived (calculated
data) may often helpHave seen this in the context of dual
levels of granularity Can keep auxiliary views and
indexes to speed up query processing
75
Schema Design
Database organization must look like business must be recognizable by business user approachable by business user Must be simple
Schema Types Star Schema Fact Constellation Schema Snowflake schema
76
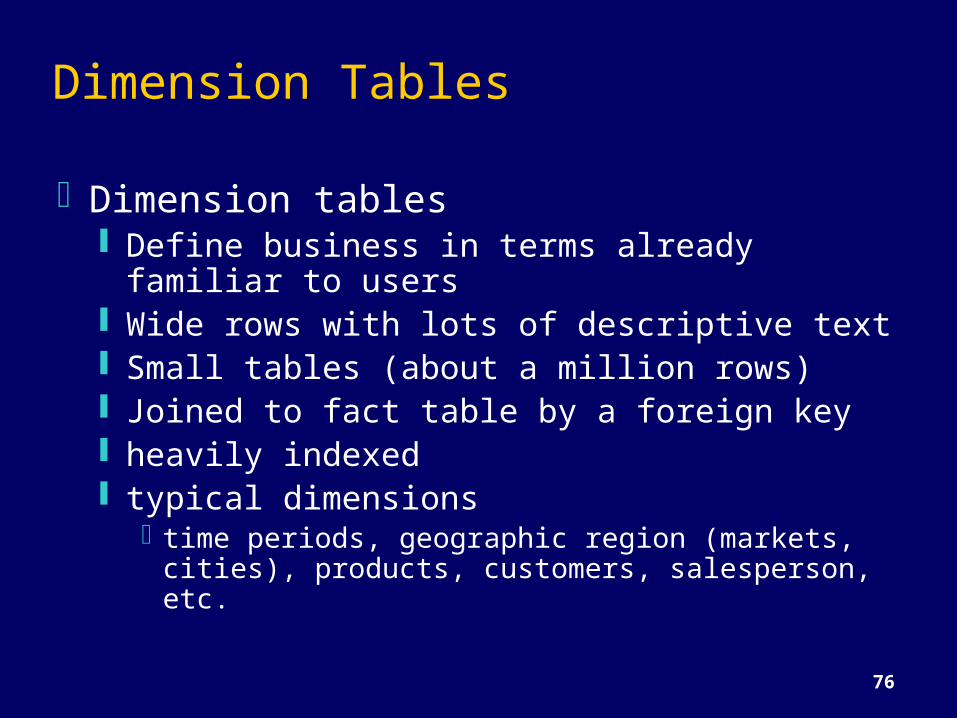
Dimension Tables
Dimension tables Define business in terms already familiar
to users Wide rows with lots of descriptive text Small tables (about a million rows) Joined to fact table by a foreign key heavily indexed typical dimensions
time periods, geographic region (markets, cities), products, customers, salesperson, etc.
77
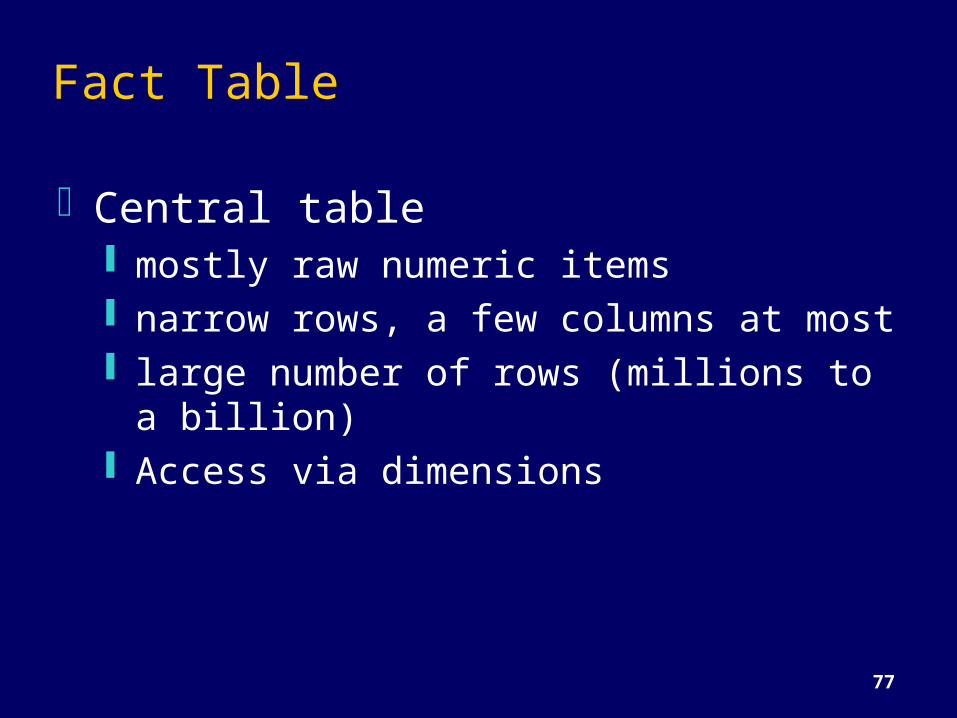
Fact Table
Central table mostly raw numeric items narrow rows, a few columns at most large number of rows (millions to a
billion) Access via dimensions
78
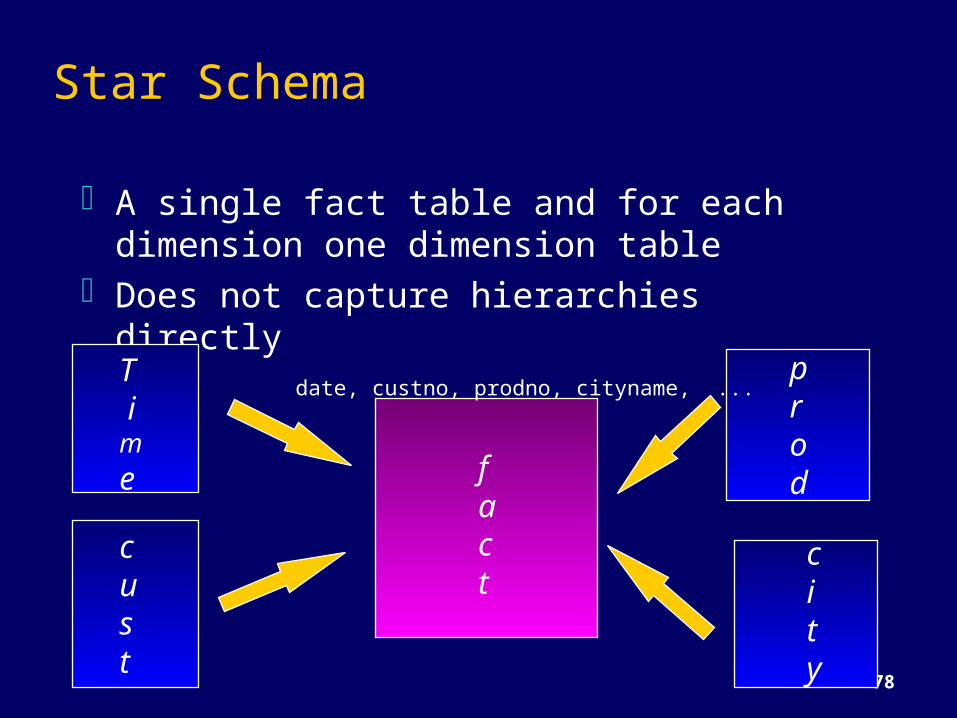
Star Schema
A single fact table and for each dimension one dimension table
Does not capture hierarchies directlyT ime
prod
cust
city
fact
date, custno, prodno, cityname, ...
79
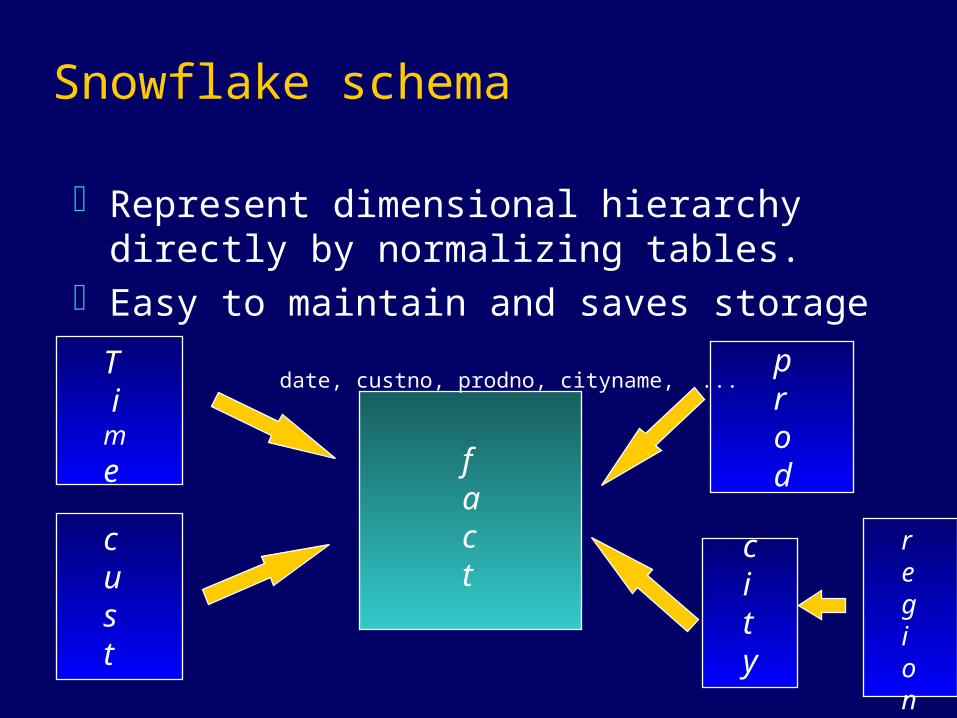
Snowflake schema
Represent dimensional hierarchy directly by normalizing tables.
Easy to maintain and saves storageT ime
prod
cust
city
fact
date, custno, prodno, cityname, ...
region
80
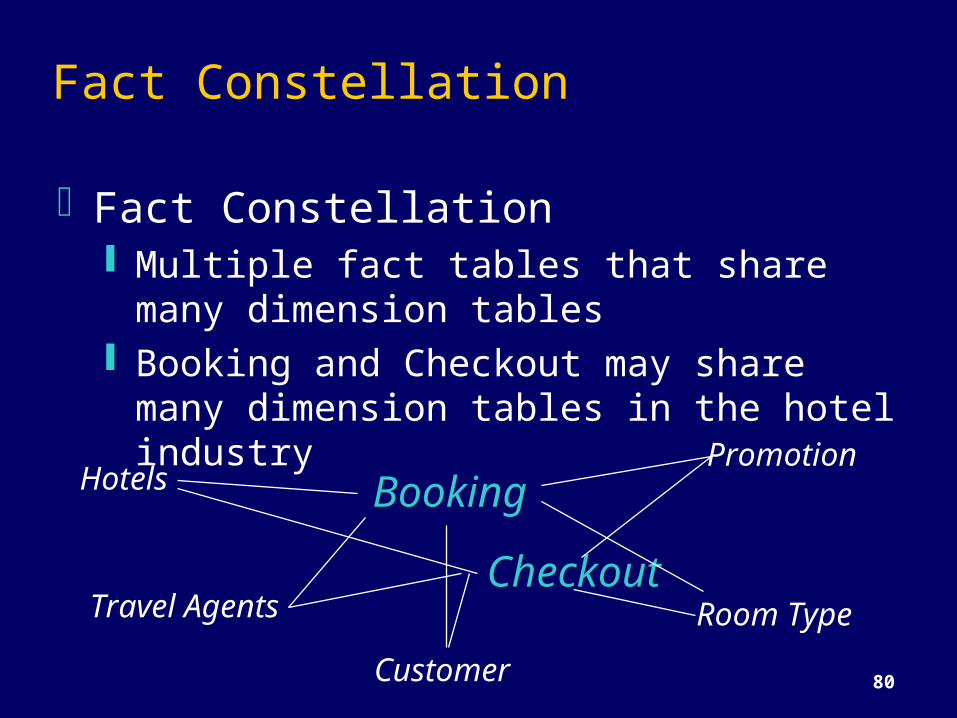
Fact Constellation
Fact Constellation Multiple fact tables that share many
dimension tables Booking and Checkout may share many
dimension tables in the hotel industryHotels
Travel Agents
Promotion
Room TypeCustomer
Booking
Checkout
81
De-normalizationNormalization in a data warehouse
may lead to lots of small tablesCan lead to excessive I/O’s since
many tables have to be accessedDe-normalization is the answer
especially since updates are rare
82
Creating ArraysMany times each occurrence of a sequence of
data is in a different physical locationBeneficial to collect all occurrences together
and store as an array in a single rowMakes sense only if there are a stable number
of occurrences which are accessed togetherIn a data warehouse, such situations arise
naturally due to time based orientation can create an array by month
83
Selective RedundancyDescription of an item can be stored
redundantly with order table -- most often item description is also accessed with order table
Updates have to be careful
84
PartitioningBreaking data into several
physical units that can be handled separately
Not a question of whether to do it in data warehouses but how to do it
Granularity and partitioning are key to effective implementation of a warehouse
85
Why Partition?Flexibility in managing dataSmaller physical units allow
easy restructuring free indexing sequential scans if needed easy reorganization easy recovery easy monitoring
86
Criterion for PartitioningTypically partitioned by
date line of business geography organizational unit any combination of above
87
Where to Partition?Application level or DBMS levelMakes sense to partition at
application level Allows different definition for each year
Important since warehouse spans many years and as business evolves definition changes
Allows data to be moved between processing complexes easily
Data Warehouse vs. Data Marts
What comes first
89
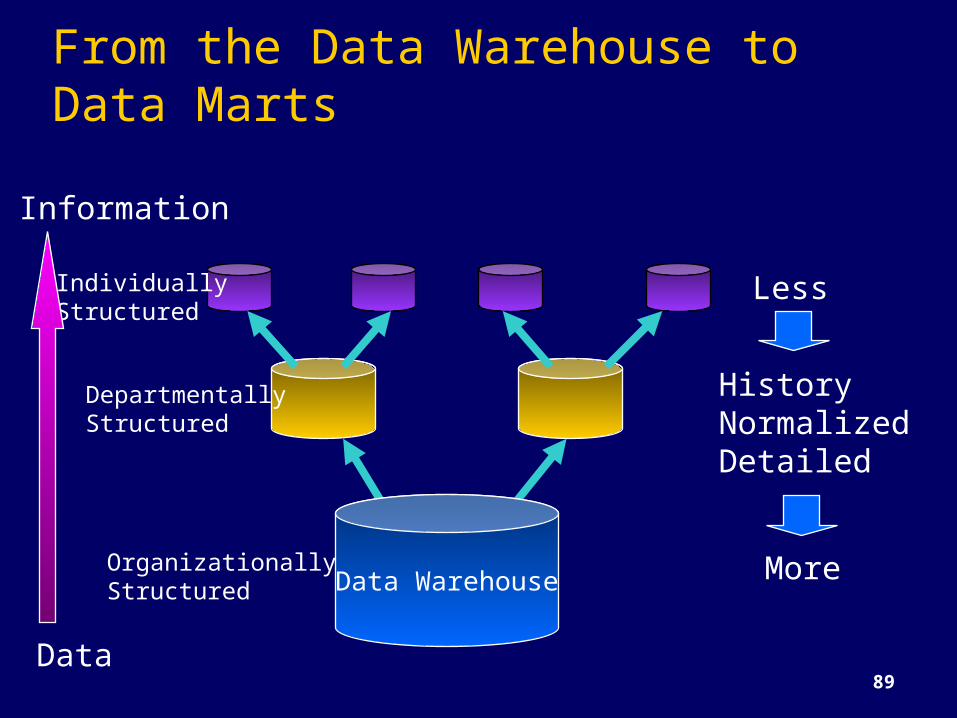
From the Data Warehouse to Data Marts
DepartmentallyStructured
IndividuallyStructured
Data WarehouseOrganizationallyStructured
Less
More
HistoryNormalizedDetailed
Data
Information
90
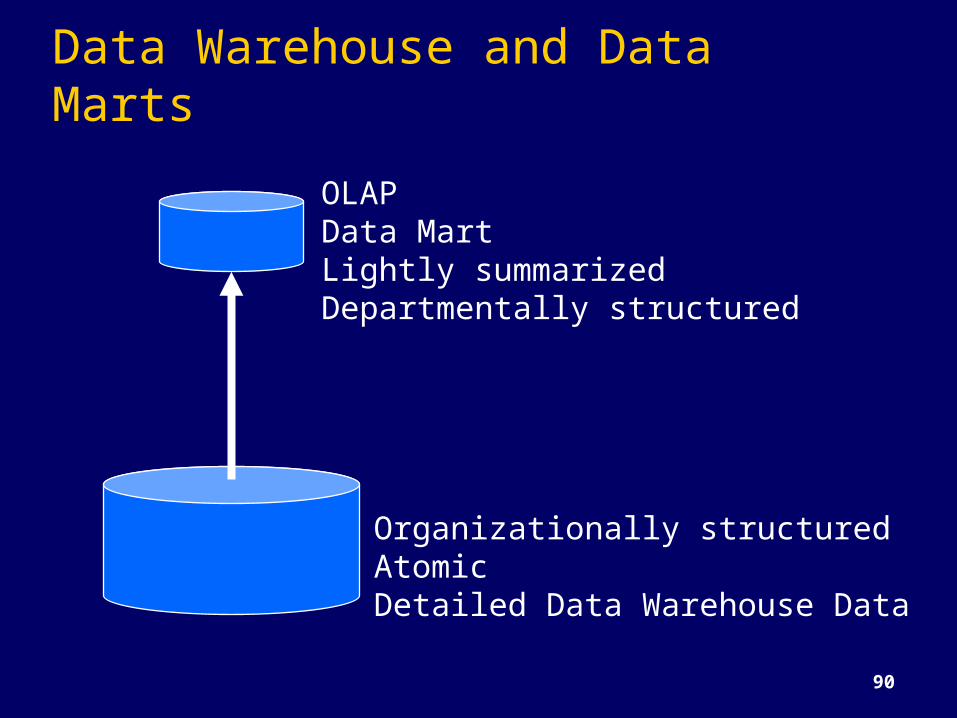
Data Warehouse and Data MartsOLAPData MartLightly summarizedDepartmentally structured
Organizationally structuredAtomicDetailed Data Warehouse Data
91
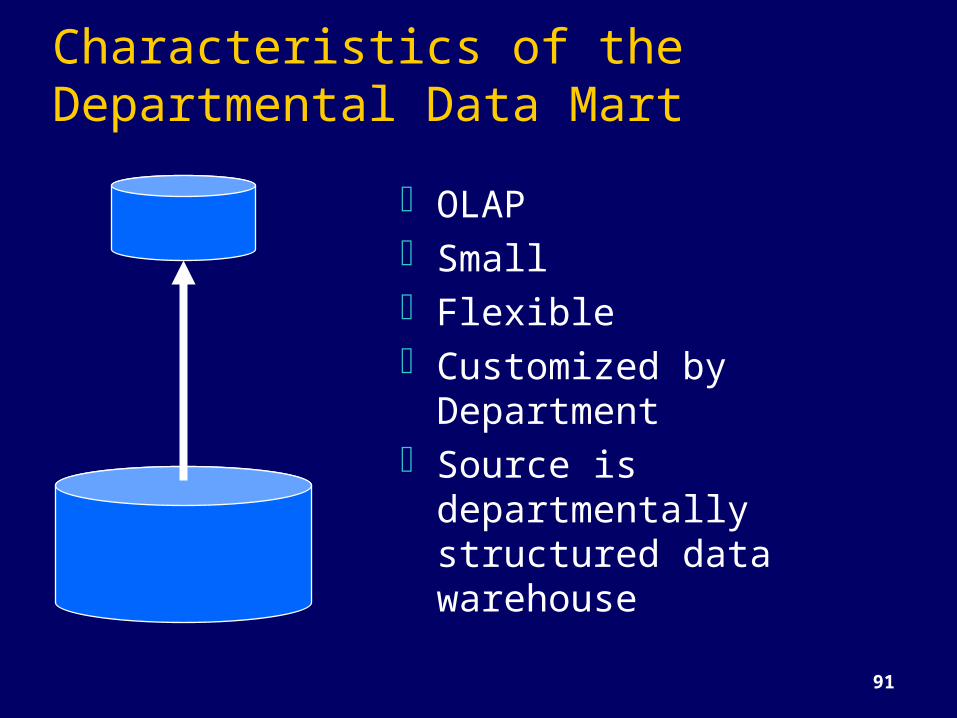
Characteristics of the Departmental Data Mart
OLAPSmallFlexibleCustomized by
DepartmentSource is
departmentally structured data warehouse
92
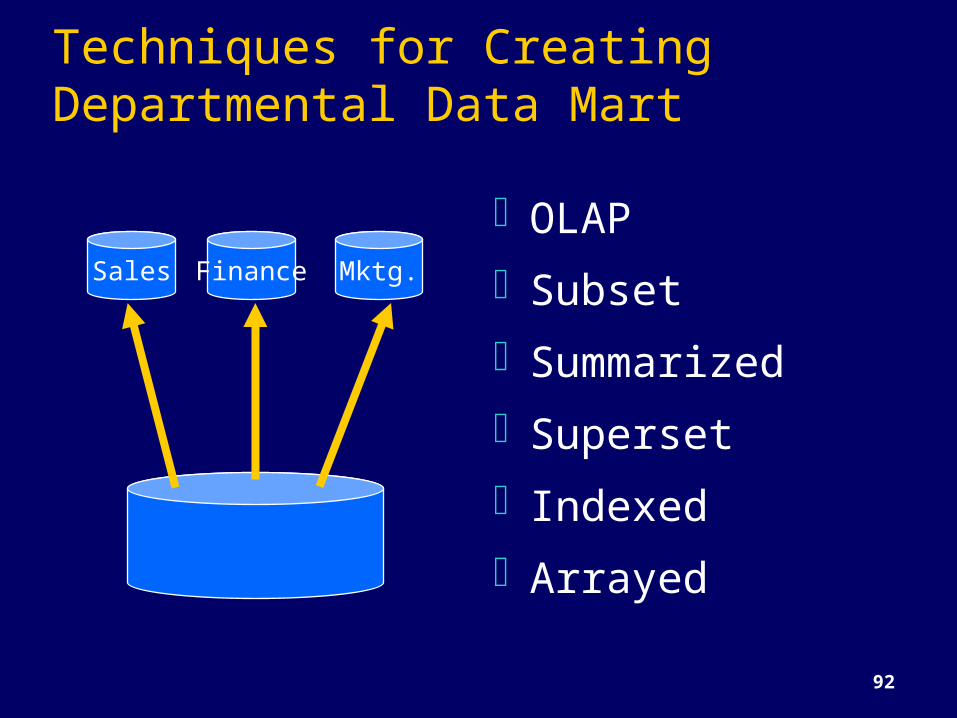
Techniques for Creating Departmental Data Mart
OLAPSubsetSummarizedSupersetIndexedArrayed
Sales Mktg.Finance
93
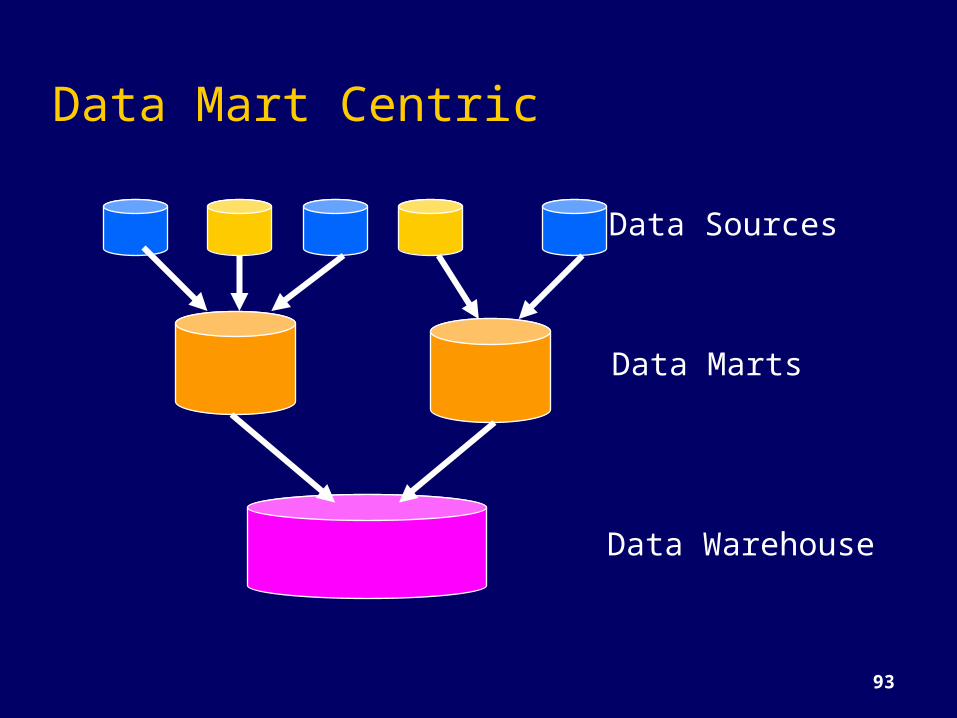
Data Mart Centric
Data Marts
Data Sources
Data Warehouse
94
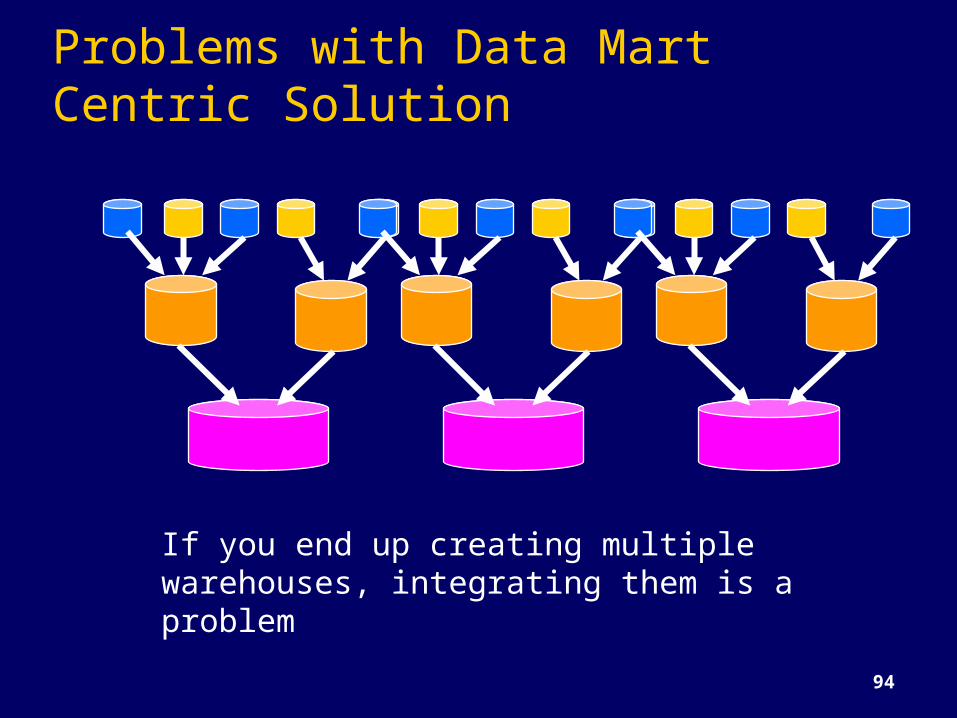
Problems with Data Mart Centric Solution
If you end up creating multiple warehouses, integrating them is a problem
95
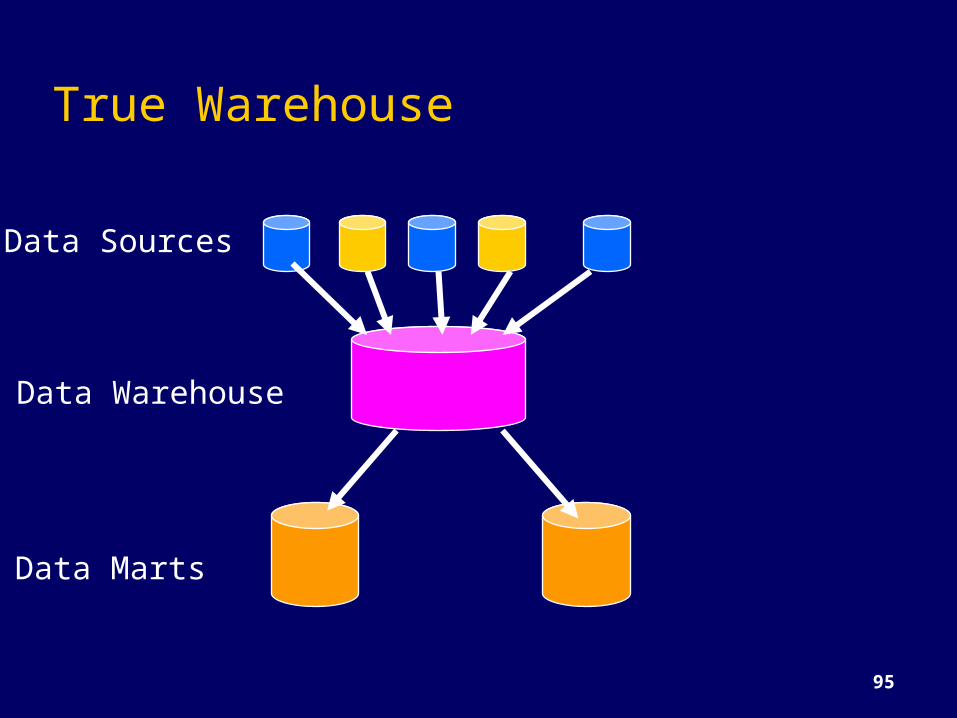
True Warehouse
Data Marts
Data Sources
Data Warehouse
96
Query Processing
Indexing
Pre computed views/aggregates
SQL extensions
97
Indexing TechniquesExploiting indexes to reduce scanning
of data is of crucial importanceBitmap IndexesJoin IndexesOther Issues
Text indexing Parallelizing and sequencing of index
builds and incremental updates
98
Indexing Techniques
Bitmap index: A collection of bitmaps -- one for each
distinct value of the column Each bitmap has N bits where N is the
number of rows in the table A bit corresponding to a value v for a
row r is set if and only if r has the value for the indexed attribute
99
BitMap IndexesAn alternative representation of RID-listSpecially advantageous for low-cardinality
domainsRepresent each row of a table by a bit and
the table as a bit vectorThere is a distinct bit vector Bv for each value
v for the domainExample: the attribute sex has values M and
F. A table of 100 million people needs 2 lists of 100 million bits
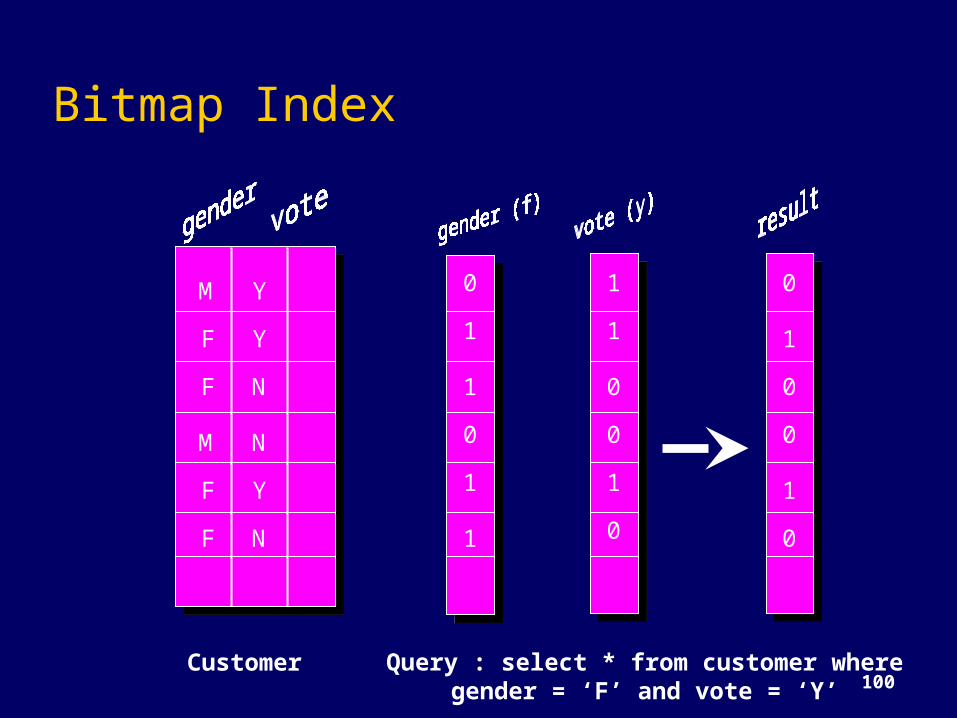
100Customer Query : select * from customer where
gender = ‘F’ and vote = ‘Y’
0
00
0
0
000
0
1
1
1
1
11
1
1
1
Bitmap Index
MFF
FF
M
YY
Y
N
N
N
101
Bit Map Index
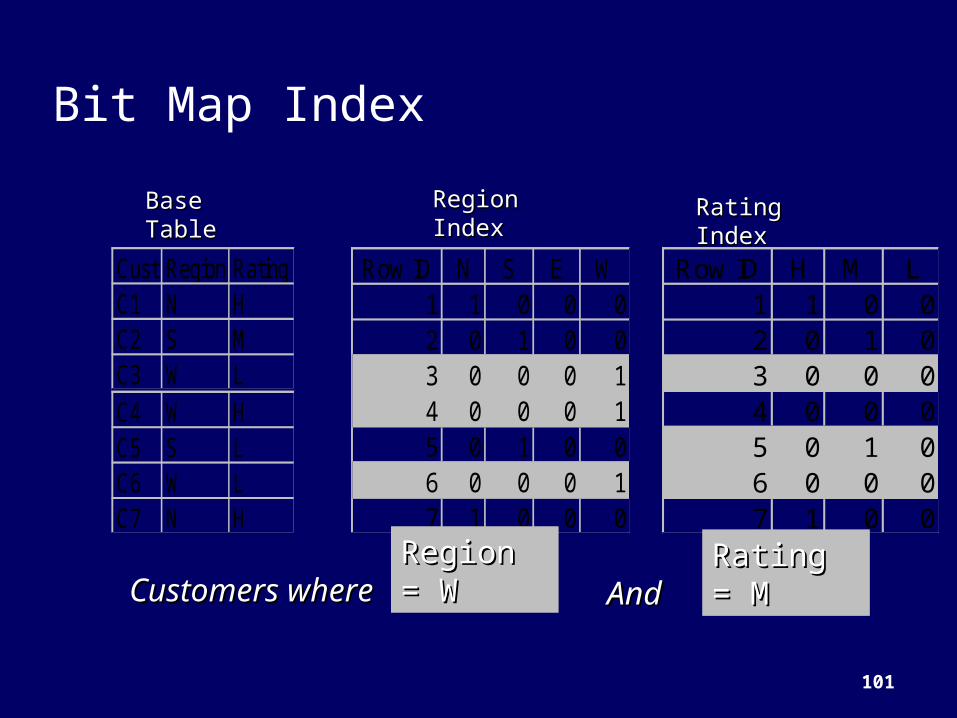
Cust Region RatingC1 N HC2 S MC3 W LC4 W HC5 S LC6 W LC7 N H
Base Base TableTable
Row ID N S E W1 1 0 0 02 0 1 0 03 0 0 0 14 0 0 0 15 0 1 0 06 0 0 0 17 1 0 0 0
Row ID H M L1 1 0 02 0 1 03 0 0 04 0 0 05 0 1 06 0 0 07 1 0 0
Rating IndexRating IndexRegion Region IndexIndex
Customers whereCustomers where Region = Region = WW
Rating = Rating = MMAndAnd
102
BitMap IndexesComparison, join and aggregation operations
are reduced to bit arithmetic with dramatic improvement in processing time
Significant reduction in space and I/O (30:1)Adapted for higher cardinality domains as well.Compression (e.g., run-length encoding)
exploitedProducts that support bitmaps: Model 204,
TargetIndex (Redbrick), IQ (Sybase), Oracle 7.3
103
Join Indexes
Pre-computed joinsA join index between a fact table and a
dimension table correlates a dimension tuple with the fact tuples that have the same value on the common dimensional attribute e.g., a join index on city dimension of calls
fact table correlates for each city the calls (in the calls
table) from that city
104
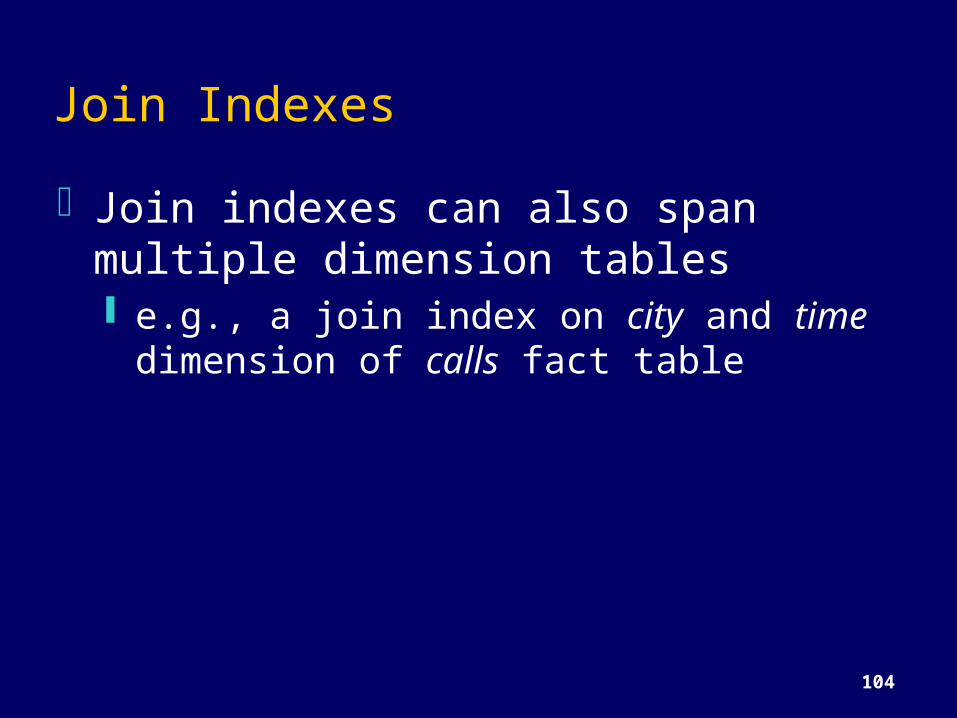
Join IndexesJoin indexes can also span multiple
dimension tables e.g., a join index on city and time
dimension of calls fact table
105
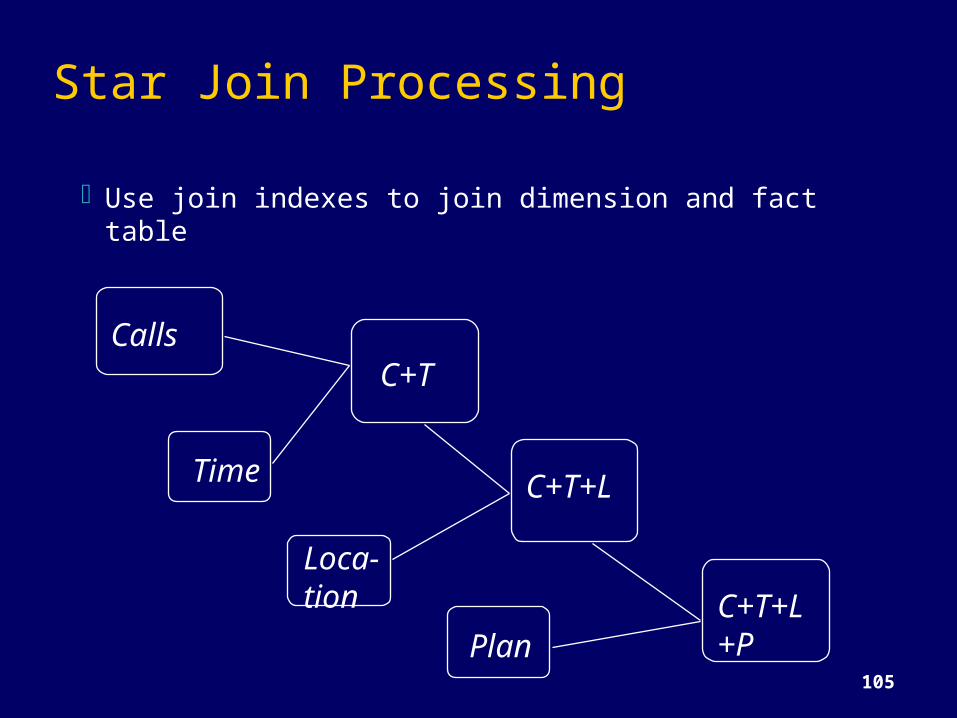
Star Join Processing
Use join indexes to join dimension and fact table
CallsC+T
C+T+L
C+T+L+P
Time
Loca-tion
Plan
106
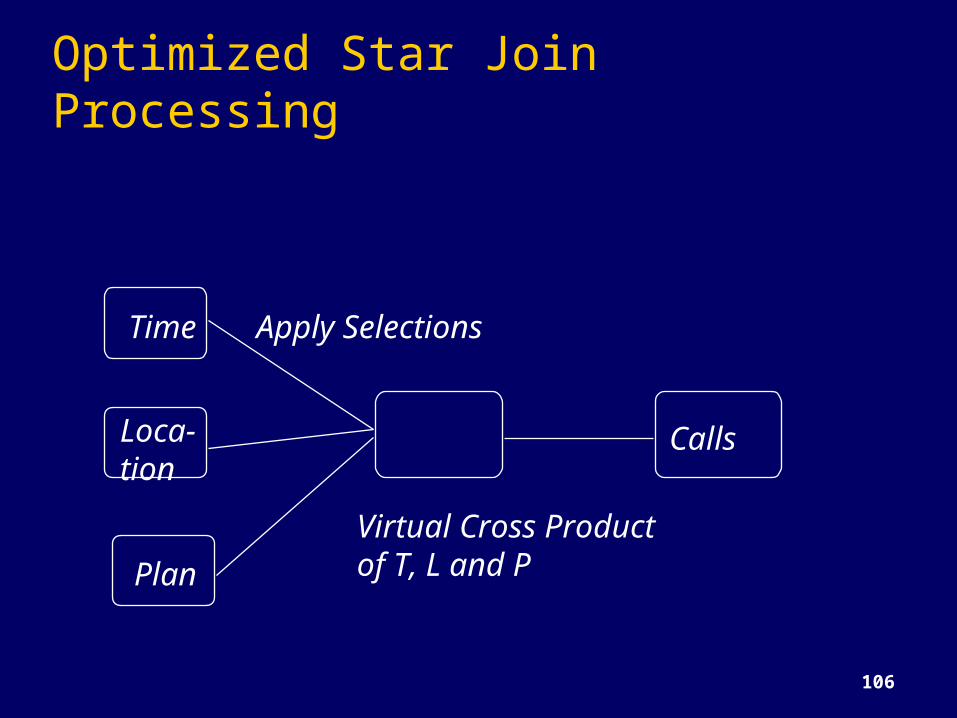
Optimized Star Join Processing
Time
Loca-tion
Plan
Calls
Virtual Cross Productof T, L and P
Apply Selections
107
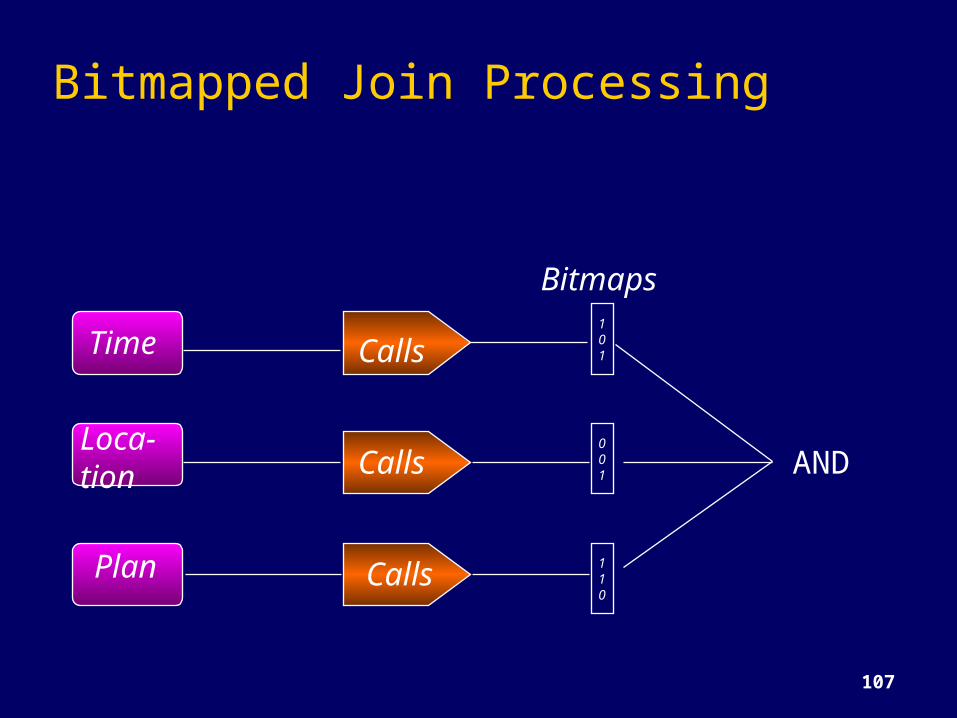
Bitmapped Join Processing
AND
Time
Loca-tion
Plan
Calls
Calls
Calls
Bitmaps101
001
110
108
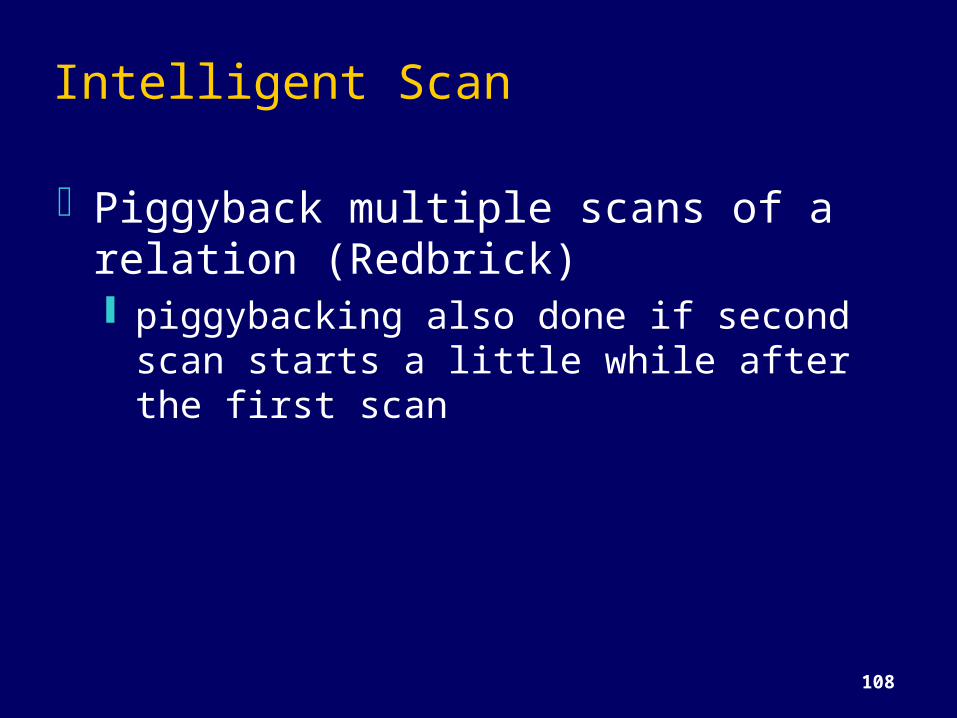
Intelligent Scan
Piggyback multiple scans of a relation (Redbrick) piggybacking also done if second scan
starts a little while after the first scan
109
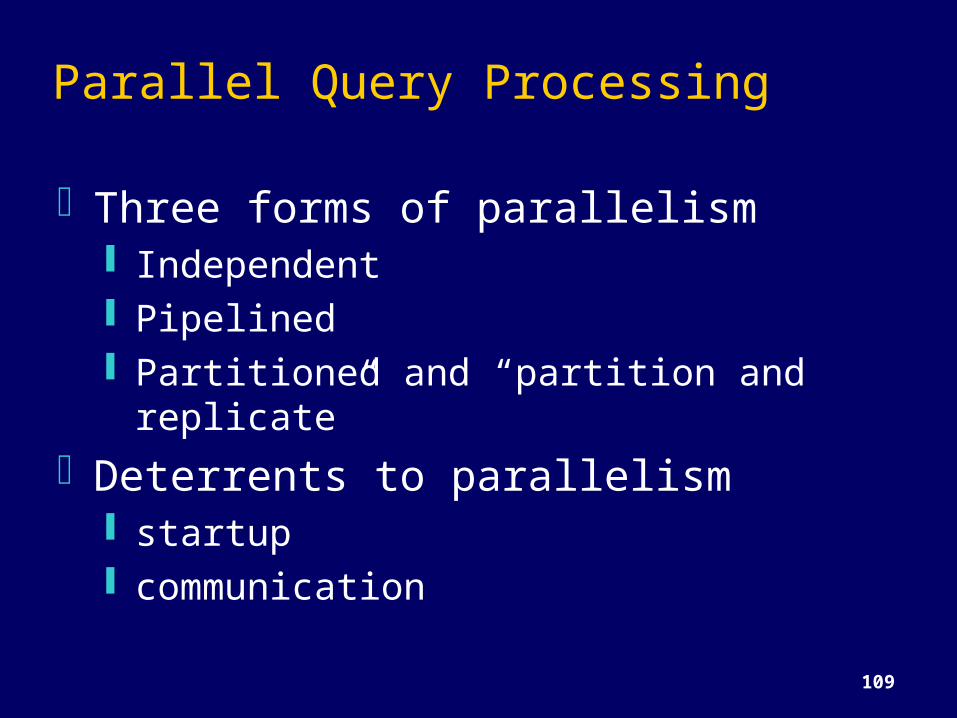
Parallel Query Processing
Three forms of parallelism Independent Pipelined Partitioned and “partition and replicate”
Deterrents to parallelism startup communication
110
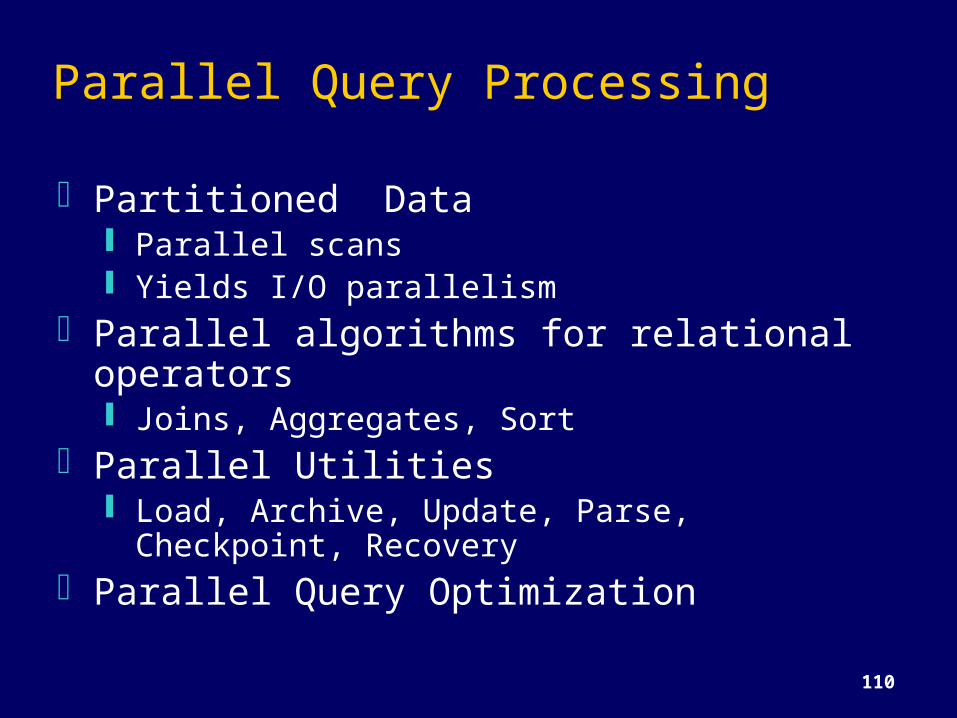
Parallel Query Processing
Partitioned Data Parallel scans Yields I/O parallelism
Parallel algorithms for relational operators Joins, Aggregates, Sort
Parallel Utilities Load, Archive, Update, Parse, Checkpoint,
Recovery Parallel Query Optimization
111
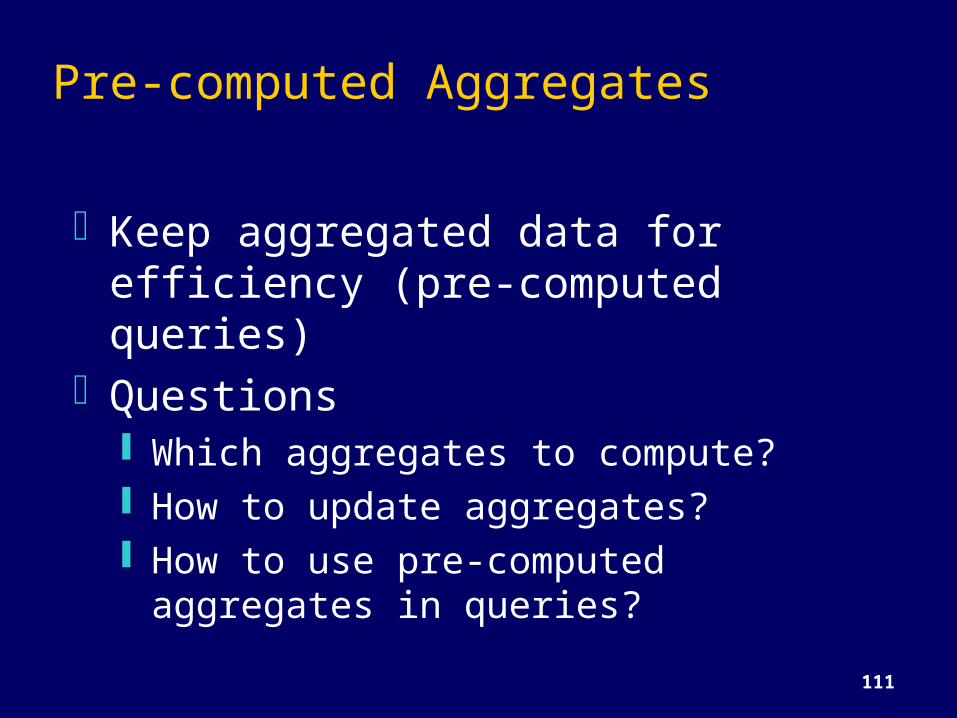
Pre-computed Aggregates
Keep aggregated data for efficiency (pre-computed queries)
Questions Which aggregates to compute? How to update aggregates? How to use pre-computed aggregates
in queries?
112
Pre-computed AggregatesAggregated table can be maintained
by the warehouse server middle tier client applications
Pre-computed aggregates -- special case of materialized views -- same questions and issues remain
113
SQL Extensions
Extended family of aggregate functions rank (top 10 customers) percentile (top 30% of customers) median, mode Object Relational Systems allow
addition of new aggregate functions
114
SQL ExtensionsReporting features
running total, cumulative totalsCube operator
group by on all subsets of a set of attributes (month,city)
redundant scan and sorting of data can be avoided
115
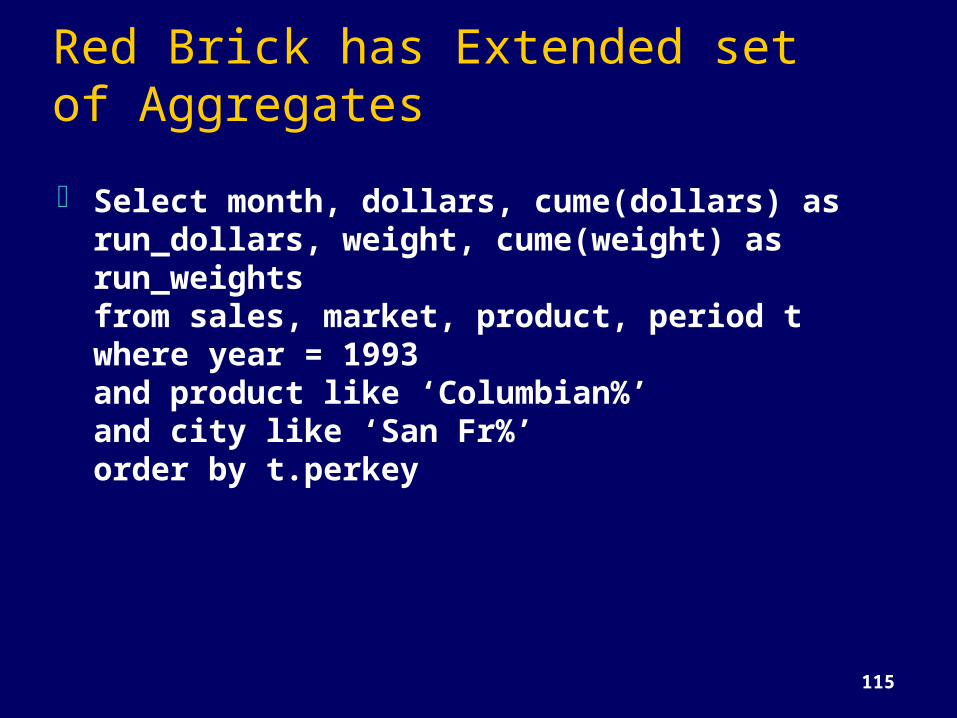
Red Brick has Extended set of Aggregates Select month, dollars, cume(dollars) as run_dollars, weight, cume(weight) as run_weightsfrom sales, market, product, period twhere year = 1993and product like ‘Columbian%’and city like ‘San Fr%’order by t.perkey
116
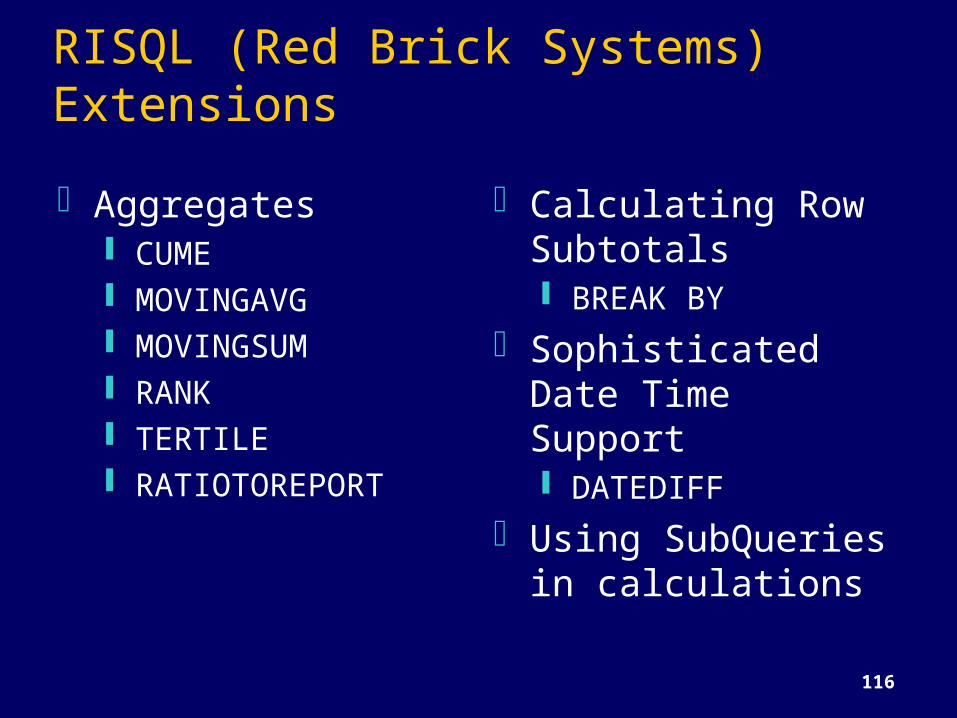
RISQL (Red Brick Systems) ExtensionsAggregates
CUME MOVINGAVG MOVINGSUM RANK TERTILE RATIOTOREPORT
Calculating Row Subtotals BREAK BY
Sophisticated Date Time Support DATEDIFF
Using SubQueries in calculations
117
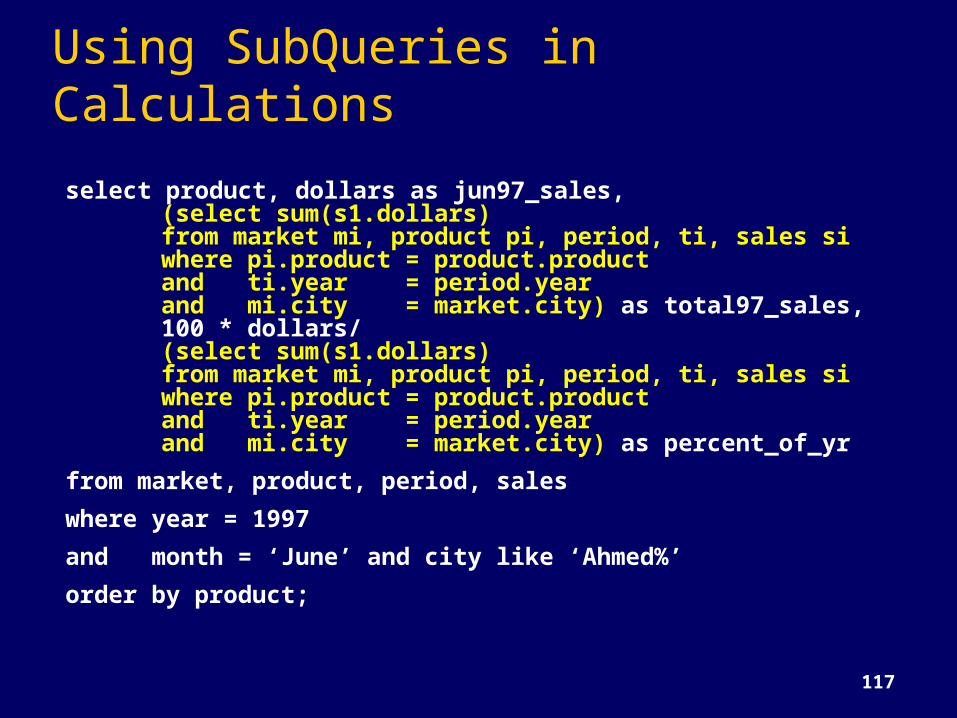
Using SubQueries in Calculationsselect product, dollars as jun97_sales,
(select sum(s1.dollars)from market mi, product pi, period, ti, sales siwhere pi.product = product.productand ti.year = period.yearand mi.city = market.city) as total97_sales,100 * dollars/(select sum(s1.dollars)from market mi, product pi, period, ti, sales siwhere pi.product = product.productand ti.year = period.yearand mi.city = market.city) as percent_of_yr
from market, product, period, saleswhere year = 1997and month = ‘June’ and city like ‘Ahmed%’order by product;
118
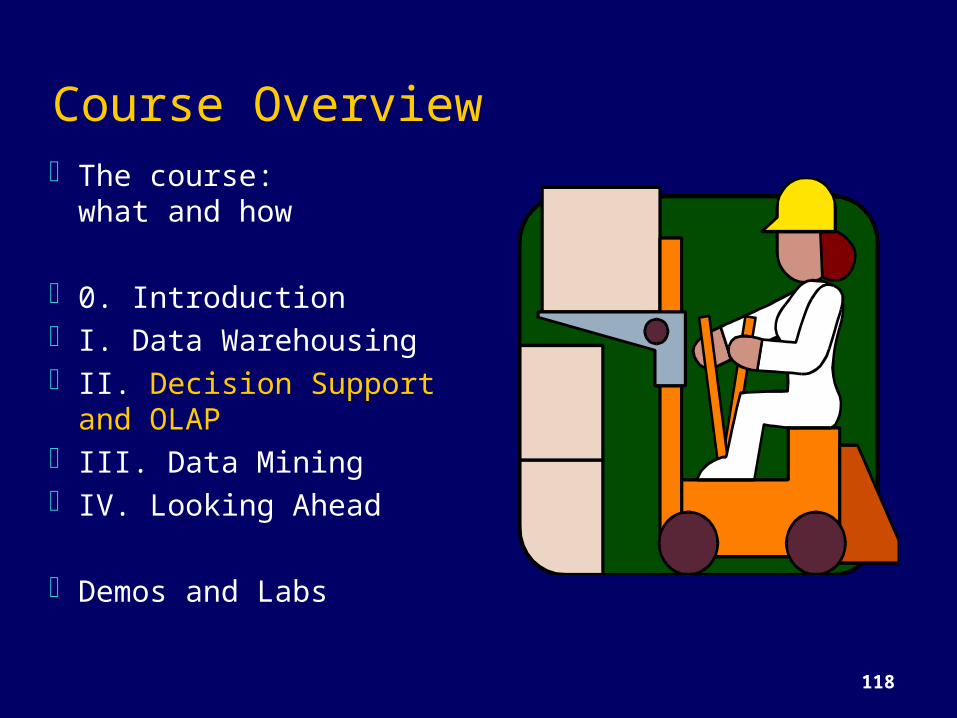
Course OverviewThe course: what and
how
0. IntroductionI. Data WarehousingII. Decision Support and
OLAPIII. Data MiningIV. Looking Ahead
Demos and Labs
II. On-Line Analytical Processing (OLAP)
Making Decision Support Possible
120
Limitations of SQL
“A Freshman in Business needs a Ph.D. in SQL”
-- Ralph Kimball
121
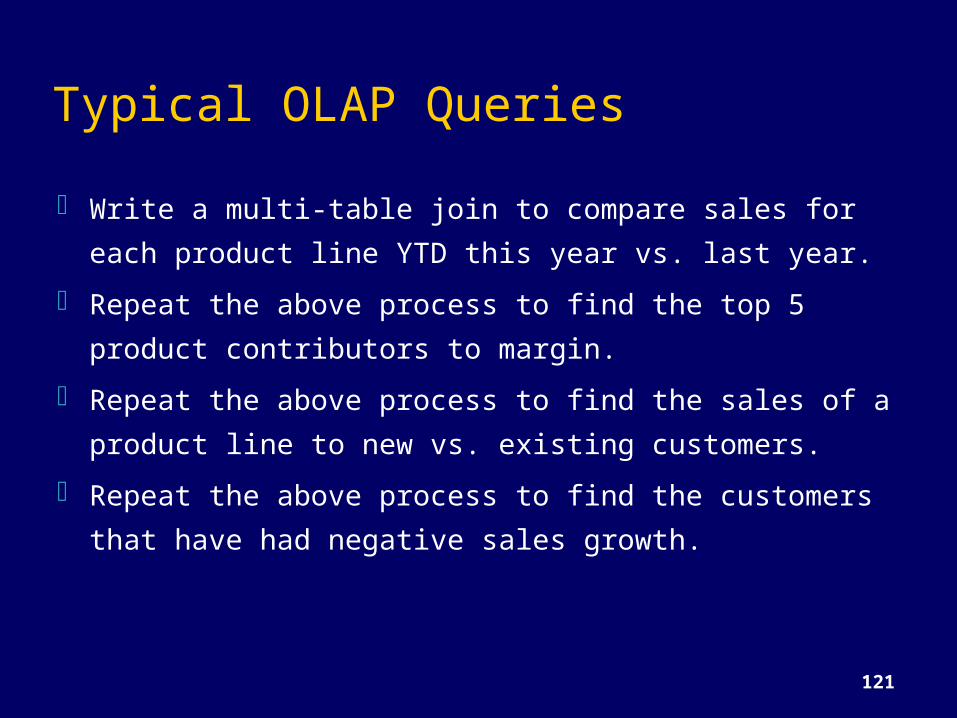
Typical OLAP Queries Write a multi-table join to compare sales for each
product line YTD this year vs. last year. Repeat the above process to find the top 5
product contributors to margin. Repeat the above process to find the sales of a
product line to new vs. existing customers. Repeat the above process to find the customers
that have had negative sales growth.
122
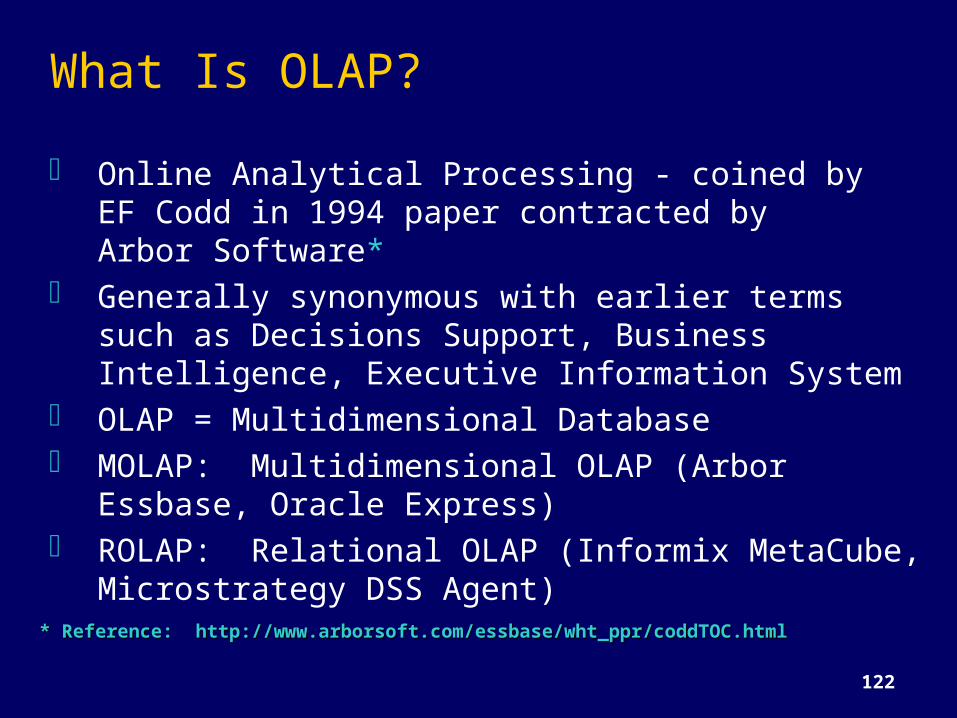
* Reference: http://www.arborsoft.com/essbase/wht_ppr/coddTOC.html* Reference: http://www.arborsoft.com/essbase/wht_ppr/coddTOC.html
What Is OLAP? Online Analytical Processing - coined by
EF Codd in 1994 paper contracted by Arbor Software*
Generally synonymous with earlier terms such as Decisions Support, Business Intelligence, Executive Information System
OLAP = Multidimensional Database MOLAP: Multidimensional OLAP (Arbor Essbase,
Oracle Express) ROLAP: Relational OLAP (Informix MetaCube,
Microstrategy DSS Agent)
123
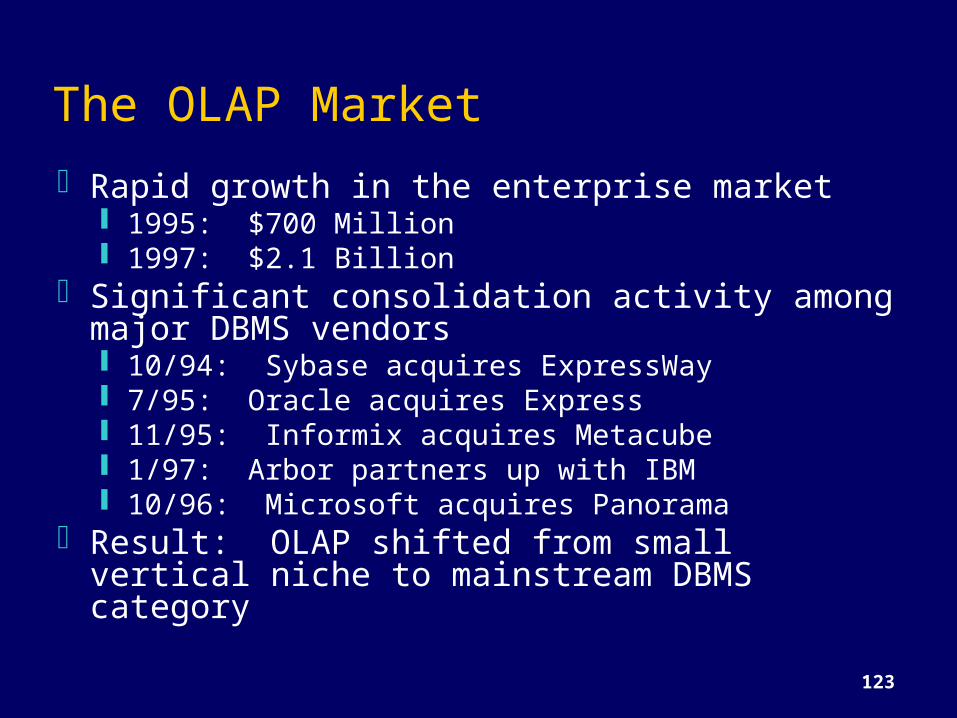
The OLAP Market Rapid growth in the enterprise market
1995: $700 Million 1997: $2.1 Billion
Significant consolidation activity among major DBMS vendors 10/94: Sybase acquires ExpressWay 7/95: Oracle acquires Express 11/95: Informix acquires Metacube 1/97: Arbor partners up with IBM 10/96: Microsoft acquires Panorama
Result: OLAP shifted from small vertical niche to mainstream DBMS category
124
Strengths of OLAP
It is a powerful visualization paradigmIt provides fast, interactive response timesIt is good for analyzing time seriesIt can be useful to find some clusters and
outliersMany vendors offer OLAP tools
125
Nigel Pendse, Richard Creath - The OLAP ReportNigel Pendse, Richard Creath - The OLAP Report
OLAP Is FASMIFastAnalysisSharedMultidimensionalInformation
126MonthMonth
1 1 22 3 3 4 4 776 6 5 5
Prod
uct
Prod
uct
Toothpaste Toothpaste
JuiceJuiceColaColaMilk Milk
CreamCream
Soap Soap
Region
Region
WWS S
N N
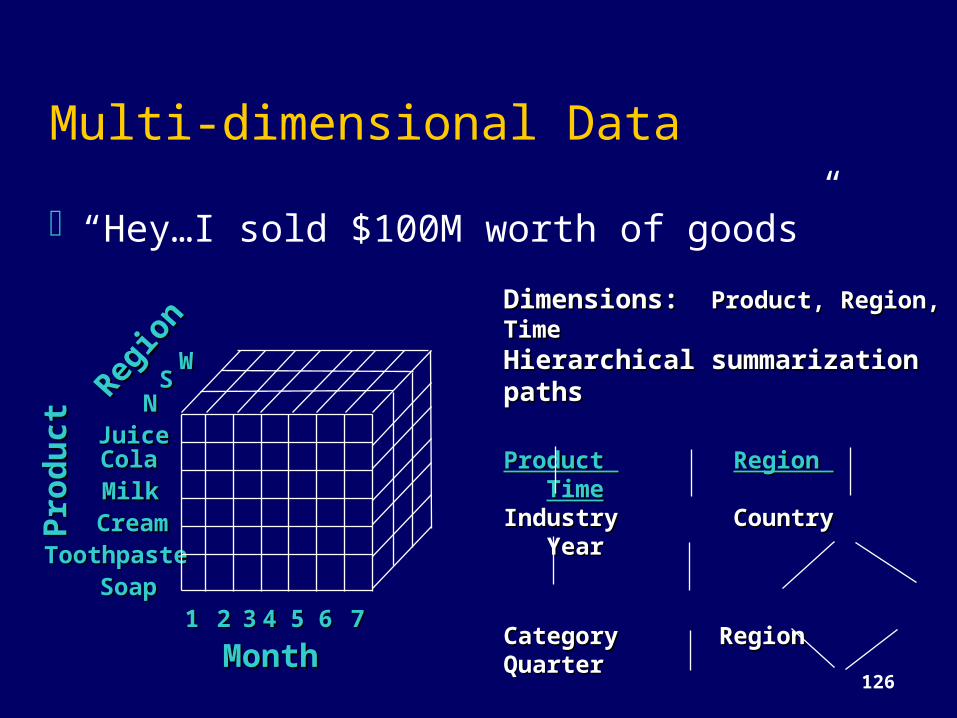
Dimensions: Dimensions: Product, Region, TimeProduct, Region, TimeHierarchical summarization pathsHierarchical summarization paths
Product Product Region Region TimeTimeIndustry Country YearIndustry Country Year
Category Region Quarter Category Region Quarter
Product City Month WeekProduct City Month Week
Office DayOffice Day
Multi-dimensional Data“Hey…I sold $100M worth of goods”
127
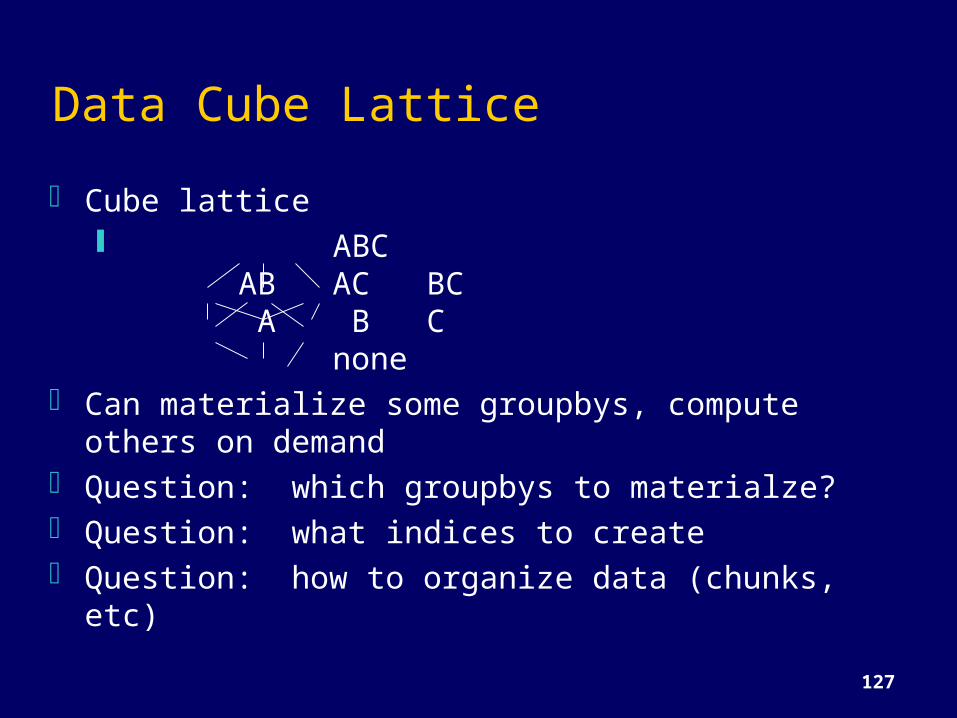
Data Cube Lattice Cube lattice
ABC AB AC BC A B C none
Can materialize some groupbys, compute others on demand
Question: which groupbys to materialze? Question: what indices to create Question: how to organize data (chunks, etc)
128
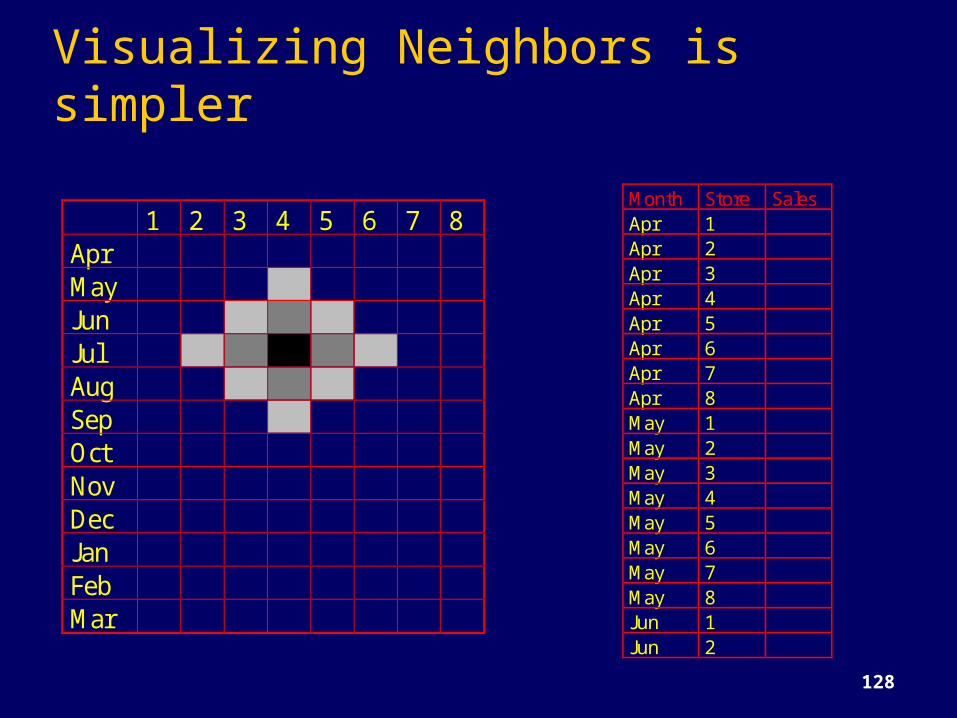
Visualizing Neighbors is simpler
1 2 3 4 5 6 7 8AprMayJunJulAugSepOctNovDecJanFebMar
Month Store SalesApr 1Apr 2Apr 3Apr 4Apr 5Apr 6Apr 7Apr 8May 1May 2May 3May 4May 5May 6May 7May 8Jun 1Jun 2
129
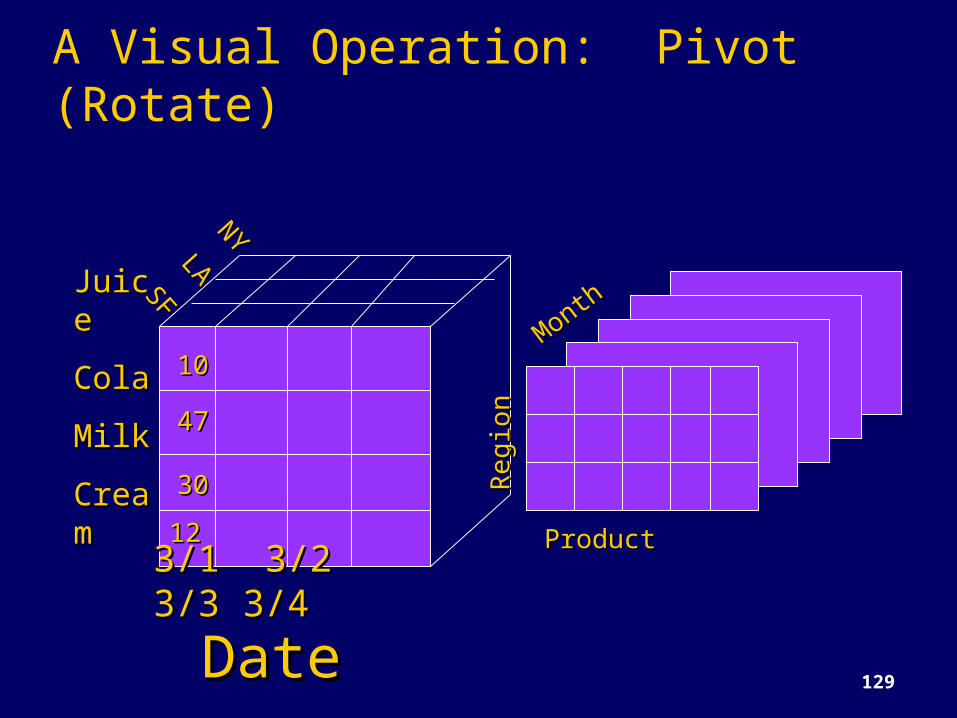
A Visual Operation: Pivot (Rotate)
1010
4747
30301212
JuiceJuiceColaColaMilk Milk CreaCreamm
NYNYLALASFSF
3/1 3/2 3/3 3/1 3/2 3/3 3/43/4
DateDate
MonthMonth
Regi
onRe
gion
ProductProduct
130
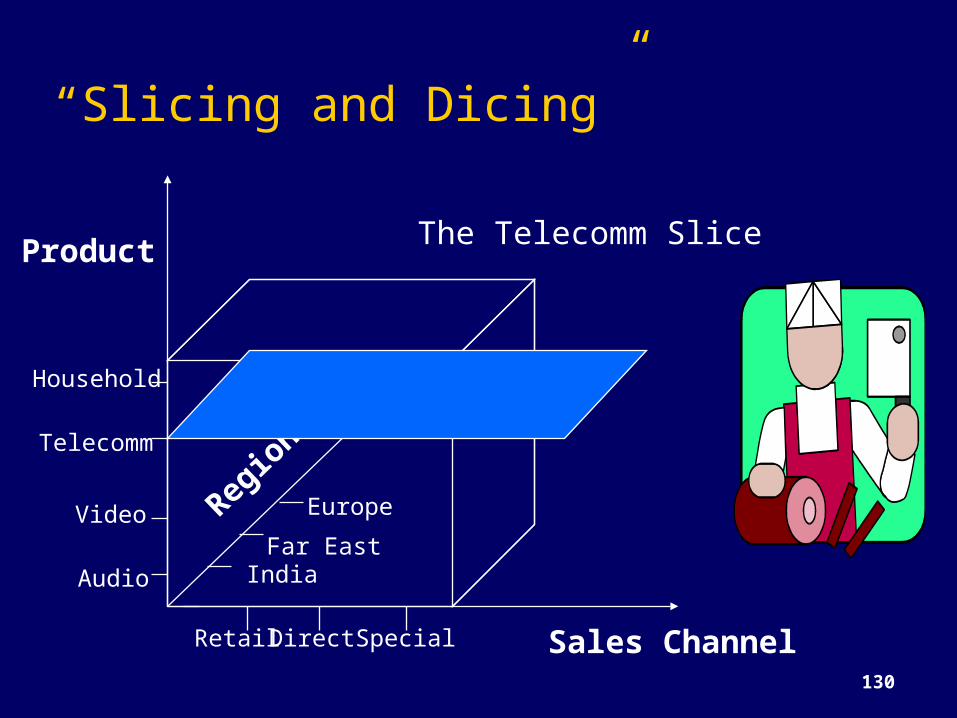
“Slicing and Dicing”
Product
Sales Channel
Region
s
Retail Direct Special
Household
Telecomm
Video
Audio IndiaFar East
Europe
The Telecomm Slice
131
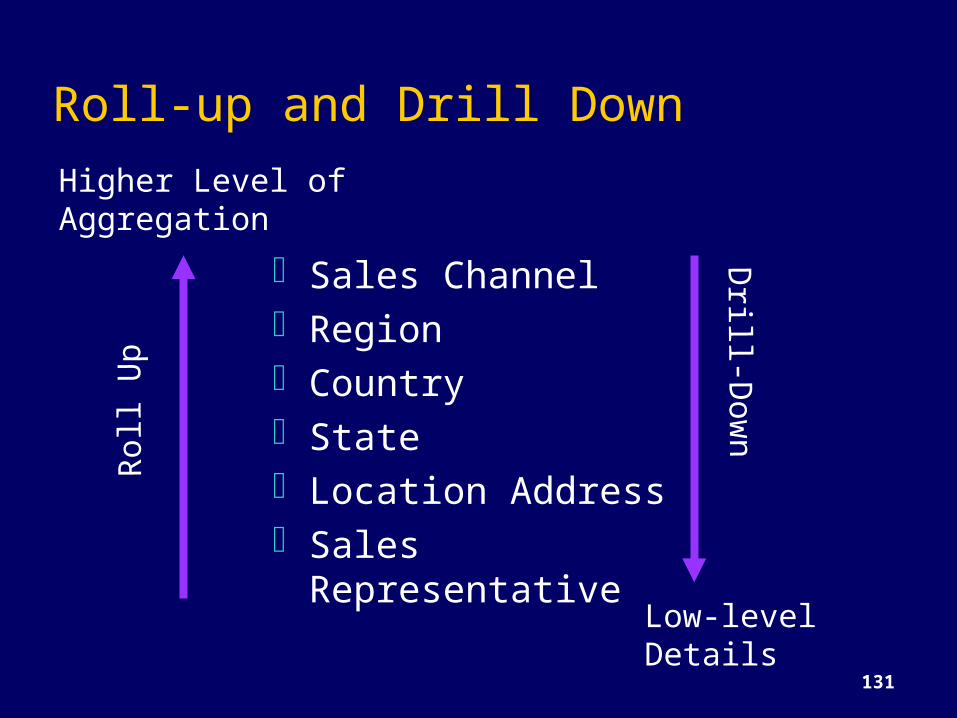
Roll-up and Drill Down
Sales ChannelRegionCountryState Location AddressSales
Representative
Roll
UpHigher Level ofAggregation
Low-levelDetails
Drill-Down
132
Nature of OLAP AnalysisAggregation -- (total sales,
percent-to-total)Comparison -- Budget vs.
ExpensesRanking -- Top 10, quartile
analysisAccess to detailed and
aggregate dataComplex criteria
specificationVisualization
133
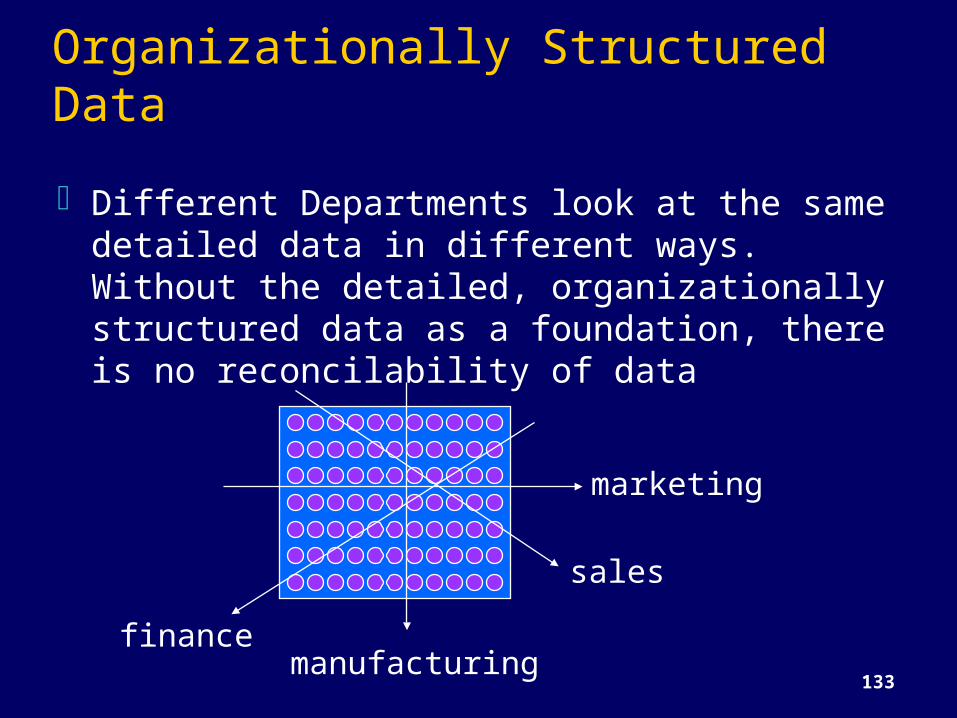
Organizationally Structured DataDifferent Departments look at the same
detailed data in different ways. Without the detailed, organizationally structured data as a foundation, there is no reconcilability of data
marketing
manufacturing
salesfinance
134
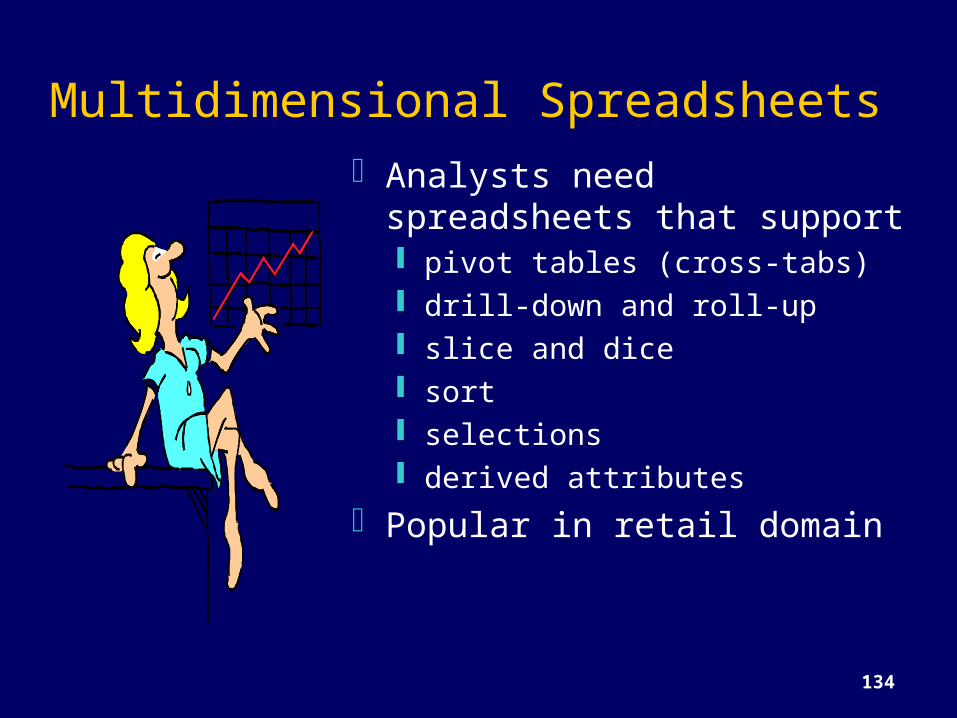
Multidimensional SpreadsheetsAnalysts need spreadsheets
that support pivot tables (cross-tabs) drill-down and roll-up slice and dice sort selections derived attributes
Popular in retail domain
135
OLAP - Data Cube
Idea: analysts need to group data in many different ways eg. Sales(region, product, prodtype, prodstyle,
date, saleamount) saleamount is a measure attribute, rest are
dimension attributes groupby every subset of the other attributes
materialize (precompute and store) groupbys to give online response
Also: hierarchies on attributes: date -> weekday, date -> month -> quarter -> year
136
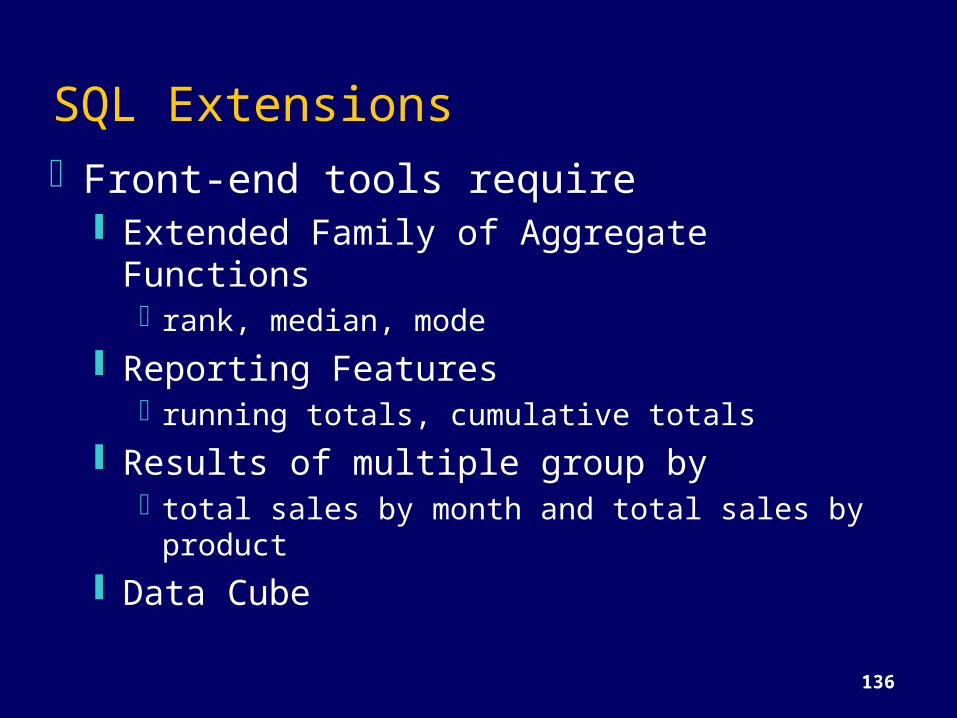
SQL ExtensionsFront-end tools require
Extended Family of Aggregate Functionsrank, median, mode
Reporting Featuresrunning totals, cumulative totals
Results of multiple group bytotal sales by month and total sales by
product Data Cube
137
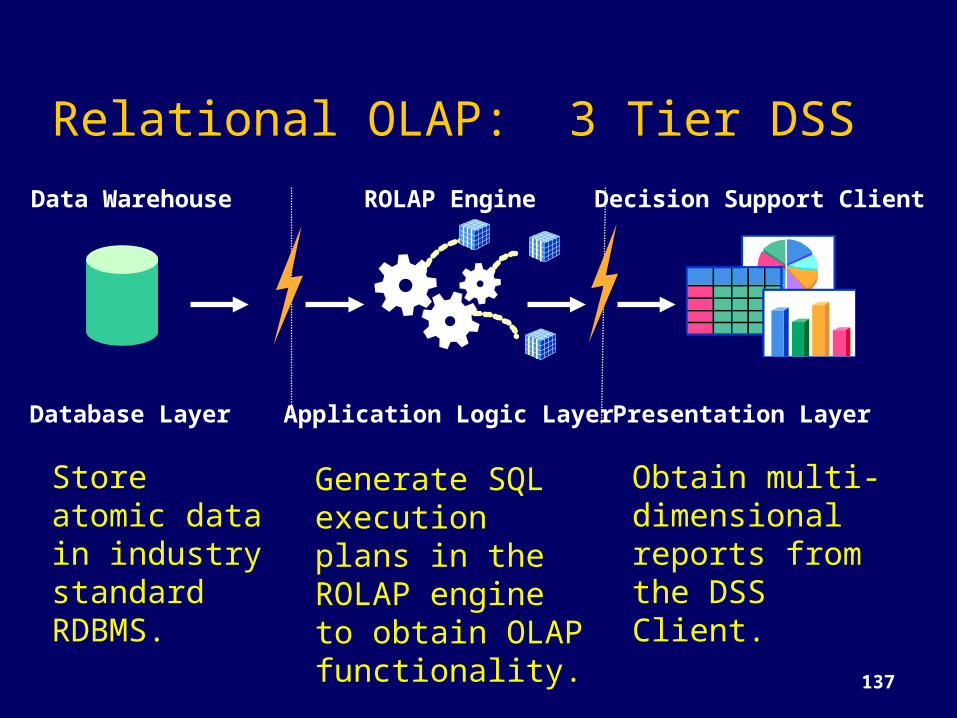
Relational OLAP: 3 Tier DSSData Warehouse ROLAP Engine Decision Support Client
Database Layer Application Logic Layer Presentation Layer
Store atomic data in industry standard RDBMS.
Generate SQL execution plans in the ROLAP engine to obtain OLAP functionality.
Obtain multi-dimensional reports from the DSS Client.
138
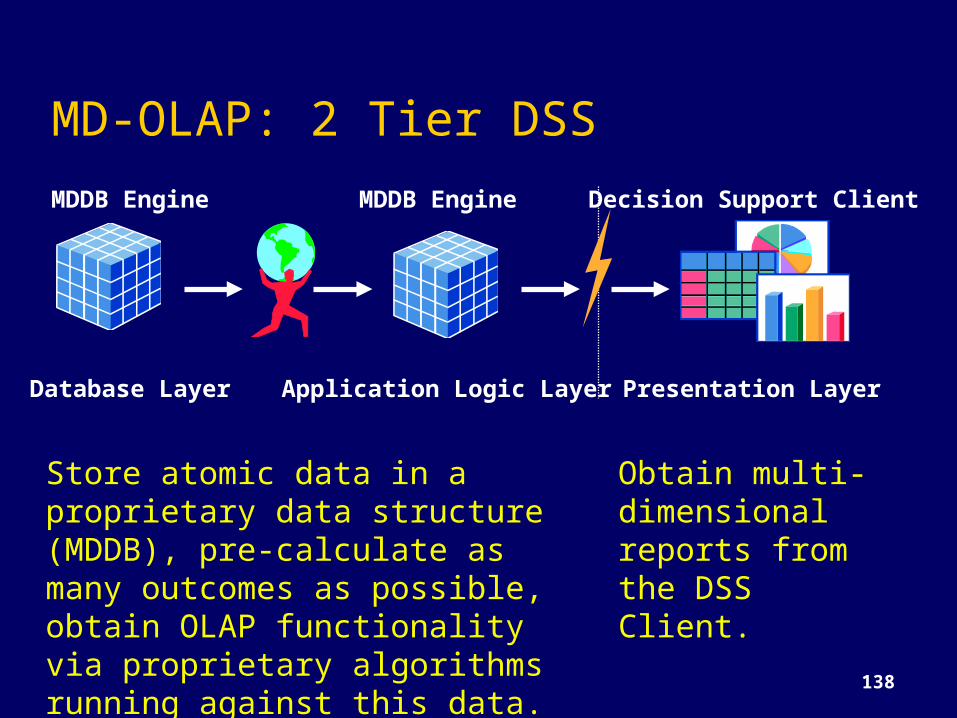
MD-OLAP: 2 Tier DSSMDDB Engine MDDB Engine Decision Support Client
Database Layer Application Logic Layer Presentation Layer
Store atomic data in a proprietary data structure (MDDB), pre-calculate as many outcomes as possible, obtain OLAP functionality via proprietary algorithms running against this data.
Obtain multi-dimensional reports from the DSS Client.
139
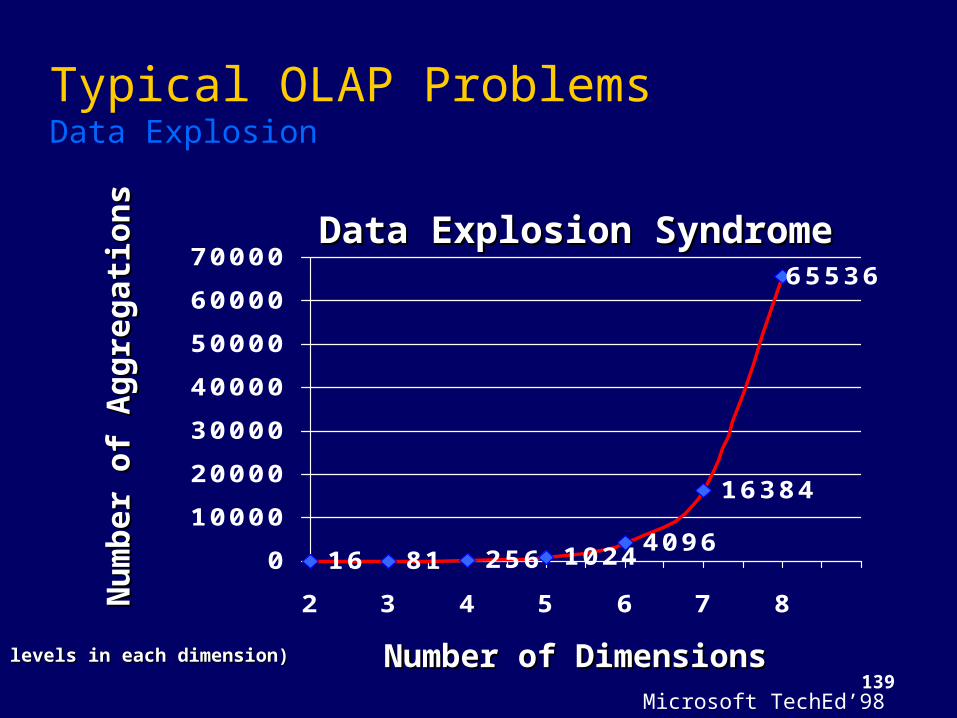
16 81 256 10244096
16384
65536
010000200003000040000500006000070000
2 3 4 5 6 7 8
Data Explosion SyndromeData Explosion Syndrome
Number of DimensionsNumber of Dimensions
Num
ber o
f Agg
rega
tions
Num
ber o
f Agg
rega
tions
(4 levels in each dimension)(4 levels in each dimension)
Typical OLAP Problems Data Explosion
Microsoft TechEd’98
140
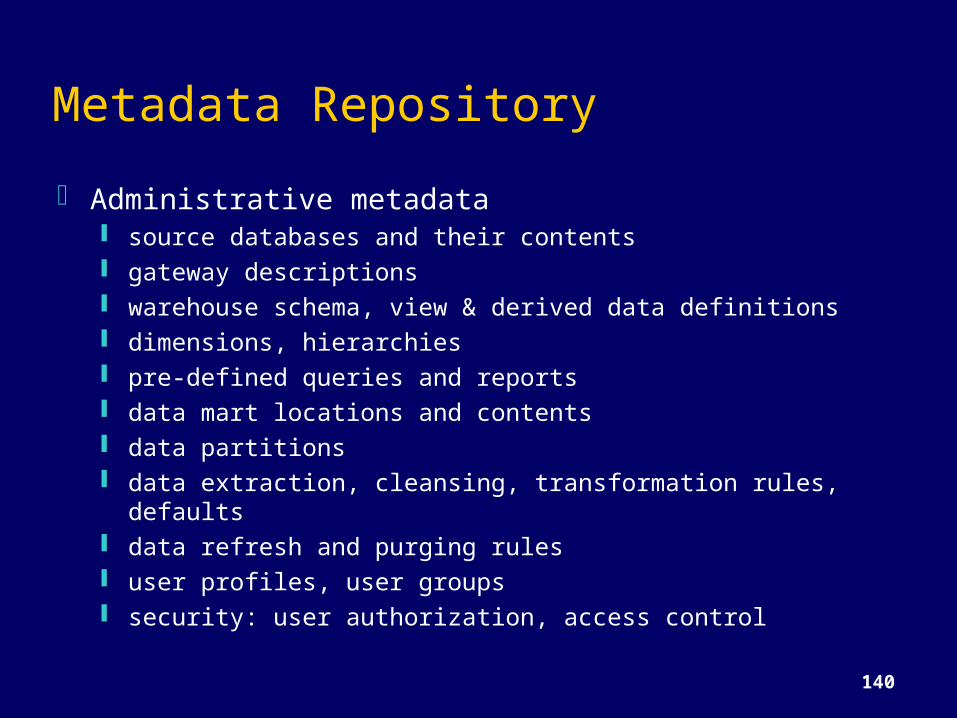
Metadata Repository Administrative metadata
source databases and their contents gateway descriptions warehouse schema, view & derived data definitions dimensions, hierarchies pre-defined queries and reports data mart locations and contents data partitions data extraction, cleansing, transformation rules, defaults data refresh and purging rules user profiles, user groups security: user authorization, access control
141
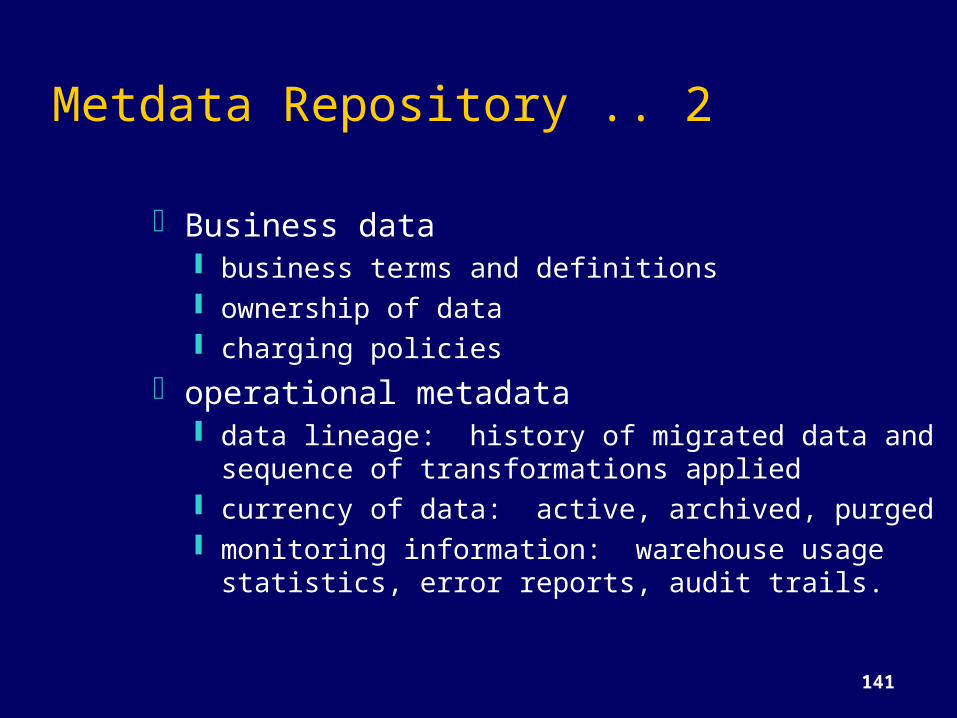
Metdata Repository .. 2
Business data business terms and definitions ownership of data charging policies
operational metadata data lineage: history of migrated data and
sequence of transformations applied currency of data: active, archived, purged monitoring information: warehouse usage
statistics, error reports, audit trails.
Recipe for a Successful Warehouse
143
For a Successful Warehouse
From day one establish that warehousing is a joint user/builder project
Establish that maintaining data quality will be an ONGOING joint user/builder responsibility
Train the users one step at a timeConsider doing a high level corporate data
model in no more than three weeks
From Larry Greenfield, http://pwp.starnetinc.com/larryg/index.html
144
For a Successful WarehouseLook closely at the data extracting,
cleaning, and loading tools Implement a user accessible automated
directory to information stored in the warehouse
Determine a plan to test the integrity of the data in the warehouse
From the start get warehouse users in the habit of 'testing' complex queries
145
For a Successful WarehouseCoordinate system roll-out with network
administration personnel When in a bind, ask others who have done
the same thing for advice Be on the lookout for small, but strategic,
projects Market and sell your data warehousing
systems
146
Data Warehouse Pitfalls You are going to spend much time extracting,
cleaning, and loading data Despite best efforts at project management, data
warehousing project scope will increase You are going to find problems with systems
feeding the data warehouse You will find the need to store data not being
captured by any existing system You will need to validate data not being validated
by transaction processing systems
147
Data Warehouse Pitfalls Some transaction processing systems feeding the
warehousing system will not contain detail Many warehouse end users will be trained and
never or seldom apply their training After end users receive query and report tools,
requests for IS written reports may increase Your warehouse users will develop conflicting
business rules Large scale data warehousing can become an
exercise in data homogenizing
148
Data Warehouse Pitfalls 'Overhead' can eat up great amounts of disk space The time it takes to load the warehouse will expand
to the amount of the time in the available window... and then some
Assigning security cannot be done with a transaction processing system mindset
You are building a HIGH maintenance system You will fail if you concentrate on resource
optimization to the neglect of project, data, and customer management issues and an understanding of what adds value to the customer
149
DW and OLAP Research Issues Data cleaning
focus on data inconsistencies, not schema differences data mining techniques
Physical Design design of summary tables, partitions, indexes tradeoffs in use of different indexes
Query processing selecting appropriate summary tables dynamic optimization with feedback acid test for query optimization: cost estimation, use of
transformations, search strategies partitioning query processing between OLAP server and
backend server.
150
DW and OLAP Research Issues .. 2Warehouse Management
detecting runaway queries resource management incremental refresh techniques computing summary tables during load failure recovery during load and refresh process management: scheduling queries, load
and refresh Query processing, caching use of workflow technology for process
management
Products, References, Useful Links
152
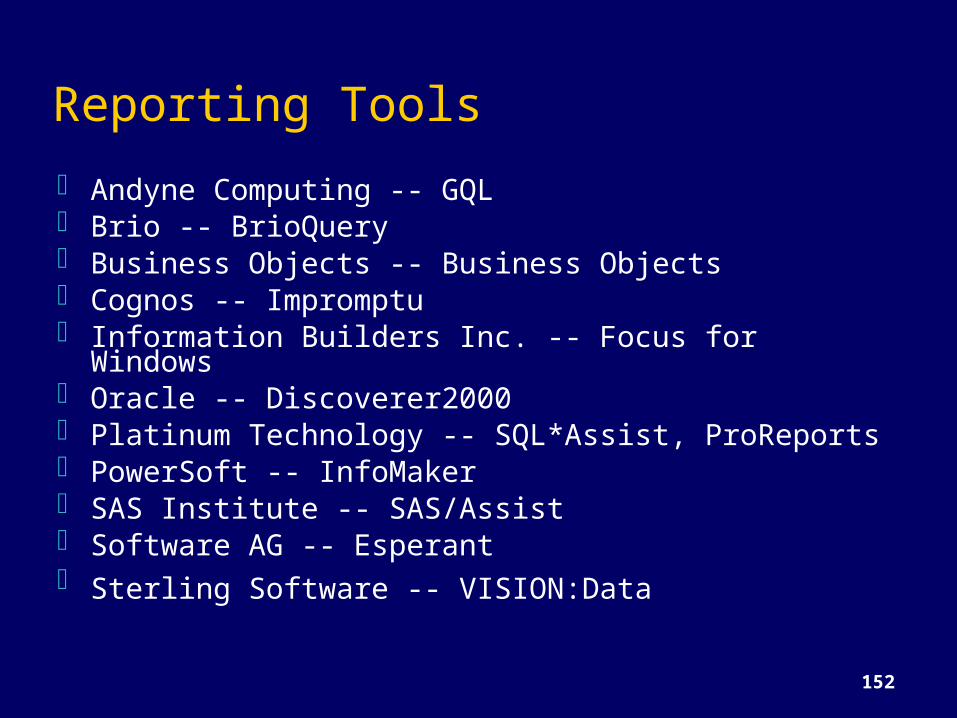
Reporting Tools Andyne Computing -- GQL Brio -- BrioQuery Business Objects -- Business Objects Cognos -- Impromptu Information Builders Inc. -- Focus for Windows Oracle -- Discoverer2000 Platinum Technology -- SQL*Assist, ProReports PowerSoft -- InfoMaker SAS Institute -- SAS/Assist Software AG -- Esperant Sterling Software -- VISION:Data
153
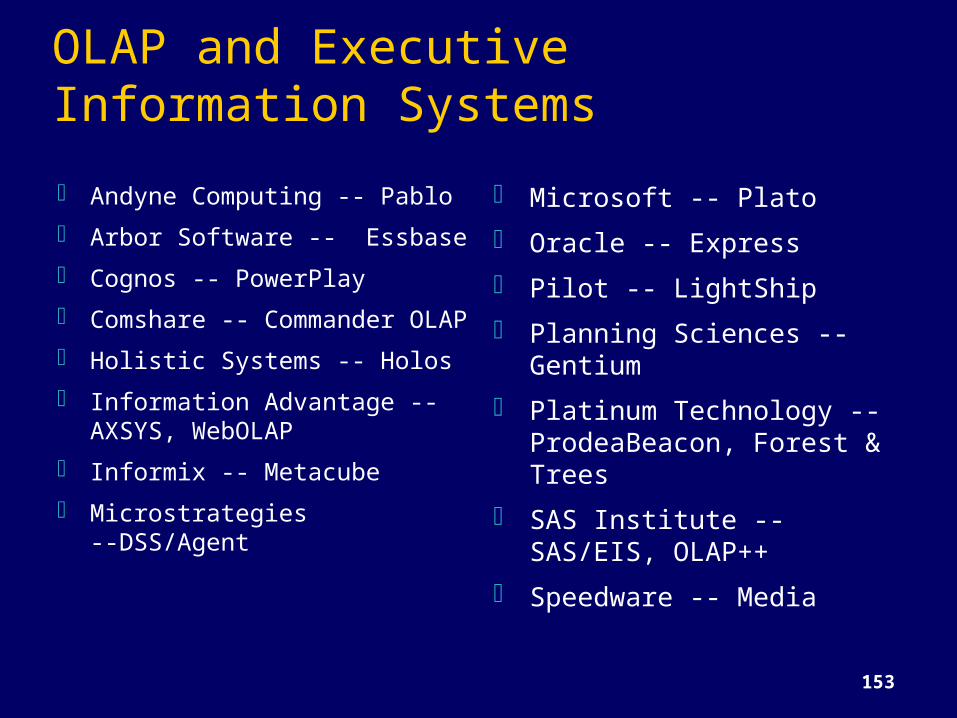
OLAP and Executive Information Systems Andyne Computing -- Pablo Arbor Software -- Essbase Cognos -- PowerPlay Comshare -- Commander
OLAP Holistic Systems -- Holos Information Advantage --
AXSYS, WebOLAP Informix -- Metacube Microstrategies --DSS/Agent
Microsoft -- Plato Oracle -- Express Pilot -- LightShip Planning Sciences --
Gentium Platinum Technology --
ProdeaBeacon, Forest & Trees
SAS Institute -- SAS/EIS, OLAP++
Speedware -- Media
154
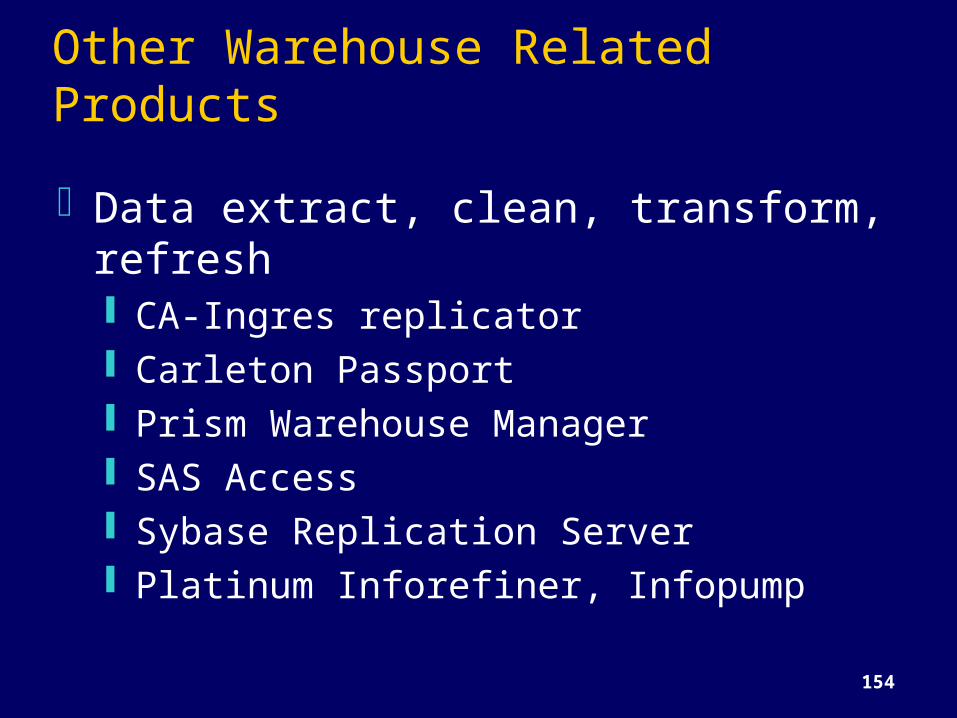
Other Warehouse Related ProductsData extract, clean, transform,
refresh CA-Ingres replicator Carleton Passport Prism Warehouse Manager SAS Access Sybase Replication Server Platinum Inforefiner, Infopump
155
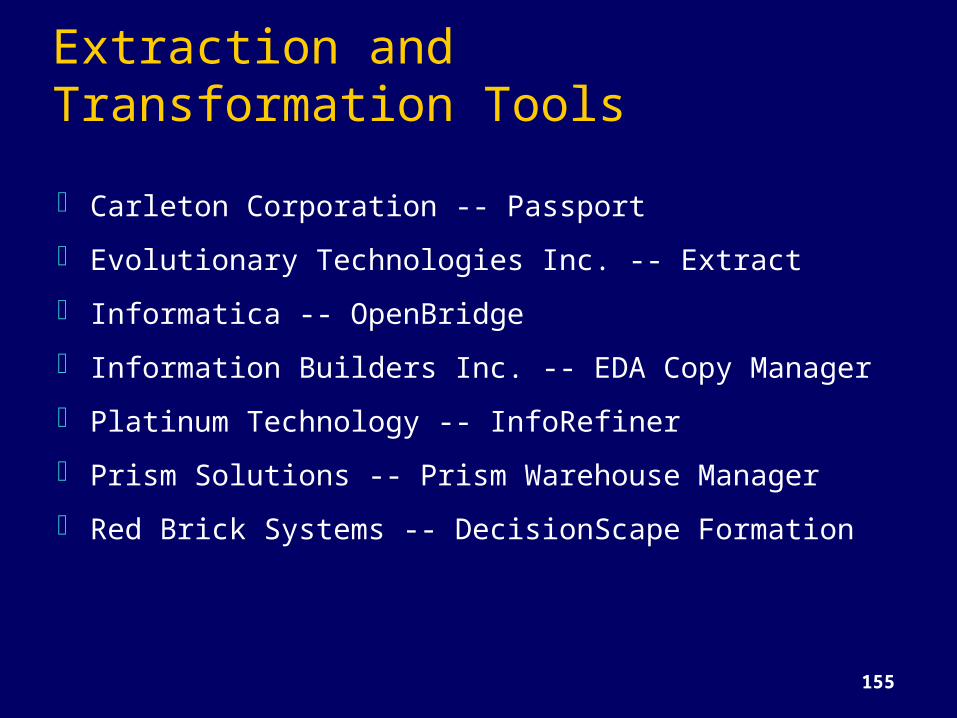
Extraction and Transformation Tools Carleton Corporation -- Passport Evolutionary Technologies Inc. -- Extract Informatica -- OpenBridge Information Builders Inc. -- EDA Copy Manager Platinum Technology -- InfoRefiner Prism Solutions -- Prism Warehouse Manager Red Brick Systems -- DecisionScape Formation
156
Scrubbing ToolsApertus -- Enterprise/Integrator Vality -- IPEPostal Soft
157
Warehouse ProductsComputer Associates -- CA-Ingres Hewlett-Packard -- Allbase/SQL Informix -- Informix, Informix XPSMicrosoft -- SQL Server Oracle -- Oracle7, Oracle Parallel ServerRed Brick -- Red Brick Warehouse SAS Institute -- SAS Software AG -- ADABAS Sybase -- SQL Server, IQ, MPP
158
Warehouse Server ProductsOracle 8Informix
Online Dynamic Server XPS --Extended Parallel Server Universal Server for object relational
applicationsSybase
Adaptive Server 11.5 Sybase MPP Sybase IQ
159
Warehouse Server ProductsRed Brick WarehouseTandem NonstopIBM
DB2 MVS Universal Server DB2 400
Teradata
160
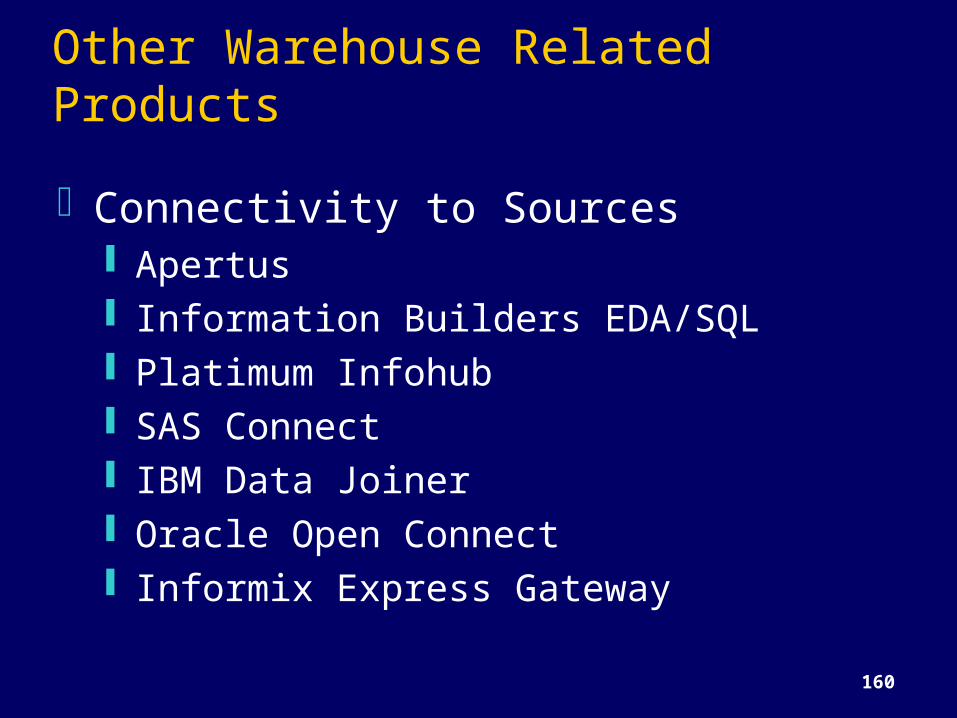
Other Warehouse Related ProductsConnectivity to Sources
Apertus Information Builders EDA/SQL Platimum Infohub SAS Connect IBM Data Joiner Oracle Open Connect Informix Express Gateway
161
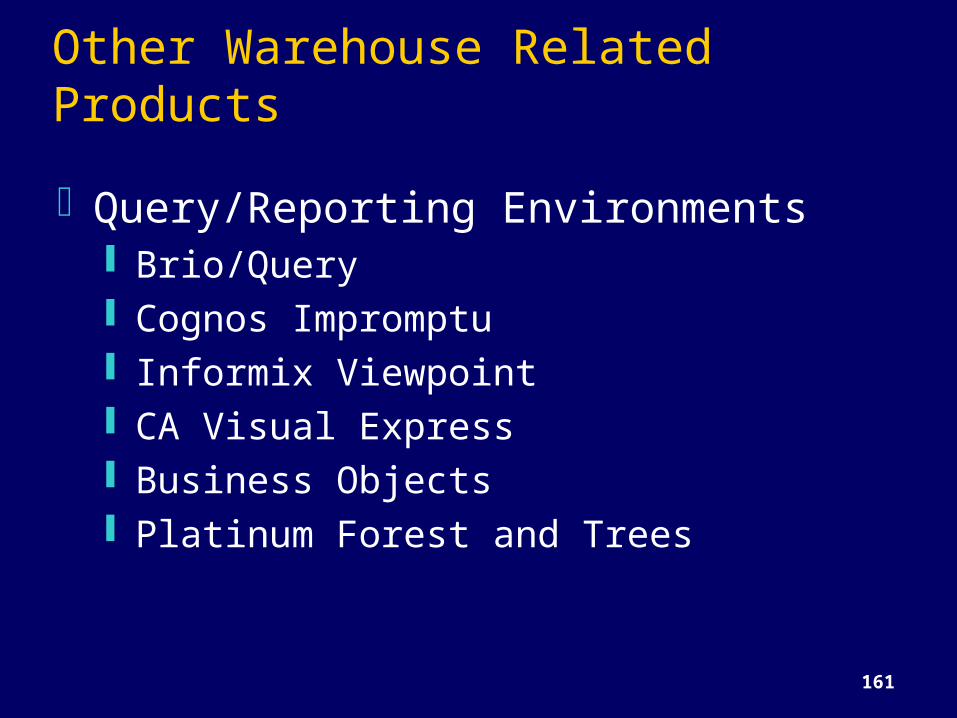
Other Warehouse Related ProductsQuery/Reporting Environments
Brio/Query Cognos Impromptu Informix Viewpoint CA Visual Express Business Objects Platinum Forest and Trees
162
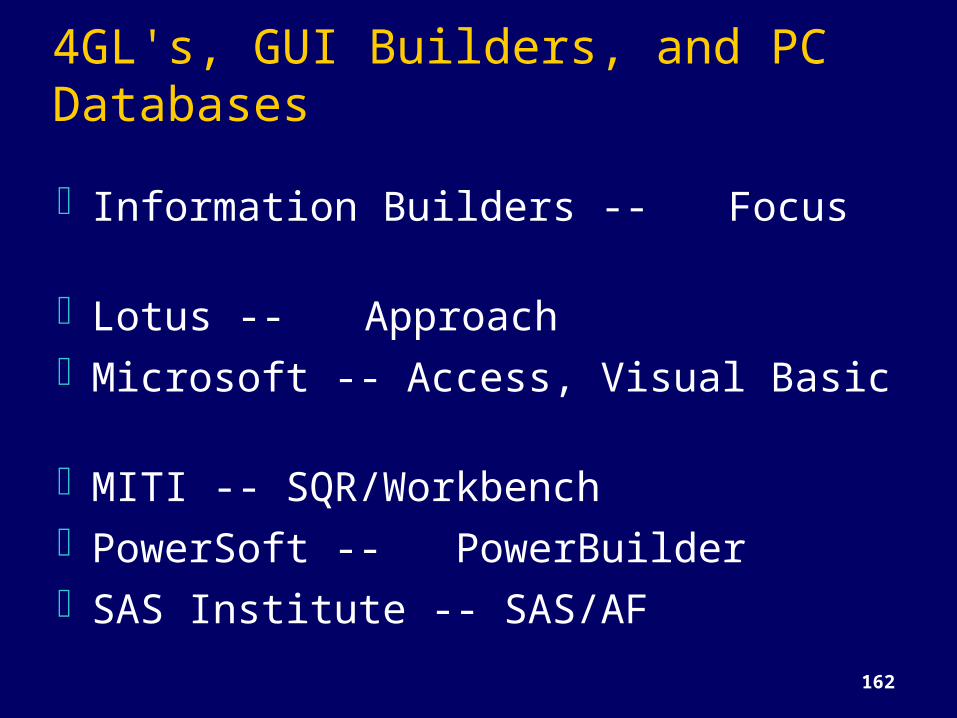
4GL's, GUI Builders, and PC DatabasesInformation Builders --Focus Lotus -- Approach Microsoft -- Access, Visual Basic MITI -- SQR/Workbench PowerSoft -- PowerBuilder SAS Institute -- SAS/AF
163
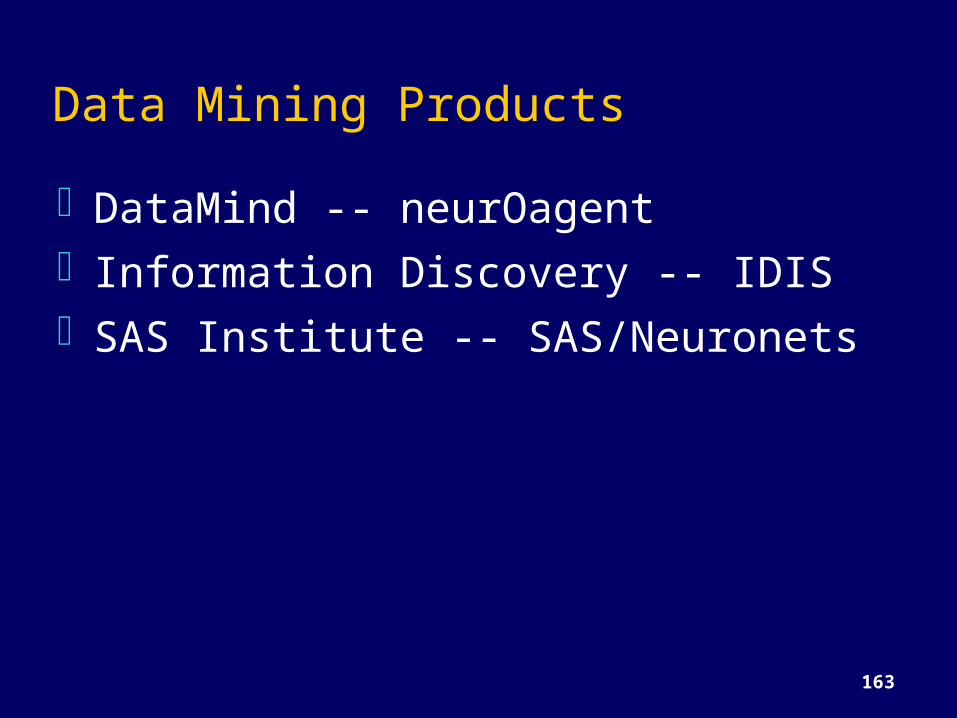
Data Mining ProductsDataMind -- neurOagent Information Discovery -- IDIS SAS Institute -- SAS/Neuronets
164
Data WarehouseW.H. Inmon, Building the Data Warehouse,
Second Edition, John Wiley and Sons, 1996W.H. Inmon, J. D. Welch, Katherine L.
Glassey, Managing the Data Warehouse, John Wiley and Sons, 1997
Barry Devlin, Data Warehouse from Architecture to Implementation, Addison Wesley Longman, Inc 1997
165
Data WarehouseW.H. Inmon, John A. Zachman, Jonathan G.
Geiger, Data Stores Data Warehousing and the Zachman Framework, McGraw Hill Series on Data Warehousing and Data Management, 1997
Ralph Kimball, The Data Warehouse Toolkit, John Wiley and Sons, 1996
166
OLAP and DSSErik Thomsen, OLAP Solutions, John Wiley
and Sons 1997Microsoft TechEd Transparencies from
Microsoft TechEd 98Essbase Product LiteratureOracle Express Product LiteratureMicrosoft Plato Web SiteMicrostrategy Web Site
167
Data MiningMichael J.A. Berry and Gordon Linoff, Data
Mining Techniques, John Wiley and Sons 1997
Peter Adriaans and Dolf Zantinge, Data Mining, Addison Wesley Longman Ltd. 1996
KDD Conferences
168
Other Tutorials Donovan Schneider, Data Warehousing Tutorial,
Tutorial at International Conference for Management of Data (SIGMOD 1996) and International Conference on Very Large Data Bases 97
Umeshwar Dayal and Surajit Chaudhuri, Data Warehousing Tutorial at International Conference on Very Large Data Bases 1996
Anand Deshpande and S. Seshadri, Tutorial on Datawarehousing and Data Mining, CSI-97
169
Useful URLsRalph Kimball’s home page
http://www.rkimball.comLarry Greenfield’s Data Warehouse
Information Center http://pwp.starnetinc.com/larryg/
Data Warehousing Institute http://www.dw-institute.com/
OLAP Council http://www.olapcouncil.com/