Embed Size (px)
Citation preview
data journa l i smhandbook.org
DATA JOURNALISM HANDBOOK

The Data Journalism Handbook was born at a 48 hour workshop at MozFest 2011 in London.
Hundreds of contributors
DATA JOURNALISM HANDBOOK

Journalism done with dataNew possibilities that open up when you combine the
traditional ‘nose for news’ and ability to tell a compelling story, with the sheer scale and range of digital information now available.
Can help a journalist tell a complex story through engaging infographics
Can help explain how a story relates to an individualData can be the source of data journalism, or it can
be the tool with which the story is told — or it can be both
WHAT IS DATA JOURNALISM?

Today news stories are fl owing in as they happen, from multiple sources, eye-witnesses, blogs and what has happened is fi ltered through a vast network of social connections, being ranked, commented and more often than not: ignored.
Right now, a few pioneering journalists already demonstrate how data can be used to create deeper insights into what is happening around us and how it might aff ect us.
Data analysis can reveal “a story’s shape” (Sarah Cohen), or provides us with a “new camera” (David McCandless).
Becoming knowledgeable in searching, cleaning, and visualizing data is transformative for the profession of information gathering.
Companies and institutions around the world are looking for “sensemakers” and professionals, who know how to dig through data and transform it into something tangible.
There is one barrier keeping journalists from using this potential: training in order to learn how to work with data through all the steps from a fi rst question to a big data-driven scoop.
WHY SHOULD JOURNALISTS USE DATA?
The European Journalism Centre conducted a survey to find out more about training needs of journalists.
Found there is a big willingness to get out of the comfort zone of traditional journalism and to invest time to master the new skills.
The results from the survey showed that journalists see the opportunity, but need a bit of support to cut through the initial problems keeping them from working with data.
SURVEY
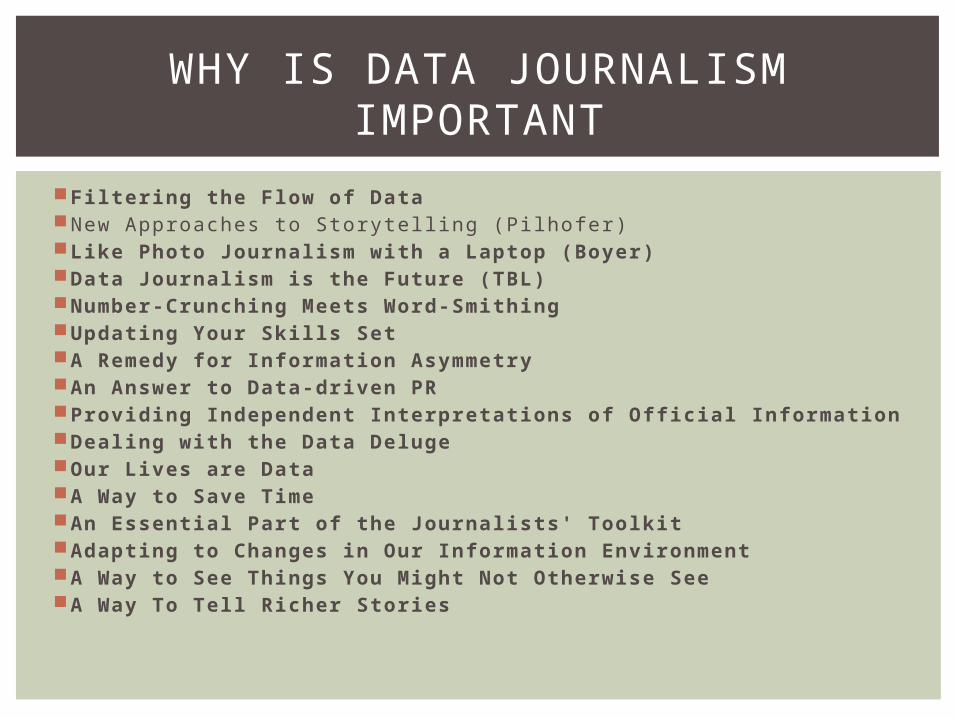
Filtering the Flow of Data New Approaches to Storytell ing (Pilhofer) Like Photo Journalism with a Laptop (Boyer) Data Journalism is the Future (TBL) Number-Crunching Meets Word-Smithing Updating Your Skills Set A Remedy for Information Asymmetry An Answer to Data-driven PR Providing Independent Interpretations of Offi cial Information Dealing with the Data Deluge Our Lives are Data A Way to Save Time An Essential Part of the Journalists' Toolkit Adapting to Changes in Our Information Environment A Way to See Things You Might Not Otherwise See A Way To Tell Richer Stories
WHY IS DATA JOURNALISM IMPORTANT
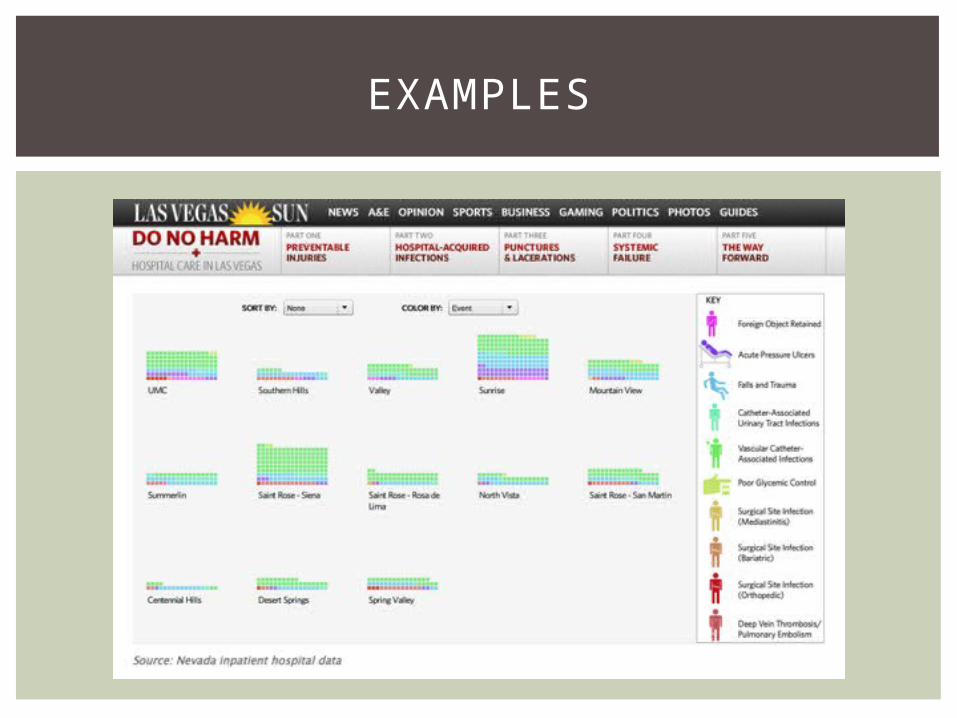
EXAMPLES
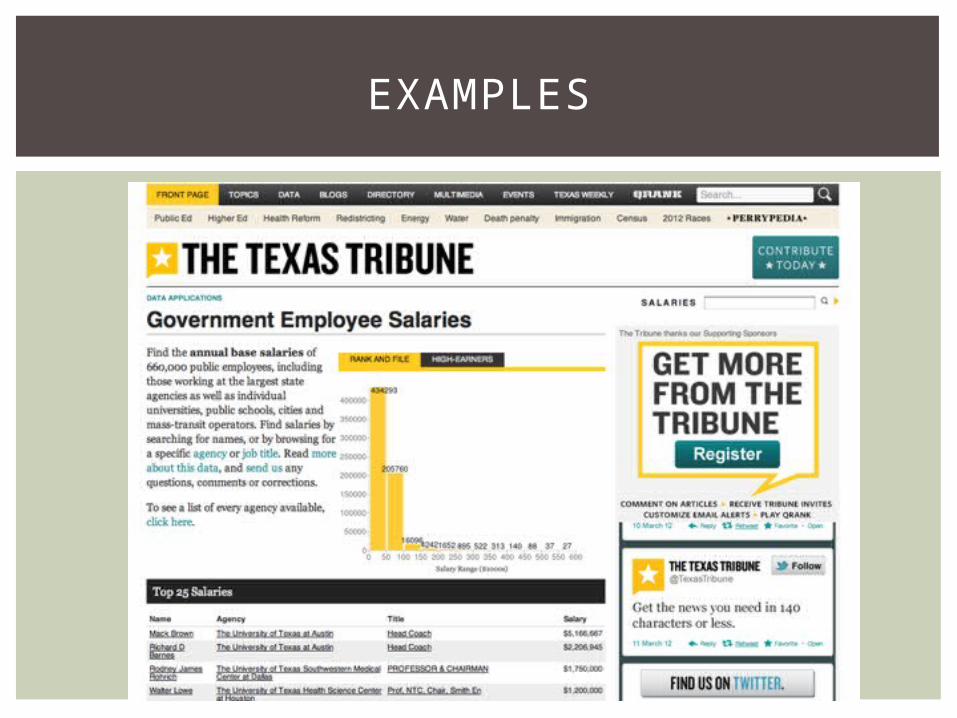
EXAMPLES

EXAMPLES

EXAMPLES
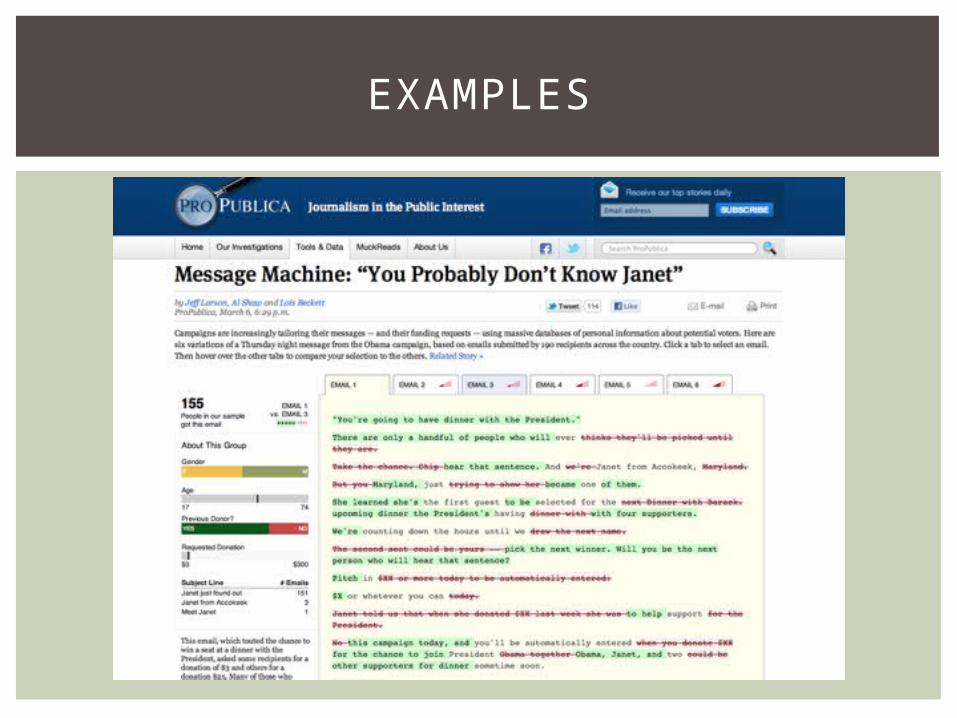
EXAMPLES
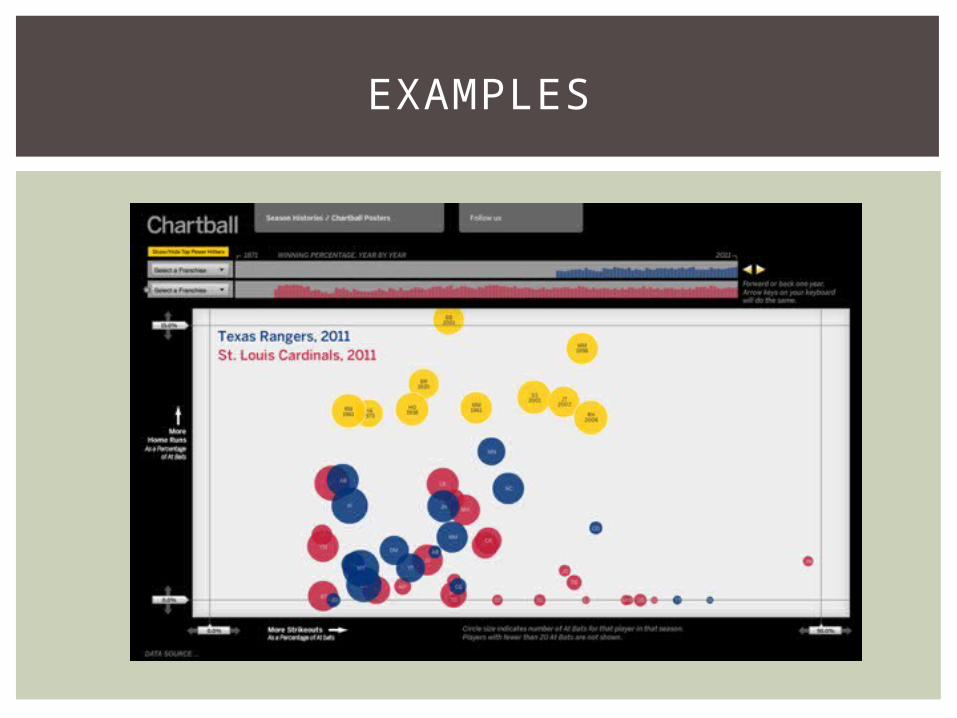
EXAMPLES

August 2010 – one of 1 s t data journalism conferences in Amsterdam
The way that media organizations like Guardian and the New York Times handled the large amounts of data released by Wikileaks is one of the major steps that brought the term into prominence.
One of the earliest formulations of what we now recognise as data journalism was in 2006 by Adrian Holovaty, founder of EveryBlock — an information service which enables users to fi nd out what has been happening in their area, on their block.
He argues that journalists should publish structured, machine-readable data, alongside the traditional ‘big blob of text’.
Using data to improve reportage and delivering structured (if not machine readable) information to the public has a long history. (CAR)
PERSPECTIVES
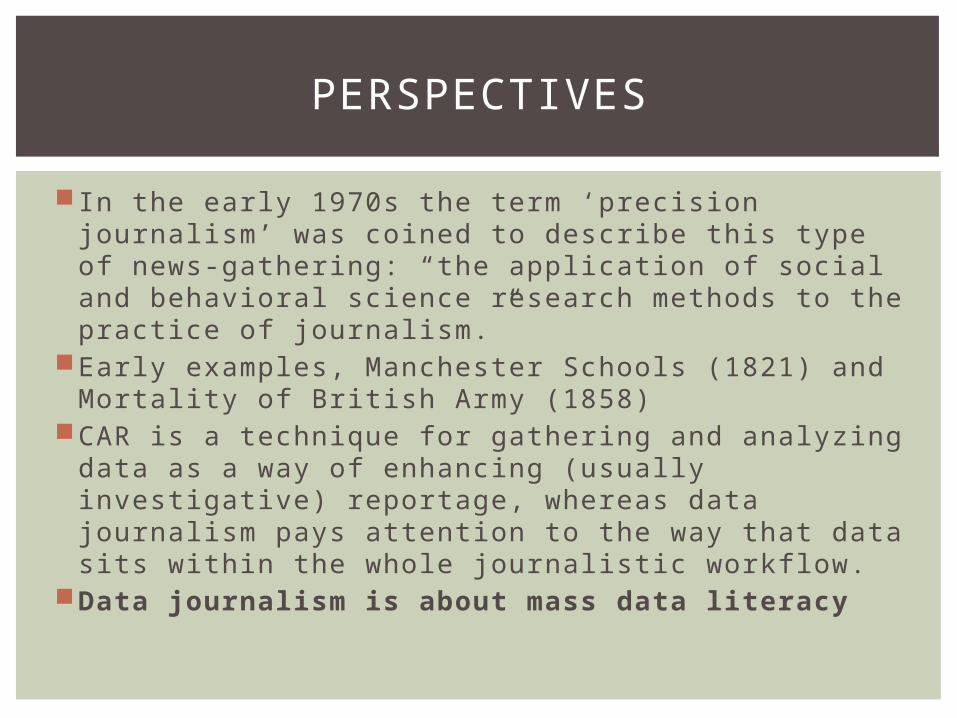
In the early 1970s the term ‘precision journalism’ was coined to describe this type of news-gathering: “the application of social and behavioral science research methods to the practice of journalism.”
Early examples, Manchester Schools (1821) and Mortality of British Army (1858)
CAR is a technique for gathering and analyzing data as a way of enhancing (usually investigative) reportage, whereas data journalism pays attention to the way that data sits within the whole journalistic workflow.
Data journalism is about mass data literacy
PERSPECTIVES
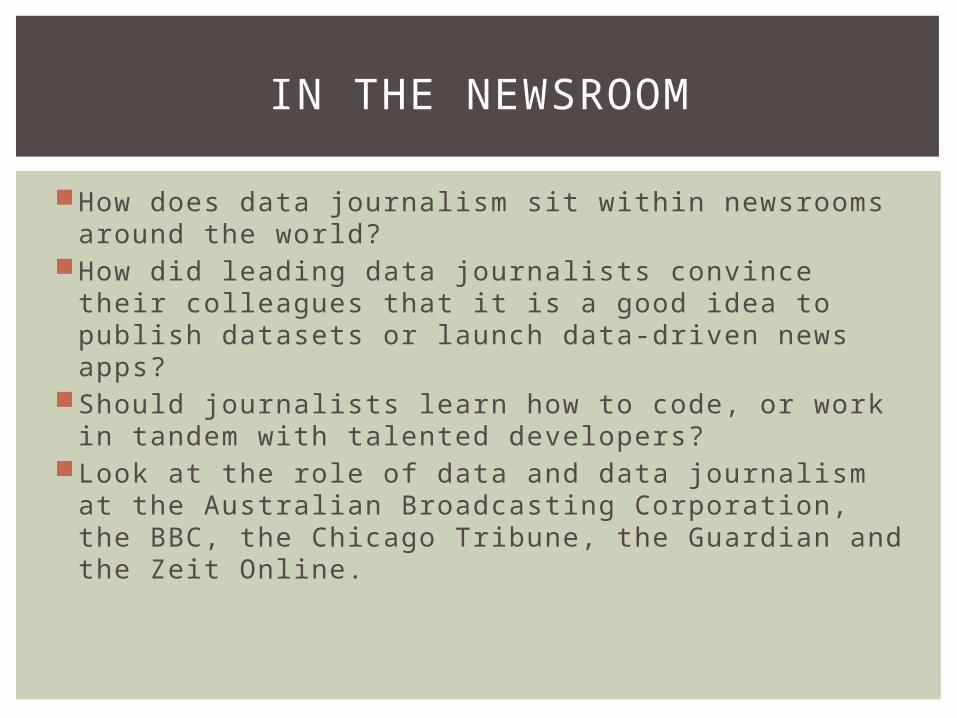
How does data journalism sit within newsrooms around the world?
How did leading data journalists convince their colleagues that it is a good idea to publish datasets or launch data-driven news apps?
Should journalists learn how to code, or work in tandem with talented developers?
Look at the role of data and data journalism at the Australian Broadcasting Corporation, the BBC, the Chicago Tribune, the Guardian and the Zeit Online.
IN THE NEWSROOM

Australia’s public broadcasterContent makers at the ABC have been encouraged to
as the corporate mantra puts it — be ‘agile’. Inspired by work of The GuardianCoal Seam Gas by the Numbers - five pages of
interactive maps, data visualizations and textThe jewel was an interactive map showing coal seam
gas wells and leases in Australia.
THE ABC’S DATA JOURNALISM PLAY
A web developer and designer A lead journalist A part time researcher with expertise in data
extraction, excel spread sheets and data cleaning A part time junior journalist A consultant executive producer A academic consultant with expertise in data mining,
graphic visualization and advanced research skills The services of a project manager and the
administrative assistance of the ABC’s multi-platform unit
Importantly we also had a reference group of journalists and others whom we consulted on a needs basis
THEIR TEAM

Co-location of the team is vital. Our developer and designer were off-site and came in for meetings. This is definitely not optimal! Place in the same room as the journalists.
Our consultant EP was also on another level of the building. We needed to be much closer, just for the drop-by factor
Choose a story that is solely data driven. Big media organizations need to engage in capacity
building to meet the challenges of data journalismData journalism is interdisciplinary
WHAT THEY LEARNED
School league tablesEvery death on the roadThe world at seven billionBBC Budget CalculatorSimple toolsMining the dataUnderstanding an issueTeam is 20 journalists, designers and developersDon’t have people who are specifically identified as
‘data’ journalists, but all editorial staff on the team have to be proficient at using basic spreadsheet applications such as Excel and Google Docs to analyze data.
DATA JOURNALISM AT BBC

We work closely with editors and reporters to help:(1) research and report stories, (2) illustrate stories online (3) build evergreen web resources for the fine people
of Chicagoland. Important that they sit in newsroomFounded by technologists for whom journalism was a
career changeWork in Agile fashion; daily standup meeting; pair
programming; short projects; fail fast; hack iteratively and on deadline
App ideas come from newsroom
HOW THE NEWS APPS TEAM AT CHICAGO TRIBUNE WORKS
Off ers full datasets from behind news storiesNow consists of a front page (guardian.co.uk/data); searches of world government and global
development data; data visualizations by from around the web and
Guardian graphic artists, and tools for exploring public spending data
Members of Parliament expense scandal - crowdsourced 458,000 documents relating to MPs' expenses and analyzed the detailed data of which MPs had claimed what
WikileaksSit next to newsdesks
GUARDIAN DATABLOG
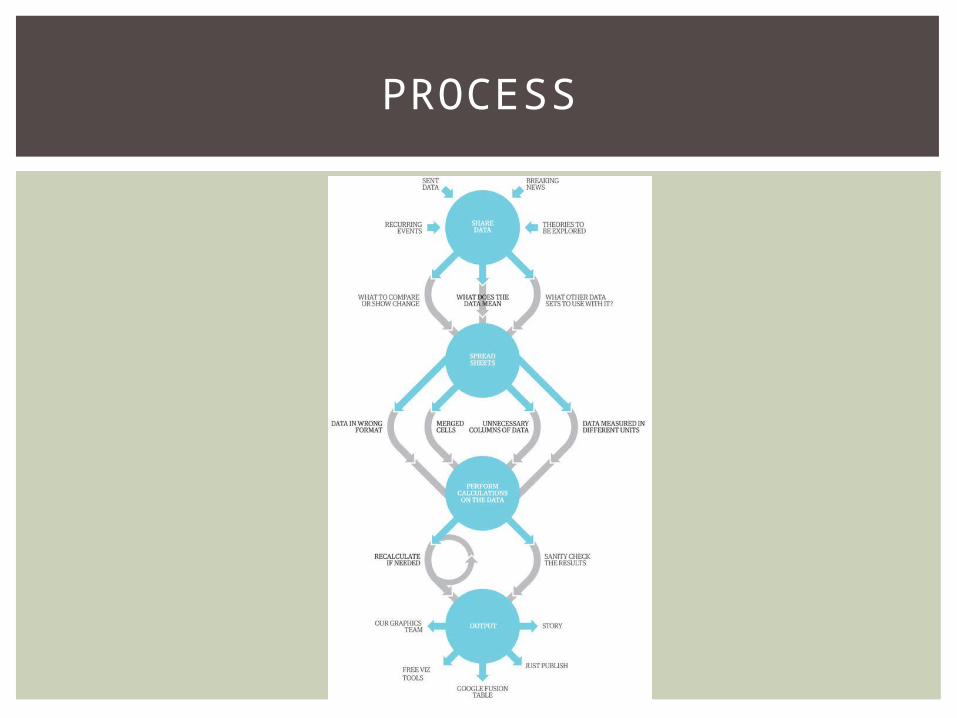
PROCESS
The PISA based Wealth Comparison project is an interactive visualization that enables comparison of standards of living in diff erent countries.
Analyze and visualize this data to provide a unique way of comparing standards of living in diff erent countries
ZEIT ONLINE

Organization may have people with these skills Post on job websites Contact relevant mailing lists Contact relevant organizations Join relevant groups/networks Local interest communities Hackathons and competitions Ask a geek They code the full stack They see the whole picture They tell a good story They talk things through They teach themselves But they need technical management
HOW TO HIRE A HACKER
Find storiesConnect peopleHost a social eventQuestion or data?Little technical knowledge Is it news?What’s the routine?
HACKATHONS
Data projects don’t date You can build on your past work Data journalism pays for itself
OUR STORIES COME AS CODE
Many journalists seem to be unaware of the size of the revenue that is already generated through data collection, data analytics and visualization
The big, worldwide market that is currently opening up is all about transformation of publicly available data into something our that we can process: making data visible and making it human
BloombergReutersThe EconomistStartups Increase importance of role in society; trustNon-profi t funding
BUSINESS MODELS
Many databases on the web are indexed by search engines, whether the publisher intended this or not.
Include search terms relating to content and formatSearch by part of url: ‘inurl:downloads fi letype:xls’ Search sites where data may be available:
‘site:agency.gov Directory Listing’Browse data sites and servicesAsk on a forum or mailing list Join Hacks/Hackers/Ask an expertLearn about Govt ITSearch again with new phrasesWrite a FOI request
GETTING DATA
Freedom of Information Plan ahead Know fees Know your rights and communicate that Keep it simple Keep it focused Be specifi c Submit multiple requests/international requests Do a test run Anticipate exceptions Ask for access Keep a record Make it public Ask for raw data
YOUR RIGHT TO DATA
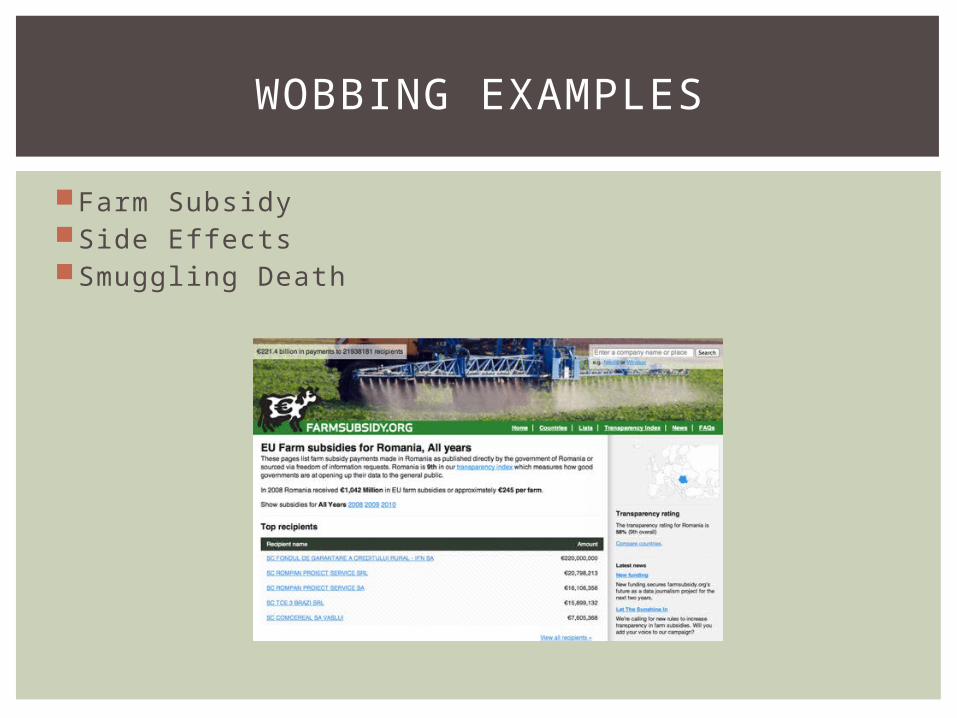
Farm SubsidySide Eff ectsSmuggling Death
WOBBING EXAMPLES
Web-based APIsExtract from PDFScrape itScraperwikiChrome Scraper ExtensionScrapers are small pieces of code that automate
getting data from a website that is not in csv or other easy to use format.
Based on html structure of pageWe will discuss in coming weeks
GETTING DATA FROM THE WEB

Whois Blekko Compete.com Google site search – narrow search Bit.ly Twitter Google’s cache Wayback Machine at archive.org View, Source TinEye – image search YouTube statistics Emails Wikipedia article traffi c Google Insights
THE WEB AS A DATA SOURCE
Crowdsourcing dataSharing - Ethical issues, restrictions, licenses
OTHER

How was the data collected?What’s in there to learn?How reliable is the information? Sample size,
intervening variables, accounting for all relevant information…
These are basic research methods techniques with which you should be familiar.
BECOMING DATA LITERATE IN 3 STEPS
Enjoy yourself; handle as you would other evidenceDon’t confuse skepticism with cynicismBe objective and open-minded about what the data
meansUncertainty is okThe investigation is a storyUse prompts to think about the data. Is it too big or
small? Does it make sense? Where did it come from?
TIPS FOR WORKING WITH NUMBERS
Data requests should begin with a list of questions you want to answer.
Data often is messy and needs to be cleaned.Data may have undocumented features
BASIC STEPS FOR WORKING WITH DATA
Start with data, finish with a storyMeasurement – counting or totaling somethingProportion Internal comparisonExternal comparisonChange over timeLeague tables – must take size into accountAnalysis by categoryAssociation - correlation
DATA STORIES

Google Spreadsheets and Fusion TablesExcelDjango and Ruby on RailsStatistical tools like SPSS, Google Refine and RMapping tools – QGIS, ArcGIS, TileMillTableau PublicA good text editor, like TextWrangler, BBEdit, Komodo
Edit
TOOLS OF CHOICE
Use it to provide insight Tables for small amounts of data Charts with visual properties Maps Graphs
Analyze and interpret what you seeDocument your insights and steps
Why have I created this chart? What have I done to the data to create it? What does this chart tell me?
Transform data – zoom, fi lter, outlier removal
VISUALIZE DATA
There are times when data can tell a story better than words or photos
New tools and technologies help in visual storytelling The question facing journalists now less about whether
you can turn your dataset into a visualization, but whether you should - – Aron Pilhofer
Use of motion and animation when appropriate Excel, news desk, visualize, post. Then promote via Twitter
– Simon Rogers Time on data projects > than other items on Guardian Visualize and provide download; increases transparency Human element – location; Open source – Alastair Dant Partner, design, usability and user experience – Chrys Wu
PRESENTING DATA TO THE PUBLIC

Enduring, help users solve problems, ex ProPublica’s Dialysis Facil ity Tracker
Audience? what are their needs How much time should I spend? Take things to the next level by developing productivity
tools News Apps 2.0 – combining
storytell ing and public service – Chase Davis
ProPublica – data, national in scope, yet granular enough to expose details – Scott Klein
Need headline, byline, lead, nut graph
Generative – generate more reporting and stories
ProPublica’s Dollars for Docs Mapping LA Why? It’s great journalism, it’s
hugely popular, and if we don’t do it somebody else wil l
HOW TO BUILD A NEWS APP
Help you identify themes and questions for the rest of your reporting
Identify outliers: good stories, or perhaps errors, in your data
Help you find typical examples Show you holes in your reporting
Visualizations also play multiple roles in publishing: Illustrate a point made in a story in a more
compelling way Remove unnecessarily technical information from
prose Particularly when they are interactive and allow
exploration, provide transparency about your reporting process to your readers
VISUALIZATION

Use small multiples to quickly orient yourself in a large dataset
Look at your data upside down and sidewaysDon’t assumeAvoid obsessing over precisionCreate chronologies of cases and eventsMeet with your graphics department early and
oftenMatch the eff ort of the data collection with the
interactive graphicDesign for two types of readersConvey one idea – then simplify
TIPS
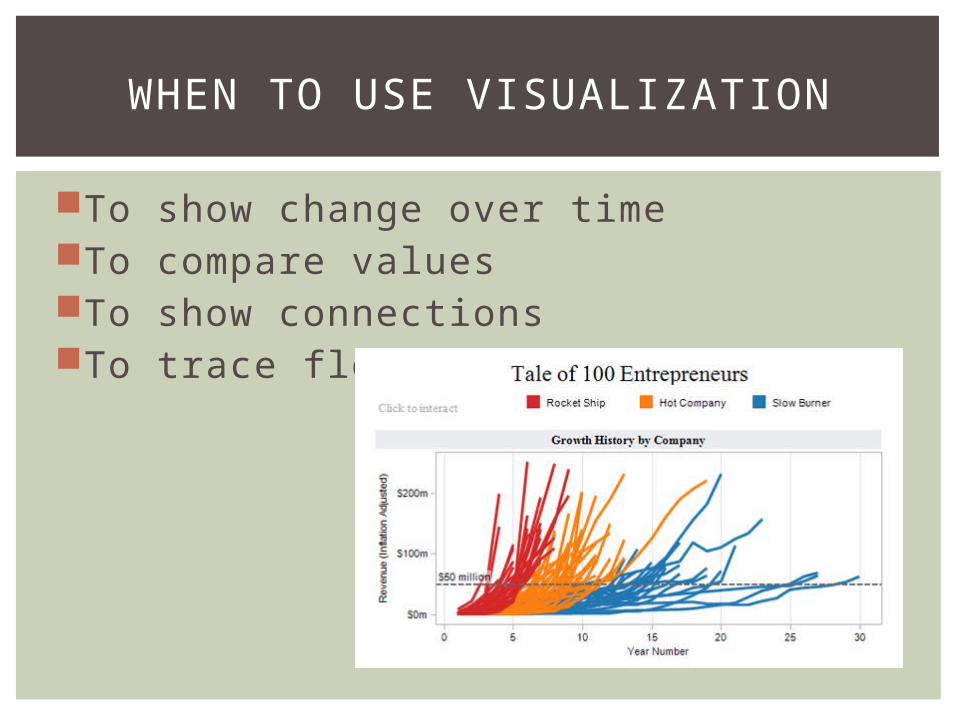
To show change over timeTo compare valuesTo show connectionsTo trace flows
WHEN TO USE VISUALIZATION
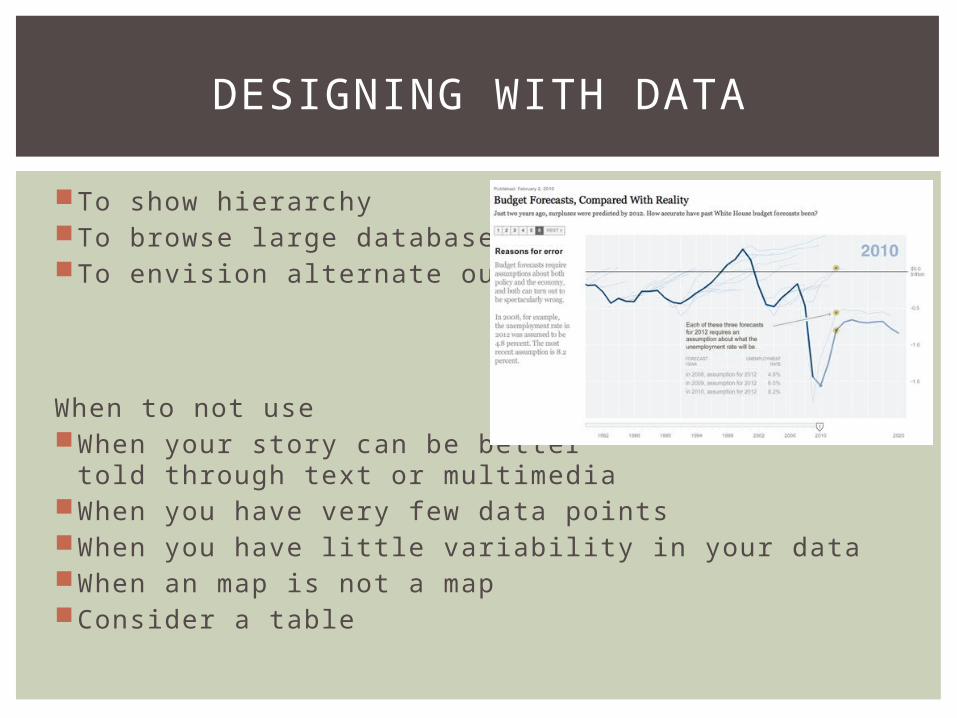
To show hierarchyTo browse large databasesTo envision alternate outcomes
When to not useWhen your story can be better
told through text or multimediaWhen you have very few data pointsWhen you have little variability in your dataWhen an map is not a mapConsider a table
DESIGNING WITH DATA
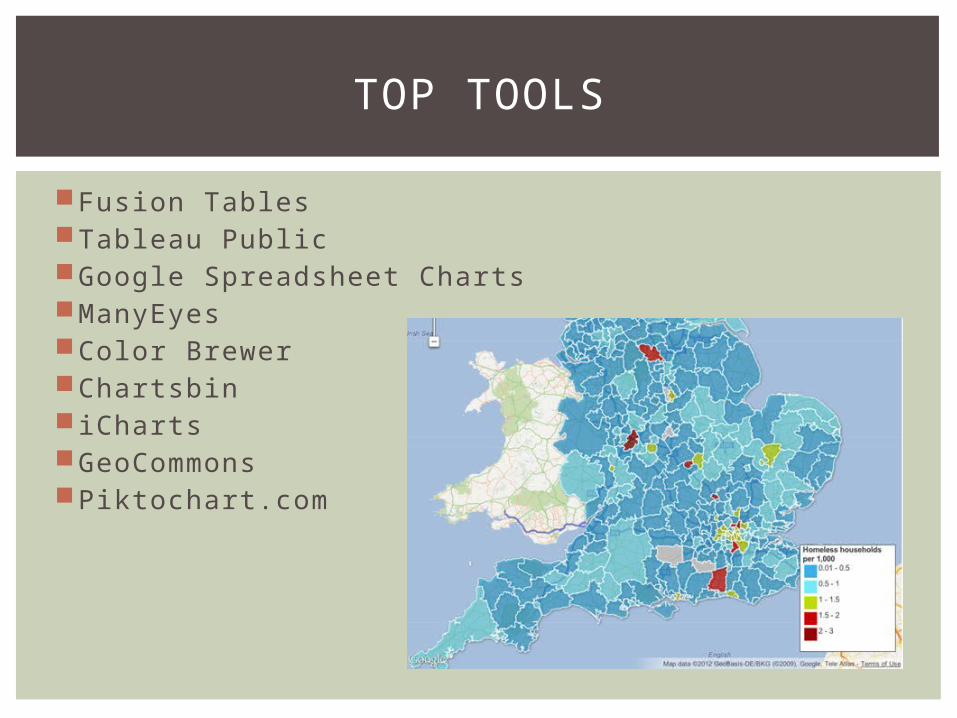
Fusion TablesTableau PublicGoogle Spreadsheet ChartsManyEyesColor BrewerChartsbin iChartsGeoCommonsPiktochart.com
TOP TOOLS
Occasional Users. These are users who want information simply and quickly. They are interested in getting a picture of the data, not detailed analytics. We can engage them via Tweets or interactive graphics.
Active Users. Users who stimulate discussion, and use the data to increase their knowledge of a given area or challenge the assumptions of the data. For these users we want to provide feedback mechanisms and the possibility to share insights with their peers via social networks.
Data Hogs: These users want raw data for visualization or analysis. We simply give them the data for their purposes.
Engage people with social media
3 KINDS OF USERS