Embed Size (px)
Citation preview

DATA LITERACY WORKSHOP - JAN 30TH & 31ST, 2019
DatapackUNOCHA Centre for Humanitarian Data
Results and analysis for the UNOCHA Centre for Humanitarian Data’s broad-based data literacy survey, conducted online 15-25 January 2019

Overview ……………………………….………………………...The Drop-Off ……………………………………………………………….Data Use, Activities & Challenges…………………………...Motivations, Topics & Engagement…………………………Segments………………………………………………………...HQ and Regional Program Management…………………Heads of Office and Country Directors……………………Humanitarian Advisors and Experts…………………………....Data and Information Management………………………...
31219314042485463
Content
02

OverviewWho responded to the survey?
This first section presents the descriptive statistics of the 1232 survey respondents reached from 15-25 January 2019 via direct email, pop-ups on the Centre’s and HDX’s website, and banners on ReliefWeb.
03
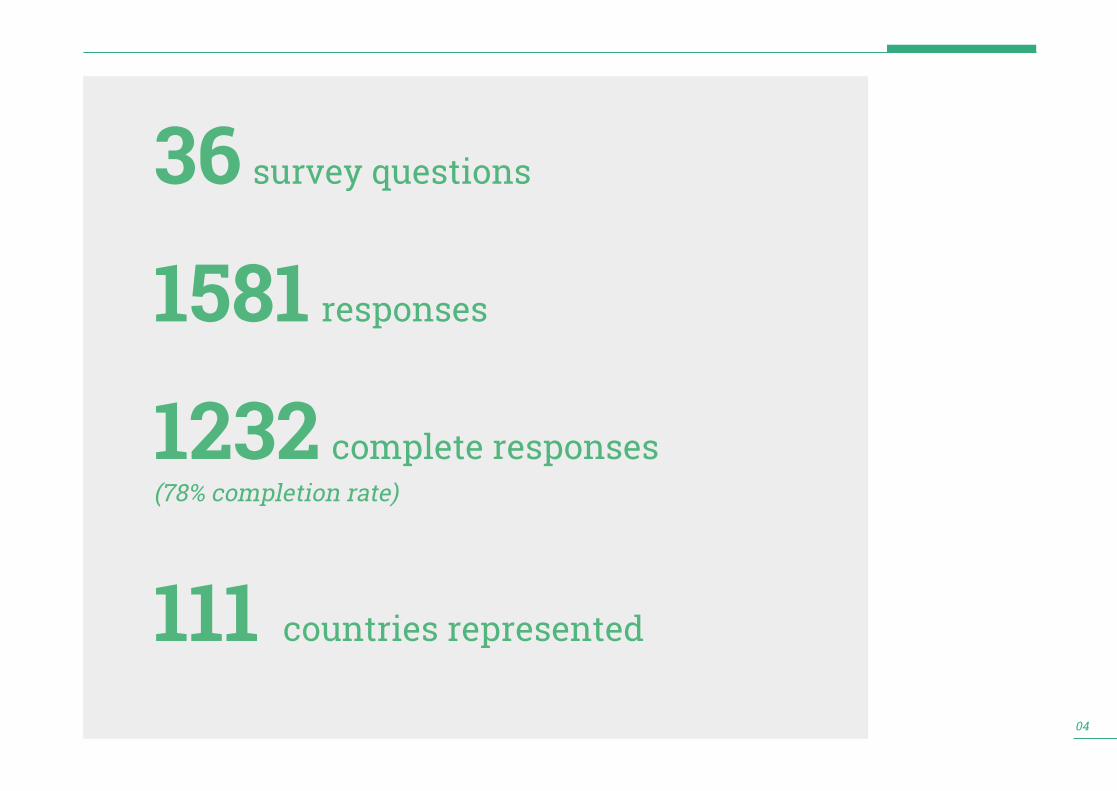
36 survey questions
1581 responses
1232 complete responses (78% completion rate)
111 countries represented
04
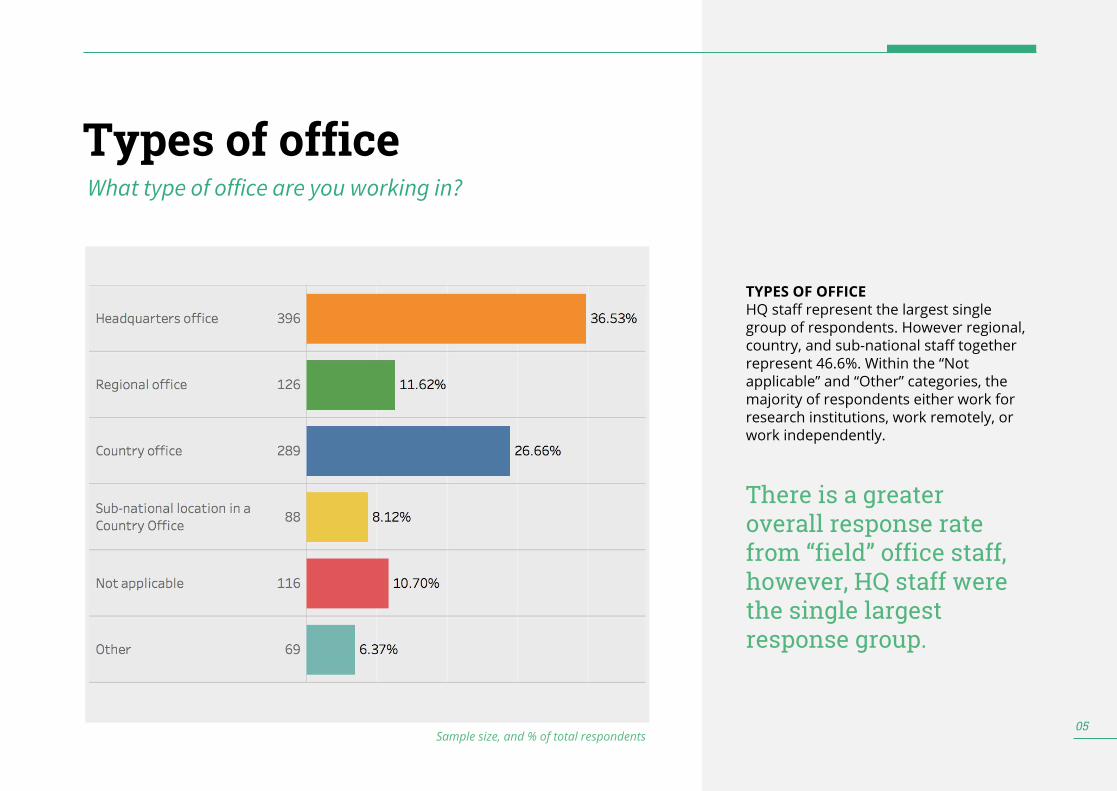
TYPES OF OFFICEHQ staff represent the largest single group of respondents. However regional, country, and sub-national staff together represent 46.6%. Within the “Not applicable” and “Other” categories, the majority of respondents either work for research institutions, work remotely, or work independently.
There is a greater overall response rate from “field” office staff, however, HQ staff were the single largest response group.
Types of officeWhat type of office are you working in?
05Sample size, and % of total respondents

TYPES OF ORGANISATIONUN staff represented the greatest proportion of respondents, followed by staff from a variety of other international NGOs. Staff from the Red Cross and Red Crescent represented 6.1% of respondents (or a total of 75 people).
UN and international NGO staff represent about 58% of the total respondents.
OrganisationWhat type of organisation do you work for?
06% of total respondents

While there are differing rates of response across age groups, the distribution is broadly in line with the UN System HR demographic data.
This also holds true for gender, where women represent about 40% of UN System employees. Notably, the most significant gender gap is in data management staff, where men represent about 75% of respondents. Of our respondents, women approach parity only among program managers and communications/public information staff.
Both age and gender response rates are in line with UN System HR data. Women represent only 25% of data management staff respondents, but are closer to half of program managers and communications staff.
Age and Gender What is your age? What is your gender?
07
% of total respondents
AGE
GENDER

REGIONSWestern Europe and North America were the most represented regions, in line with the large response rate from HQ staff. However respondents from across Africa and the Middle East were well represented.
South Asia, Latin America and the Caribbean, and Eastern Europe and Central Asia are the least represented, but this is largely in line with the distribution of humanitarian crises and crisis zones worldwide.
Respondents were distributed across regions. The greatest number of responses came from USA (15.2%), Switzerland (7.5%), Kenya (4.2%) and the UK (4.2%).
Regions
08
In which region are you based?
% of total respondents

TENURESimilar to age and gender, while there are different rates of response across tenure ranges, the distribution is broadly in line with the UN System HR demographic data. The results reflect the pyramid distribution of tenure found in most organisations.
Less experienced staff responded in greater numbers, resulting in rates largely in line with UN System HR data, and general age distribution.
Tenure How many years have you worked in the humanitarian sector?
09% of total respondents

Data-oriented staff represent a significant proportion of respondents, however there is strong representation across program management staff, and even of senior leadership.
166 respondents identified themselves as ‘other’, making them the single largest response group. The data was cleaned, and respondents were reclassified with group names changed to better reflect respondents’ self-designations, bringing the ‘other’ category down to 50.
Data-oriented and information management staff represent more than half of total respondents.
Sample size, and % of total respondents
Roles 36.1%
54.7%
10

SURPRISINGThere was a higher than expected response from heads of office and country directors. This may signal a greater level of investment by senior country staff than we anticipated, and a potential opportunity area.
CONFORMINGData-oriented staff are heavily sampled in the data. As needs may vary widely across user groups and roles - and overall findings will be uniquely skewed by each group - it is helpful to segment respondents by role, and may be additionally interesting to segment by region.
Recommendation:Data-oriented staff are an interested audience. Country directors may be another interesting group.
Demographics Summary
11
Greater response rate from people working outside of HQWhile more HQ staff responded to the survey as a single group, there is a greater overall response rate from “field” office staff.
Greater response rate from UN and international NGO staffUN and international NGO staff represent about 58% of the total respondents.
Respondents are well-distributed across regionsWestern Europe and North America were the most represented regions, in line with HQ response rates.
Greater response from data-oriented staffHowever strong representation across all staff, including program management staff, and even senior leadership.
Gender, age, and tenure map to UN system HR data The most significant gender gap is in data management staff (men 75%), greatest parity among program managers and communications/public information staff.

‘The drop-off’Who stopped responding part of the way through the survey?
This section presents the descriptive statistics of the 349 survey respondents who did not complete the survey.
12

The respondents who did not finish the survey followed a similar distribution to those who completed the survey. Those whose office type was “not applicable” were in the only category that showed a significant drop-off (31%). The drop-off was smallest among regional and country office staff, perhaps signalling a greater interest in those types of offices.
With regards to organisation, respondents working in the media, showed significant drop-off. Respondents working for the government, and in the private sector were also slightly more represented in the drop-off sample.
In both cases these trends may speak to the fact that respondents working in those organisations, or who fall outside of the UN/iNGO systems, did not feel the survey was for them.
Respondents in regional and country offices were most likely to complete the survey.
Type of Office and OrganisationWhat type of office are you working in? What type of organisation do you work for?
13
% of total respondents
TYPE OF OFFICE
TYPE OF ORGANISATION

Younger respondents (those younger than 25) were significantly more likely to drop out of the survey (34%) while older respondents (those over 46) were slightly less likely to drop the survey (18%).
Those identifying as either male, female, or electing not to state their gender were all equally likely to drop out of the survey. However respondents who identified as an “other” gender were more likely to drop out, this result is difficult to interpret due to the small sample size.
The youngest respondents (those under 25) were more likely to drop out of the survey. Dropping out of the survey did not significantly vary across male and female respondents.
Age and Gender What is your age? What is your gender?
14
AGE
GENDER
% of total respondents

REGIONSRespondents from Eastern Europe and Central Asia were more likely to drop out of the survey (34%).
Respondents from Latin America and the Caribbean, Eastern and Southern Africa, and West and Central Africa were slightly more likely to complete the survey which may indicate slightly increased levels of interest in these regions.
Respondents from Eastern Europe and Central Asia were more likely to drop out of the survey.
Regions
15
In which region are you based?
% of total respondents

TenureSimilar to the age results, respondents with shorter tenure (those with less than 5 years experience) were more likely to drop out of the survey (25%) however these results did not vary so significantly from the average.
These results are interesting as one might assume that longer tenured staff may be more burned out of completing surveys, and they were among the most likely to complete this survey. However, it may also speak to acknowledged skills gaps in longer tenured staff, and a desire and willingness to invest in their own data literacy.
While there was limited variability by tenure, less tenured staff were slightly less likely to have completed the survey.
Tenure
16
How many years have you worked in the humanitarian sector?
% of total respondents

With regards to role, the respondents who did not finish the survey followed a similar distribution to those who completed the survey.
Data-oriented staff were slightly more likely to complete the survey (particularly analysts, data and information management, data scientists, and M&E staff). Non-technical staff were slightly less likely to complete the survey. This may reflect a perception that the survey was not geared towards non-technical staff, or not relevant to their roles.
Data-oriented and information management staff were slightly more likely to complete the survey than non-technical staff.
Sample size, and % of respondents in each role who did not complete the survey
Roles
17

SURPRISINGThe response rate did vary significantly by region, with Latin America and the Caribbean, Eastern and Southern Africa, and West and Central Africa slightly more likely to complete the survey which may indicate slightly increased levels of interest in these regions.
CONFORMINGData-oriented staff were more likely to complete the survey. This may reflect a perception that the survey seemed geared towards them, and a greater comfort in engaging with material about data.
Recommendation:Region and role seem to be among the larger determinants of interest (where drop-off is the proxy), which reinforces a need to segment across these dimensions.
Drop-off Summary
18
Regional and country office staff were most likely to complete the survey.The drop-off was smallest among regional and country office staff, perhaps signalling a greater interest in those types of offices.
The youngest respondents (those under 25) were more likely to drop out of the survey. Furthermore, older respondents (those over 46) were slightly less likely to drop the survey (18%).Dropping out of the survey did not significantly vary by genderThose identifying as either male, female, or electing not to state their gender were all equally likely to drop out of the survey.
Respondents from Eastern Europe and Central Asia were more likely to drop out.
Data-oriented staff were more likely to complete the survey. Data-oriented staff were slightly more likely to complete the survey (particularly analysts, data and information management, data scientists, and M&E staff).

Data Use, Activities & ChallengesWHAT DO RESPONDENTS DO, AND WHAT ARE THEIR MAIN CHALLENGES?
This section includes data on respondents’ perception of the investment their own organizations have made in data, their own data-related responsibilities, and key challenges in their work. 19

INVESTMENT90% of respondents feel that their organisations invest in data to some degree, with almost 50% concluding there is “some investment”. Of the 10% who feel there is no investment, respondents vary by region and by role.
About 90% of respondents feel their organisations invest to some extent in the use and impact of data.
InvestmentTo what extent does your organization invest in the use and impact of data?
20% of total respondents

Investment by Region
21
% of respondents by region
To what extent does your organization invest in the use and impact of data?
Respondents in South Asia perceive the lowest levels of investment, with the highest proportion of respondents among regions marking both “no investment” and “some investment”.
Respondents in North America and Eastern and Southern Africa perceive the highest levels of investment in the use and impact of data. Meanwhile, those in South Asia, East Asia and the Pacific regions are more likely to report no investment.
Investment by Role
22
% of respondents by role
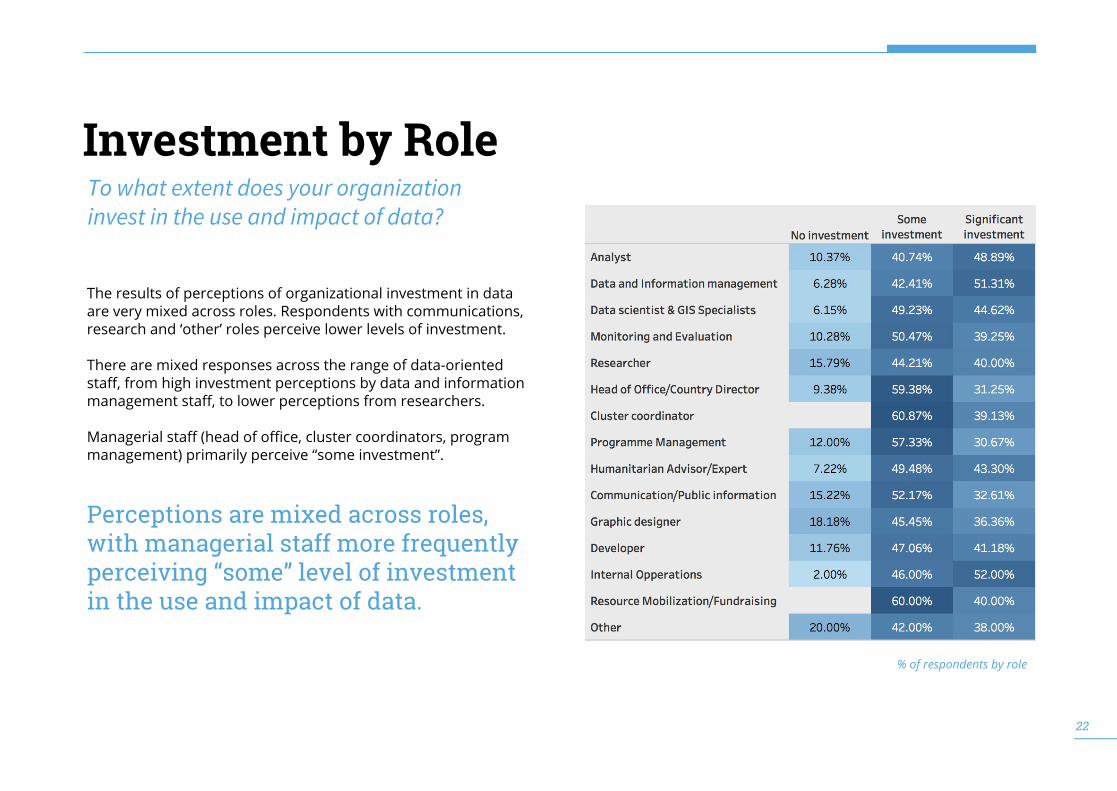
The results of perceptions of organizational investment in data are very mixed across roles. Respondents with communications, research and ‘other’ roles perceive lower levels of investment.
There are mixed responses across the range of data-oriented staff, from high investment perceptions by data and information management staff, to lower perceptions from researchers.
Managerial staff (head of office, cluster coordinators, program management) primarily perceive “some investment”.
Perceptions are mixed across roles, with managerial staff more frequently perceiving “some” level of investment in the use and impact of data.
To what extent does your organization invest in the use and impact of data?

DATA INVOLVEMENTAlmost all respondents engage in tasks related to data. (See next page for how responses vary by role.)
98% of respondents work on tasks related to data, with 70% working with data “all the time”.
Data InvolvementHow frequently do you work on tasks related to data in your job?
23% of total respondents

Involvement by Role
24
% of respondents by role
As expected, the majority of data-oriented staff report working on data tasks “all the time”. Other respondents report working on data related tasks either “occasionally” or “all the time”.
Non-technical or managerial staff (e.g. heads of office, program management) are evenly split between working with data occasionally or all the time. Very few respondents in any role report never working on data-related tasks.
How frequently do you work on tasks related to data in your job?
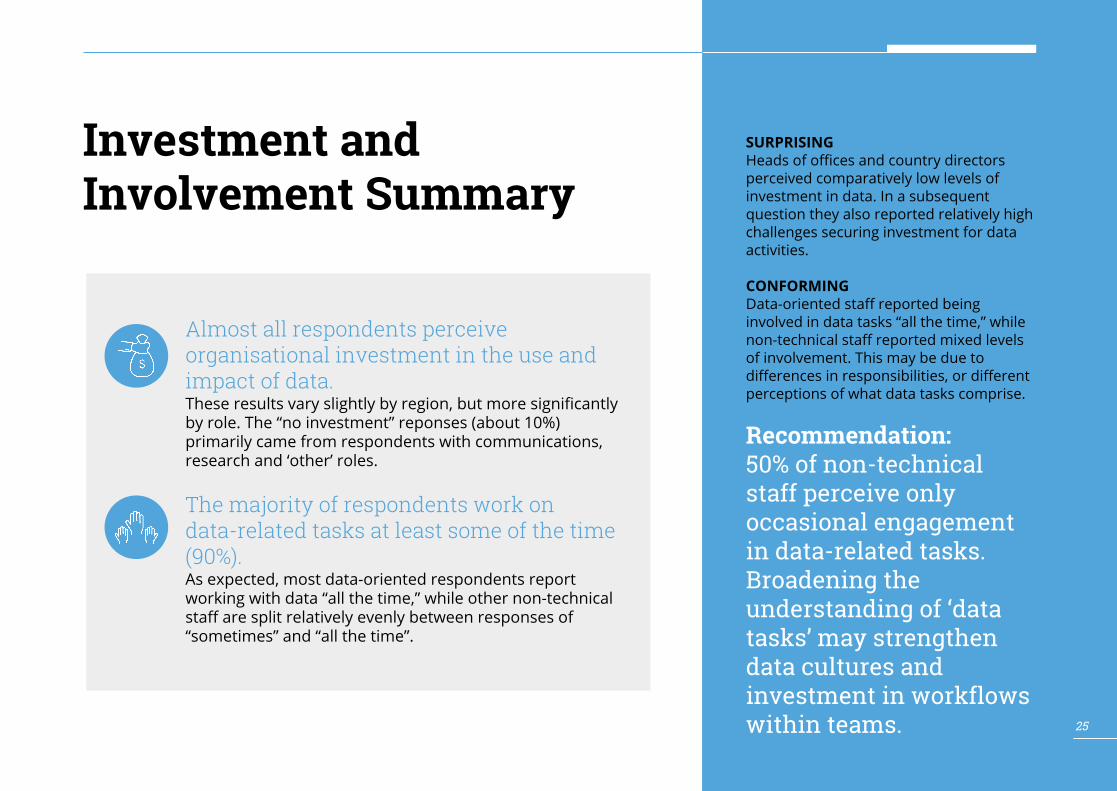
SURPRISINGHeads of offices and country directors perceived comparatively low levels of investment in data. In a subsequent question they also reported relatively high challenges securing investment for data activities.
CONFORMINGData-oriented staff reported being involved in data tasks “all the time,” while non-technical staff reported mixed levels of involvement. This may be due to differences in responsibilities, or different perceptions of what data tasks comprise.
Recommendation:50% of non-technical staff perceive only occasional engagement in data-related tasks. Broadening the understanding of ‘data tasks’ may strengthen data cultures and investment in workflows within teams.
Investment and Involvement Summary
25
Almost all respondents perceive organisational investment in the use and impact of data. These results vary slightly by region, but more significantly by role. The “no investment” reponses (about 10%) primarily came from respondents with communications, research and ‘other’ roles.
The majority of respondents work on data-related tasks at least some of the time (90%).As expected, most data-oriented respondents report working with data “all the time,” while other non-technical staff are split relatively evenly between responses of “sometimes” and “all the time”.
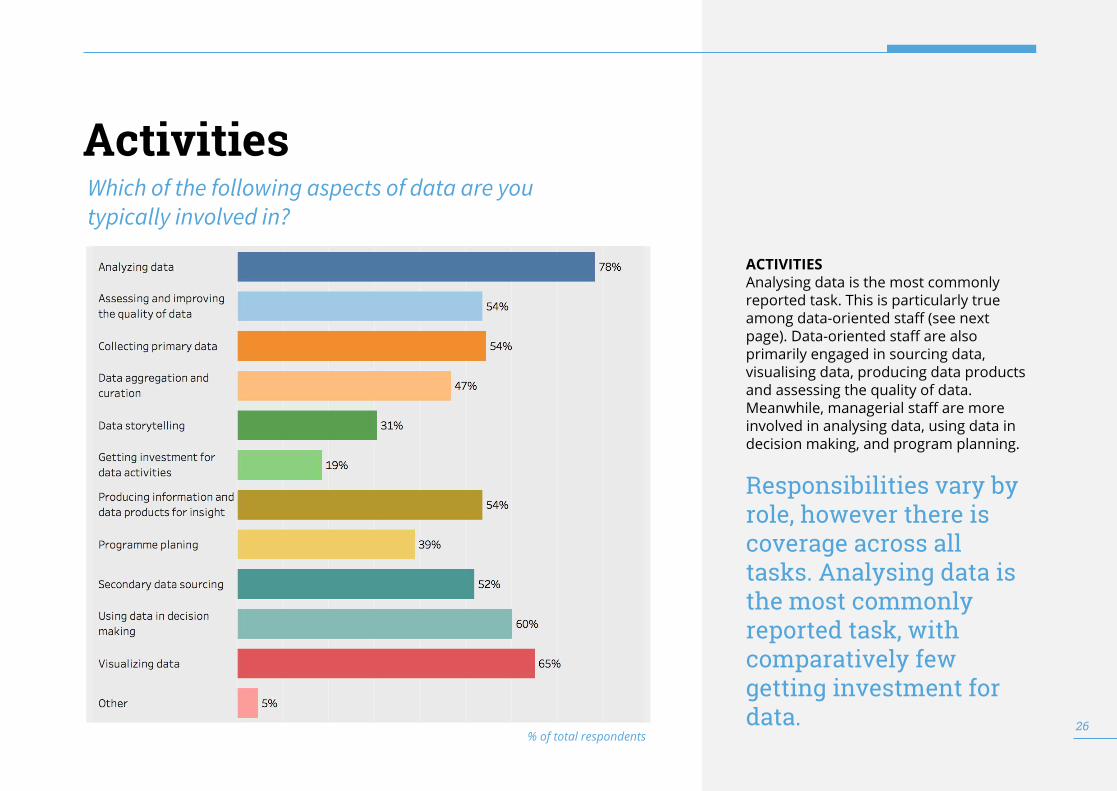
ACTIVITIESAnalysing data is the most commonly reported task. This is particularly true among data-oriented staff (see next page). Data-oriented staff are also primarily engaged in sourcing data, visualising data, producing data products and assessing the quality of data. Meanwhile, managerial staff are more involved in analysing data, using data in decision making, and program planning.
Responsibilities vary by role, however there is coverage across all tasks. Analysing data is the most commonly reported task, with comparatively few getting investment for data.
Activities Which of the following aspects of data are you typically involved in?
26% of total respondents

Activities by Role
27
Which of the following aspects of data are you typically involved in?
% of total respondents within each role

CHALLENGESThe most commonly reported challenges are collecting primary data, and assessing and improving the quality of data. These challenges remain the most common even when controlling for role (see next page). Heads of office and country directors report a more diverse range of challenges than other roles, suggesting further research may be required to understand their involvement and pain points.
Collecting primary data and assessing and improving the quality of data are the most commonly reported challenges. This is in line with expert feedback that “people don’t know what good looks like, and how to get there.”
Challenges Which of the following aspects of data do you find the most challenging in your work?
28% of total respondents

Challenges by Role
29
Which of the following aspects of data do you find the most challenging in your work?
% of total respondents within each role

SURPRISINGOnly 19% of respondents reported getting investment for data activities as an activity, while 29% reported it as a challenge. This was particularly true for data and information management staff and program managers.
CONFORMINGAssessing and improving the quality of data is one of the most commonly reported challenges. This is in line with expert feedback that “people don’t know what good looks like, and how to get there.”
Recommendation:Collecting primary data and assessing and improving the quality of data are the most commonly reported challenges, and present opportunities across both technical and non-technical staff.
Activities and Challenges Summary
30
Activities vary broadly by role, however there is coverage across all tasks related to data.Analysis is the most common activity and holds true across roles. Using data for decision making is also a common task across roles. Other activities vary by role in line with role-based expectations.
Assessing and improving the quality of data, and collecting primary data are the most commonly reported challenges. Senior level managerial staff, particularly heads of office and country directors, report a more widely distributed range of challenges.

Motivations, Topics & EngagementWHAT DO RESPONDENTS WANT TO LEARN, WHY, AND HOW DO THEY WANT TO LEARN IT?
This section covers respondents’ self-reported motivations for improving their data skills, topics they may be interested in learning, and preferences across a range of modes of engagement. 31

MOTIVATIONSWhile we had expected a more diverse array of motivators, the majority of respondents across all roles are motivated by improving overall capabilities and using data to make the humanitarian response more effective.
One-third of respondents reported a desire to gain expertise, and one-quarter are motivated by the perceived growing importance of data, and a need to collaborate across roles using data.
The primary motivations do not convey a sense of immediacy. “To perform current job” and other more problem-related motivations had lower response rates.
Which of the following best expresses why you would be interested in improving your data skills?
32% of total respondents
Motivations

33
Which of the following best expresses why you would be interested in improving your data skills?
Motivations by Role
% of total respondents within each role

Which topics would you be interested in learning more about?
% of total respondents
Topics
34
TOPICS“Big data” and “Predictive analytics” attracted large interest, perhaps given their popularity and a currency beyond data circles. “Predictive analytics” was popular across roles (see next page), while “Big data” was more popular among data-oriented respondents. Non-technical staff showed a relatively larger level of interest in statistics. These topics may be used as a “draw” or entry point for user engagement, however many may not be appropriate for the core curriculum for the scope of most roles.
“Big data” and “predictive analytics” were of primary interest, perhaps due to their popularity in popular discourse.

Topics by Role Which topics would you be interested in learning more about?
35
% of total respondents within each role

Most participants have received written materials and used video tutorials. While these categories were not rated as highly effective, they were still considered to be the most effective among the available options.
There was a significant drop across all engagement models between those that participants had been part of, and those they believed to be effective. The most significant drop was for webinars, which were only considered effective by 30% of their original audiences, as compared to the others considered to be effective by about 50% of their audiences.
There was a significant drop (about 50%) across all engagement models between those that participants had been part of, and those they believed to be effective. Written materials and video tutorials were considered the most effective engagement models.
Engagement Models
% of total respondents
BEEN PART OF
EFFECTIVE
Which of the following learning methods have you personally engaged in? Which did you feel were most effective?
36

% of total respondents
Engagement Models Which of the following learning methods should the Centre for Humanitarian Data offer?
37
ENGAGEMENT MODELS - WHAT THE CENTRE SHOULD OFFERVideo tutorials were the most desired engagement model across almost all groups. Data-oriented staff also showed a preference for written material. Quick learn modules and self-paced e-learning were also moderately desired by almost all groups. Notably, in-person or interpersonal engagement models (conferences, workshops, mentoring, peer learning) were not highly desired by many, apart from managerial and non-technical staff who showed some interest in one day workshops.
Video tutorials emerged as the most desired engagement model across almost all groups. Quick learning, self-paced e-learning, and written material were also desired, however responses vary by role.

Engagement Models by Role Which of the following learning methods should the Centre for Humanitarian Data offer?
38
% of total respondents within each role

SURPRISINGWith regards to motivations, “to perform current job” and other more problem-related motivations had lower response rates. These responses would have conveyed a greater sense of urgency or immediate need for data literacy tools and skills.
CONFORMINGWebinars were considered least effective by those who had participated in them. While they may be ineffective, the low level of interest may be due to fatigue of a commonly used engagement model, or because webinars were not used as part of a comprehensive learning pathway.
Recommendation:The topics of interest may be used as a “draw” or entry point for user engagement strategy, however many may not be appropriate for the core curriculum for most roles.
Motivations, Topics and Engagement Summary
39
Improving overall capabilities, and improving the humanitarian response are the strongest motivators, these do not convey a sense of immediacy.Other motivating forces include building personal expertise, current job performance, perceptions of the growing importance of data, and enabling team collaboration.
“Big data” and “predictive analytics” were of primary interest.Predictive analytics was of particular interest to the majority of respondents. Less technical respondents also indicated interested in statistics, while more technical respondents were interested in big data. Nearly half selected data responsibility.
Self-directed learning methods were among the most desired engagement models.Video tutorials, quick learning modules, self-paced learning, and other written material were the most desired engagement models. Webinars were considered least effective by those who had participated in them.

SegmentsWHO ARE THE PRIORITY AUDIENCES? WHAT ARE THEIR ACTIVITIES, STRENGTHS, AND PAIN POINTS? WHAT DO THEY WANT TO LEARN, AND HOW DO THEY WANT TO BE ENGAGED?
This section segments priority audiences and breaks out distinguishing factors of their activities, challenges, motivations and engagement preferences in order to identify addressable opportunity areas.
HQ and Regional Program Management1
Heads of Office and Country Directors 2
Country Program Teams and HAOs3
Data Management Teams4

WHY WE CHOSE THESE SEGMENTSHQ and regional senior management, as well as heads of office and country directors, influence internal teams and partner organisations, impacting systems more significantly than other roles.
HAOs and Programme Management can strengthen internal systems and are vital in the translation of data across roles.
Technical staff are frequently eager to upskill. Providing technical training will be broadly appreciated across organisations, and additionally provides an opportunity to share Centre-specific tools and resources that are primarily used by these staff.
Our data includes humanitarians both within and outside of OCHA. To what extent should our programs target partners? Which groups can we best influence?
Bottom up, skills development: ● Data and Information
Management (all office types, all locations, with breakdown for potential priority regions)
Should we work with OCHA and partner Organisations? Should we segment further by geography?
Within OCHA – Should we segment further by geography?
Top down, systems strengthening: ● Program Management
(Regional and HQ office types, all locations)
● Head of Office/Country Directors (all office types, all locations)
Mid-level management, translation:● Humanitarian Advisor/
Expert (all office types, all locations, with breakdown for potential priority regions)
Should we work with OCHA and partner organisations?
41

HQ and Regional Program ManagementACTIVITIES, CHALLENGES, COMPETENCIES, MOTIVATIONS, INTERESTS, AND ENGAGEMENT PREFERENCES
42

Analysing data, using data for decision making, and program planning are the primary activities that HQ and Regional management engage in. Their largest challenges echo those of the broader dataset – particularly assessing and improving the quality of data, and collecting data. Other notable challenges include analysing data, getting investment for data activities, and using data in decision making. Two potential pathways emerge from this result: 1) improving capabilities in current activities (analyzing data, and using data for decision making), and 2) building new capabilities (assessing and improving the quality of data, getting investment for data-related activities).
Increasing capabilities around assessing and improving the quality of data, analyzing data, using data for decision making, and getting data investment present areas of opportunity.
Activities and Challenges Which of the following aspects of data are you typically involved in? Which do you find most challenging?
43% of respondents
ACTIVITIES
CHALLENGES
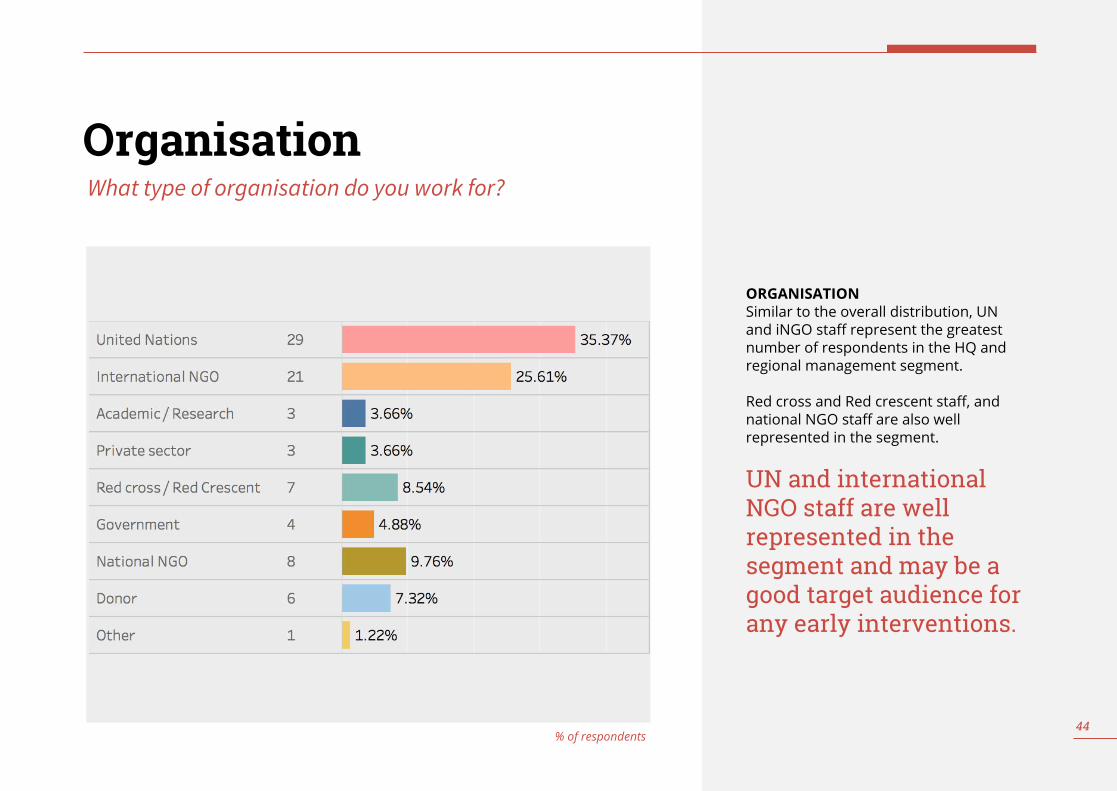
ORGANISATIONSimilar to the overall distribution, UN and iNGO staff represent the greatest number of respondents in the HQ and regional management segment.
Red cross and Red crescent staff, and national NGO staff are also well represented in the segment.
UN and international NGO staff are well represented in the segment and may be a good target audience for any early interventions.
What type of organisation do you work for?
% of respondents
Organisation
44

45
Competencies
While it is not required that HQ and regional management be experts in technical activities, increasing expertise in non-technical data skills, and comfort interfacing with technical staff, will strengthen data teams and systems.
Specific areas of opportunity include: 1) improving the quality of data by identifying staff skills, identifying problem areas, assessing and improving data quality, 2) improving analysis by framing better questions for analysis, and 3) improving decision making by using data to identify problems, adjust programs, and ensure responsible use.
Competencies show specific opportunities to improve quality of data, data analysis, decision making, and responsibility.
What is your skill level with each of the following tasks?
% of respondents

Similar to the overall response, HQ and regional managers are motivated to improve their data skills to make the humanitarian response more effective, and to improve their overall capabilities. Approximately one quarter see data as currently and increasingly relevant to their work, and want to increase expertise. Also in line with other respondents, they are most interested to learn predictive analytics, statistics, and big data.
Focussing on building capabilities and contributing to humanitarian effectiveness may drive interest. Content on predictive analytics, statistics and big data may spark initial engagement or sustain interest, but they must link through to mission.
Motivations and TopicsWhich of the following expresses your motivations? Which topics would you be interested in learning more about?
% of respondents
MOTIVATIONS
TOPICS
46

ENGAGEMENT MODELSSimilar to most staff, HQ and regional managers are most interested in self-directed learning (video tutorials, e-learning courses, quick-learn modules, and other written material). However, unlike other groups they also express interest in one-day in-person workshops. Blended approaches that allow for in-person engagement of this smaller, more senior audience, extended by self-directed modules may be the most effective pathways to engagement. These in-person models also allow for group sharing and cross-pollination between offices, contexts and domains, as well as breaking down stigma related to not understanding data concepts that now carry rapidly increasing currency across sectors. Resources should encourage community engagement in this segment for broader systems change.
For this more senior audience, in-person learning, extended with self-initiated pathways may satisfy their learning needs.
Which of the following learning methods should the Centre offer?
% of respondents
Engagement Models
47

Heads of Office and Country Directors ACTIVITIES, CHALLENGES, COMPETENCIES, MOTIVATIONS, INTERESTS, AND ENGAGEMENT PREFERENCES
48

Similar to HQ and regional management, heads of office and country directors are involved in using data for decision making, analysing data, and program planning. However at a country level, they are also more involved in collecting primary data. While competency-related challenges exist around analysing data and assessing and improving the quality of data, more systemic challenges arise around getting investment for data activities. Present needs to improve their own capabilities and the capabilities of their teams to collect and use data may may underlie their need to convince more senior stakeholders to invest in these data activities.
Both competency-related (analysing data, assessing and improving the quality of data) and systemic challenges may be well-supported by improved data literacy and investment.
Activities and Challenges Which of the following aspects of data are you typically involved in? Which do you find most challenging?
49
ACTIVITIES
CHALLENGES
% of respondents

ORGANISATIONSimilar to the overall distribution, UN and iNGO staff represent the greatest number of respondents in the Heads of Office and Country Director segment.
UN and international NGO staff are well represented in the segment and may be a good target audience for any early interventions.
What type of organisation do you work for?
% of respondents
Organisation
50

Competencies
Although it is not required that senior country management be experts in many technical data activities, building such expertise can strengthen their teams, partnerships, and collaborations internally and externally in and among their offices and organizations.
Opportunity areas include 1) improving the quality of data: identifying staff skills, identifying problem areas, assessing and improving data quality, 2) improving analysis: framing questions for analysis, evaluating and summarizing results, interpreting data products, and 3) encouraging investment in data: use data to identify problems and support program adjustments.
Improving the quality of data and data analysis may drive investment in data in offices and across organizations.
What is your skill level with each of the following tasks?
% of respondents
51

Similar to the full dataset, heads of office and country directors are most motivated to improve their data skills so that they can make the humanitarian response more effective, and secondly to improve their overall capabilities. They are also most interested to learn predictive analytics, statistics, and big data.
Notably, there is significant interest in data responsibility and security, which aligns well with the Centre’s strategic goals and complements any ambition to big data and predictive analytics.
Emphasising contributions to overall humanitarian response may drive interest. Offering content on predictive analytics, statistics and big data may attract audiences. However content on data responsibility and security are desired and align with the Centre.
Motivations and TopicsWhich of the following expresses your motivations? Which topics would you be interested in learning more about?
52
MOTIVATIONS
TOPICS
% of respondents

ENGAGEMENT MODELSThe country-level senior management staff are very similar to HQ and regional managers. They are most interested in self-directed learning (video tutorials, e-learning courses, quick-learn modules, and other written material), however they are also interested in one day in-person workshops. Blended approaches that leverage in-person engagement reinforced by self-directed resources are more likely effective and sustainable learning pathways. In-person engagement creates space for community learning and fosters longer-term cross-pollination.
In-person learning, reinforced with self-directed modules may satisfy their learning preferences and strengthen community connections.
Which of the following learning methods should the Centre offer?
% of respondents
Engagement Models
53

Humanitarian Advisors and Experts
54
ACTIVITIES, CHALLENGES, COMPETENCIES, MOTIVATIONS, INTERESTS, AND ENGAGEMENT PREFERENCES

Similar to heads of office and country directors, humanitarian advisors are involved in analysing data, using data for decision making, and program planning, however report little curation and storytelling such as might be used to secure more investment in data. The most significant challenges exist around assessing and improving the quality of data. Secondary challenges include collecting primary data, and analysing data. Using data in decision making and producing data products are also challenges, which may speak to the translational role they play between data teams and senior management, highlighted by those challenged in using data to generate insights.
Humanitarian advisors play a translational role for data management teams. Addressing their needs to better collect, assess and improve data quality and communicate it are opportunities to leverage their influence.
Activities and Challenges Which of the following aspects of data are you typically involved in? Which do you find most challenging?
55
ACTIVITIES
CHALLENGES
% of respondents

ORGANISATIONUN staff represent 43% of the respondents in this segment.
iNGO staff are also well represented, followed by Red cross and Red crescent and donor staff.
UN staff make up a significant portion of respondents in the segment and may be a good target audience for any early interventions.
What type of organisation do you work for?
56% of respondents
Organisation

Competencies
Humanitarian advisors may not require highly specialized technical competencies, however they do require competencies that can support data collection and use in their teams.
Specific opportunities include: 1) improving the quality of data and data collection by identifying staff skills, identifying problem areas, identifying errors in data, and assessing and improving data quality; 2) improving analysis and data products by helping them frame questions for analysis, evaluate and summarize results, and interpret data products.
These competencies demonstrate specific opportunities to support improvement of the quality of data and primary data collection.
What is your skill level with each of the following tasks?
% of respondents
57

Again similar to broad trends in the full dataset, humanitarian advisors are most motivated to improve their data literacy to make the humanitarian response more effective, and secondly to improve their overall capabilities. They are also most interested to learn predictive analytics and big data. There is also significant interest in statistics, which may tie into their challenges around data collection, analysis, and quality assessment.
Emphasising contributions to the overall humanitarian data system may drive uptake. Including content on predictive analytics and big data may spark initial engagement and sustain interest, but are not fully representative of urgent, contextual needs.
Motivations and TopicsWhich of the following expresses your motivations? Which topics would you be interested in learning more about?
58
MOTIVATIONS
TOPICS
% of respondents

ENGAGEMENT MODELShumanitarian advisors are most interested in self-directed learning (video tutorials, e-learning courses), yet are also interested in in-person or interpersonal modes of engagement (e.g. one-day and week-long workshops, teacher facilitated e-learning). Given the significant number of staff in this segment, large scale in-person activities may be prohibitively expensive to scale. A combination of teacher-facilitated e-learning with self-directed modules may be an effective pathway for learners, coupled with a network model that sustains engagement in the community. Close collaboration with partners is also likely to unlock success for the Centre here.
Given the large number of staff in this segment, networks that host facilitated e-learning with self-directed resources may be the most effective pathways.
Which of the following learning methods should the Centre offer?
59% of respondents
Engagement Models

East and Southern Africa: Challenges & Engagement
60
% of respondents
CHALLENGES
ENGAGEMENT
Unlike the broader humanitarian advisors group, staff in East and Southern African locations report no challenges around analysing data, and limited challenges on collecting primary data. Their most significant challenge is around assessing and improving the quality of data. Producing information and data products and using data in decision making remain challenges.
Engagement preferences are in line with the broader group’s desire for self directed learning. Self-paced e-learning, quick learn modules, and written materials are the most popular. There is limited appetite in this group for playbooks, formal courses, and peer learning.
For humanitarian advisors in East and Southern Africa, assessing and improving the quality of data is their most pressing concern, while analyzing data is of no concern. Similar to the broader group, this sub-group also prefers self directed engagement models.

West and Central Africa: Challenges & Engagement
61
CHALLENGES
ENGAGEMENT
The most pressing concerns of staff in West and Central African locations are in line with the broader humanitarian advisors group. Their most significant challenges are around assessing and improving the quality of data, collecting primary data, and using data for decision making. Analysing data remains a challenge, and sourcing secondary data is a greater challenge in this sub-group. Data visualisation and storytelling are of no concern.
Engagement preferences are in line with the broader group’s desire for self directed learning. Self-paced e-learning, and video tutorials are the most popular, however, unlike the broader group webinars are also of interest.
For humanitarian advisors staff in West and Central Africa, assessing and improving the quality of data is their most pressing concern. Similar to the broader group, this sub-group also prefers self directed engagement models.
% of respondents

Middle East and North Africa: Challenges & Engagement
62
CHALLENGES
ENGAGEMENT
Unlike the broader humanitarian advisors group, staff in the Middle East and North African locations report most significant challenges around collecting primary data. Getting investment for data activities is also a key challenges in this region. Other concerns are in line with the broader humanitarian advisors group, including assessing and improving the quality of data and analyzing data.
Engagement preferences diverge somewhat from the broader group, with more interest in intermediated models. Teacher facilitated e-learning was most popular (and remains a relatively low investment model). Quick learn models, self paced e-learning are also of interest, and weeklong workshops also scored highly (which would require significantly more Centre investment).
For humanitarian advisors in the Middle East and North Africa, collecting primary data is their most pressing concern. They prefer a mixture of self guided and intermediated engagement models.
% of respondents

Data and Information ManagementACTIVITIES, CHALLENGES, COMPETENCIES, MOTIVATIONS, INTERESTS, AND ENGAGEMENT PREFERENCES
63

As expected, data and information management staff are broadly involved in many data tasks, including: analysing data, visualizing data, assessing and improving the quality of data, and data aggregation and curation, among others. Their most significant challenges are in assessing and improving the quality of data, and collecting primary data. Getting investment for data activities, and secondary data sourcing are also significant challenges, and may represent root causes of their challenges in collection, assessment and improvement.
Increasing capabilities around assessing and improving the quality of data, and collecting primary data present emerging opportunity areas, particularly if paired with increased mid and senior level engagement and investment.
Activities and Challenges Which of the following aspects of data are you typically involved in? Which do you find most challenging?
64% of respondents
ACTIVITIES
CHALLENGES

ORGANISATIONUN staff represent the majority of the respondents in this segment (56%).
iNGO staff are also well represented, followed by respondents from the Red cross and Red crescent.
UN staff make up the majority of respondents in the segment and may be a good target audience for any early interventions.
What type of organisation do you work for?
% of respondents
Organisation
65

Competencies
Data and information management staff should be experts in many of these tasks. While many are already proficient, expertise is perhaps surprisingly low and presents a clear opportunity for further capability building in this segment.
Specific opportunities include: 1) improving quality of data and data collection by strengthening their ability to identify errors in data, assess and improve data quality, and use data standards including HXL for interoperability; and 2) improving the collection of primary data by defining methodologies for use.
Advancing from proficiency to confident expertise is critical to strengthening humanitarian data culturally, as well as overall quality.
What is your skill level with each of the following tasks?
% of respondents
66

In line with the overall response, data and information management staff are most motivated to improve their data literacy to make the humanitarian response more effective, and secondly to improve their overall capabilities. They are also most interested to learn big data, predictive analytics and statistics. There is also significant interest in computer programming/coding and data security in this segment. This interest in data security creates an opportunity for the Centre as they expand their data policy and standards workstream.
Emphasising the contribution to the overall humanitarian data system, and showing impact, will likely drive uptake. Including content on big data, predictive analytics, and statistics may drive initial interest and engagement.
Motivations and TopicsWhich of the following expresses your motivations? Which topics would you be interested in learning more about?
% of respondents 67
MOTIVATIONS
TOPICS

ENGAGEMENT MODELSData and information management staff are most interested in self-directed learning (video tutorials, e-learning courses, quick-learn modules), yet unlike all other groups, they are also interested in-person approaches such as weeklong workshops. (See following pages on regional variance.) Given the significant number of staff in this segment, large scale in-person activities are prohibitively expensive to scale.
Self-directed or moderately intermediated modules may be a more feasible, sustainable pathway, coupled with an infrastructure that can support community engagement through online, peer-learning, office hackathons, and distributed mentorship models. This aligns with methods used by technical experts, such as developers (“Google-ing” functions and methods, consulting online forums, debugging with colleagues, etc.).
Given the large number of staff involved, self directed modules may be the most feasible pathway.
Which of the following learning methods should the Centre offer?
% of respondents
Engagement Models
68

East and Southern Africa: Challenges & Engagement
69
% of respondents
CHALLENGES
ENGAGEMENT
Unlike the broader data and information management group, staff in East and Southern African locations report less significant challenges around analysing data, and assessing and improving the quality of data. Their most significant challenge is around collecting primary data. Getting investment for data activities, and secondary data sourcing remain challenges.
Engagement preferences are in line with the broader group’s desire for a mixture of intermediated and self directed learning. Video tutorials and written materials are the most popular, however there is also significant interest around weeklong workshops - in line with the broader group.
For data and information management staff in East and Southern Africa, collecting primary data is their most pressing concern. Similar to the broader group, this sub-group prefers a mixture of self guided and intermediated engagement models.

West and Central Africa: Challenges & Engagement
70
CHALLENGES
ENGAGEMENT
Similar to the broader data and information management group, staff in West and Central African locations report challenges around analysing data, assessing and improving the quality of data, and collecting primary data. Secondary data sourcing, getting investment for data activities, and producing data and information products remain challenges.
Staff in West and Central African locations have a preference for self directed learning. Video tutorials, quick learn modules, are the most popular, however there is also significant interest around written material and teacher facilitated e-learning.
For data and information management staff in West and Central Africa, collecting primary data is their most pressing concern. This sub-group prefers self guided engagement models.
% of respondents

Middle East and North Africa: Challenges & Engagement
71
CHALLENGES
ENGAGEMENT
Very similarly to the broader data and information management group, staff in West and Central African locations report challenges around collecting primary data, and assessing and improving the quality of data. Secondary data sourcing, and using data in decision making are also significant challenges for this sub-group.
Staff in Middle East and North African locations preferences are in line with the broader group’s desire for a mixture of intermediated and self directed learning. Video tutorials and weeklong workshops are the most popular, with some interest in self-paced e-learning and quick learn modules.
For data and information management staff in the Middle East and North Africa, collecting primary data is their most pressing concern. Similar to the broader group, this sub-group prefers a mixture of self guided and intermediated engagement models.
% of respondents