Embed Size (px)
Citation preview

DataStreme Ocean: The Ocean in the Earth System
AMS/NOAA Cooperative Program for Earth System Education
American Meteorological Society
DataStreme Ocean: The Ocean in the Earth System
The American Meteorological Society (AMS), founded in 1919, is a scientific and professional society. Interdisciplinary in its scope, the Society actively promotes the development and dissemination of information on the atmospheric and related oceanic and hydrologic sciences. AMS has more than 14,000 professional members from more than 100 countries and over 175 corporate and institutional members representing 40 countries. The Education Program is the initiative of the American Meteorological Society to foster the teaching of atmospheric, oceanic, hydrologic and related topics across the curriculum in grades K-12. It is a unique partnership between scientists and teachers with the ultimate goal of attracting young people to further studies in science, mathematics and technology via the development and dissemination of scientifically accurate, up-to-date, and instructionally sound resource materials for teachers and students. DataStreme Ocean, a major component of the AMS education initiative, is part of the Cooperative Program for Earth System Education (CPESE), a teacher enhancement program conducted with support from the National Oceanic and Atmospheric Administration (NOAA) and State University of New York at Brockport. DataStreme Ocean provides teachers with a comprehensive study of oceanography from the perspective of the Earth system and current environmental information while simultaneously considering classroom applications. It provides real experiences demonstrating the value of computers and electronic access to time-sensitive information.
This project was supported, in part, by the
National Oceanic and Atmospheric Administration Opinions expressed are those of the authors and not necessarily
those of the Administration All rights reserved. No part of this publication may be reproduced, stored in a retrieval system, or transmitted, in any form or by any means, electronic, mechanical, photocopying, recording or otherwise, without the prior written permission of the publisher. Permission is hereby granted for the reproduction, without alteration, of materials contained in this publication for non-commercial use in schools or in other teacher enhancement activities on the condition their source is acknowledged. This permission does not extend to delivery by electronic means. ©2010 American Meteorological Society 45 Beacon Street. Boston, MA 02108
i
ii
The Earth's Ocean An Earth System Approach
The Theoretical Framework of DataStreme Ocean
Earth is a complex and dynamic system with a surface that is more ocean than land. The ocean interacts continuously with the atmosphere, geosphere, cryosphere, and biosphere by exchanging, storing and transporting matter and energy.
By far the largest reservoir of water on the planet, the ocean anchors the global hydrological cycle—the continual flow of both water and energy within the Earth system. As a major component of all other biogeochemical cycles, the ocean is the final destination of water-borne and air-borne materials.
The ocean’s range of physical conditions and supply of essential nutrients provide a wide variety of marine habitats for a vast array of living organisms.
The ocean’s great thermal inertia, radiative properties, and surface- and deep-water circulations make it a primary control in Earth’s climate system.
Society impacts and is impacted by the ocean. Humans rely on the ocean for livelihood, commerce, natural resources, security, and to disperse wastes.
Humankind’s intimate relationship with the sea calls for continued scientific assessment, prediction, and stewardship to achieve and/or maintain environmental quality and sustainability. Welcome to DataStreme Ocean! You are about to be introduced to the study of Earth system science through the investigation of Earth's ocean. The statement above describes the ocean, why it is important, and how it impacts all of our lives.
Because the ocean is the major reservoir in Earth's water cycle which is so critical to the functioning of all portions of the Earth system and is so pervasive on our planet, it is an ideal vehicle to study science. The ocean will be studied by the use of remotely sensed data that are readily available via the Internet. It’s also a great way to begin exploring the potential of the Internet as a provider of current information about the environment.
This guide first describes the ocean as a subsystem of the Earth and the concept of Earth as a system. The scientific processes that act within the ocean and across the interfaces of the ocean with other portions of the Earth system are highlighted.
Hands-on investigations follow that show how water can be tracked through the Earth system, how the ocean bottom topography reflects plate tectonics, how the ocean and atmosphere interact, and how ocean circulations are driven by wind and density variations. In each investigation, you will be shown how you can apply what you have learned to understand and interpret ocean information delivered to your school by Internet.
The contents of this guide have been developed as part of the American Meteorological Society’s DataStreme Ocean course and are primarily intended for peer-training use by Ocean Education Resource Teachers. Major funding for DataStreme Ocean is through the Cooperative Program for Earth System Education (CPESE) supported by the National Oceanic and Atmospheric Administration (NOAA).
Contents:
Narrative: Ocean in the Earth System Activity A: Ocean in the Global Water Cycle Activity B: Ocean Bottom Topography Activity C: Ocean - Atmosphere Connections Activity D: Seawater Temperature and Surface Ocean Currents

Ocean in the Earth System What is the Earth system and more fundamentally, what is a system? A system is an interacting set of components that behave in an orderly way according to the fundamental principles of physics, chemistry, geology, and biology. Based on extensive observations and understanding of a system, scientists can predict how the system and its components are likely to respond to changing conditions. This predictive ability is especially important in dealing with the complexities of global climate change and its potential impacts on Earth’s subsystems. The Earth system consists of four major inter-acting subsystems: hydrosphere, atmosphere, geosphere, and biosphere. Here we briefly examine each subsystem,
its composition, basic properties, and some of its interactions with other components of the Earth system. The full-disk visible satellite view of Planet Earth in Figure 1 shows all the major subsystems of the Earth system. The ocean is the most widespread feature; clouds partially obscure the ice sheets that cover much of Greenland and Antarctica; and the atmosphere is made visible by swirling storm clouds over the Atlantic and Pacific Oceans. Land (part of the geo-sphere) shows lighter in green and brown than the ocean as the latter absorbs more incoming solar radiation. The dominant color of Earth from space is blue because the ocean covers more than two-thirds of its surface; in fact, often Earth is referred to as the “blue planet” or “water planet.”
Figure 1. Visible satellite view of Earth.
[http://veimages.gsfc.nasa.gov/2429/globe_west_2048.jpg]
1

THE HYDROSPHERE
The hydrosphere includes water in all three phases (ice, liquid, and vapor) that continually cycles from one reservoir to another within the Earth system. (We discuss the global water cycle in more detail later.) Water is unique in the Earth system in that it is the only naturally occurring substance that co-exists in all three phases at normal temperatures and pressures on Earth’s surface. The ocean, by far the largest reservoir in the hydrosphere, covers about 70.8% of the planet’s surface and has an average depth of approximately 3.8 km (2.4 mi) but accounts for only 0.02% of Earth’s mass. About 97% of the hydrosphere is ocean salt water. The next largest reservoir in the hydrosphere is glacial ice, most of which covers much of Antarctica and Greenland. Considerably smaller quantities of water occur on the land surface (lakes, rivers), in the subsurface (soil moisture, groundwater), the atmosphere (water vapor, clouds, precipitation), and biosphere (plants, animals). The hydrosphere is dynamic. Earth’s waters are continually moving although at different rates through different parts of the Earth system. Nonetheless, the ocean is the ultimate destination of all water moving on or beneath the land surface. Water flowing in river or stream channels may take a few weeks to reach the ocean. Groundwater typically moves at a very slow pace through fractures and tiny openings in subsurface rock and sediment and feeds into rivers, lakes, or directly into the ocean. Water in large, deep lakes also moves slowly, in some cases taking centuries to reach the ocean. Water frozen into mountain glaciers may take thousands of years to be released to the sea whereas ice in the Greenland and Antarctic ice sheets may be sequestered for hundreds of thousands of years. The ocean and atmosphere are coupled such that surface winds drive surface ocean currents. Wind-driven currents are restricted to a surface ocean layer typically about 100 m (300 ft) deep and require a few months to years to cross an ocean basin. Deep-ocean currents, at depths greater than 100 m (300 ft), are much more sluggish and more challenging to study than surface currents because of the considerable confining pressure and difficulties in making measurements at great depths. Movements of deep-ocean waters are caused primarily by small differences in water density (mass per unit volume) arising from small differences in water temperature and salinity (a measure of dissolved salt content). Cold water, being denser than warm water,
tends to sink whereas warm water, being less dense, is buoyed upward by (or floats on) colder water. Likewise, saltier water is denser than less salty water and tends to sink whereas less salty water is buoyed upward. The combination of temperature and salinity determines whether a water mass remains at its original depth or sinks to the bottom. Even though deep currents are relatively slow, they keep ocean waters well mixed so that the ocean has a nearly uniform chemical composition. The densest ocean waters form in polar or nearby subpolar regions. Salty waters become even saltier where sea ice forms at high latitudes because growing ice crystals exclude dissolved salts. Chilling of this salty water near Greenland and Iceland and in the Norwegian and Labrador Seas further raises its density so that it sinks and forms a bottom current that flows southward under the equatorial surface waters and into the South Atlantic as far south as Antarctica. There deep water from the North Atlantic mixes with deep water formed around Antarctica. Branches of the cold bottom current then spread northward into the Atlantic, Indian, and Pacific basins. Eventually, the water slowly diffuses to the surface, mainly in the Pacific, and then starts its journey on the surface through the islands of Indonesia, across the Indian Ocean, and around South Africa and into the tropical Atlantic. There, intense heating and evaporation make the water hot and salty. This surface water is then transported northward in the Gulf Stream thereby completing the cycle. This so-called ocean meridional overturning (or thermohaline) circulation and its transport of heat energy and salts is an important control of climate. The frozen portion of the hydrosphere, known as the cryosphere, encompasses massive glacial ice sheets, mountain glaciers, ice in permanently frozen ground (permafrost), and the ice floes and bergs floating at sea. All of these ice types except sea ice (frozen sea water) are freshwater. A glacier is a mass of ice that flows internally under the influence of gravity. Huge glacial ice sheets, in places up to 3 km (1.8 mi) thick, cover nearly all of Greenland and Antarctica. The Antarctic ice sheet contains 90% of the ice in the Earth system. Much smaller glaciers (tens to hundreds of meters thick) primarily occupy the highest mountain valleys on all continents. At present, glacial ice covers about 10% of the planet’s land area but at times during the past 1.7 million years, glacial ice expanded over as much as 30% of the land surface, primarily in the
2

Northern Hemisphere. At the peak of the last glacial advance, about 20,000 to 18,000 years ago, the Laurentide ice sheet covered much of Canada and the northern tier states of the United States. At the same time, a smaller ice sheet buried the British Isles and portions of northwest Europe. Meanwhile, mountain glaciers worldwide thickened and expanded. Glaciers form where annual snowfall exceeds annual snowmelt. As snow accumulates, the pressure of the overlying snow converts snow to ice. As the ice forms, it preserves traces of the original seasonal layers of snow and traps gas bubbles. Chemical analysis of the ice layers and air bubbles in the ice provides clues to climatic conditions at the time the original snow fell. Ice cores extracted from the Greenland and Antarctic ice sheets yield information on changes in Earth’s climate and atmospheric composition extending back hundreds of thousands of years. Under the weight of the overlying snow and ice, glacial ice flows slowly from sources at higher latitudes or higher elevations (where some winter snow survives the summer) to lower latitudes or lower elevations, where the ice either melts or flows out to the nearby ocean. Glaciers normally expand (thicken and advance) and shrink (thin and retreat) very slowly in response to changes in climate (long-term average temperature and snowfall). Mountain glaciers take decades to centuries to form or totally disappear. On the other hand, continental ice sheets change on time scales of tens of thousands to hundreds of thousands of years. Around Antarctica, streams of glacial ice flow out to the ocean. Ice, being less dense than seawater, floats, forming ice shelves (typically about 500 m or 1600 ft thick). Masses of ice break off the shelf edge, forming flat-topped icebergs that are carried by surface ocean currents around Antarctica. Likewise, irregularly shaped icebergs break off the glacial ice streams of Greenland and flow out into the North Atlantic. In 1912, the newly launched luxury liner, Titanic, struck a Greenland iceberg, southeast of Newfoundland and sank with the loss of more than 1500 lives. Most pack ice surrounding Antarctica forms each winter through freezing of surface seawater. During summer most of the sea ice around Antarctica melts whereas in the Arctic Ocean sea ice can persist for several years before flowing out through Fram Strait into the Greenland Sea and eventually melting. This “multi-year” ice loses salt content with age, so that Eskimos harvest this older, less salty ice for drinking water.
THE GLOBAL WATER CYCLE
We can reasonably assume that the total amount of water in the Earth system is neither increasing nor decreasing although natural processes continually generate and breakdown water. Water vapor accounts for perhaps half of all gases emitted during a volcanic eruption; at least some of this water (called juvenile water) was originally sequestered in magma and solid rock. Volcanic activity is more or less continuous on Earth and adds to the supply of water. Also, a minute amount of water is contributed to Earth by meteorites and other extraterrestrial debris continually bombarding the upper atmosphere. At the same time, intense solar radiation entering the upper atmosphere converts (photodissociates) a small amount of water vapor into its constituent hydrogen and oxygen atoms, which may escape to space. Also, water chemically reacts with other substances and is thereby locked up in various compounds. Annual additions of water from volcanic eruptions roughly equal losses of water through photodissociation of water vapor and chemical reactions. This balance of give and take has prevailed on Earth for perhaps millions of years. The fixed quantity of water in the Earth’s system is distributed in its three phases among oceanic, terrestrial (land-based), atmospheric, and biospheric reservoirs. The ceaseless movement of water among its various reservoirs on a planetary scale is known as the global water cycle (Figure 2). In brief, water vaporizes from ocean and land to the atmosphere where winds can transport water vapor thousands of kilometers. Clouds form and rain, snow and other forms of precipitation fall from clouds to Earth’s surface and recharge the ocean and the terrestrial reservoirs of water. From terrestrial reservoirs, water seeps and flows back to the ocean. The continuity of the global water cycle is captured in a verse from Ecclesiastes: “Every river flows into the sea, but the sea is not yet full. The waters return to where the rivers began and starts all over again.”
Transfer of water between Earth’s surface and the atmosphere is key to the existence of the global water cycle. Water cycles from Earth’s surface to the atmosphere via evaporation, sublimation, and transpiration. Ultimately, solar radiation supplies the heat energy for these phase changes and powers the global water cycle. Evaporation is the process whereby water changes from a liquid to a vapor. Water evaporates from the surface of bodies of water including
3

Figure 2. Global Water cycle
the ocean, lakes, and rivers as well as from soil and the damp surfaces of plant leaves and stems. About 85% of the total annual evaporation in the Earth system takes place at the ocean surface so that the ocean is the principal source of water in the atmosphere. During sublimation water changes directly from a solid to a vapor without first becoming liquid. Through sublimation, snow banks shrink and patches of ice on sidewalks and roads disappear even while the air temperature remains below freezing.
Transpiration is the process whereby water that is taken up from the soil by plant roots eventually escapes as vapor through the tiny pores (called stomates) on the surface of green leaves. On land during the growing season, transpiration is considerable and is often more important than direct evaporation of water in delivering water vapor to the atmosphere. A single hectare (2.5 acres) of corn typically transpires 34,000 liters (8800 gallons) of water per day. Measurements of direct
evaporation from Earth’s surface plus transpiration are often combined as evapotranspiration.
Water cycles from the atmosphere to land and ocean via condensation, deposition, and precipitation. Condensation is the process whereby water changes phase from vapor to liquid (in the form of small droplets). Water droplets forming on the outside surface of a cold can of soda on a warm and humid day is an example of condensation of water vapor. Deposition is the process whereby water changes directly from vapor to solid (ice crystals) without first becoming a liquid. Frost on an automobile windshield is the consequence of deposition of water vapor. Condensation or deposition within the atmosphere produces clouds. Precipitation is water in frozen or unfrozen forms (e.g., rain, drizzle, snow, ice pellets, hail) that falls from clouds and reaches Earth’s surface.
Significantly, evaporation (or sublimation) followed by condensation (or deposition) purifies water. As water vaporizes (evaporation, transpiration, or
4

sublimation), all suspended and dissolved substances such as sea salts are left behind. Through this natural cleansing mechanism, ocean water that originally was too salty to drink eventually falls as freshwater precipitation, replenishing reservoirs on Earth’s surface. Purification of water through phase changes is known as distillation. Although precipitation is fresh water, it is not free of all dissolved or suspended materials. Condensation and deposition take place on tiny particles suspended in the atmosphere, slightly altering the chemical composition of cloud and precipitation particles. Also, as precipitation falls through the atmosphere, it dissolves or captures gases or suspended particles that also change its composition (e.g., acid rain).
Return of water from the atmosphere to the land and ocean via condensation, deposition, and precipitation completes an essential subcycle in the global water cycle. To learn more about the atmosphere-Earth’s surface subcycle of the global water cycle, we compare the movement of water between the continents and the atmosphere with that between the ocean and atmosphere. The balance sheet for inputs and outputs of water to and from the various global reservoirs is called the global water budget (Table 1). Over the course of a year, the volume of precipitation (rain plus melted snow) that falls on land exceeds the total volume of water that vaporizes (via evaporation, transpiration, and sublimation) from land by about one-third. (This imbalance occurs because land masses favor certain precipitation-forming mechanisms.) Over the same period, the volume of precipitation falling on the ocean is less than the volume of water that evaporates from the ocean. (This imbalance occurs because the ocean surface supplies a nearly limitless supply of water for evaporation.) The global water budget thus indicates an annual net gain of water mass
on the continents and an annual net loss of water mass from the ocean. The annual excess of water on the continents about equals the deficit from the ocean. But year after year the continents do not get any wetter and sea level is not changing appreciably because excess water on land drips, seeps, and flows back to the sea, thus completing the global water cycle. The net flow of water from land to sea also is maintained by a net flow of atmospheric water from sea to land.
The flow of excess surface and subsurface water from the continents to the ocean has important implications for the composition of seawater and the global distribution of water pollutants. The ocean is the ultimate destination for all substances dissolved or suspended in surface or subsurface waters. This is one (but not the only) source of salt in seawater. The ocean is also the ultimate destination of contaminants dumped into waterways (e.g., rivers, streams, canals). These contaminants primarily end up in estuaries and other coastal waters, which are also the most productive portion of the ocean. Not surprisingly, considerable debate centers on the capacity of the ocean to assimilate waste—especially toxic and hazardous industrial waste—without long lasting adverse effects on marine ecosystems. Precipitation that reaches land surface can follow one of several pathways. Some precipitated water vaporizes (evaporates or sublimates) directly back into the atmosphere and some is temporarily stored in lakes, snow and ice fields, or glaciers. Some either flows on the surface as rivers or streams (runoff component) or seeps into the ground as soil moisture or groundwater (infiltration component). The ratio of the portion of water that infiltrates the ground to the portion that runs off depends on rainfall intensity, vegetation, topography, and physical properties of the land surface. For example,
TABLE 1 Global Water Budget
Source Cubic meters per yr Gallons per yr Precipitation on the ocean +3.24 × 10¹⁴ +85.5 × 10¹⁵ Evaporation from the ocean -3.60 × 10¹⁴ -95.2 × 10¹⁵ Net loss from the ocean -0.36 × 10¹⁴ -09.7 × 10¹⁵ Precipitation on land +0.98 × 10¹⁴ +26.1 × 10¹⁵ Evapotranspiration from land -0.62 × 10¹⁴ -16.4 × 10¹⁵ Net gain on land +0.36 × 10¹⁴ +09.7 × 10¹⁵
5

rain falling on frozen ground or city streets mostly runs off whereas rain falling on unfrozen sandy soil readily soaks into the ground. During the growing season, plant roots take up some soil moisture and almost all of that water (98%) transpires back to the atmosphere. Water that seeps to greater depths may completely fill the spaces between particles of soil or sediment or the fractures within rock, constituting groundwater. In most environments, groundwater flows very slowly in the subsurface from recharge areas at Earth’s surface toward discharge areas including wells, springs, rivers, lakes, and the ocean. Where the groundwater reservoir is located well below surface water reservoirs, water may seep out of rivers and lakes and recharge the groundwater reservoir. Rivers and streams plus their tributaries drain a fixed geographical area known as a drainage basin (or watershed). The quantity and quality of water flowing in a river depends on the climate, topography, geology, and land use in the drainage basin. A drainage basin may also include lakes or glaciers, temporary impoundments of surface water.
HUMAN IMPACT ON THE OCEAN
Humans have altered the Earth system to such an extent that human activities are equivalent in magnitude to many geological processes. Human activities impact the orderly functioning of the ocean (and other components of the Earth system) by altering cycling rates and disrupting the equilibrium of biogeochemical cycles. Agriculture, mining, and electrical power generation are examples of widespread human activities that affect the ocean and other components of the Earth system. Most of the waste byproducts of these activities are widely distributed by winds and/or rivers that discharge into the ocean. Consider an example. Runoff from agricultural activities has impacted the ocean, especially in coastal areas. Nitrogen compounds (e.g., nitrates), essential for terrestrial and marine plant growth, are manufactured as fertilizer, and routinely applied to agricultural fields in spring and summer. Excessive nitrogen runoff from fields enters rivers, and eventually reaches bays and coastal waters
Figure 3. Mississippi River watershed and Gulf of Mexico "dead zone".
6
7
causing major pollution problems. Excess nitrogen stimulates explosive growth of algal populations. While alive, these algae shade out sea grasses growing on the bottom, which soon die, depriving other organisms of habitat for reproduction and growth. After they die, algae settle to the bottom and decompose depleting the oxygen dissolved in the near-bottom waters. The result is large volumes of water that can support only bacteria that grow in the absence of oxygen (anaerobic bacteria). Most commercially valuable fish and shellfish (e.g., crabs, oysters) die.
Each summer a large (New Jersey-size) area on the continental shelf off the mouth of the Mississippi River in the Gulf of Mexico becomes devoid of dissolved oxygen (Figure 3). Seasonal changes in weather cause replenishment of dissolved oxygen by late fall. In late 2001, G.F. McIsaac, an environmental scientist at the University of Illinois at Urbana-Champaign, reported that this “dead zone” in the Gulf of Mexico could be alleviated significantly if farmers in the Mississippi River drainage basin cut their application of nitrogen fertilizer by 12%. McIsaac argued that such a reduction would not necessarily reduce crop yields but would decrease the discharge of nitrates into the Gulf of Mexico by one-third by the year 2010. Efforts at mitigating this seasonal zone continue.

Investigation A: OCEAN IN THE GLOBAL WATER CYCLE
(NOTE: Completion of this activity requires Internet access.)
Driving Question: What role does the ocean play in the global water cycle within the
Earth system? Educational Outcomes: Earth’s ocean covers almost 71% of Earth’s surface to an average depth of about 3.8 km (2.4 mi). Earth is truly a water planet, especially when the commanding presence of the ocean is combined with the large expanses of terrestrial ice and snow cover, lakes, groundwater, and the global presence of atmospheric moisture. Central to the functioning of the Earth system is the global water cycle, the ceaseless flow of water, energy, and water-borne materials among the oceanic, terrestrial, and atmospheric reservoirs and their interactions with life on Earth. DataStreme Ocean employs an Earth system approach by focusing on (a) ocean components and boundaries, (b) internal and external processes that involve the ocean, and (c) the role of the ocean in biogeochemical cycles. After completing this investigation, you should be able to: List advantages of the Earth system perspective in understanding the global water cycle. Explain ways in which satellite remote sensing aids our understanding of the ocean. Describe the role of the ocean as the ultimate source of fresh water everywhere on the
planet. A. The Global Water Cycle In the holistic Earth system perspective, Earth is composed of many interacting subsystems including the ocean, atmosphere, geosphere, cryosphere, and biosphere. DataStreme Ocean investigates the role of the ocean in the Earth system. DataStreme Ocean has implications for important contemporary issues including global climate change, air and water quality, food supply, and national security. Figure A1 below schematically illustrates the movements and transformations of water in the Earth system. The figure was developed by the Global Water Cycle program element of the US Global Change Research Program.
A - 1

Figure A1. The Water Cycle (Schematic view) [http://www.usgcrp.gov/usgcrp/images/ocp2003/ocpfy2003-fig5-1.htm]
Figure A1 also displays major aspects of the essential reason why water cycles through its reservoirs, namely, energy flow. The mass flow of water as portrayed in the figure is a response to the non-uniform distribution of energy in the Earth system. Water’s coexistence in all three phases (solid, liquid, vapor) and the relative ease at which it changes phase within the temperature and pressure ranges on Earth makes water the working fluid that absorbs, transports, and releases heat within the Earth system. Water is the primary mover of energy in the Earth system from where there is relatively more to where there is relatively less. Ocean currents transport enormous quantities of heat energy poleward. The ocean is the primary source of atmospheric moisture, accounting for about 85% of all evaporation worldwide. Winds transport water vapor and the latent heat it absorbed during evaporation to every location on Earth, including the highest peaks. Changing back to liquid or solid within the atmosphere, water begins its gravity-driven return trip to Earth’s surface and eventually to the ocean. Development of a more complete and authentic depiction of the global water cycle including both mass and energy flows is an integral part of DataStreme Ocean.
A - 2

1. The depiction of the global water cycle in Figure A1 shows the ocean to the right. Water substance is provided to the ocean by [(surface runoff)(stream flow)(groundwater)(all three processes)]. Precipitation also occurs over the ocean and adds fresh water directly to the ocean surface. Meanwhile, water is lost from the ocean through [(evaporation) (precipitation)]. Not clearly shown are oceanic losses by infiltration of salty groundwater and the additions of water to the ocean via volcanic activity.
Components of the energy flow so essential to the water cycle are schematically shown or mentioned in Figure A1. Figure A2, below, provides striking evidence of some of these energy flows. It depicts the atmospheric component of the global water cycle (and simultaneously portrays the global-scale approach of DataStreme Ocean) by revealing clouds as bright splotches and water vapor as light gray swirls. The circulation of water (clouds, water vapor) in the atmosphere is the essential heat-driven uphill component of the water cycle that can lift water to great altitudes. Atmospheric water is transported horizontally by winds, often traveling great distances before precipitating. The rest of the cycle is gravity driven and downhill. Ocean circulation is driven by winds and by variations in water density resulting from temperature and salinity differences.
Figure A2. A composite satellite image displaying the distribution of water vapor and clouds in the middle region of the atmosphere.
Figure A2 is a composite of images from sensors onboard five geostationary weather satellites sensing water vapor and clouds in the Earth's atmosphere. This image is derived from computer processing of the invisible infrared (heat) radiation emitted by Earth's surface that interacts with water in the middle atmosphere and reaches the satellite's sensors. This particular image is from 1800 UTC (1 p.m. EST) on 22 January 2010.
A - 3

Bright white patches in the image represent the relatively cold tops of high clouds. Clouds occur where atmospheric motions are upward. Medium gray regions depict mainly water vapor. These regions would probably appear clear on visible and ordinary infrared satellite images. Streaks and curls of gray highlight the generally eastward flow of middle atmospheric water vapor transported by large-scale atmospheric motions. Dark areas are relatively dry middle atmosphere regions where air is sinking. 2. Using a straight edge and pen or colored pencil, draw a line horizontally that divides the
image in half and approximates the location of the equator. The bright white cloud patches forming an irregular band roughly along the equator mark areas where huge quantities of water vapor enter the atmosphere from underlying warm ocean surface. These high thunderstorm cloud tops indicate the end product of [(evaporation)(overland runoff)] from the ocean surface. If we viewed a sequence of similar water vapor composite satellite images, it would be evident that in the tropics atmospheric water vapor flows more or less steadily from east to west. The flow is embedded in the trade winds of the low latitudes. (An animation of these images can be found at: www.ssec.wisc.edu/data/comp/wv/wvmoll.mpg).
3. Over the course of a year, the Atlantic Ocean basin loses more water to the atmosphere by evaporation than it receives by precipitation and other sources. This water loss causes Atlantic surface waters to become saltier, thereby increasing their density. At lower latitudes, there is a net flow of atmospheric water vapor evaporated from the Atlantic Ocean westward across Central America to the Pacific Ocean basin. There, precipitation freshens Pacific surface water and [(increases)(decreases)] salt concentration and water density. We will see later that this atmospheric flow of water vapor enhances the meridional overturning (thermohaline) circulation of the world ocean.
4. Large clusters of thunderstorm clouds mark source regions of water vapor that flows into
higher latitudes (shown as broad gray plumes on the satellite image). Darker regions forming two bands located just north and south of the equator indicate [(dry)(humid)] air. These are regions of sinking air that, in combination with the grayer storm swirls at higher latitudes indicating rising air, are evidence of the vertical motions of air that occur in weather systems.
5. The curving swirls of water vapor in the middle latitudes of the Northern and Southern
Hemisphere portions of the image imply that the atmospheric motions [(do)(do not)] transport water vapor horizontally north and south as well as east and west within the atmosphere. Midlatitude swirls are storm systems that transport humid warm air poleward to be replaced by colder and drier polar air moving equatorward. Storm motions transfer [(water mass)(heat energy)(both)] within the Earth system.
6. The band of swirls running east and west in the Northern Hemisphere is at lower latitudes
than the band of swirls in the Southern Hemisphere. This is because in this January view the [(Northern)(Southern)] Hemisphere is warmer. The sun is lower in the Northern Hemisphere sky providing less incoming solar radiation to fuel evaporation. At comparable latitudes in July, [(Northern)(Southern)] Hemisphere locations receive more
A - 4

A - 5
incoming solar radiation. This uneven heating of the Earth drives atmospheric circulation to redistribute heat energy in the Earth system.
The actual global-scale transport of atmospheric water vapor and clouds can be observed via image animation by going to the NASA Global Hydrology and Climate Center homepage (www.ghcc.msfc.nasa.gov/GOES/globalwv.html). Imagery is based on NOAA data. Figure A3 is a global display from the TRMM satellite of precipitation anomalies in millimeters per day for January 2010. An anomaly is the departure of the observed value from its average value. Blues and greens depict positive anomalies (greater than normal rainfall amounts) while yellows and browns are negative anomalies (less than normal.)
Figure A3. TRMM precipitation anomalies for January 2010. 7. Figure A3 shows the greatest rainfall rates in January 2010 as occurring over the
[(Atlantic)(Pacific)(Indian)] Ocean basin.
8. Relatively intense rainfall rates occurred along a band located just [(north)(south)] of the equator, shown by the dashed line across the middle of the image. This is the InterTropical Convergence Zone (ITCZ) which corresponds to the "heat equator." This rainfall band [(does)(does not)] generally correspond to the location of the cloud and water vapor band you identified in question #2.
Figure A2 showed the water vapor that resulted from evaporation of water from the ocean. The TRMM satellite image shows the rainfall returning that water to the ocean. These two satellite views depict the global water cycle in action! For the latest TRMM global precipitation views, go to the DataStreme Ocean website, Atmosphere/Ocean Interaction, and click on "TRMM Tropical Rainfall."
Investigation B: OCEAN BOTTOM TOPOGRAPHY
(NOTE: Completion of this activity requires Internet access.)
Driving Question: How does ocean depth vary with distance from the shore? Educational Outcomes: Ocean depth varies markedly from one location to another. Over large areas water depth is less than 200 m (650 ft); in other areas the water depth is as great as 11,000 m (36,000 ft). The average ocean depth is 3796 m (12,454 ft). This investigation examines the ocean bottom in vertical cross-sectional profile, including the continental margin and ocean basin. In places the ocean bottom is almost flat and featureless whereas in other places the ocean bottom consists of lofty ridges and volcanoes. Three distinct ocean-bottom zones are evident. The zone closest to the shore features a very gentle slope extending seaward to a depth of about 200 m (655 ft). From there to a depth of about 3000 m (9800 ft), the water depth increases much more rapidly with distance. Then a relatively narrow zone is transitional from the steep slope of the previous zone to the more-or-less flat ocean basin. The initial, gently sloping zone is the continental shelf; the second, steeply sloping zone is the continental slope; and the third transition region is the continental rise. The continental shelf, slope, and rise together comprise the continental margin as shown to the right in Figure B1. This term is appropriate because the bedrock of the continental margin is the same as the continental plates. From a geological perspective, the continents do not end at the shore, but at the continental rise. At its outer edge, the continental margin merges with the deep-sea floor or gives way to an oceanic trench. An oceanic trench marks the convergent tectonic plate boundary where subduction of the oceanic plate is occurring. Where there are trenches, the continental margin is abbreviated. After completing this investigation, you should be able to: Describe the ocean-bottom features in the transition zone from the continents to the mid-
ocean basins. Construct a profile of the ocean bottom in the land-sea transition zone. Distinguish between the profiles of tectonically active and passive continental margins.
B - 1

Figure B1. Cross-sectional profile of the ocean bottom. (Note: The vertical scale is greatly
exaggerated.) Ocean Bottom Profile 1. In the Figure B1 schematic view of the ocean bottom above, the vertical scale is given in
kilometers. This vertical scale is vastly different from the horizontal scale. The vertical distance between scale markings is [(1)(10)(100)] kilometers. The ocean trench in the schematic view reaches a maximum depth of [(8)(80)(800)] kilometers below sea level.
2. The scale markings on the vertical and horizontal scales are equal distances apart as
measured with a ruler although they represent different distances. Comparison of the two scales indicates that the vertical scale is exaggerated [(10)(100)(1000)] times relative to the horizontal scale.
The right and left portions of Figure B1 describe general characteristics of the ocean bottom in coastal areas that are tectonically passive or active, respectively. Tectonically active areas, typically associated with plate boundaries, experience relatively frequent earthquakes and/or volcanic activity. Figure B2 below shows the major tectonic plates with heavy lines marking their boundaries. Dots indicate the location of volcanoes, with the preponderance along the Pacific Ocean being termed the "Ring of Fire."
B - 2

Figure B2. Major tectonic plates that compose Earth’s crust and the location of active
volcanic belts. 3. Plate boundaries are more closely associated with the [(east)(west)] coasts of the
Americas. The east coasts of North and South America, with their generally broad continental margins as schematically shown to the right in Figure B1, are tectonically [(passive)(active)]. The west coasts of the Americas, with relatively narrow continental margins as shown to the left in the same figure, are tectonically [(passive)(active)].
4. On Figure B2 above draw a short horizontal line across the west coast of South America
at approximately the level of the top of the "P" in "South American Plate." This point is at 23.5 degrees S latitude. The eastern end of this line is located over [(land)(water)] near the [(east)(west)] coast of South America. Note that the line you drew crosses a tectonic plate boundary.
Topographical relief data in meters with bathymetric (water depth) values indicated by negative numbers are provided in the table below at quarter degree intervals along the 23.5 degrees S latitude line segment from 70.0 degrees W to 73.0 degrees W, across the coastal region you noted above:
°W. Long.
Elev. (m)
°W. Long.
Elev. (m)
°W. Long.
Elev.(m)
°W. Long.
Elev.(m)
70.00 1372 71.00 -4865 72.00 -4258 73.00 -3432 .25 1219 .25 -7075 .25 -3996 .50 -313 .50 -6029 .50 -3577 .75 -2549 .75 -4986 .75 -3492
B - 3

5. Plot these data on the graph provided below. Note that longitude values increase from right to left. The 0 line represents sea level. Altitudes and depths are plotted in thousands of meters. Draw a line connecting adjacent data points to produce a profile of the land/ocean vertical cross section:
6. Noting that longitude values increase from right (east) to left (west), the coast is located at approximately [(70.0)(70.4)(72.4)] degrees W. The greatest depth in the vertical profile is located at approximately [(71.25)(72.0)(72.5)] degrees W. The difference in longitude between the coast and the deepest water locations is ______ degrees.
7. At this latitude (23.5 degrees S), the east-west distance between lines of longitude one
degree apart is 102 km (63.4 statute miles). Consequently, the distance from shore to the greatest depth in the trench is about [(10)(100)(1000)] km.
8. According to the graph, the depth of the deep-sea bottom in the open ocean west of the
trench is about [(3500)(5500)(7000)] meters below sea level. The deepest part of the trench is about [(1500)(2500)(3500)] meters below the bottom of the open ocean west of the trench.
9. Compare this vertical cross-section to Figure B1. The profile you drew more closely
resembles the [(right)(left)] portion of the Figure 1 schematic cross-sectional profile. This profile is characteristic of a tectonically [(passive)(active)] coastal region.
B - 4
B - 5
10. Go to the DataStreme Ocean website and click on “Bathymetry” in the Geological Section. Click on the square containing the portion of South America where the profile you constructed is located. Click on the image to enlarge it. The view is awesome!
The darkest blue shading indicates the greatest ocean depths. This shading represents the presence of a [(trench)(shallow slope)] just off the west coast of South America. The light bluish-green shading just off the east coast of South America indicates the presence of a [(trench)(shallow slope)] on the sea floor. These conclusions [(are)(are not)] consistent with your answers to question 3.
As proof of the tectonically active nature of this plate boundary, on 27 February 2010 at 0634 UTC, an incredibly powerful 8.8 magnitude earthquake occurred at 35.9 S, 72.7 W off the coast of Chile south of the location you have identified in the profile. Extensive devastation occurred to the villages onshore. Also a minor tsunami was generated that caused localized shore damage and was detected as far away as Hawaii and southern California.
Investigation C: OCEAN - ATMOSPHERE CONNECTIONS
(NOTE: Completion of this activity requires Internet access.)
Driving Question: How does the atmosphere influence the ocean and how does the
ocean influence the atmosphere? Educational Outcomes: The interface between the atmosphere and the ocean is dynamic. Solar radiation largely passes through the atmosphere and most of what strikes the sea surface is absorbed (converted to heat) in the upper portion of the ocean (the photic zone). The average albedo (reflectivity) of the ocean surface is only about 8%, meaning that 92% of incident radiation is absorbed by the ocean. Some of the resulting heat at the ocean surface is used to evaporate water. Heat used for this purpose is the latent heat of vaporization. Whereas some water is lost from the ocean to the atmosphere via evaporation, much of it returns to the ocean via precipitation. On an average annual basis, however, more water evaporates from the world ocean than returns to the ocean via direct precipitation. The magnitude and direction of the flux of water between the ocean and atmosphere varies from place to place and over the course of a year. The exchange of water (as water vapor or precipitation) between the atmosphere and ocean involves an exchange of energy. Heat that is used to evaporate water is carried with the vapor and later released to the atmosphere when water vapor condenses (or deposits as ice) into clouds. This heat transfer mechanism is known as latent heating. In addition, where the sea surface temperature (SST) is higher than the air temperature, heat is conducted from the sea surface to the air immediately above and convected into the troposphere. This heat transfer mechanism (combining conduction and convection) is known as sensible heating. On a global annual basis, for the world ocean, latent heating is considerably more important than sensible heating in transferring heat energy to the atmosphere. After completing this investigation, you should be able to: Identify factors that influence the rates of evaporation and precipitation over the ocean. Describe the general pattern of net evaporation (evaporation minus precipitation) over the
world ocean. Relate the pattern of net evaporation (evaporation minus precipitation) to planetary-scale
atmospheric circulation. The amount of precipitation over the ocean is derived remotely by satellite. Sensors monitor microwaves emitted by the Earth-atmosphere system and the extent and thickness of cloud cover. Estimates of evaporation from the ocean are more difficult to make but are based on satellite-derived values of sea surface temperature and radiation emission along with the few scattered weather observations at sea. Figure C1 below is the global distribution of the difference between evaporation (E) and precipitation (P) in cm per year over the ocean in the band between 50 degrees N and 50 degrees S for the period 1988-1993.
C - 1

Figure C1. Six-year average of EP (cm/yr), adapted from Gautier, et al., 1996. Lighter shadings in Figure 1 signify positive values of EP, that is, evaporation greater than precipitation. Darker shadings indicate where EP is negative, that is, precipitation is greater than evaporation. Contour lines are drawn at intervals of 75 cm per year. A bold, heavy line denotes 0 difference, that is, where evaporation equals precipitation. The shading scale is shown to the right. Latitude is along the left and longitude is plotted at the bottom. 1. The region of the ocean where the value of evaporation exceeds precipitation by more
than 300 cm per year (lightest shading) is located in the eastern South [(Indian)(Pacific) (Atlantic)] Ocean. In this region, more than 3 m of water is lost through evaporation than is gained via precipitation. At the other extreme, the greatest excess of precipitation over evaporation (negative values or darkest shading) occurs along the equator in the [(Atlantic)(western Pacific and eastern Indian Oceans)(eastern Pacific)] where E-P values exceed 300 cm per year.
2. The greatest positive values of E-P (more evaporation than precipitation) occur in that part of the ocean where the climate is dominated by fair-weather [(subtropical anticyclones)(subpolar lows)(westerlies)]. These massive semi-permanent weather systems are regions where rates of evaporation are relatively [(high)(low)] and rates of precipitation are relatively [(high)(low)].
3. The greatest negative values of EP (more precipitation than evaporation) occur along
and just north of the equator. This excess of precipitation over evaporation [(does)(does not)] generally coincide with the location of the InterTropical Convergence Zone (ITCZ) where the trade winds of the two hemispheres converge and trigger development of a discontinuous east-west band of showers and thunderstorms.
4. Areas of excess evaporation (over precipitation) are not symmetric north and south of the
equator. Positive EP patterns generally cover [(larger)(smaller)] areas in the Southern Hemisphere and their magnitudes are [(greater)(less)] than in the corresponding ocean basins of the Northern Hemisphere. (The evaporation dominance in the Southern Indian Ocean has no counterpart north of the equator.) This lack of symmetry is based in large
C - 2

part on the greater proportion of water to land that exists in the [(Northern)(Southern)] Hemisphere.
5. A secondary region of precipitation dominance (over evaporation) occurs in the ocean to
the northeast of the Asian and North American continents from about 40 to 50 degrees N. Heavy precipitation is due to midlatitude storm (cyclone) tracks that exit the continent over the ocean bringing frequent episodes of rain and snow. In addition, surface water temperatures are relatively low thereby [(reducing)(increasing)] the evaporation rate. Storminess coupled with the cooler waters of higher latitudes [(would)(would not)] favor a negative EP balance (more precipitation than evaporation).
Evaporation and precipitation have considerable impact on the ocean surface layer, particularly in terms of its salinity. To investigate the effect on salinity, examine Figure C2 for patterns of sea surface salinity on the global scale. Mark each major center of highest salinity with an “H” and survey the map to identify regions of relatively low salinity. 6. Compare Figure C2 depicting mean annual salinity with Figure C1 displaying average
annual E-P values. This comparison shows that, in general, regions of the ocean with higher surface salinities are associated with areas that also experience [(more)(less)] evaporation than precipitation. Those regions of the ocean with lower surface salinities are associated with areas that experience [(more)(less)] evaporation than precipitation.
7. Figure C2 shows that the highest open ocean salinities occur in the [(Atlantic)(Pacific) (Indian)] Ocean. Figure C1 confirms that this is a region where evaporation is [(less than)(more than)] precipitation.
The region of the ocean identified in Item 7 is a major source of atmospheric water vapor that is transported by the [(trade winds)(westerlies)] across the isthmus of Central America. This water vapor contributes freshwater precipitation to the southeastern North Pacific. The east-to-west transport of water substance is accompanied by a(n) [(west-to-east)(east-to-west)] transport of latent heat.
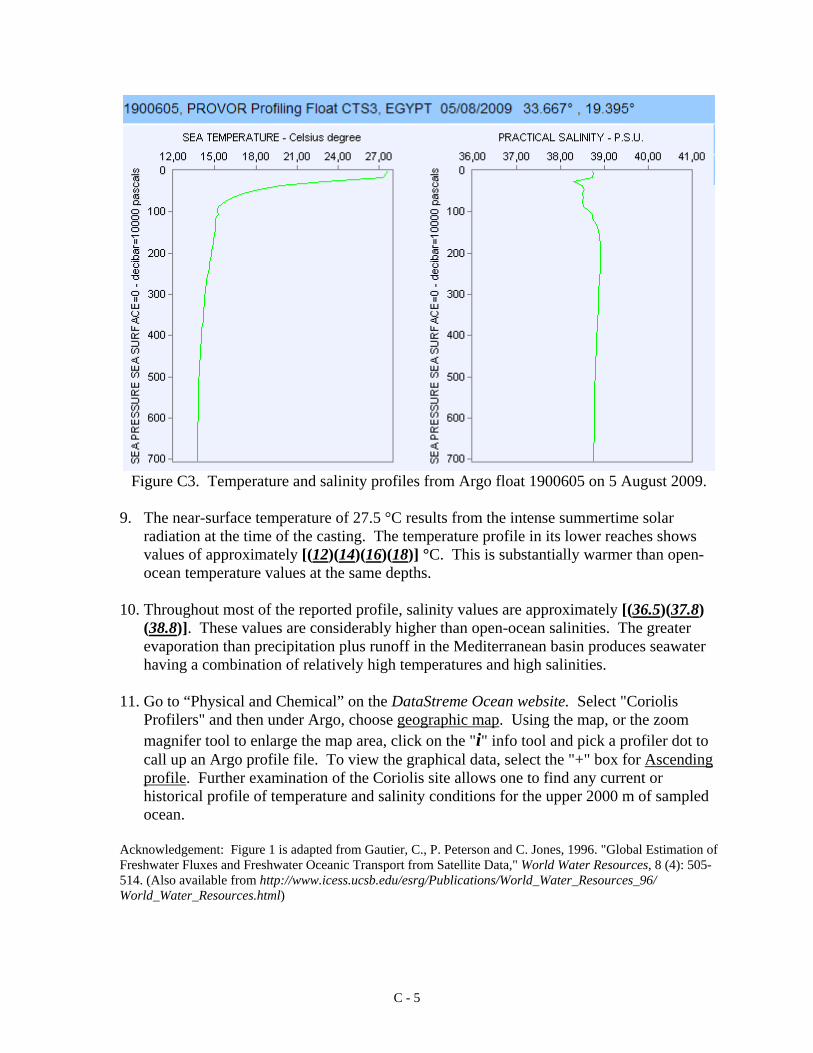
The relationship between evaporation and precipitation can have profound effects on ocean structure and circulation. The Mediterranean Sea, a semi-enclosed basin, is subjected to greater evaporation than precipitation (plus river discharge) throughout the year. But it is not drying up! Its level is maintained by the influx of surface currents of Atlantic Ocean water through the Strait of Gibraltar. Figure C3 provides temperature and salinity profiles acquired by an Egyptian PROVOR Argo profiling float (WMO No. 1900605). The float was located approximately in the center of the Mediterranean Sea basin at 33.7 degrees N and 19.4 degrees E on 5 August 2009 during its 121st cycle ascent from a depth of 707 m.
C - 3

Figure C2. Annual mean salinity at the ocean surface (from World Ocean Atlas 2001, (http://www.nodc.noaa.gov/OC5/WOA01F.ssearch.html)
C - 4
C - 5
Figure C3. Temperature and salinity profiles from Argo float 1900605 on 5 August 2009.
9. The near-surface temperature of 27.5 °C results from the intense summertime solar
radiation at the time of the casting. The temperature profile in its lower reaches shows values of approximately [(12)(14)(16)(18)] °C. This is substantially warmer than open-ocean temperature values at the same depths.
10. Throughout most of the reported profile, salinity values are approximately [(36.5)(37.8)
(38.8)]. These values are considerably higher than open-ocean salinities. The greater evaporation than precipitation plus runoff in the Mediterranean basin produces seawater having a combination of relatively high temperatures and high salinities.
11. Go to “Physical and Chemical” on the DataStreme Ocean website. Select "Coriolis
Profilers" and then under Argo, choose geographic map. Using the map, or the zoom magnifer tool to enlarge the map area, click on the "i" info tool and pick a profiler dot to call up an Argo profile file. To view the graphical data, select the "+" box for Ascending profile. Further examination of the Coriolis site allows one to find any current or historical profile of temperature and salinity conditions for the upper 2000 m of sampled ocean.
Acknowledgement: Figure 1 is adapted from Gautier, C., P. Peterson and C. Jones, 1996. "Global Estimation of Freshwater Fluxes and Freshwater Oceanic Transport from Satellite Data," World Water Resources, 8 (4): 505-514. (Also available from http://www.icess.ucsb.edu/esrg/Publications/World_Water_Resources_96/ World_Water_Resources.html)

Investigation D: SEAWATER TEMPERATURE AND SURFACE OCEAN
CURRENTS
(NOTE: Completion of this activity requires Internet access.) Driving Question: How do seawater density differences arising from temperature
variations contribute to the production of ocean surface currents? Educational Outcomes: The ocean is a major player in Earth’s climate system. The ocean and atmosphere are closely coupled. Huge wind-driven gyres (roughly circular current systems) occur in all ocean basins. Along their boundaries, differences in the density of warm and cold seawater help produce sloping ocean surfaces, which in turn generate narrow surface ocean currents such as the Gulf Stream. Similar to rivers on land, strong ocean currents develop bends (meanders) along their course. Some meanders pinch off and form large circular circulations, called eddies or rings. After completing this investigation, you should be able to: Explain why the sea surface slopes where warm and cold seawater occur side-by-side. Describe the development of ocean surface currents in response to water temperature
(and density) differences. Describe how the Coriolis effect influences the direction of motion of surface ocean
currents and eddies. Materials: Scissors, blue and red colored pencils. A. Investigating the Gulf Stream Water, like most substances, can vary in density with temperature. Density is the mass of material in a volume. As materials warm and expand, less mass of material will fill a given volume. Warmer materials are less dense, colder materials more dense. Put another way, equal masses of warmer, less dense materials fill more volume than colder, more dense materials. Therefore, a column of warm, less dense material would be taller than an equal cross-sectional area column of colder, more dense material. 1. In the ocean, water of different temperatures existing side-by-side exhibits these same
characteristics. At some depth in the ocean, pressure exerted by the overlying water is the same horizontally. Above that level, less dense warm water produces a sea surface that is at a [(higher)(lower)] elevation than the sea surface above neighboring cold, more dense water. The sea surface slopes downward from [(warm to cold)(cold to warm)] water.
This water temperature relationship can be employed in modeling ocean currents and finding relationships among water temperature, height of the sea surface, and ocean currents. We
D - 1

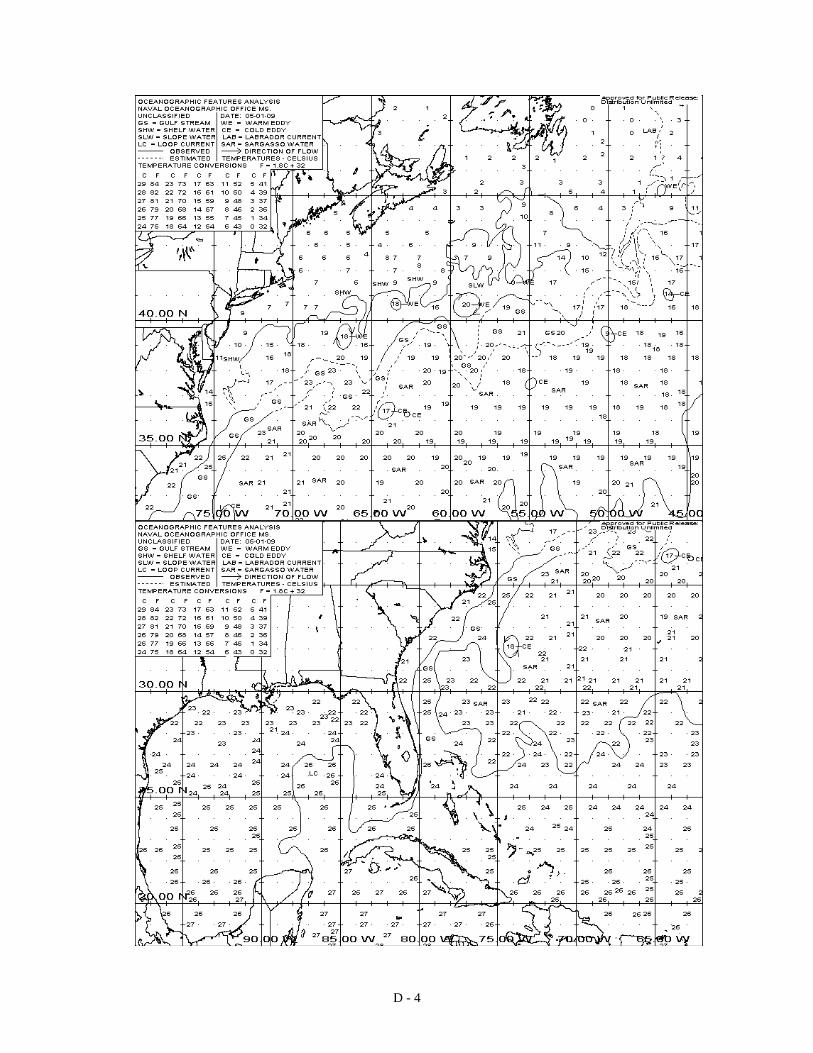
will do so by taking a closer look at the warm Gulf Stream that forms the western arm of the North Atlantic gyre. Our primary source of sea-surface temperatures (SST) of the Gulf Stream and surrounding ocean is measurements made by infrared sensors flown aboard Earth-orbiting satellites. The maps appearing in the accompanying Figures D1 and D2 are supplied by the US Naval Oceanographic Office. The images are overlapping maps on which are plotted SST in °C obtained on 1 May 2009. Combined, the maps cover the Gulf of Mexico and the Atlantic Ocean along the East Coast of North America. To produce a single continuous map, cut your paper copy of the northern Gulf Stream analysis along the 35-degree latitude line, place it over the southern Gulf Stream analysis where the two maps match, and then secure with tape along the left margin of the northern map portion and on the back side. 2. Relatively high sea-surface temperatures delineate the Gulf Stream on this analysis (by
the Naval Oceanographic Office). Two roughly parallel solid and dashed black lines enclose the Gulf Stream, labeled “GS.” The Gulf Stream system parallels the coast from Florida to southern Virginia and then turns eastward and then loops generally northeastward across the North Atlantic. Starting in the Atlantic just offshore from Florida use a red pencil to shade the location of the Gulf Stream.
Optional: Color-code the ocean surface to indicate relative temperature. Use dark blue for the shelf water “SHW” along the Northeast coast, light blue for the slope water “SLW” where it appears between the Gulf Stream and shelf water, dark red for the Gulf Stream “GS,” and light red for the Sargasso water south and east of the Gulf Stream.
3. East of Florida, the highest sea-surface temperature in the Gulf Stream is ______ °C.
According to the Temperature Conversions chart, this corresponds to a temperature of 77 °F.
4. The direction of flow of the Gulf Stream is generally from southwest to northeast.
Looking in the direction of the flow, the coldest surface water is located to the [(right)(left)] of the Gulf Stream.
5. Ocean water rings, or eddies, form when loops in the meandering Gulf Stream break off
to form isolated and persistent rotating bodies of water. Their presence is evidenced by differences between their surface temperatures and the temperature of the water surrounding them. On this analysis (Figures D1 and D2), warm eddies (“WE”) include those plotted east of New Jersey at about 39 degrees N, 67 degrees W and at about 41 degrees N, 59 degrees W. Cold eddies (“CE”) are located east of the Georgia-South Carolina coast at about 32 degrees N, 74 degrees W and east of North Carolina at about 36.5 degrees N, 64 degrees W. In general, warm eddies “WE” are located on the [(cold)(warm)] water side of the Gulf Stream and cold eddies “CE” are on the [(cold)(warm)] water side of the Gulf Stream.
6.6. The sea-surface temperature at the center of the warm eddy east of Long Island, NY at
about 41 degrees N, 59 degrees W is ___ °C. This is several Celsius degrees higher than
D - 2
colder)(warmer)] than surrounding water.
7. The temperatures of waters along the Gulf Stream are [(warmer)(colder)] than
temperatures of waters immediately along the coast. Thus, the surface of the Gulf Stream waters would be [(higher)(lower)] than the sea surface of the waters along the coast. Water flowing downhill from higher toward lower elevations would turn to the right due to the Coriolis deflection in the Northern Hemisphere. This downhill, rightward flow of waters in the Gulf Stream would be directed generally from [(northwest to southeast)(southwest to northeast)], consistent with the direction noted earlier.
The latest Gulf Stream maps similar to those used in this investigation can be found on the Gulf Stream page of the NLMOC web site. Go to the DataStreme Ocean website and under Physical & Chemical Information, click on “Additional Physical & Chemical Links.” Select “US Naval Oceanographic Office products.” Click your way through the Navy encryption acceptance process and then choose the section of the world ocean of interest from the small map in the upper left corner (North Atlantic). Next, select the section of the ocean basin for display (NA6) from the map or NA6-Regional from the middle list, and "Oceanographic Features Analysis" from the right-hand list. Finally, pick the "B-W Composite Series" of satellite products for the latest Gulf Stream SST analysis in upper and lower panel display. Color displays of these values can also be obtained. The DataStreme Ocean website also delivers the latest color, contoured 3-day summary of Gulf Stream temperatures under Physical & Chemical, "Gulf Stream Temperatures".
D - 3
D - 4