Embed Size (px)
Citation preview
Dating late Quaternary planktonic foraminifer Neogloboquadrina pachyderma from the
Arctic Ocean by using amino acid racemization
Darrell S. Kaufman,1 Leonid Polyak,2 Ruth Adler,2 James E.T. Channell,3 and Chuang Xuan3
1Department of Geology, Northern Arizona University, Flagstaff AZ 86011, USA.
2Byrd Polar Research Center, Ohio State University, 1090 Carmack Road, Columbus, OH
43210, USA.
3Department of Geological Sciences, University of Florida, 241 Williamson Hall, P.O. Box
112120, Gainesville, FL 32611, USA.
Abstract. The long-term rate of racemization for amino acids preserved in planktonic
foraminifera was determined by using independently dated sediment cores from the Arctic
Ocean. The racemization rates for aspartic acid (Asp) and glutamic acid (Glu) in the common
taxon, Neogloboquadrina pachyderma, were calibrated for the last 150 ka using 14C ages and the
emerging Quaternary chronostratigraphy of Arctic Ocean sediments. An analysis of errors
indicates realistic age uncertainties of about ± 12% for Asp and ± 17% for Glu. Fifty individual
tests are sufficient to analyze multiple subsamples, identify outliers, and derive robust sample
mean values. The new age equation can be applied to verify and refine age models for sediment
cores elsewhere in the Arctic Ocean, a critical region for understanding the dynamics of global
climate change.
Keywords: amino acid racemization, Quaternary geochronology, Arctic Ocean, planktonic
foraminifera.

1. Introduction
Climate change in the Arctic commands increasing attention as unprecedented shrinkage of sea
ice has surpassed the range of historical observations and is likely heading toward a seasonally
ice-free Arctic Ocean [e.g., Comiso et al., 2008]. Foreseeing the consequences of this
fundamental shift in the state of the Arctic system requires an understanding of past changes in
Arctic climatic and oceanic conditions. Meanwhile, acquisition and interpretation of
paleoceanographic data in the Arctic face many difficulties. In addition to logistical challenges,
studies of Arctic Ocean sedimentary records are hampered by generally low sedimentation rates,
limited biogenic proxies due to low productivity and high dissolution, and non-analogous
conditions compared with other, better investigated oceanic regions. As a result, despite recent
progress in some areas [Jakobsson et al., 2000; Spielhagen et al., 2004; O’Regan et al., 2008],
no regional stratigraphic standard for central Arctic Ocean sediments has been developed, and
many aspects of their age interpretation are questionable [e.g., Backman et al., 2004; Sellen et
al., 2008]. A reliable age model is necessary to place the paleoenvironmental history of the
Arctic into a global context, and this requires the advent of new chronostratigraphic approaches.
Considerable advances in the development of age models for Quaternary sediment from
the Arctic Ocean have been made since the new stratigraphic paradigm was introduced for cores
from the Lomonosov Ridge [Jakobsson et al., 2000], and has been expanded across the central
Arctic Ocean [Backman et al., 2004; Spielhagen et al., 2004]. The new approach recognized the
complexities of paleomagnetic records, which had been the staple of Arctic Ocean stratigraphy,
and used a more realistic assessment of sedimentation rates and placement of paleoclimatic
events than in earlier studies [e.g., Clark et al., 1980; Phillips and Grantz, 1997]. Recently this
new age model has been shown to be consistent with longer-term Cenozoic stratigraphy
2
developed for the first deep-drilling record from the central Arctic [O’Regan et al., 2008].
Nevertheless, many aspects of age assignment within this general stratigraphic framework
remain unclear and cannot be resolved by methods that have been applied to date [O’Regan et
al., 2008; Cronin et al., 2008]. Even more problems arise with stratigraphies from other areas of
the central Arctic Ocean [e.g., Sellen et al., 2008]. In this paper we advance the use of amino
acid racemization in planktonic foraminifers as applied to upper Quaternary sediments from the
Arctic Ocean.
The extent of amino acid racemization (AAR) in fossil foraminifera has been used
previously to estimate the ages of Quaternary marine sediment (Kaufman [2006] reviews
previous AAR studies on foraminifera). Deep-marine settings are ideal for amino acid
geochronology because of the long-term thermal and geochemical stability of the depositional
environment. Foraminifera inhabit most of the world’s ocean and they contain high
concentrations of amino acids that are well retained by their carbonate test. Sample-size
requirements for AAR analysis of foraminifera using reverse-phase chromatography (RPC) are
in the sub-milligram range. Preparing samples composed of a small number of tests is less time-
consuming than picking larger samples such as for 14C dating or for AAR analysis by the
chromatographic techniques used previously, and it can improve the accuracy of the results
because the best-preserved individuals can be selected, and because collections of microfossils
commonly include a few individuals whose extent of racemization values fall well outside the
mean of the others. These outliers might result from post-depositional reworking, post-collection
contamination, or an aberrant diagenetic pathway. Regardless of the cause, by routinely
analyzing multiple subsamples from a single stratigraphic level, these tests can be identified
objectively and excluded from the data set.
3
Two general approaches are used to convert the extent of AAR to a numeric time scale:
In the first approach, the effects of time and temperature on the extent of racemization are
determined in modern shells subjected to high-temperature laboratory experiments [e.g.,
Kaufman, 2006]. This relation, together with a model of racemization kinetics, is used to
calculate the age of a sample if its temperature history is known. A more secure approach that
does not require assumptions about temperature history is to calibrate the rate of racemization by
analyzing securely dated samples of a particular taxon from a region where temperature histories
are uniform [e.g., Hearty et al., 2004]. The calibrated reaction rate is then used to date samples
of the same taxon of unknown age from the same region.
The two previous attempts to use AAR in the Arctic Ocean [Sejrup et al., 1984; Macko
and Aksu, 1986] used the calibration approach. Both studies relied on only two independently
dated samples from the North Atlantic to calibrate the rate of isoleucine epimerization in the
foraminifera, Neogloboquadrina pachyderma. Because the temperature of bottom water in the
North Atlantic is about 4°C higher than in the Arctic Ocean, assumptions were needed to adjust
the reaction rate for the Arctic Ocean. Both studies also relied on only a single sample from each
stratigraphic level; we find that replication is important for recognizing outliers. Furthermore,
both studies were based on isoleucine, which reacts more slowly and therefore has lower
temporal resolution than the amino acids that we use in this study. Because of these
shortcomings, results of the previous AAR studies in the Arctic Ocean were difficult to interpret
conclusively, and during the last 20 years, the approach was not developed further for use in the
Arctic Ocean.
In this study, we take advantage of recent developments in the chronostratigraphic
framework of Arctic Ocean sediments to calibrate the rate of racemization using control samples
4
from within the Arctic Ocean itself. We focus on aspartic acid, which affords enhanced age
resolution where ambient temperature is low [Goodfriend et al., 1996]. We use these data to
develop an AAR age equation for late Quaternary Neogloboquadrina pachyderma from the
Arctic Ocean, which is applicable to samples as old as 150 ka.
2. Material and Methods
Samples for this study are from three long (piston) sediment cores from three major submarine
ridges extending into the central Arctic Ocean: Lomonosov, Mendeleev, and Northwind ridges,
plus two multicore samples from the Mendeleev Ridge (Table 1; Figs. 1, 2). Cores HLY0503-
8JPC, -10MC and -11MC were collected on the 2005 Healy-Oden TransArctic Expedition
(HOTRAX) [Darby et al., 2005]; the data in this paper from these HOTRAX cores have not been
presented previously. Litholostratigraphic, paleomagnetic, and microfaunal data from core
88AR-P5 have been published by Poore et al. [1993, 1994]; core 96/12-1PC was studied by
Jakobsson et al. [2000, 2001] and used for correlation by O’Regan et al. [2008] as part of the
development of the new stratigraphic model for the central Arctic Ocean.
U-channel samples from core HLY0503-8JPC were taken for paleomagnetic analysis.
Natural remanent magnetization (NRM) was measured at 1 cm spacing after demagnetization at
14 steps in the 10-100 mT peak field range. Component magnetizations were determined using
the standard 3-D least squares method (Kirschvink, 1980). The demagnetization range used for
calculation of the component directions was non-uniform downcore, and depended on
demagnetization behavior of each measurement position, but was usually in the 30-80 mT
interval. Maximum angular deviation (MAD) values, associated with the characteristic
magnetization components are generally less than 10° for the upper ~420 cm of the core,
5
indicating that the components are well defined, and then vary widely in the 5°-30° range below
that level, indicating that the definition of the characteristic component is highly variable. The
onset of negative inclinations at ~420 cm bsf (cm below seafloor) is, however, well defined (Fig.
2), although the control on its position (lithological vs. geomagnetic) has yet to be determined.
Samples for foraminifera and other analyses from core HLY0503-8JPC were taken
continuously at 1 cm intervals to 500 cm bsf, freeze dried, washed, and separated by several size
fractions. Foraminifers were counted in the >150 μm fraction and picked for AAR analysis from
relative abundance peaks throughout the washed portion of the core and, concurrently, for 14C
determinations from its upper part. Samples for 14C analyses contained 5 to 8 mg of planktonic
foraminifers; no pretreatment was applied.
The rate of amino acid racemization is taxon-dependent and in this study we focus on
mono-specific samples of left-coiled Neogloboquadrina pachyderma, the predominant Arctic
planktonic foraminifer. Approximately 50 tests of adult (encrusted) N. pachyderma were picked
from intervals with peak foraminifer abundance. They were cleaned by sonicating repeatedly at 1
minute increments until the bath water was clear, then rinsed three times in deionized water. The
tests were immersed in 1 mL of 3% H2O2 for 2 hr, rinsed with purified H2O, then air dried under
laminar flow. The best-preserved, most-thoroughly cleaned, whole tests were then picked and
divided into subsamples composed of 3 to 10 individuals (average = 8), which were placed in
sterilized, conical bottomed micro-reaction vials and dissolved in 7 µL of 6 M HCl, and sealed
under N2. To recover the total hydrolysable amino acid population while minimizing the induced
racemization, the solutions were hydrolysed at 110°C for 6 hr. Subsamples were evaporated to
dryness, rehydrated in 4 µL of 0.01 M HCl with 10 µM L-hArg, an internal spike used to
quantify the abundance of amino acids, and injected onto a high-performance liquid
6
chromoatograph (HPLC).
The chromatographic instrumentation and procedure used to separate amino acid
enantiomers is presented by Kaufman and Manley [1998], with modifications for individual
microfossils described by Kaufman [2000, 2003]. Briefly, the analytical method employed pre-
column derivatization with o-phthaldialdehyde (OPA) together with the chiral thiol, N-
isobutyryl-L-cysteine (IBLC), to yield fluorescent diastereomeric derivatives of chiral primary
amino acids. The derivatization was performed on-line prior to each injection using the auto-
injector of an integrated Agilent 1100 or 1200 HPLC. Separation was by a reverse-phase column
packed with a C18 stationary phase (Hypersil BDS, 5 µm) using a linear gradient of aqueous
sodium acetate, methanol and acetonitrile. Detection was by fluorescence.
The extent of AAR was measured by the ratio of D- to L-enantiomers. The average
analytical uncertainty (internal reproducibility) measured by the coefficient of variation for
multiple injections of laboratory standards is typically between 2 and 5% for the D/L values of
most of the amino acids. Both intra- and inter-laboratory comparative (ILC) samples [Wehmiller,
1984] were analyzed routinely to monitor machine performance. For this study, we focused on
aspartic acid (Asp) and glutamic acid (Glu), two amino acids that are among the most abundant
in foraminifera protein, and are the best resolved chromatographically. More accurately, the Asp
and Glu may include a small component of asparagine and glutamine, respectively, which were
converted to Asp and Glu during laboratory hydrolysis. Asp and Glu elute during the first 30 min
of the sample run, and span most of the range of racemization rates. Serine (Ser) also elutes
during this interval and is useful index of contamination, rather than for geochronology. The
procedural blank is dominated by Ser, and the blank accounts for an average of 3% and 6% of L-
Asp and L-Glu, respectively. The influence of the blank is insignificant at low D/L values, but
7
increases in older samples as the concentration of indigenous amino acids decrease. No attempt
was made to adjust D/L values for the blank.
3. Existing Stratigraphic Context of AAR Samples
3.1. Sediment Core Correlations
The stratigraphy of the cores in this study was tied to the age model developed for the central
Lomonosov Ridge [Jakobsson et al., 2000, 2001; O’Regan et al., 2008]. For correlation we use
lithological characteristics, foraminiferal abundances, NRM inclination, and benthic
foraminiferal events (Fig. 2). Together with new 14C data, this stratigraphy enables the ages of
each AAR sample to be estimated independently.
Quaternary sediments in the central Arctic Ocean are generally composed of gray to
yellow-brown, nearly abiotic mud alternating with brown, faunal-rich beds interpreted to
represent a succession of glaciations and interglacial/ interstadial periods, respectively [Darby et
al., 2006 and references therein; O’Regan et al., 2008; Cronin et al., 2008]. This cyclic
sedimentation pattern provides the basic framework for stratigraphic correlations across the
Arctic Ocean; however, it cannot be used as the sole basis for correlation because of varying
sedimentation rates and possible spatial differences in sedimentary environments and
preservation of paleontological material. Some additional lithologic features provide more
detailed correlation, notably layers of detrital carbonate that were delivered by icebergs from the
Canadian Arctic Archipelago during major collapses or surges of the Laurentide ice sheet and
dispersed by the Beaufort Gyre [Bischof and Darby, 1997; Phillips and Grantz, 2001]; however,
these features do not occur in the Eurasia Basin and most of the Lomonosov Ridge including
core 96/12-1PC.
8
Paleomagnetic properties, particularly inclination records have been commonly used for
stratigraphic correlations of Arctic Ocean sediment [e.g., Steuerwald et al., 1968; Clark et al.,
1980; Backman et al., 2004; Spielhagen et al., 2004]. The paleomagnetic inclination of sediment
from the central Arctic probably records not only variations in paleomagnetic field, but also
changes in rock-magnetic composition, and therefore cannot be used as a simple
chronostratigraphic tool [Jakobsson et al., 2000; O’Regan et al., 2008]. Nevertheless, inclination
records exhibit an apparently consistent pattern in various regions of the Arctic Ocean and
therefore provide an independent means of correlation, regardless of their genesis [e.g.,
Spielhagen et al., 2004; Sellen et al., 2008]. In particular, the prominent change from
predominantly high inclination values to strongly variable including negative values (solid tie
line in Fig. 2), previously interpreted as the Bruhnes-Matuyama polarity boundary, is now used
as a chronostratigraphic marker in the middle of marine isotope stage (MIS) 7, based on the
current age model [Jakobsson et al., 2000; O’Regan et al., 2008].
The abundance of planktonic foraminifers shows a spiky distribution with maxima in
brown units in the upper part of all three cores (Fig. 2). The absolute abundance of tests differs
between the cores, probably due to different degrees of carbonate dissolution, but relative
downcore changes have a consistent pattern. Below the stratigraphic level assigned to MIS 7,
sediments throughout the Arctic Ocean are mostly barren of calcareous fossils; instead,
arenaceous foraminifers become common and their abundance varies with glacial-interglacial
cycles [Jakobsson et al., 2001; Backman et al., 2004; Cronin et al., 2008]. This level probably
marks the general weakening of carbonate dissolution in the deep Arctic Ocean and can be used
as an aditional stratigraphic marker.
The chronostratigraphic framework is further constructed using benthic foraminiferal
9
assemblages that contain unique components – species that are otherwise absent or sparse in
other stratigraphic levels. These foraminiferal events have been described for the cores in this
study or from adjacent sites [Poore et al., 1994; Ishman et al., 1996; Jakobsson et al., 2001;
Polyak et al., 2004]. Among the most prominent events are the abundance maximum of Bulimina
aculeata, and the occurrence of Epistominella exigua (dashed tie lines in Fig. 2). Neither species
lives in the central Arctic Ocean today, evidently not adapted to perennial ice conditions.
Regardless of what caused their previous expansions into the high Arctic, such species
occurrences are valuable stratigraphic markers. These events correspond with MIS 5a and 5e,
potentially the warmest, low-ice intervals of the late Quaternary [Nørgaard-Pedersen et al.,
2007].
3.2. Age Control
Eleven samples from the upper 63 cm in HLY0503-8JPC and two additional samples from the
northern part of the Mendeleev Ridge (HLY0503-MC10 and -MC11) were dated by AMS 14C
for this study (Table 2). An additional 14C age for the top sample in core 88AR-P5 was taken
from Poore et al. [1994]. Because of uncertainties in the reservoir age in the Arctic Ocean, we
have not applied a ΔR to age calibration. Adult N. pachyderma in the central Arctic Ocean live
mostly in the lower halocline [e.g., Volkmann, 2000], which is ventilated rapidly, on the order of
10 yr in modern conditions [Ekwurzel et al., 2001]. The influence of riverine inputs from Siberia
on ΔR in this water cannot be estimated conclusively; limited data from the Laptev Sea indicate
a ΔR value between –100 and 460 yr [Bauch et al., 2001]. In the past, especially during
discharges of large volumes of glacial meltwater, reservoir ages may have been greater, so the
14C ages from these periods should be considered maximum ages. As a guideline, we assume that
10

intervals containing planktonic foraminifera with high values of δ13C, which faithfully
correspond to brown units [Poore et al., 1999; Polyak et al., 2004], were associated with high
ventilation rates. Other complications in the 14C chronology might stem from bioturbation of
overall thin interglacial/interstadial units and the input of old carbonaceous water during the
discharges of Laurentide detrital carbonates. The latter possibility has not yet been investigated,
but potentially can bias 14C ages in the Amerasia Basin, especially at sites proximal to the
Canadian Arctic. Generally, 14C ages in HLY0503-8JPC show an orderly succession, consistent
with ages obtained earlier from the Mendeleev Ridge [Darby et al., 1997; Polyak et al., 2004].
Some pre-Holocene ages, however, are older than expected by a few thousand years, possibly
reflecting the influence of old carbonaceous water, and one sample appears too young, possibly
resulting from bioturbation.
Below the range of 14C dating, sample ages are based on correlation with global MIS
record [the orbitally-tuned, staked oxygen-isotope record typically referred to as SPECMAP,
Martinson et al., 1987], as first proposed by Jakobsson et al. [2000] for core 96/12-1PC, and
further developed on correlative cores, including the IODP core from the Lomonosov Ridge
[Spielhagen et al., 2004; O’Regan et al., 2008]. The general validity of this age model for the
upper Quaternary is corroborated for example by correlation of units containing abundant coarse
ice-rafted debris and related meltwater indicators with major ice advances along the margins of
the Arctic Ocean [Spielhagen et al., 2004], and the presence of subpolar foraminifers at levels
corresponding to the warmest intervals, MIS 5a and 5e [Nørgaard-Pedersen et al., 2007]. The
resulting age assignment of samples is coarse, but it provides an internally consistent
stratigraphic framework suitable for a first-order calibration of the rate of AAR. It is reasonable
to assume that the age error for our calibration samples is typically less than one-half of the
11
duration of a marine isotope substage, that is, within ± 10%.
4. AAR Results
A total of 47 samples of N. pachyderma were analyzed for this study. Each sample comprised 2
to 9 subsamples (average = 5; total = 249) (see Supplemental Appendix, “Extent of amino acid
racemization (D/L) for aspartic acid (Asp), glutamic acid (Glu), and serine (Ser) in
Neogloboquadrina pachyderma from Arctic Ocean cores”). Some subsamples yielded D/L
values that were clear outliers compared with others from the same sample (Fig. 3). The cause of
the variation is not clear. Outliers might reflect reworking of individual tests and are useful for
understanding time averaging and age structure in the fossil record [e.g., Kosnik and Kaufman,
2008]. In this study, the goal is to derive a robust estimate of the central tendency of D/L values,
and a reasonable estimate of the uncertainty of the mean D/L of a sample. Excluding outliers is
therefore justified, provided that an objective and reproducible screening procedure is employed.
We used a three-step screening procedure to systematically identify outliers. Rejected results are
listed and the specific screening criterion applied is tracked for each subsample (Supplemental
Appendix). The criteria are: (1) The concentration of serine (Ser) was used to identify
subsamples with aberrantly high levels of this labile amino acid, presumably resulting from
contamination by modern amino acids. Subsamples with L-Ser/L-Asp > 0.8 were rejected (n =
30). (2) Next, the well-defined covariance between the D/L values of Glu and Asp was used to
identify subsamples whose extent of racemization in this pair of amino acids deviated from the
trend of other analyses in this study (n = 3). (3) Subsamples with D/L Asp or Glu that fell
beyond ± 2σ of the mean of the rest of the group, after screening by the two above criteria, were
rejected, and this procedure was not iterated (n = 8). In all, 41 out of 249 subsamples were
12

rejected, or 16% of the data.
The rejected subsamples had D/L values that were generally lower than the other
subsamples. Overall, the sample mean D/L values increased by an average of 0.030 for Asp and
0.012 for Glu, following screening for the 29 samples with one or more rejected subsamples.
This is consistent with high L-Ser content of most of the rejected subsamples, which indicates
contamination by modern amino acids. Overall, however, the abundance of Asp and Glu was not
notably higher for rejected subsamples (Fig. 4), suggesting that a small amount of contamination
can significantly impact the D/L values. Although screening had little effect on the mean D/L
values and downcore trends, it significantly decreased the intra-sample variability. Following
data screening, the intra-sample variability (CV) decreased from 21% to 5% for D/L Asp, and
from 29% to 10% for D/L Glu. Overall, following screening, standard errors (σx) of mean D/L
values average 2.4% for Asp and 5.0% for Glu, which can largely be attributed to analytical
precision.
The abundance of amino acids decreases with increasing extent of racemization (Fig. 4),
as expected because amino acids degrade or are leached from the tests with time. The amino acid
abundance values depend on the mass of the individual foraminifera tests, which varies among
samples. On average, the mass of a single Neogloboquadrina pachyderma test analyzed in this
study is between 8 and 10 µg. On this basis, the concentration of amino acids per mass of
carbonate in N. pachyderma is similar to that of the larger planktonic foraminifera Pulleniatina,
which as been analyzed extensively in sediment cores [Hearty et al., 2004] and laboratory
heating experiments [Kaufman, 2006]. The amino acid content of N. pachyderma decreases more
rapidly with increasing racemization extent than that of Pulleniatina, however, indicating a
higher rate of amino acid attrition for N. pachyderma.
13
5. Discussion
5.1. AAR Correlations Among Cores
D/L values for both Asp and Glu increase regularly with depth down to about 2 m in all three
long cores (Fig. 5). The values then level off below this depth, corresponding to an age of about
150 ka. Some decrease in the rate of racemization with increasing age is expected as this
reversible reaction approaches equilibrium. In the case of the N. pachyderma from the Arctic
Ocean, however, it appears that D/L values plateau at around 0.4 in Asp and 0.2 for Glu. This
plateau is unlikely to have been caused by a shift from overall lower temperature prior to 150 ka
to higher temperature since then, because site temperatures are currently near the freezing point.
The D/L values in the two amino acids covary strongly in subsamples below this level, and none
of the subsamples contain excessive Ser content (Fig. 3), suggesting that the extent of
racemization follows the expected diagenetic pathway. If so, then some of the samples below 2
m could be younger than we have assumed. On the other hand, when heated in the laboratory,
planktonic foraminifera of the genus Pulleniatina show a sharp decrease in the rate of
racemization at around the same D/L values, although D/L values continue to increase with
heating time (Fig. 4 in [Kaufman, 2006]). Determining whether the D/L values plateau or
whether they continue to increase with age and depth will require further analyses.
The two unique benthic foraminifera events and the shift in paleomagnetic characteristics
(Fig. 2) provide chronostratigraphic markers to compare D/L values among the three long cores
(Fig. 3). The D/L values for both Asp and Glu overlap within ± 1σ (or ± 2σx) for the three
samples from each of the marker horizons. The D/L values vary by 2 to 6% for Asp and 5 to 9%
for Glu. Most of the difference in D/L values among correlative horizons in different cores can
14
be ascribed to analytical errors and intra-sample variability, mutually supporting the integrity of
the stratigraphic correlations and the AAR results.
5.2. AAR Age Equation
The chronostratigraphic ages and the 14C ages from all five cores were aggregated to develop a
calibrated age equation that relates the extent of racemization in N. pachyderma to sample age
(Table 3). Following the procedure discussed by Kosnik et al. [2008], we modeled the rate of
racemization using a simple power transformation and chose the exponent that best linearized the
trend in D/L versus sample age based on least-squares regression forced through the origin (Fig.
6). Samples older than 150 ka could not be modeled using a power transformation and were
excluded from the age model. Least-squares linear regressions based on the remaining 38
samples yield the age equations for N. pachyderma from the Arctic Ocean for up to 150 ka. The
age equation for Asp is:
t = 920(D/L)2.3 (r2 = 0.884; P <0.001) (1)
and for Glu
t = 1462(D/L)1.6 (r2 = 0.774; P <0.001) (2)
where t = age in ka.
The accuracy of ages derived from this procedure depends on an array of variables. A
Monte Carlo simulation was used to quantify the overall age uncertainty in the AAR age model,
and to assess its sensitivity to the input variables. The results of this simulation show that the
accuracy of the AAR ages is primarily and linearly related to the uncertainty in the independent
ages that are used to calibrate the rate of racemization. For each ± 10% change in the uncertainty
in the calibration ages, the corresponding change in the accuracy of AAR ages is about ± 1.3%,
15

assuming that the uncertainty in the D/L value (intra-sample variability) is characterized by ±
1σx. Using ± 2σx to characterize the intra-sample variability reduces the sensitivity of the AAR
age accuracy to changes in the uncertainty associated with the calibration ages. At ± 2σx the
intra-sample variability is the primary uncertainty in the overall age estimate, and the resulting
accuracy of the AAR ages is about ± 12% for Asp and about ± 17% for Glu, regardless of
whether the uncertainty in the calibration ages is 10% or 30%, for instance.
Quantifying the uncertainty in the independent ages used to calibrate the rate of
racemization is difficult. Instead, we rely on conventional regression statistics to estimate the
uncertainty in the rate of racemization as derived from the combined data set (n = 38). The
standard error of the slope of the least-squares regression (rate of racemization) is ± 54 ka (D/L)-
2.3 for Asp, and ± 136 ka (D/L)-1.6 for Glu. Combining this error in the slope with the typical ±
2σx in mean D/L values determined from our samples (Asp = ± 4.8%; Glu = ± 10.0%) yields an
overall realistic age error of about ± 12% for Asp and ± 17% for Glu for samples within the age
range of the calibration equations (up to about 150 ka). This compares with standard error of the
sample, based on the residuals, of 14 ka for Asp and 19 ka for Glu.
Both the regression fit and the intra-sample variability are better for Asp than for Glu,
implying that Asp is a superior chronometer for these samples. For samples with D/L values
higher than about 0.5, however, the rate of racemization for Asp decreases beyond that for Glu,
suggesting that Glu might out-perform Asp for older samples. Regardless, tracking D/L values
for both amino acids is important because, although the rate of racemization in Asp and Glu are
affected by the same systematic errors and are therefore not strictly independent, samples that
yield similar ages for the two amino acids are viewed with greater confidence. Kosnik and
Kaufman [2008] suggest that samples that yield ages for Asp and Glu that differ by more than
16
20% should be considered suspect. Otherwise, the ages can be averaged to generate a single age.
These uncertainties are less than those estimated for the planktonic foraminifer,
Pulleniatina, which are based on racemization kinetics analyzed in the laboratory (the first
approach described above), with an assumed temperature uncertainty of ± 0.5°C [Kaufman,
2006]. The enhanced age resolution for N. pachyderma can in part be attributed to its relatively
high rate of racemization, which is about twice as high for samples from the Arctic Ocean than
for Pulleniatina from the Queensland Trough, Australia [Hearty et al., 2004] (Fig. 6), despite
bottom water temperatures that are a least a few degrees lower in the deep Arctic Ocean (–1° to
0ºC in the Arctic Ocean compared with 2°C for Queensland Trough). The higher rate of
racemization in N. pachyderma seems inconsistent with its higher rate of amino acid attrition
(discussed above) and suggests that, if amino acids are lost to leaching, they are not
preferentially leached from the more highly racemized free amino acid fraction. We suggest that
the proportion of amino acids within the intra-crystalline fraction, which is dominated by free
amino acids in carbonate fossils [Penkman et al., 2008] increases at a higher rate in N.
pachyderma than in Pulleniatina, but this hypothesis awaits testing by analyzing the different
amino acid fractions.
6. Conclusions and Implications
AAR values (D/L of aspartic acid and glutamic acid) analyzed in planktonic foraminifer
Neogloboquadrina pachyderma show a consistent pattern of downcore trends in three sediment
cores from the central Arctic Ocean separated by hundreds of kilometers, which confirms the
applicability of AAR geochronology to Arctic Ocean stratigraphy. Calibration of the rate of
racemization by independent age assignments (14C ages and correlations with the global MIS
17

record using the Lomonosov Ridge stratigraphy as reference) shows a convincing correlation
between D/L values and age, at least for the late Quaternary. These results indicate that AAR,
which can be measured on small numbers of foraminifers, provides a useful tool for stratigraphic
correlation and late Quaternary geochronology in the Arctic Ocean. To confidently correlate
stratigraphic sequences with reference records, such as in this paper, requires multiple
stratigraphic techniques at relatively high sample resolution, which may not be feasible for many
sites. The AAR approach offers a fast and cost-efficient method for checking the age of target
intervals identified by lithostratigraphic correlation across the Arctic Ocean, even in low-
resolution cores. As a stratigraphic tool, the technique is unencumbered by uncertainties related
to the 14C reservoir age, and is applicable beyond the range of 14C dating. Sediment cores from
the Nordic seas might provide suitable material for refining and extending the AAR calibration
for the Arctic Ocean because bottom water temperatures in the Nordic seas are similar to those in
the Arctic Ocean (near -1°C), and the stratigraphy for the last 500 ka is well developed and
correlated with North Atlantic records (e.g., Bauch and Erlenkeuser, 2003; Helmke and Bauch,
2003).
The late Quaternary time interval is especially important for paleoclimatic studies as it
encompasses the last interglacial, potentially the closest analog for the projected future, low-ice
or even seasonally ice-free state of the Arctic [Otto-Bliesner et al., 2006]. To date, the last
interglacial in the Arctic has been characterized based mostly on sites along the Arctic periphery
[CAPE, 2006], and without a reliable stratigraphic framework for the identification of the last
interglacial in sedimentary records from the central Arctic Ocean. The AAR geochronology
developed here offers a new possibility for resolving this problem with a reasonable accuracy for
sediment cores that contain at least small numbers of planktonic foraminifera.
18
Acknowledgments. HOTRAX’05 coring expedition was supported by the NSF-OPP award
ARC-0352359/0352395. Collection and processing of cores 96/12-1PC and 88AR-P5 was
supported by the Swedish Research Council (award to J. Backman) and the US Geological
Survey, respectively. T Cronin and an anonymous reviewer suggested improvements on the
manuscript. J Bright analyzed the samples in the Amino Acid Geochronology Laboratory at
Northern Arizona University, which is supported by NSF grant EAR-0620455 to DSK. This
study was also supported by NSF-OPP awards ARC-0520505 and 0612473 to LP.
References
Backman, J., M. Jakobsson, R., Løvlie, L. Polyak, and L. A. Febo (2004), Is the central Arctic
Ocean a sediment starved basin? Quat. Sci. Rev., 23, 1435-1454.
Bauch, H.A., and H. Erlenkeuser (2003), Interpreting glacial-interglacial changes in ice volume
and climate from subarctic deep water foraminiferal δ18O, In: Earth's Climate and Orbital
Eccentricity: The Marine Isotope Stage 11 Question, Geophysical Monograph Series, 137,
87-102.
Bauch, H.A., Mueller-Lupp, T., Taldenkova, E., Spielhagen, R.F., Kassens, H., Grootes, P.M.,
Thiede, J., Heinemeier, J., and Petryashov, V.V. (2001), Chronology of the Holocene
transgression at the North Siberian margin, Global Planet. Change, 31, 125–139.
Bischof, J. A. and D. A. Darby (1997), Mid to late Pleistocene ice drift in the western Arctic
Ocean: evidence for a different circulation in the past, Science, 277, 74-78.
CAPE-Last Interglacial Project Members (2006), Last interglacial Arctic warmth confirms polar
amplification of climate change, Quat. Sci. Rev., 25, 1383-1400.
19
Clark, D.L., Whitman, R.R., Morgan, K.A., and Mackey, S.D., 1980. Stratigraphy and glacial-
marine sediments of the Amerasian Basin, central Arctic Ocean. Geologial Society of
America Special Paper 181, 57p.
Comiso, J. C., et al. (2008), Accelerated decline in the Arctic sea ice cover, Geophy. Res. Lett.,
35, doi:10.1029/2007GL031972.
Cronin, T. M., S. Smith, F. Eynaud, M. O�Regan, and J. King (2008), Quaternary
paleoceanography of the central Arctic based on IODP ACEX 302 foraminiferal
assemblages, Paleoceanography, in press.
Darby, D. A., J. F. Bischof, and G. A. Jones (1997), Radiocarbon chronology of depositional
regimes in the western Arctic Ocean, Deep-Sea Res., 44, 1745-1757.
Darby, D., M. Jakobsson, and L. Polyak (2005), Icebreaker expedition collects key Arctic
seafloor and ice data, EOS Trans. AGU, 86(52), 549-556.
Darby, D. A., L. Polyak, and H. Bauch (2006), Past glacial and interglacial conditions in the
Arctic Ocean and marginal seas - a review, in Structure and Function of Contemporary Food
Webs on Arctic Shelves: A Pan-Arctic Comparison, edited by P. Wassman, Prog.
Oceanography, 71, 129-144.
Ekwurzel, B., P. Schlosser, R. A. Mortlock, R. G. Fairbanks, and J. H. Swift (2001), River
runoff, sea ice meltwater and Pacific water distribution and mean residence times in the
Arctic Ocean, J. Geophys. Res., 106, 9075-9092.
Fairbanks, R. G., Mortlock, R. A., Chiu, T.-C., Cao, L., Kaplan, A., Guilderson, T. P., Fairbanks,
T. W., and Bloom, A. L. (2005). Marine radiocarbon calibration curve spanning 0 to 50,000
years B.P. based on paired 230Th/234U/238U and 14C dates on pristine corals, Quatern. Sci.
Rev., 24, 1781-1796.
20
Goodfriend, G. A., J. Brigham-Grette, and G. H. Miller (1996), Enhanced age resolution of the
marine Quaternary record in the Arctic using aspartic acid racemization dating of bivalve
shells, Quat. Res., 45, 176-187.
Hearty, P. J., M. J. O'Leary, D. S. Kaufman, M. Page, and J. Bright (2004), Amino acid
geochronology of individual foraminifer (Pulleniatina obliquiloculata) tests, north
Queensland margin, Australia: A new approach to correlating and dating Quaternary tropical
marine sediment cores, Paleoceanography, 19, PA4022, doi:10.1029/2004PA001059.
Helmke, J. P., and H.A. Bauch (2003), Comparison of glacial and interglacial conditions
between the polar and subpolar North Atlantic region over the last five climatic cycles,
Paleoceanography, 18 (2), 1036, doi:10.1029/2002PA000794.
Ishman, S. E., L. V. Polyak, and R. Z. Poore (1996), Expanded record of Quaternary
oceanographic change: Amerasian Arctic Ocean, Geology, 24, 139-142.
Jakobsson, M., N. Cherkis, J. Woodward, B. Coakley, and R. Macnab (2000), A new grid of
Arctic bathymetry: A significant resource for scientists and mapmakers, EOS Trans. AGU,
81(9), 89, 93, 96.
Jakobsson, M., R. Løvlie, H. Al-Hanbali, E. Arnold, J. Backman, and M. Mörth (2000),
Manganese color cycles in Arctic Ocean sediments constrain Pleistocene chronology,
Geology, 28, 23-26.
Jakobsson, M., R. Løvlie, E. M. Arnold, J. Backman, L. Polak, J. O. Knutsen, and E. Musatov
(2001), Pleistocene stratigraphy and paleoenvironmental variation from Lomonosov Ridge
sediments, central Arctic Ocean. Global Planet. Change, 31, 1-22.
Kaufman, D. S. (2000), Amino acid racemization in ostracodes, in Perspectives in Amino Acid
and Protein Geochemistry, edited by G. Goodfriend et al., pp. 145-160, Oxford Univ. Press,
21
New York.
Kaufman, D. S. (2003), Dating deep-lake sediments by using amino acid racemization in fossil
ostracodes, Geology, 31, 1049-1052.
Kaufman, D. S. (2006), Temperature sensitivity of aspartic and glutamic acid racemization in the
foraminifera Pulleniatina, Quat. Geochron., 1, 188-207.
Kaufman, D. S., and W. F. Manley (1998), A new procedure for determining enantiomeric (D/L)
amino acid ratios in fossils using reverse phase liquid chromatography. Quat. Sci. Rev., 17,
987-1000.
Kirschvink, J.L., 1980, The least squares lines and plane analysis of paleomagnetic data:
Geophys. J.R. Astr. Soc., 62, 699-718..
Kosnik, M. A., and D. S. Kaufman (2008), Identifying outliers and assessing the accuracy of
amino acid racemization measurements for geochronology: II. Data screening, Quat.
Geochron., 3, 328-341.
Kosnik, M. A., D. S. Kaufman, and Q. Hau (2008), Identifying outliers and assessing the
accuracy of amino acid racemization measurements for geochronology: I. Age calibration
curves, Quat. Geochron., 3, 308-327.
Martinson, D. G., N. G. Pisias, J. D. Hays, J. Imbrie, T. C. Moore, and N. J. Shackleton (1987),
Age dating and the orbital theory of the ice ages - development of a high-resolution 0 to
300,000-year chronostratigraphy, Quat. Res., 27, 1-29.
Macko, S. A., and A. E. Aksu (1986), Amino acid epimerization in planktonic foraminfera
suggests slow sedimentation rates for Alpha Ridge, Arctic Ocean, Nature, 322, 730-732.
Nørgaard-Pedersen, N., N. Mikkelsen, and Y. Kristoffersen (2007), Arctic Ocean record of last
two glacial-interglacial cycles off North Greenland/Ellesmere Island - Implications for
22
glacial history, Marine Geol., 244, 93–108.
O’Regan, M., J. King, J. Backman, et al. (2008), Constraints on the Pleistocene chronology of
sediments from the Lomonosov Ridge, Paleoceanography, (in press).
Otto-Bliesner, B. L., S. J. Marshall, J. T. Overpeck, G. H. Miller, A. Hu, and C. L. I. members
(2006), Simulating arctic climate warmth and icefield retreat in the last interglaciation,
Science, 311, 1751-1753.
Penkman, K. E. H., D. S. Kaufman, D. Maddy, and M. J. Collins (2008), Closed-system
behaviour of the intra-crystalline fraction of amino acids in mollusk shells, Quat. Geochron.,
3, 2-25.
Phillips, R.L., and A. Grantz, 1997, Quaternary history of sea ice and paleoclimate in the
Amerasia basin, Arctic Ocean, as recorded in the cyclical strata of Northwind Ridge. Geol.
Soc. Amer. Bull., 109, 1101-1115.
Phillips, R. L., and A. Grantz (2001), Regional variations in provenance and abundance of ice-
rafted clasts in Arctic Ocean sediments: implications for the configuration of late Quaternary
oceanic and atmospheric circulation in the Arctic, Marine Geol., 172, 91-115.
Polyak, L., W. B. Curry, D. A. Darby, J. Bischof, and T. M. Cronin (2004), Contrasting
glacial/interglacial regimes in the western Arctic Ocean as exemplified by a sedimentary
record from the Mendeleev Ridge, Palaeogeog., Palaeoclimatol., Palaeoecol., 203, 73-93.
Poore, R. Z., R. L. Phillips, and H. J.Rieck (1993), Paloeclimate record for Northwind Ridge,
western Arctic Ocean, Paleoceanography, 8, 149-159.
Poore, R. Z., S. E. Ishman, R. L. Phillips, and D. H. McNeil (1994), Quaternary stratigraphy and
paleoceanography of the Canada Basin, western Arctic Ocean, US Geol. Surv. Bull., 2080, 32
pp.
23

Poore, R. Z., L. Osterman, W. B. Curry, and R. L. Phillips (1999), Late Pleistocene and
Holocene meltwater events in the western Arctic Ocean, Geology, 27, 759-762.
Sejrup, H. P., G. H. Miller, J. Brigham-Grette, R. Løvlie, and D. Hopkins (1984), Amino acid
epimerization implies rapid sedimentation rates in Arctic ocean cores, Nature 310, 772-775.
Sellen, E., M. Jakobsson, and J. Backman (2008), Sedimentary regimes in Arctic’s Amerasian
and Eurasian basins: clues to differences in sedimentation rates, Global and Planet. Change
61, 275-284.
Spielhagen, R. F., K. H. Baumann, H Erlenkeuser, N. R. Nowaczyk, N. Norgaard-Pedersen, C.
Vogt, and D. Weiel (2004), Arctic Ocean deep-sea record of northern Eurasian ice sheet
history, Quat. Sci. Rev., 23, 1455–1483.
Steuerwald, B. A., D. L. Clark, and J. A. Andrew (1968), Magnetic stratigraphy and faunal
patterns in Arctic Ocean sediments, Earth Planet. Sci. Lett., 5, 79-85.
Volkmann, R. (2000), Planktic foraminifers in the outer Laptev Sea and the Fram Strait –
modern distribution and ecology, J. Foraminiferal Res., 30, 157-176.
Wehmiller, J. F. (1984), Interlaboratory comparison of amino acid enantiomeric ratios in fossil
Pleistocene mollusks, Quat. Res., 22, 109-120.
24
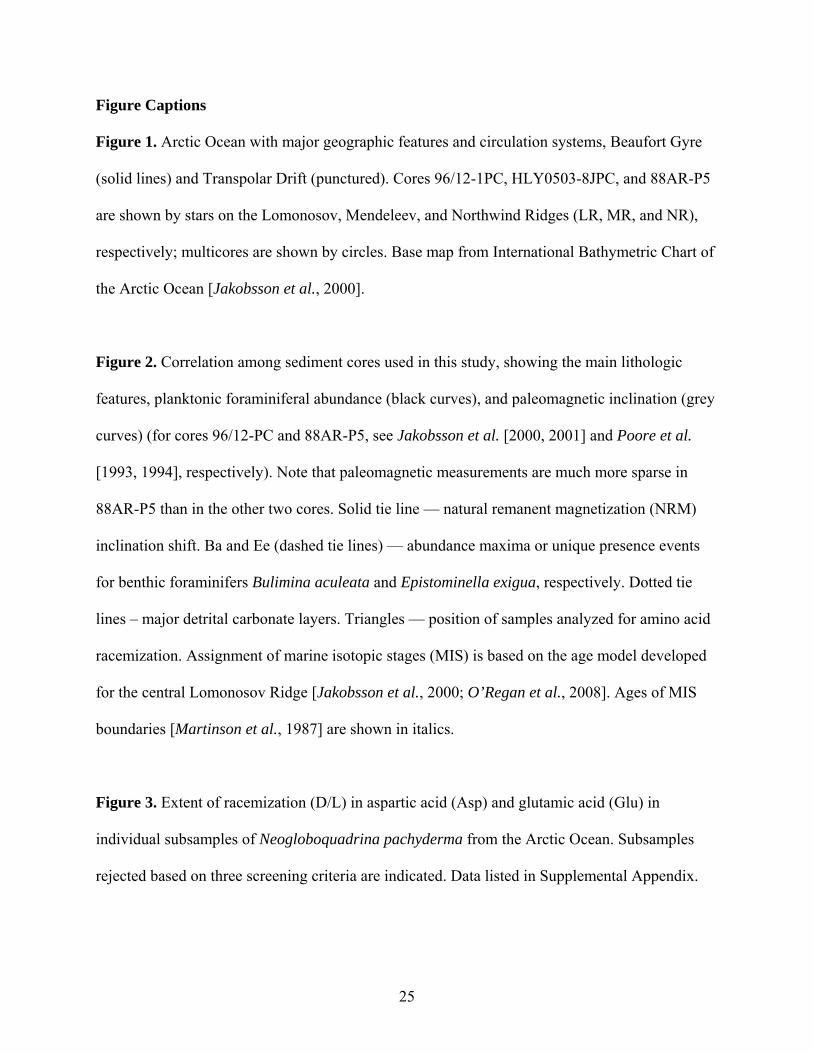
Figure Captions
Figure 1. Arctic Ocean with major geographic features and circulation systems, Beaufort Gyre
(solid lines) and Transpolar Drift (punctured). Cores 96/12-1PC, HLY0503-8JPC, and 88AR-P5
are shown by stars on the Lomonosov, Mendeleev, and Northwind Ridges (LR, MR, and NR),
respectively; multicores are shown by circles. Base map from International Bathymetric Chart of
the Arctic Ocean [Jakobsson et al., 2000].
Figure 2. Correlation among sediment cores used in this study, showing the main lithologic
features, planktonic foraminiferal abundance (black curves), and paleomagnetic inclination (grey
curves) (for cores 96/12-PC and 88AR-P5, see Jakobsson et al. [2000, 2001] and Poore et al.
[1993, 1994], respectively). Note that paleomagnetic measurements are much more sparse in
88AR-P5 than in the other two cores. Solid tie line — natural remanent magnetization (NRM)
inclination shift. Ba and Ee (dashed tie lines) — abundance maxima or unique presence events
for benthic foraminifers Bulimina aculeata and Epistominella exigua, respectively. Dotted tie
lines – major detrital carbonate layers. Triangles — position of samples analyzed for amino acid
racemization. Assignment of marine isotopic stages (MIS) is based on the age model developed
for the central Lomonosov Ridge [Jakobsson et al., 2000; O’Regan et al., 2008]. Ages of MIS
boundaries [Martinson et al., 1987] are shown in italics.
Figure 3. Extent of racemization (D/L) in aspartic acid (Asp) and glutamic acid (Glu) in
individual subsamples of Neogloboquadrina pachyderma from the Arctic Ocean. Subsamples
rejected based on three screening criteria are indicated. Data listed in Supplemental Appendix.
25

Figure 4. Amino acid abundance in subsamples of Neogloboquadrina pachyderma from the
Arctic Ocean. Abundance values are the sum of aspartic acid (Asp), glutamic acid (Glu), and
serine (Ser) per individual foraminifer. The mass of each test averages 8-10 µg. The abundance
of amino acids decreases with increasing racemization (age) and is similar for accepted and
rejected subsamples. Data listed in Supplemental Appendix.
Figure 5. Extent of racemization (D/L) in aspartic acid (Asp) and glutamic acid (Glu) in samples
of Neogloboquadrina pachyderma plotted according depth in five sediment cores from the Arctic
Ocean. Tie lines connect samples from specific stratigraphic events discussed in the text and
shown in Fig. 2, including: inclin — paleomagnetic inclination shift; Ba and Ee — Bulimina
aculeata and Epistominella exigua events, respectively; dc — samples adjacent to the upper
detrital carbonate layer. Data listed in Table 3.
Figure 6. Rate of racemization in (A) aspartic acid (Asp) and (B) glumatic acid (Glu) in
independently dated samples of Neogloboquadrina pachyderma from the Arctic Ocean. Least-
squares linear regressions are based on samples <150 ka only. Samples shown in grey symbols
were not included. Data listed in Table 4. Grey curve — rate of racemization in Pulleniatna from
the Queensland Trough, Australia [Hearty et al., 2004].
26
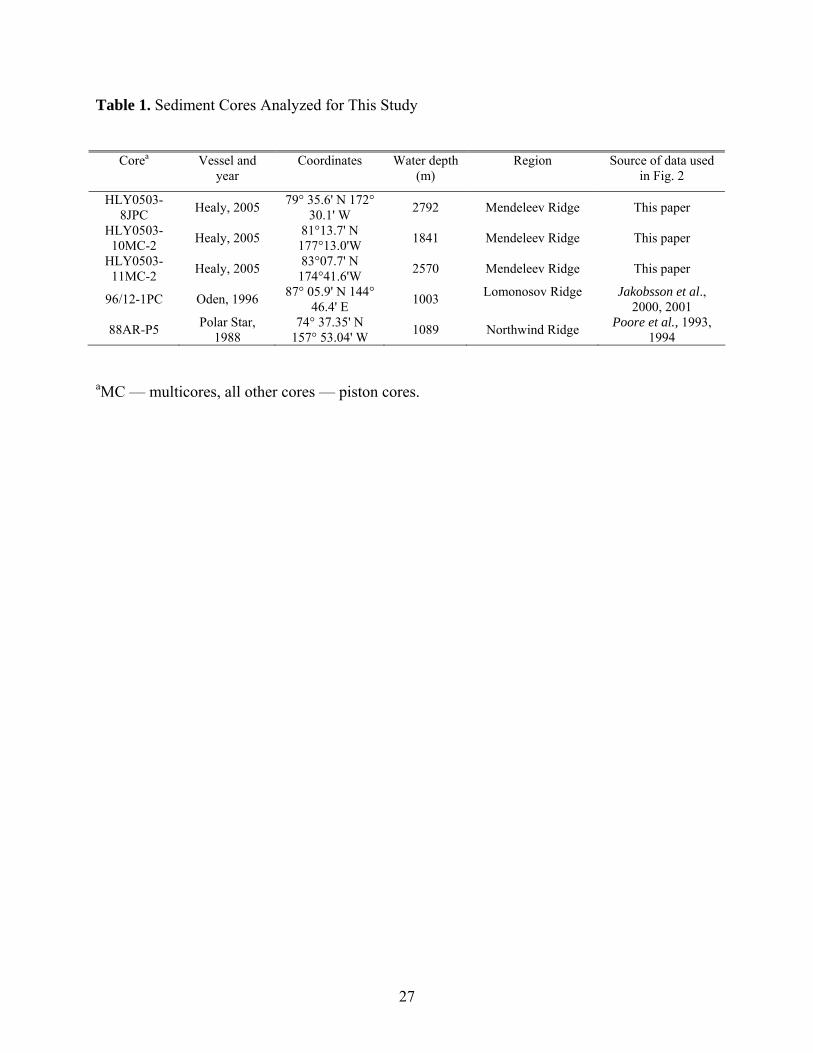
Table 1. Sediment Cores Analyzed for This Study
Corea Vessel and
year Coordinates Water depth
(m) Region Source of data used
in Fig. 2
HLY0503-8JPC Healy, 2005 79° 35.6' N 172°
30.1' W 2792 Mendeleev Ridge This paper
HLY0503-10MC-2 Healy, 2005 81°13.7' N
177°13.0'W 1841 Mendeleev Ridge This paper
HLY0503-11MC-2 Healy, 2005 83°07.7' N
174°41.6'W 2570 Mendeleev Ridge This paper
96/12-1PC Oden, 1996 87° 05.9' N 144° 46.4' E 1003 Lomonosov Ridge Jakobsson et al.,
2000, 2001
88AR-P5 Polar Star, 1988
74° 37.35' N 157° 53.04' W 1089 Northwind Ridge Poore et al., 1993,
1994
aMC — multicores, all other cores — piston cores.
27
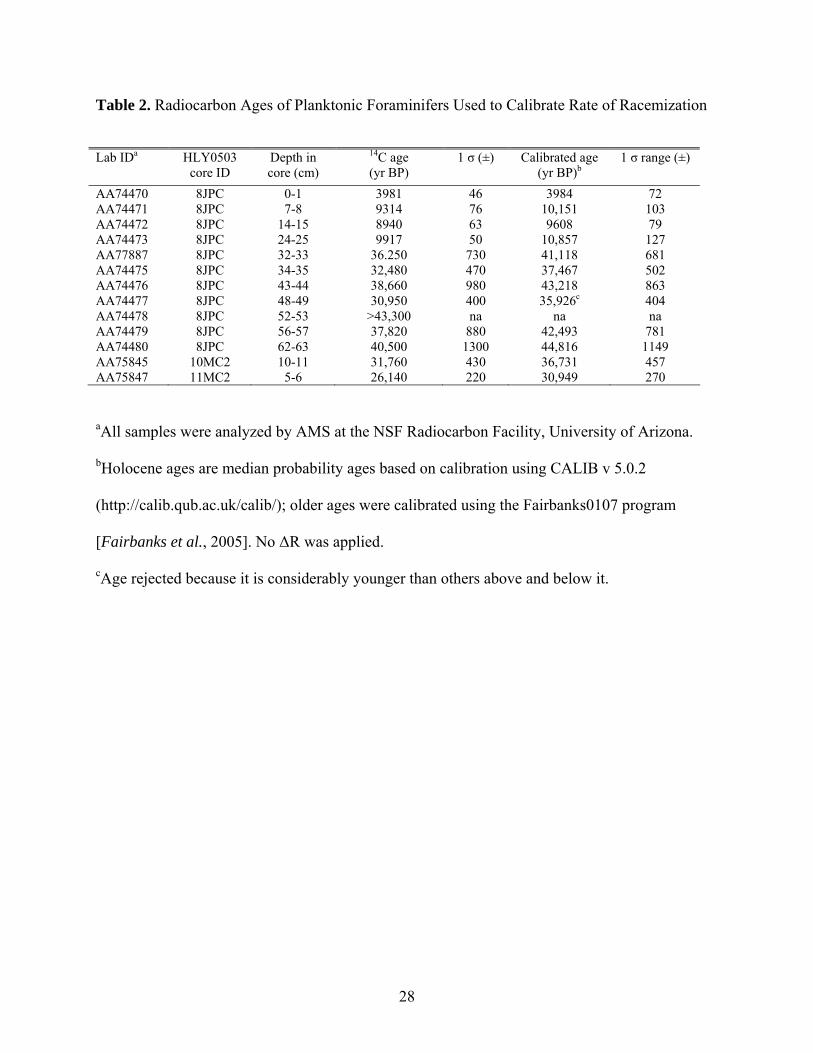
Table 2. Radiocarbon Ages of Planktonic Foraminifers Used to Calibrate Rate of Racemization
Lab IDa HLY0503
core ID Depth in core (cm)
14C age (yr BP)
1 σ (±) Calibrated age (yr BP)b
1 σ range (±)
AA74470 8JPC 0-1 3981 46 3984 72 AA74471 8JPC 7-8 9314 76 10,151 103 AA74472 8JPC 14-15 8940 63 9608 79 AA74473 8JPC 24-25 9917 50 10,857 127 AA77887 8JPC 32-33 36.250 730 41,118 681 AA74475 8JPC 34-35 32,480 470 37,467 502 AA74476 8JPC 43-44 38,660 980 43,218 863 AA74477 8JPC 48-49 30,950 400 35,926c 404 AA74478 8JPC 52-53 >43,300 na na na AA74479 8JPC 56-57 37,820 880 42,493 781 AA74480 8JPC 62-63 40,500 1300 44,816 1149 AA75845 10MC2 10-11 31,760 430 36,731 457 AA75847 11MC2 5-6 26,140 220 30,949 270
aAll samples were analyzed by AMS at the NSF Radiocarbon Facility, University of Arizona.
bHolocene ages are median probability ages based on calibration using CALIB v 5.0.2
(http://calib.qub.ac.uk/calib/); older ages were calibrated using the Fairbanks0107 program
[Fairbanks et al., 2005]. No ΔR was applied.
cAge rejected because it is considerably younger than others above and below it.
28

29
Table 3. Extent of Racemization (D/L) in Foraminifera from Arctic Ocean Cores
Lab ID Depth Aspartic acid Glutamic acid Age (UAL) (cm) na exa D/L ± σx D/L ± σx (ka)b
88AR-P5 5921 1 5 0 0.098 0.005 0.050 0.005 5.535920 55 5 0 0.248 0.004 0.111 0.005 355918 89 5 0 0.288 0.006 0.139 0.004 645922 125 4 1 0.349 0.012 0.163 0.015 855917 180 3 2 0.380 0.011 0.169 0.006 1005923 191 4 1 0.406 0.004 0.213 0.005 1055919 233 4 1 0.404 0.004 0.194 0.003 1235916 318 4 1 0.395 0.011 0.203 0.006 1935913 365 4 4 0.408 0.007 0.194 0.004 24296/12-1PC 5926 0-1.9 4 2 0.154 0.003 0.088 0.001 105927 18.3-20.2 3 2 0.267 0.002 0.118 0.006 355928 175.8-177.4 6 1 0.313 0.008 0.146 0.011 795929 198.4-200 3 2 0.404 0.017 0.194 0.013 855930 206.4-208.1 3 1 0.401 0.014 0.207 0.021 1005931 219-220.5 5 0 0.392 0.008 0.184 0.010 1235932 257.5-259 4 1 0.440 0.016 0.230 0.018 1935933 275-276.6 5 0 0.463 0.013 0.248 0.018 242HLY0503-8JPC 6134 0-1 4 1 0.080 0.003 0.035 0.000 3.986141 7-8 4 0 0.096 0.004 0.034 0.003 10.15 6140 14-15 2 1 0.108 0.002 0.046 0.004 9.616135 24-25 3 1 0.110 0.002 0.039 0.001 10.86 6136 32-33 4 0 0.193 0.007 0.086 0.005 41.12 6142 34-35 6 0 0.190 0.006 0.076 0.006 37.47 6137 43-44 5 1 0.221 0.004 0.104 0.006 43.22 6143 48-49 4 1 0.261 0.005 0.109 0.011 406138 52-53 6 0 0.278 0.003 0.132 0.004 426144 56-57 4 1 0.285 0.010 0.131 0.014 42.49 6139 62-63 6 0 0.295 0.004 0.143 0.004 44.85 6387 73-74 4 1 0.276 0.009 0.101 0.007 486388 83-84 4 1 0.283 0.006 0.123 0.004 516389 93-94 2 0 0.344 0.007 0.176 0.008 536149 105-106 4 0 0.309 0.004 0.154 0.004 566390 115-116 4 1 0.361 0.008 0.177 0.008 616391 132-133 3 1 0.355 0.005 0.176 0.005 796392 145-146 2 0 0.342 0.013 0.145 0.013 906393c 179-180 4 0 0.462 0.006 0.232 0.006 1006717 180-181 8 1 0.405 0.008 0.197 0.006 1006394 226-227 3 2 0.402 0.007 0.188 0.006 1236395 238-239 5 0 0.395 0.007 0.177 0.007 1266396 246-247 3 2 0.389 0.005 0.168 0.006 1296775 282-283 6 0 0.411 0.006 0.201 0.010 1476718 358-359 6 3 0.400 0.010 0.184 0.005 1786719 404-405 7 2 0.419 0.010 0.204 0.008 1936720 418-419 8 1 0.429 0.010 0.211 0.009 1966776 428-429 6 1 0.441 0.012 0.219 0.016 222HLY0503-11MC-2 6510 5-6 5 0 0.225 0.018 0.106 0.011 30.95 HLY0503-10MC-2 6511 10-11 5 0 0.279 0.009 0.137 0.005 36.73
Inter-laboratory comparison samplesd
ILC-A na 9 0 0.372 0.002 0.184 0.001 naILC-B na 9 0 0.685 0.002 0.407 0.001 naILC-C na 9 0 0.889 0.008 0.839 0.001 na
an — Number of subsamples included; ex — number excluded in calculation of mean and standard error.
bAges with two decimals — 14C age (Table 2); other ages — estimated based on stratigraphic correlations.
cSample rejected because D/L values are considerably higher than any in the underlying 2 m of core.
dILC samples [Wehmiller, 1984] analyzed during the course of this study.
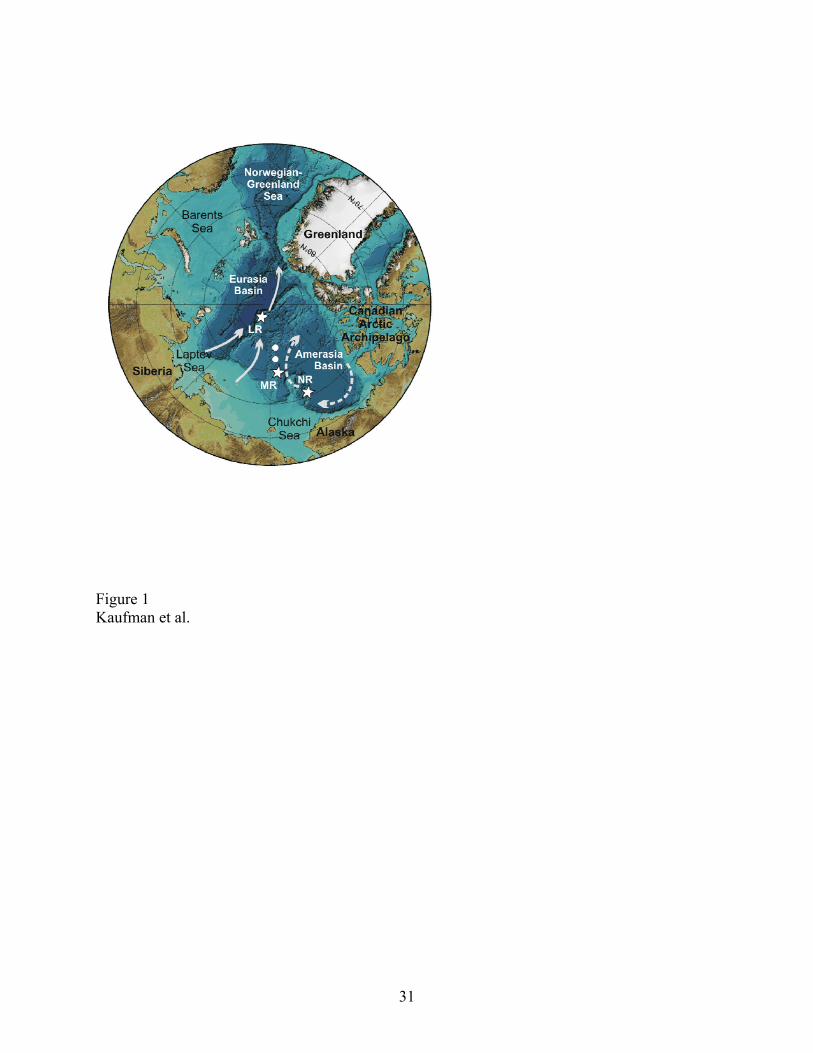
Figure 1 Kaufman et al.
31
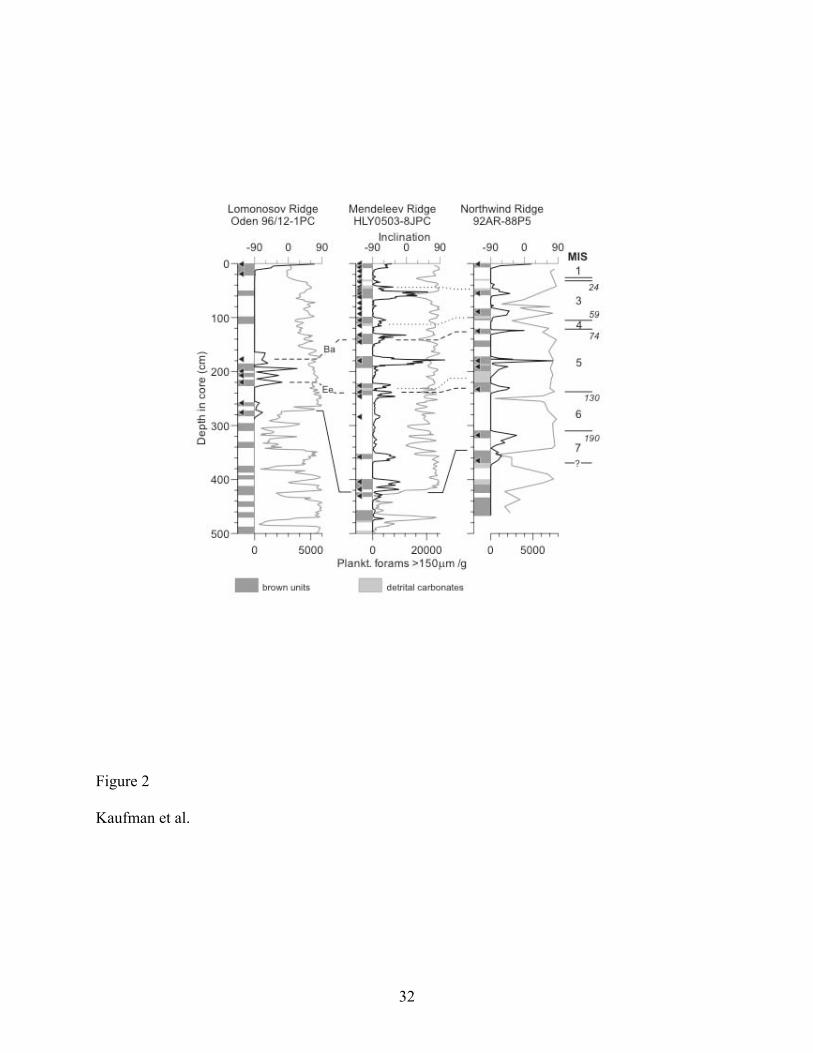
Figure 2
Kaufman et al.
32
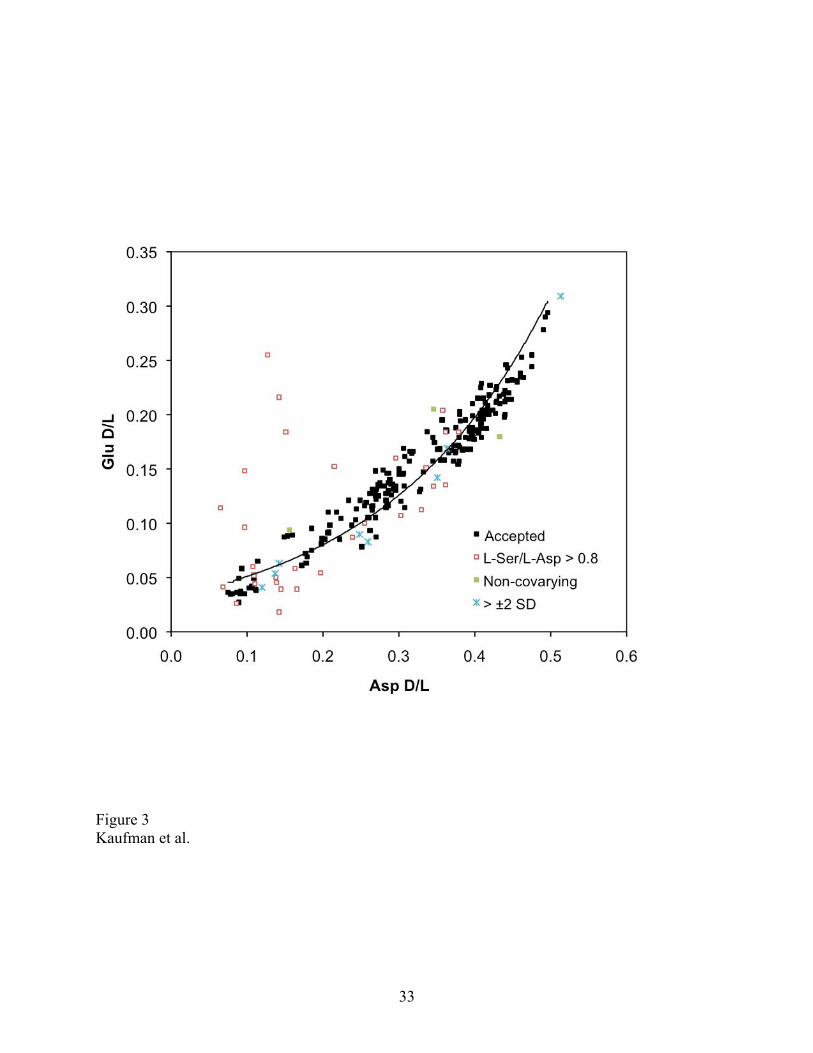
Figure 3 Kaufman et al.
33
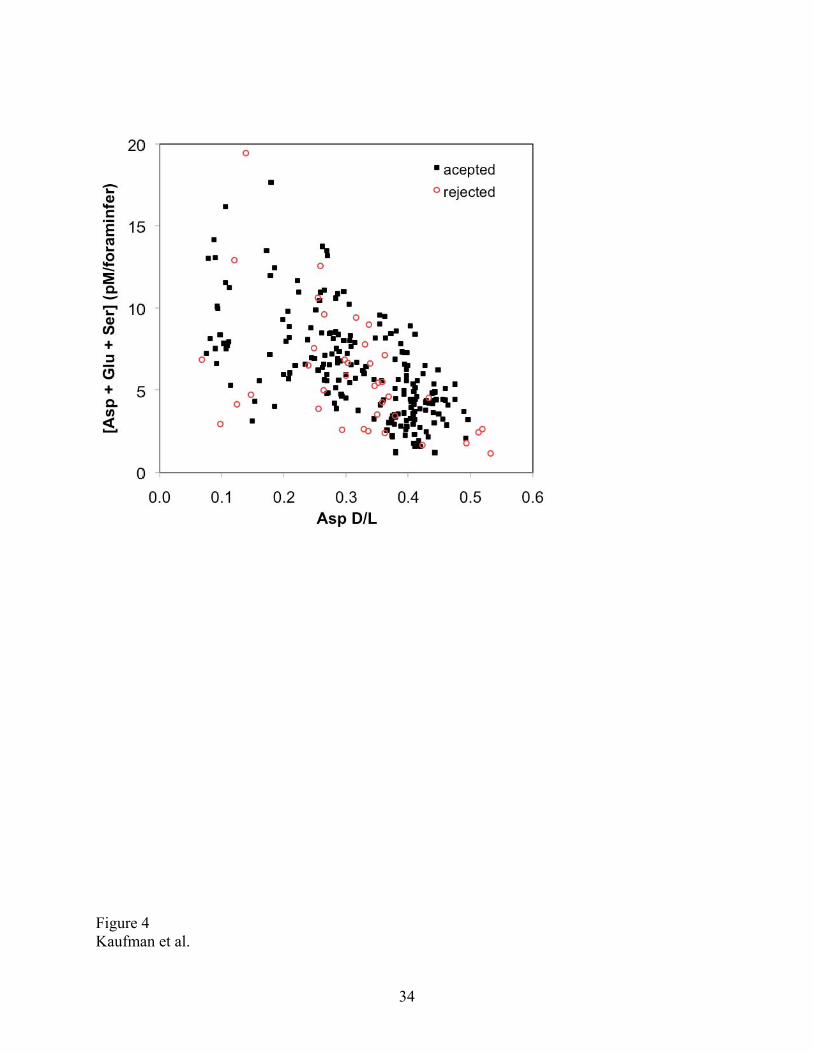
Figure 4 Kaufman et al.
34
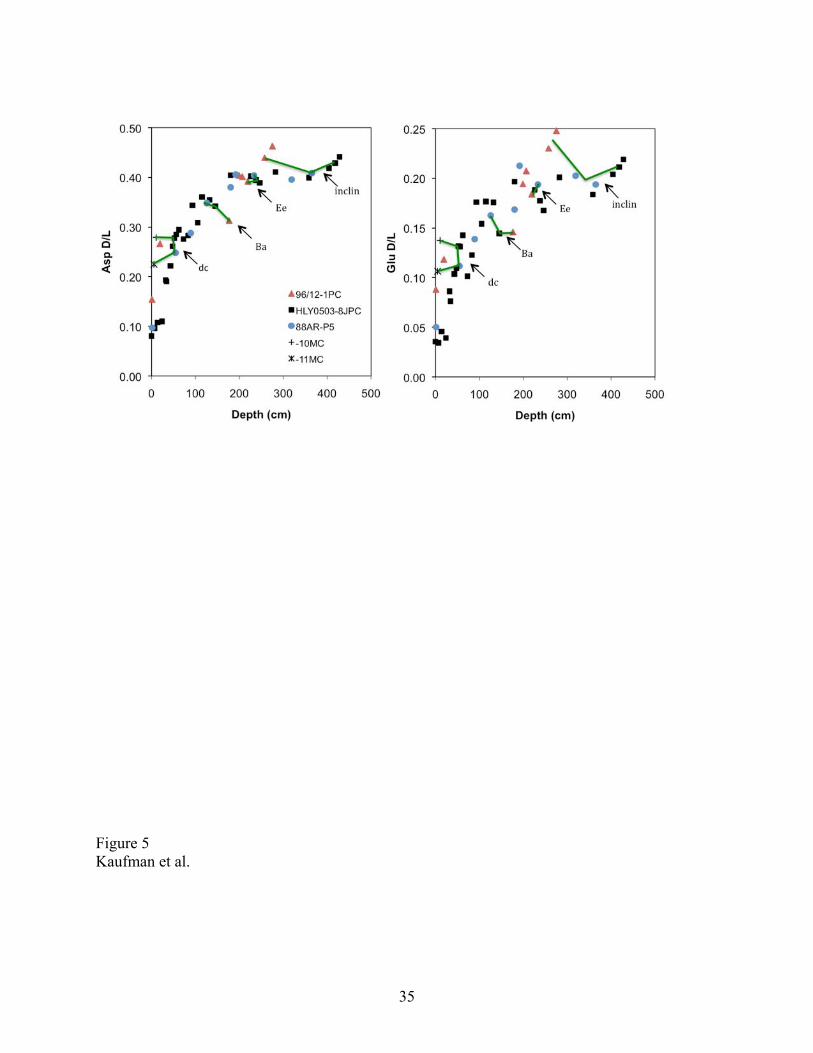
Figure 5 Kaufman et al.
35
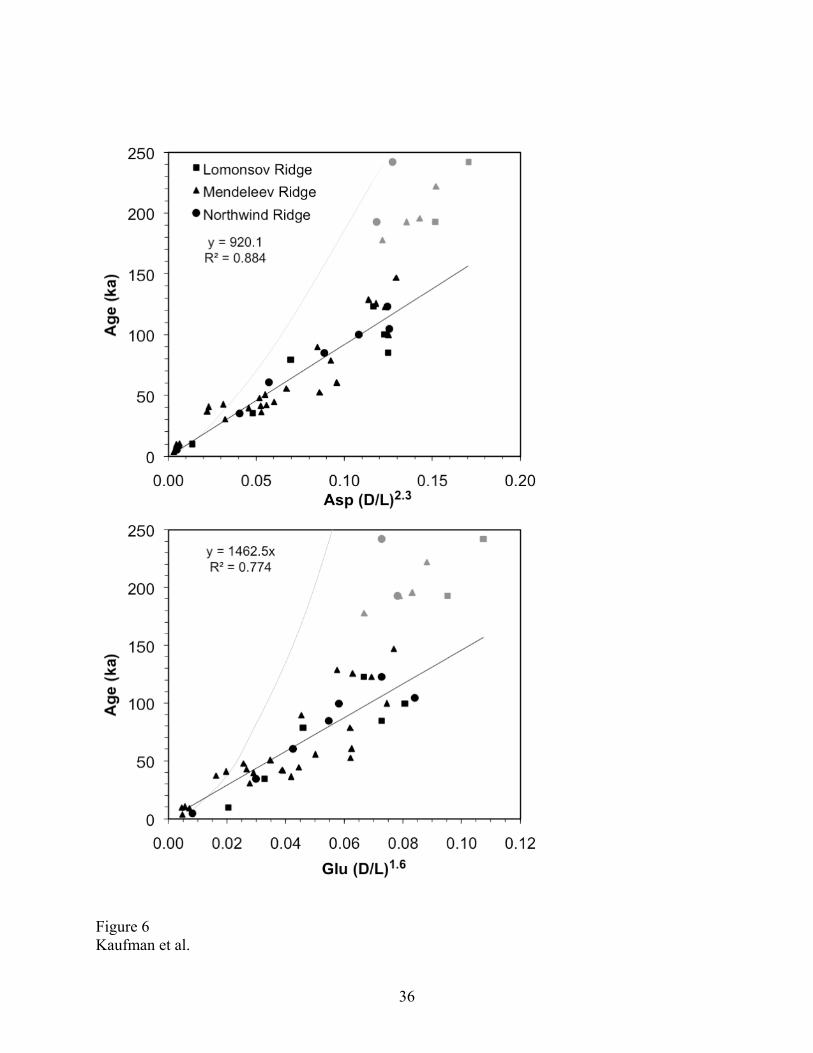
Figure 6 Kaufman et al.
36