Embed Size (px)
Citation preview
PERSISTENT OPERATING LOSSES AND CORPORATE FINANCIAL POLICIES*
David J. Denis
Stephen B. McKeon
May 2017
We thank Harry DeAngelo, Diane Denis, Will Gornall, David Haushalter, Rene Stulz, and participants at the Pacific Northwest Finance Conference, Baruch University, NOVA School of Business and Economics, North Carolina State University, TCU, Tsinghua School of Economics and Management, Tsinghua PBC, University of Oklahoma, University of Porto, and University of Wisconsin, Milwaukee for helpful comments. Roger S. Ahlbrandt, Sr. Chair and Professor of Business Administration, University of Pittsburgh, [email protected] Asst. Professor of Finance, University of Oregon, [email protected]

1
Persistent Operating Losses and Corporate Financial Policies
Abstract
Among U.S. firms, operating losses have become substantially more prevalent, persistent, and greater in magnitude since 1970. Loss firms now comprise over 30% of the Compustat universe and such losses continue for a median of four years. We find that firms with negative operating cash flows account for more than half of the rise in average cash balances over the sample period, with average cash holdings increasing by 615% for negative cash flow firms vs. 95% for positive cash flow firms. Further, firms exhibiting operating losses now comprise the majority of equity issuers. These companies issue frequently, primarily through private placements, and use the funds raised in the issue to cover subsequent operating losses. We conclude that the immediate and expected ongoing liquidity needs of firms with persistent operating losses have substantially altered corporate financial policies.
2
1. Introduction
A growing body of research reports secular changes in the composition of publicly traded
U.S. companies. As reported in Kahle and Stulz (2016), U.S. companies have evolved over the
past several decades from being manufacturing entities to being more service and high-tech
oriented. Coincident with this shift, U.S. companies spend less on capital expenditures and more
on research and development (R&D) so that intangible capital now comprises more than 50% of
net assets for the average company (Falato, Kadyrzhanova, and Sim (2013)). Cash flows have
also become more volatile and Bates, Kahle, and Stulz (2009) tie this increase in volatility to
secular increases in average corporate cash holdings.
In this study, we explore the evolution of profitability among U.S. firms and show that not
only have cash flows become riskier; they are now much lower for a considerable subset of U.S
firms. In the 1950’s about 2% of public firms listed in Compustat reported operating losses
(defined as negative cash flow from operations on the firm’s Statement of Cash Flow). In contrast,
the period since 1980 has been characterized by an explosion in the percentage of public firms
with negative cash flow (CF), rising from 9% in 1979 to over 30% in several recent years.
Moreover, similar patterns exist even if we measure operating cash flow before R&D expenditures
have been deducted. Thus, these patterns are not simply a byproduct of rising R&D expenditures
over time.
We further show that for most firms in recent years, operating losses are not a transitory
phenomenon. Firms that lose money on operations this period are likely to lose money next period
as well. For example, less than 14% of the firms that reported negative CF in 2014 subsequently
reported positive CF in 2015, and the median ‘run’ of negative cash flow is four years. This
persistence in operating losses is also a recent phenomenon; up until approximately 1990, firms
3
that reported an operating loss in one year had a greater than 50% chance of reporting positive
operating earnings in the following year. Moreover, the magnitude of operating losses has grown
substantially over time as well. In the 1970s, operating cash flow for firms in the bottom decile of
operating cash flow exhibited losses equal to 11% of assets, on average. In the 2000s, these
average losses for firms in the bottom decile have ballooned to 58% of assets.
Persistent operating losses create immediate and ongoing liquidity needs that must be met
by existing internal resources or external finance (or both). We show that firms expecting such
losses behave differently than firms with positive cash flow on several dimensions of corporate
financial policy such as cash holdings, equity issuance frequency, and cash savings from issuance.
Between 1970 and 2015, average cash holdings as a percentage of total assets increase by 91% for
firms exhibiting positive cash flow. More strikingly, however, average cash holdings increase by
615% for firms with negative operating cash flow. Firms with negative cash flow account for
more than half of the increase in average cash balances of U.S. firms reported in Bates, Kahle, and
Stulz (2009).
Traditionally, the precautionary demand for cash has been framed within a context focused
on the second moment of the distribution of cash flow. According to the precautionary savings
theory of Keynes (1936), firms stockpile cash to protect themselves against adverse cash flow
shocks because these shocks could lead to underinvestment. However, when the first moment of
the cash flow distribution is negative, first moment considerations are likely to dominate second
moment considerations. In such situations, the demand for cash stems more from the expected
level of cash flow than from its volatility. Consistent with this view, we show that neither changes
in cash flow volatility nor increases in R&D expenditures (two traditional proxies for the demand
for precautionary cash) are sufficient to capture the additional amount of cash held by negative

4
cash flow firms. For example, among the subsample of firms that comprise the top two deciles of
R&D spending, we find that the cash holdings of high cash flow firms have grown by 54% over
our sample period, while cash holdings of low cash flow firms have grown by nearly 900%.
We infer from this evidence that among the growing number of firms that exhibit persistent
operational deficits, cash stockpiling for these firms is less about guarding against the possibility
of a shock to financing needs or costs, and more about the fact that cash flow is negative right now
and is likely to remain that way. In other words, the stockpile is not solely a precaution against
the possibility of underinvestment induced by unexpected financing needs. It is a deliberate plan
to finance near term operational needs under an expectation of negative cash flows.
To explore the source of cash stockpiles in firms with negative operating flows, we analyze
external financing activity and asset sales and find that the relative proportions of each have
changed substantially over time. In the 1970’s, high CF firms mostly issued equity and low CF
firms relied predominantly on debt. By contrast, in the most recent period (2010–2015), low CF
firms raise 15 times more equity capital than debt capital.
Consistent with Ritter and Welch’s (2002) and Fama and French’s (2004) evidence on new
lists, we find that over the past four decades, negative cash flow firms represent an increasing
proportion of firm-initiated equity issuances (IPOs, SEOs, and private placements).1 In every year
but one since 1989, the majority of firms issuing equity report negative operating cash flows (CF).
In the last year of our sample, 2015, negative CF issuers outnumber positive CF issuers by a factor
of 2 to 1. In addition, we find that equity issues of firms with negative operating cash flow are
overwhelmingly private placements in recent years. Such private placements account for
1 Firm-initiated equity issues are defined as stock issuances that exceed 3% of market equity. This definition captures the vast majority of IPOs, SEOs, and private placements while excluding most employee-initiated issuances such as ESPPs and the exercise of stock options (McKeon, 2015).

5
approximately 90% of the equity issues for negative cash flow firms in the last five years of our
data. By contrast, the majority of equity issues for positive cash flow firms over the same period
are seasoned equity offerings (SEOs).
Firm-initiated equity issues typically represent a substantial cash inflow to the firm and
McLean (2011) argues that cash savings from equity issuance has been increasing over time.
Additionally, Huang and Ritter (2016) find that immediate cash needs are an important
determinant of equity issues and that firms save 65% of the proceeds from equity issues in cash at
year-end, on average.
During our sample period, over 1/3 of firms initiating equity issues hold all of the proceeds
as cash at year end. We illustrate the importance of operating losses by scaling each equity issuer’s
post-issue cash balances by the magnitude of the company’s cash burn rate.2 This scaled measure,
commonly called “runway” within the venture capital industry, represents an estimate of how
many months a firm with negative cash flows can continue to operate at the same rate without an
infusion of external capital. Ceteris paribus, equity issuers could increase runway by increasing
issuance size and stockpiling cash. However, we find that the median runway after issuance has
stayed within the same range for decades, typically between 6 and 18 months, and, most notably,
exhibits no time trend over the past two decades, a period during which average cash balances
have exploded. In other words, cash savings from issuance have increased substantially, but burn
rates have also risen concomitantly. The takeaway is that for equity issuers with negative cash
flows, the increase in cash holdings is driven in large part by elevated operating needs in the sense
2 We define monthly burn rate as –[Operating CF-Dividends-Capital Expenditures] divided by twelve. For example, a firm that reports negative CF of $100MM and capital expenditures of $20MM annually has a monthly burn rate of $10MM. Firms generating positive free cash flows do not have a burn rate.
6
that the number of months of operations covered by cash on hand has not changed substantially
over time.
Ours is not the first study to document secular decreases in the profitability of U.S. firms.
For example, Fama and French (2004) report that the profitability of newly listed firms has become
increasingly left-skewed and that, as these firms are integrated into the economy, overall
profitability becomes more left-skewed as well. Similarly, Kahle and Stulz (2016) document a
decline in average profitability rates among U.S. firms. We extend this literature by showing that
the secular trend in profitability is not just a ‘new lists’ effect, we document for the first time the
increased persistence and magnitude of operating losses, and link these trends to secular changes
in corporate financial policies.
Other prior studies have investigated financial policies in firms exhibiting losses. For
example, DeAngelo, DeAngelo, and Skinner (1992) find that dividend decreases are strongly
associated with the presence of losses, particularly if these losses are persistent. In contrast with
the troubled firms studied in DeAngelo, DeAngelo, and Skinner (1992), we show that in recent
years, firms with persistent operating losses are high-growth firms that are able to frequently raise
equity capital.
Our study also contributes to three related strands of the literature. The first seeks to
understand the magnitude of cash balances among U.S. firms and why average balances have
grown so dramatically in recent years. Our findings complement and extend those from studies
that ascribe a role for increased precautionary demands due to uncertainty in future financing
needs, and for increased costs of repatriating foreign earnings in explaining high cash balances.
We show that, in addition to these factors, an increased demand for operational cash to fund
immediate, and expected ongoing liquidity needs is an important determinant of observed cash

7
balances. Our findings also provide a potential explanation for the finding in Pinkowitz, Stulz,
and Williamson (2016) that differences in average cash balances between U.S. firms and their
foreign counterparts are driven by a small set of U.S. firms with very high R&D expenditures. We
show that high cash balances of high R&D firms are concentrated among those firms with
persistent operating losses.
Second, our findings extend the literature on the motives for equity issuance. Kim and
Weisbach (2008) report that additions to cash holdings are the primary use of equity issue proceeds
in a large international sample of IPOs and SEOs. Moreover, McLean (2011) reports that the
percentage of equity issue proceeds held as cash at the end of the year of issuance has increased
substantially over time. These studies imply that cash stockpiling is an important motive for equity
issuance. DeAngelo, DeAngelo, and Stulz (2010) report that most SEO issuers would have been
unable to fund current operating plans in the absence of the equity issue. They thus attribute the
issuance decision to the need to fund near-term investment. Our findings indicate that equity
issuers in recent years are increasingly characterized by ongoing operating losses and, therefore,
high cash burn rates. They not only have immediate funding needs, but also a need to stockpile
cash to fund anticipated near-term future funding shortfalls. Nonetheless, this stockpile is of short
duration, requiring the firms with persistent operating losses to issue equity far more frequently
than has been documented in the prior SEO literature. The frequency of issuance is consistent
with a staging of capital infusions of the type reported for newly public firms in Hertzel, Huson,
and Parrino (2012).
Finally, our findings have implications for the empirical literature that models cash
balances as a linear function of firm, country and institutional characteristics. These studies
typically include contemporaneous cash flow among the set of variables that capture the firm’s
8
sources and uses of funds and, therefore, its operating cash needs. Our findings imply that such
models have become increasingly misspecified in recent years as the distribution of firms has
shifted towards firms with persistent operating losses. Because these firms exhibit unusually high
cash balances, existing models that ignore this nonlinearity systematically underestimate ‘normal’
cash holdings for firms with persistent negative cash flows.
The rest of the study progresses as follows: Section 2 documents the rise in operating loss
firms. Section 3 reports results explaining how the rise in corporate cash holdings is related to
operating losses. Section 4 reports results on the relation between operating loss firms and cash
savings from equity issuance. Section 5 discusses implications of our findings, and Section 6
concludes.
2. Descriptive evidence on operating losses
The main sample consists of all U.S firms with total assets greater than $5 million (in 2015
dollars) between 1970 and 2015. The data are obtained from the Compustat database, Industrial
Annual file. Historically regulated firms such as financial firms (SIC codes 6000–6999) and
utilities (SIC codes 4900–4999) are excluded, as are firms missing data necessary for the
calculation of cash ratios. Within this sample, we identify firm-initiated equity issues such as
IPOs, SEOs, and private placements, using the method detailed in McKeon (2015), specifically,
those issues in which proceeds from common stock issuance are greater than 3% of market equity.
We begin by documenting the prevalence of operating losses over time. We define an
operating loss as a negative cash flow from operations as reported on the statement of cash flows.
Prior to 1987, firms were not mandated to report cash flow from operations. When this figure is
missing, we calculate an approximation as described in the Appendix. Figure 1 plots the

9
percentage of the sample that reports negative operating cash flows each year since 1960. The rise
is striking. In the early part of the sample, negative operating cash flows are almost non-existent.
Despite four recessions between 1960 and 1980 (as defined by the National Bureau of Economic
Research (NBER)), the percentage of firms with negative cash flow only exceeds 10% three times.
Since 1990, however, it has rarely been less than 25%.3 In 2015, the final year in the sample,
nearly 1/3 of the sample firms report negative operating cash flows.
One firm characteristic that has changed substantially over time is R&D expenditures
(Brown et al., 2009). To investigate whether the rise in negative cash flow firms is driven primarily
by high R&D expenditures, we measure OCFRD, which is operating cash flow with R&D added
back. As it turns out, there is more to the story than R&D. The proportion of firms with negative
OCFRD has also experienced a substantial rise over the same period and by 2015 nearly 1 in 4
firms reports negative operating cash flows even before subtracting R&D expense.
Figure 1 shows that negative cash flows are pervasive; however, a related question is
whether negative cash flows are transitory. We find that it is increasingly the case that firms are
experiencing persistent negative cash flows rather than negative cash flows that occur due to a
temporary shock. Figure 2 illustrates a strong time trend in the persistence of negative cash flows.
Panel A illustrates that in the 1970’s and 80’s most firms that experienced negative cash flows
returned to positive cash flows in the following year. By contrast, less than ¼ of firms that reported
negative cash flow in 2014 followed up with positive cash flow in 2015. Panel B reports the
average number of years, including the current year, of consecutive negative cash flows. By
construction, the lower bound of 1.0 represents a situation in which every firm reporting negative
cash flow in a given year had positive cash flow in the prior year. Consistent with panel A, this
3 Kahle and Stulz (2016) also report a decline in average profitability among U.S. firms, but do not investigate its persistence or its connection with corporate financial policies.

10
measure exhibits a strong time trend, peaking in the last year of the sample at nearly four years.
This implies that the occurrence of negative cash flows is not likely to be surprising or unexpected
for most firms in recent years. Rather, they are operating with the intention and expectation of
extended cash flow deficits. A likely consequence of this expectation is that corporate policies for
such firms, such as cash holdings, will be driven at least as much by a plan to manage expected
operating deficits as by factors that induce excess holdings such as precaution against the
possibility of a negative shock.
The final characteristic to note is that the magnitude of negative cash flow has grown
substantially over time. Table 1, panel A reports average CF/assets for the ten deciles during four
subperiods: 1970–1979, 1980–1989, 1990–1999, and 2000–2015. All deciles report lower cash
flows over time, but within the lowest decile the change is most dramatic. In the 1970’s the average
firm in the lowest decile reported cash flow equal to -9% of assets. During the 2000–2015
subperiod, the average was -55% of assets. Put another way, firms in this decile burn an average
of almost 5% of assets per month even before accounting for capital expenditures.
Taken together, Figures 1 and 2, and Table 1 highlight three stylized facts about the
evolution of firms reporting negative cash flows: Negative cash flows are vastly more prevalent,
more persistent, and the magnitude of average negative cash flows within the lowest decile has
grown fivefold. Further, Figure 3 charts the distribution of cash flow for two subperiods at the
beginning and end of the sample period and reveals that not only has a mass of firms appeared in
the left tail in the most recent period, but the density in the center of the distribution has shifted
left as well. These findings motivate the inquiry into implications of these transformative shifts in
the distribution of cash flows for corporate policy.
11
In light of the drastic change in the distribution of cash flows, a related question is whether
other characteristics of negative cash flow firms have changed. Table 2 reports summary statistics
on a variety of firm level variables for firms with negative cash flows. Surprisingly, firm age,
measured as number of years as a public firm in Compustat, has increased. The average age of
negative cash flow firms in the 1970’s is 6.5 years, rising to 11 years in the 2000’s. Thus, the shift
in the distribution of cash flow is not due simply to the characteristics of newly listed firms.4 In
terms of size, loss firms have become smaller over time at the median in term of total assets, but
larger in terms of market capitalization. It follows that the market-to-book ratio is substantially
higher in recent years, averaging 1.16 in the 1970’s versus 2.70 in the 2000’s. Leverage has fallen
sharply, whether measured as book or market leverage, and R&D expenditures as a percentage of
assets have increased substantially. Growth patterns have also changed. In the 70’s, firms with
negative cash flows exhibit signs of distress, with declining revenues and declining headcount, on
average. In the 1990’s and 2000’s the opposite is true; negative cash flow firms are growing
rapidly on average, both in terms of revenues and employee growth. Finally, payout policies have
changed. In the 70’s, negative cash flow firms maintained a dividend yield above 1% in the year
of the loss. By the 2000’s, this figure had declined to less than 0.2%. Overall, these statistics
suggest that as negative cash flows have become more prevalent, persistent and larger, the
characteristics of these firms have changed as well. In recent years, firms with negative cash flows
are more commonly highly valued, growth firms. 5
4 Fama and French (2004) report that the profitability of newly listed firms has become increasingly left-skewed. 5 The industry concentration of negative cash flow firms has also changed over time. In the 2000’s, four industries (Drugs, Business Services, Chips, Medical Eq) account for over 50% of the observations of negative cash flow. By contrast, the top four industries in the 1970’s (Wholesale, Retail, Business Services, Machinery) account for only 26% of the observations.

12
3. Operating losses and cash holdings
Numerous studies have documented and offered explanations for the rise of corporate cash
holdings. Bates, Kahle, and Stulz (2009) measure the rise in cash holdings from 1980 to 2006 and
attribute the increase to precautionary motives rather than agency explanations. Specifically, they
point to changing firm characteristics including declines in working capital and capital
expenditures, and increases in cash flow volatility and R&D. Younger firms exhibit these
characteristics more strongly, and as they enter the economy, the optimal level of cash rises. In
Table 2 of their study, they report that the rise in cash holdings for firms with negative earnings
has been particularly large.
Table 3 reports that as the prevalence, persistence, and magnitude of negative operating
cash flows has increased, cash holdings have grown dramatically. The most dramatic increase in
cash balances occur within the lowest deciles of operating cash flow, and the point of divergence
in the mid 1980’s roughly corresponds with the beginning of the rapid growth of negative cash
flow firms in Figure 1. In 1970, cash holdings across the cash flow continuum are similar, and
even slightly lower for low cash flow firms. The lowest decile held 6.5% of assets in cash, while
the highest 8 deciles held an average of 8.4% of assets in cash. During the final year of the sample,
2015, average cash holdings within the lowest decile has grown to over 63% of assets, an increase
of 878% over 1970 levels. Cash holdings within the highest eight deciles has also grown, but
much more modestly, increasing by 101% over the sample period. Overall, these figures are
consistent with Bates et al. (2009), who document a tripling of cash ratios for negative net income
firms over 1980–2006. The results in Table 3 indicate that the growth has not retreated in the years
since 2006. The takeaway is that in order to understand the rise in average cash holdings generally,

13
more attention needs to be paid to the left side of the cash flow distribution where the rise is most
evident.
Figure 4 plots the rise in cash holdings. The middle (grey) curve reports the average
observed values for the entire sample and shows that average cash holdings have grown by 208%
over the sample period. However, once the sample is split into positive cash flow firms (dotted
curve) and negative cash flow firms (bottom black curve), it is clear that negative cash flow firms
are responsible for the majority of the overall growth in cash holdings observed within the full
sample. If negative cash flow firms are removed from the sample, the growth in cash holdings
over 1970-2015 is less than half as large as the growth in cash holdings for the full sample (95%
vs 208% increase). The growth in cash balances among negative cash flow firms is a striking
615%.
Three traditional explanations for holding excess cash include repatriation taxes, agency
problems, and precautionary motives. While the uptick on the right end of the cash flow
distribution could be caused by tax considerations, the massive rise on the left is within firms that
are not likely to be subject to an offshore cash holdup due to repatriation taxes, because (i) they
have negative earnings to offset the tax burden, and (ii) only 8.5% of our sample firms that report
operating losses also report foreign income. Similarly, firms on the left side of the distribution are
less prone to agency problems. In their study of the effect of agency problems on cash holdings,
Nikolev and Whited (2014) cite three factors commonly associated with agency concerns: size,
perquisite consumption, and limited managerial ownership. Negative cash flow firms are the least
susceptible on all three counts. They are, on average, the smallest firms in the economy, they are
subject to equity capital raising on a regular basis (as we later show), and are monitored more
14
closely than mature high cash flow firms. Finally, in unreported analysis we find that negative
cash flow firms have the highest levels of managerial ownership.
Since tax motives and agency concerns are mitigated for firms with negative cash flows,
we are left solely with precaution as an explanation for the 615% rise in cash holdings between
1970 and 2015. In recent years, there has been an increased focus on R&D expenditures in the
literature. In addition to the Bates, Kahle, and Stulz (2009) study cited earlier, Falato and Sim
(2015) use state-level changes in R&D tax credits to show that firms increase their cash-to-asset
ratios when their home state increases R&D tax credits. Begenau and Palazzo (2016) link the rise
in cross-sectional cash holdings with the propensity of newly public firms to hold more cash at
entry, particularly those with high R&D intensity. Pinkowitz, Stulz, and Williamson (2016) find
that differences in average cash balances between U.S. firms and their foreign counterparts are
driven by a small set of U.S. firms with very high R&D expenditures,
High R&D intensity could impact cash holdings through two (not mutually exclusive)
mechanisms. First, disrupting R&D programs is particularly costly (Brown and Peterson, 2011),
so the firm may hold extra cash as a precaution. Second, however, many R&D intensive firms
also report negative cash flow. R&D represents a cash expense that needs to be covered regardless
of the fact that it is R&D, and resultant cash holdings intended to cover near term operations are
more accurately described as a response to the first moment of cash flow rather than the second
moment.
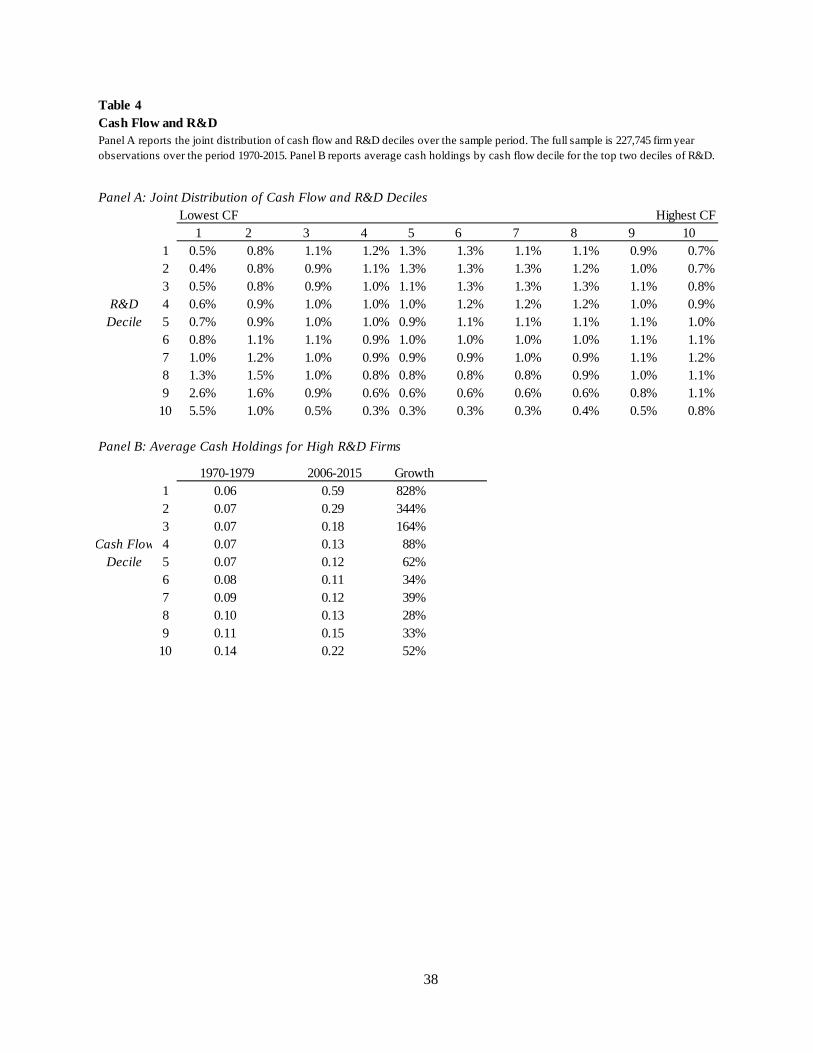
To determine whether the operating cash flow effect is simply an overlap with R&D
intensive firms, we analyze R&D and cash flow jointly in Table 4. Panel A reports the joint
distribution by decile for each measure. Not surprisingly, the largest mass is in the lowest cash
flow decile and highest R&D decile, but it only represents 5.5% of the sample. Extending to the
15
three lowest deciles of Cash Flow and the three highest deciles of R&D only comprises 15.9% of
the sample. Thus, although there is some overlap, it does not appear that the cash flow effect we
study is simply a proxy for the R&D effect studied by others.
Panel B takes a step further to examine cash holdings at high R&D firms, defined as those
within the top two deciles. The results indicate that growth in cash holdings for high R&D firms
is heavily dependent on the firm’s cash flow position. Specifically, for high R&D firms in cash
flow deciles 3-10, where cash flow is typically positive, cash holdings have grown an average of
52%. In contrast, average cash holdings for high R&D firms in the lowest cash flow decile have
grown 828%.
Figure 5 plots the relation between cash holdings and operating cash flow levels in each of
four subperiods. Similar to Figure 4, the most striking increase is observed within firms at the low
end of cash flow. However, Figure 5 reveals a more interesting observation, which is that the
relation between cash holdings and cash flow has become increasingly nonlinear over time.
Standard models of cash holdings, in which cash is specified as a linear function of cash flow (and
other characteristics), obscure this effect. Misspecification due to incorrect functional form of the
cash flow variable results in systematic prediction error. We discuss these implications in greater
detail in Section 5.2.
While the relation between cash holdings and cash flow was roughly flat in the 1970’s,
each subsequent decade has increased in convexity. Thus, it is not the case that the increase in
cash holdings in the time series is driven exclusively by the increasing prevalence and magnitude
of negative earnings; the persistence is also important. For any given level of cash flow to the left
of zero, the median firm in the 2000s holds more cash than does the median firm in the 1990s,
which holds more than the median firm in the 1980s. What has changed over time is the duration

16
of the negative cash flows. A firm reporting negative cash flow in 1970 is expecting to revert to
positive cash flows soon while a firm in the 2000s reporting the very same level of negative cash
flow is more likely to be expecting that level to persist for an extended period.
We conclude this section by examining the association between cash holdings and cash
flow realizations prior to, and subsequent to, the first year in which a firm reports negative cash
flow. This analysis is motivated by the DeAngelo, DeAngelo and Skinner (1992) finding that
dividend policies upon the realization of negative earnings respond to the future persistence of
negative earnings. We hypothesize that cash policies are similarly responsive to the firm’s
expectation about the persistence of negative cash flows.
Table 5 reports median cash holdings for four subgroups based on the persistence of future
negative cash flows and history of previous cash flows. The Persistent category consists of firms
that are entering a run of negative cash flow that is at least three years in duration. The Transitory
subgroup is made up of firms that return to positive cash flow the following year. New Firms are
those that are less than three years old. Fallen Angels are firms that reported at least five years of
positive cash flow before entering the negative cash flow sample. We find that firms entering a
run of persistently negative cash flow realizations hold substantially more cash than firms
experiencing a transitory negative cash flow shock. This is true not only for new firms, but also
those that have previously reported a long stretch of positive cash flows. These results are
consistent with the notion that the persistence of the negative cash flows matters for corporate
policies and that firms act in a manner that suggests they have some foresight about the persistence
of future cash flows.

17
4. Operating losses and external financing patterns
Our evidence indicates that firms with persistent operating losses build large cash balances
to fund these losses. However, it is unclear how they amass such large cash holdings. Although
firms with persistent losses exhibit large and ongoing liquidity needs, they are also likely to face
large frictions in the market for external funds. The uncertainty as to the duration of losses,
coupled with the possibility of information asymmetry raises the potential for agency problems if
the firm raises a substantial amount of funds in the capital market. These concerns are common
in the venture capital market and the literature identifies the staging of financing as one way to
mitigate financing frictions in venture capital funded firms [see, for example, Gompers (1995)].
Hertzel, Huson, and Parrino (2012) extend this logic to newly public firms and find evidence
consistent with staging in the timing and size of equity financing in IPO and initial follow-on
equity offerings. Such staging, however, can also be costly in that it forces firms to incur additional
issuance costs. In this section, we investigate the sources of external finance in our sample firms
and analyze the extent to which financing patterns have evolved as firms have increasingly become
characterized by persistent operating losses. In particular, we explore the extent to which the
financing of firms are consistent with the staging of capital infusions.
4.1. Sources of external finance
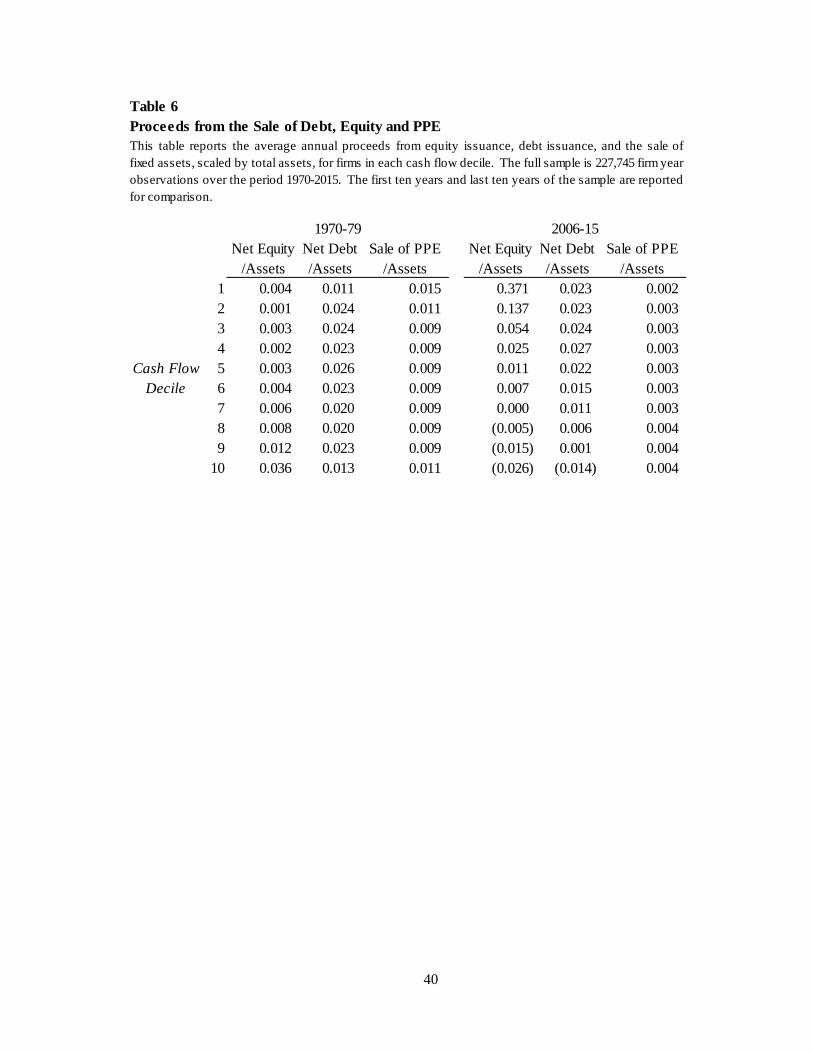
In Table 6, we investigate three mechanisms that firms can utilize to generate cash: equity
issues, debt issues, and the sale of fixed assets. We measure each of these sources, scaled by total
assets, and compare the average values within each cash flow decile at the beginning of the sample
and the end of the sample.

18
In the 1970’s, low cash flow firms raised little equity relative to high cash flow firms. On
average, a firm in the highest decile of cash flow raised over 10 times as much equity as a
percentage of assets compared to a firm in the lowest cash flow decile. For debt, the story is
different. Very low cash flow firms raised, on average, twice as much debt capital compared to
equity and firms in all deciles other than the highest raised more debt than equity on average. The
highest cash flow firms raise four times more equity capital than debt in the 1970’s. Additionally,
sale of fixed assets appears to be an important source of cash in the 70’s for firms with very low
cash flow. In the lowest decile of cash flow, sale of fixed assets is the largest source of cash,
generating 33% more cash than debt issues and about 3 times as much cash as equity issues.
Almost the exact opposite is true in recent years. Over the past decade, low cash flow firms
raise far more cash through equity than through either debt issues or the sale of fixed assets.
Relative to assets, equity issues raise, on average, 14 times the proceeds of debt issues and 162
times the proceeds from the sale of fixed assets in the lowest decile of cash flow. Meanwhile,
firms in the highest cash flow decile are now repurchasing both debt and equity, on average. These
stylized facts have had a marked impact on capital structure for negative cash flow firms, consistent
with the leverage summary statistics in Table 2.
4.2. Staging in debt financing through debt maturity structure
Although the staging of capital infusions is typically associated with the equity market,
Hertzel, Huson, and Parrino (2012) note that the use of short maturities in debt financing can also
be viewed as a form of staged financing. Companies with short maturity debt are forced to
renegotiate with creditors to roll over existing debt claims, thereby offering creditors the ability to

19
adjust the terms of debt contracts based on perceptions of company performance and growth
opportunities.
In Figure 6, we plot the median percentage of debt maturing in more than three years for
our sample companies. Consistent with the findings in Custodio et al. (2013), we find that debt
maturity significantly declines from the 1970’s to 2008. When we split the sample into positive
and negative cash flow firms, we find that the percentage of debt maturing in more than three years
is always substantially less for negative cash flow firms than for positive cash flow firms. In fact,
since 1997, the median negative cash flow firm has no debt maturing in more than three years.
Interestingly, although median debt maturity has increased markedly for positive cash flow firms
since 2008, the median percentage of debt maturing in greater than three years remains at 0% for
negative cash flow firms. These findings are consistent with negative cash flow firms using short
maturities to stage debt infusions. Moreover, our findings imply that a large portion (though not
all) of the systematic decrease in debt maturity documented in Custodio et al. (2013) is associated
with the increasing proportion of firms exhibiting negative cash flow.
4.3. Staging in equity financing
Figure 7 illustrates that over the same time period as the rise in cash holdings and overall
prevalence of operating loss firms, the characteristics of equity issuers have changed, particularly
with regards to cash flow. In the 1970’s and 1980’s, firms issuing equity are cash flow positive
on average, but in every year since 1989, the average equity issuer is burning cash. These results
are consistent with anecdotal evidence suggesting that it has become easier for negative cash flow
20
firms to raise equity capital in recent years and with the evidence in Fama and French (2004)
showing that earnings become progressively left skewed through time for newly listed firms. 6
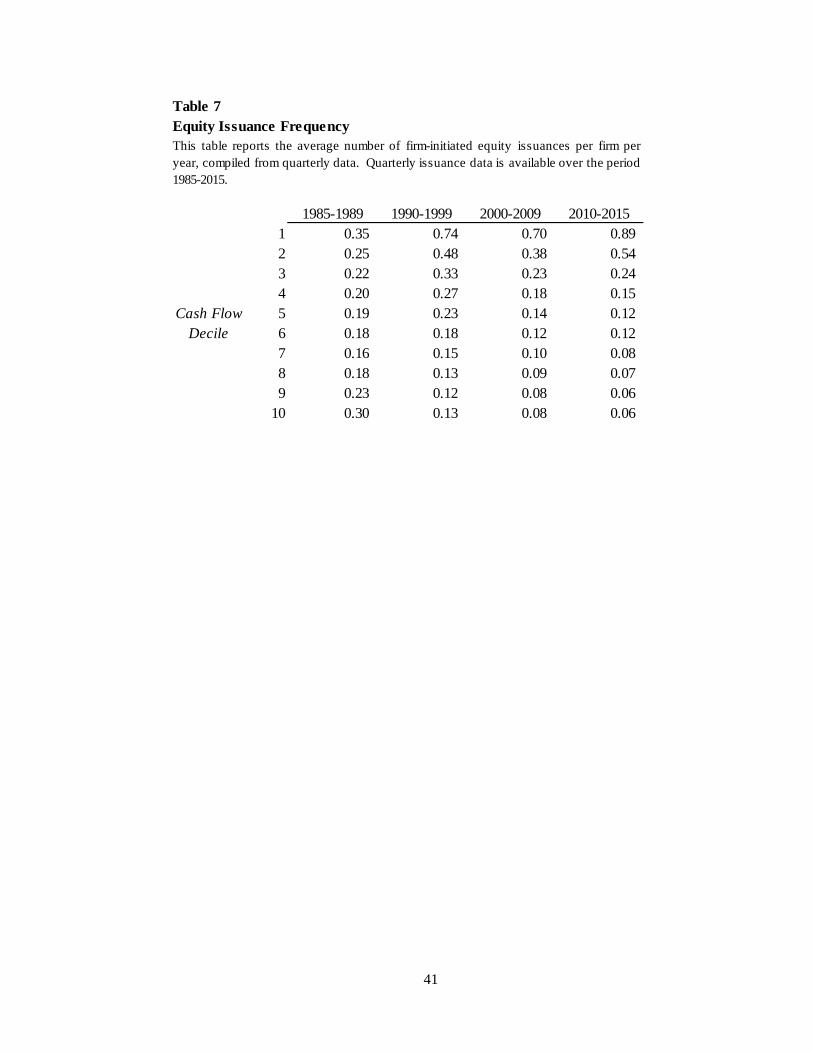
To further analyze the relation between cash flow and equity issuance frequencies, we
calculate the mean number of firm-initiated issuances per year for each cash flow decile based on
quarterly data. Table 7 reports the results of this analysis. While Figure 7 suggests that a large
portion of equity issuances are conducted by low cash flow firms, Table 7 demonstrates the
inverse: a large portion of low cash flow firms are equity issuers. In fact, between 2010 and 2015
the lowest decile of cash flow recorded 0.89 firm-initiated issuances per firm per year.
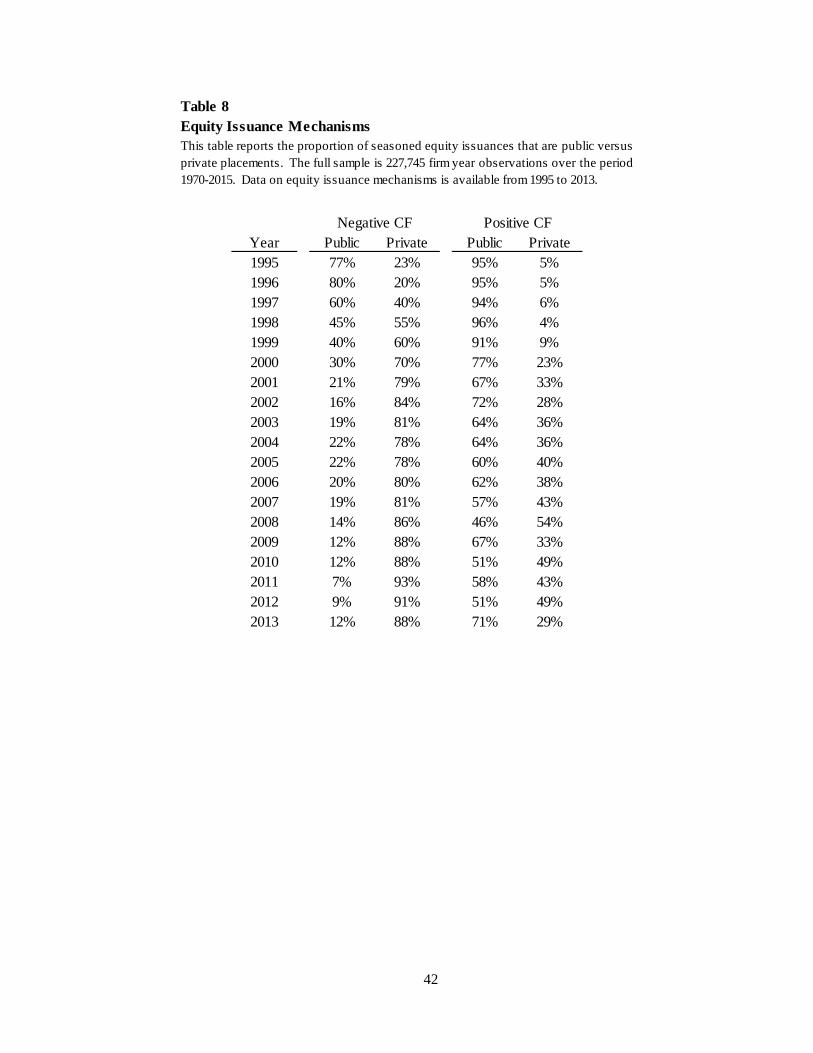
In addition to variation in issue frequencies, positive and negative cash flow firms also
differ in their choice of equity issuance mechanisms. Table 8 reports the proportion of firm-
initiated equity issues that are issued to the public via an SEO versus issued through a private
placement. Both positive and negative cash flow firms exhibit a positive trend in the use of private
placements over time, but for negative cash flows firms this mechanism makes up the vast majority
of equity issues. Over the last five years for which we have data (2009–2013), private placement
comprise over 88% of all issues in every year for negative cash flow firms, rising as high as 93%
in 2011. In addition, we find in untabulated results that of the few SEOs issued to the public, the
majority are shelf offerings.
The combination of increased issuance frequency and increased rate of private placements
among negative cash flow firms is consistent with the view that negative cash flow firms face
substantial frictions in the equity issuance market. These frictions are potentially mitigated by a
staging of capital infusions much like what is observed for private firms receiving venture capital
6 For example, Jay Ritter notes that "In the early Eighties, the major underwriters insisted on three years of profitability. Then it was one year, then it was a quarter. By the time of the Internet bubble, they were not even requiring profitability in the foreseeable future." (Rolling Stone, April 5, 2010).
21
financing. Frequent equity issues are puzzling in the presence of large fixed issuance costs in the
market for seasoned equity offerings. Our evidence suggests, however, that the staging of equity
capital infusions is increasingly done through the private placement mechanism in which fixed
issuance costs are much lower.
4.4. Equity issuance, cash savings, and runway
One of the primary features of precautionary cash savings from equity issuance is the
stockpiling of issue proceeds for future use. Following McLean (2011), we measure cash minus
issuance (CMI) as cash holdings at the end of the fiscal year minus total proceeds from equity
issuances during the year, where we define equity issuance as all firm-initiated equity issues.
When this variable carries a positive sign (CMI+), it indicates that the firm stockpiled all the equity
proceeds from issues it initiated in a given year. In Figure 8, we plot the time series of CMI+
proportions for equity issuers. Interestingly, it does not display the strong time trend that
characterizes average cash holdings. Over the sample period, the percentage of issuers that hold
all the proceeds in cash typically varies between 30% and 50% with a mean of 39%. The 1970’s
and 2000’s are in the higher segment of the range while the 1980’s and 90’s are in the lower portion
of the range. Although several studies report that precautionary motives driven by the volatility
of cash flows have risen greatly through the sample period, Figure 8 fails to detect a meaningful
trend in cash stockpiling behavior from equity issuance. We therefore posit that it must be the
case that there are additional factors influencing cash savings from equity issuance beyond these
standard notions of precaution. One such factor is the first moment of the cash flow distribution,
i.e., expected negative operating cash flows.

22
To investigate the size of the cash stockpile relative to the needs of the firm, we borrow a
metric from the venture capital industry, where negative cash flows for portfolio firms are
commonplace. Within venture-backed firms, a figure that often underlies decisions about cash
holdings and equity issuance is the monthly “burn rate,” which we define as operating cash flow
minus dividends and capital expenditures, divided by 12. Table 9 reports the median burn rate as
a percentage of total assets over time for equity issuers with negative cash flow. It is monotonically
increasing, rising from about 8% in the 1970’s to over 25% in the most recent period. In the
1970’s, the median level of cash holdings for negative cash flow equity issuers was less than 5%
of assets at year end. At 2015 burn rates, a stockpile of that size would be depleted before the ides
of March.
Cash holdings divided by the monthly burn rate is often referred to as “runway,” or in other
words, how many months a company could sustain current operations without an infusion of
external capital. Investors can limit runway by staging investment to mitigate overinvestment
problems. Hertzel et al. (2012) find that public market staging is particularly strong for firms with
high R&D and intangible assets. Additionally, they report that the median length of time before
returning to the capital market is 12 months. We extend their findings by analyzing runway length
over time to detect whether it has changed in ways similar to average cash holdings. Figure 9 plots
the median runway at the time of issuance for negative earnings firms over the sample period, and
shows that it has stayed within the same range for the last 30 years: between 6 and 18 months.
Many other firm characteristics have changed, such as those associated with precautionary cash
balances (e.g., R&D intensity and cash flow volatility), but these factors have not altered the
median runway of equity issuers in meaningful ways. For negative cash flow firms, having about

23
a year’s supply of cash is the norm. These firms aren’t saving more relative to their needs; their
operational needs have grown.
In a contemporaneous study, McLean and Palazzo (2016) analyze the timing and size of
equity issues and report evidence that firms issue not only to cover short-term liquidity squeezes,
but also to stockpile the proceeds as a precaution against adverse future market conditions. In light
of their finding that precautionary considerations can influence issuance size, it seems likely that
such considerations contribute to the time-series variation in the median runway we observe after
issuance in Figure 8. Nonetheless, the fact that runway exhibits virtually no time trend over recent
decades, while the average cash balances of issuers has exploded, points to operating needs, rather
than precaution, as the first order factor influencing the time series of cash balances.
5. Other Implications and Discussion
In this section, we discuss other implications of the findings presented in this study,
including (i) motivations for equity issuance, (ii) misspecification in models of cash holdings, and
(iii) the cash flow sensitivity of cash.
5.1 Motivations for Equity Issuance
Our findings have implications for the literature on motivations for equity issuance. Kim
and Weisbach (2008) show that cash holdings are the largest use of equity issuance proceeds for
an international sample of over 30,000 IPOs and SEOs between 1990 and 2003. McLean (2011)
extends this result by documenting that the percentage of equity issuance proceeds held as cash at
the end of the year of issuance has increased over time. Specifically, he reports that in the 1970’s
firms retained an average of $0.23 in cash for each dollar of issuance, but that this figure rises to
24
$0.60 for the period 2000–2007. In a separate study, DeAngelo, DeAngelo and Stulz (2010) report
that 62% of the SEO issuers in their sample would run out of cash by the end of the following year
without the issuance. They attribute SEO decisions primarily to a “lifecycle theory that predicts
young firms with high market-to-book (M/B) ratios and low operating cash flows sell stock to fund
investment.” Overall, our findings suggest that cash savings and lifecycle motives are not mutually
exclusive.
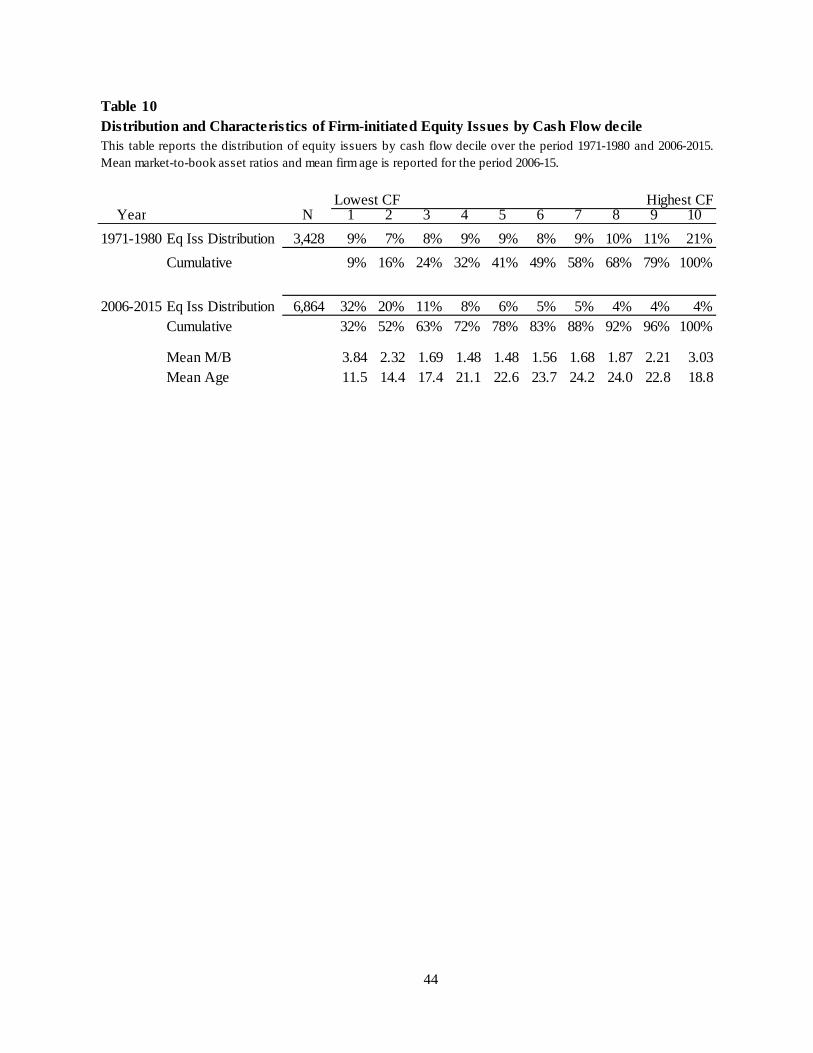
For example, under the lifecycle explanation we should observe a disproportionate number
of equity issuances at the low end of the cash flow spectrum, and this is exactly what we see in
recent years. Table 10 reports the distribution of firm-initiated equity issues for the first ten years
and the last ten years of the sample period to compare how the joint distribution of equity issues
and cash flow has changed over time. In the first ten years of the sample, equity issuance frequency
is skewed towards high cash flow firms. However, during the most recent period, from 2006–
2015, equity issuances are dominated by negative CF firms: the lowest decile of CF accounts for
32% of all equity issues and the lowest two deciles comprise 52% of all equity issues. Consistent
with the lifecycle theory, these two deciles have the youngest average age and high average M/B
ratios.
These results imply that, for firms with positive burn rates, which make up the majority of
equity issuers in recent years, it is possible to observe both a high savings rate in the year of
issuance (as in McLean (2011)), as well as a full depletion of pre-issuance cash (as in DeAngelo,
DeAngelo, and Stulz (2010)) during the following year. The issuances are topping up the stockpile
on a regular basis, but the firms are burning through the stockpile rapidly. A portion of the
stockpile is undoubtedly related to volatility-induced precaution, but the savings from issuance are
also driven by near term operating needs.
25
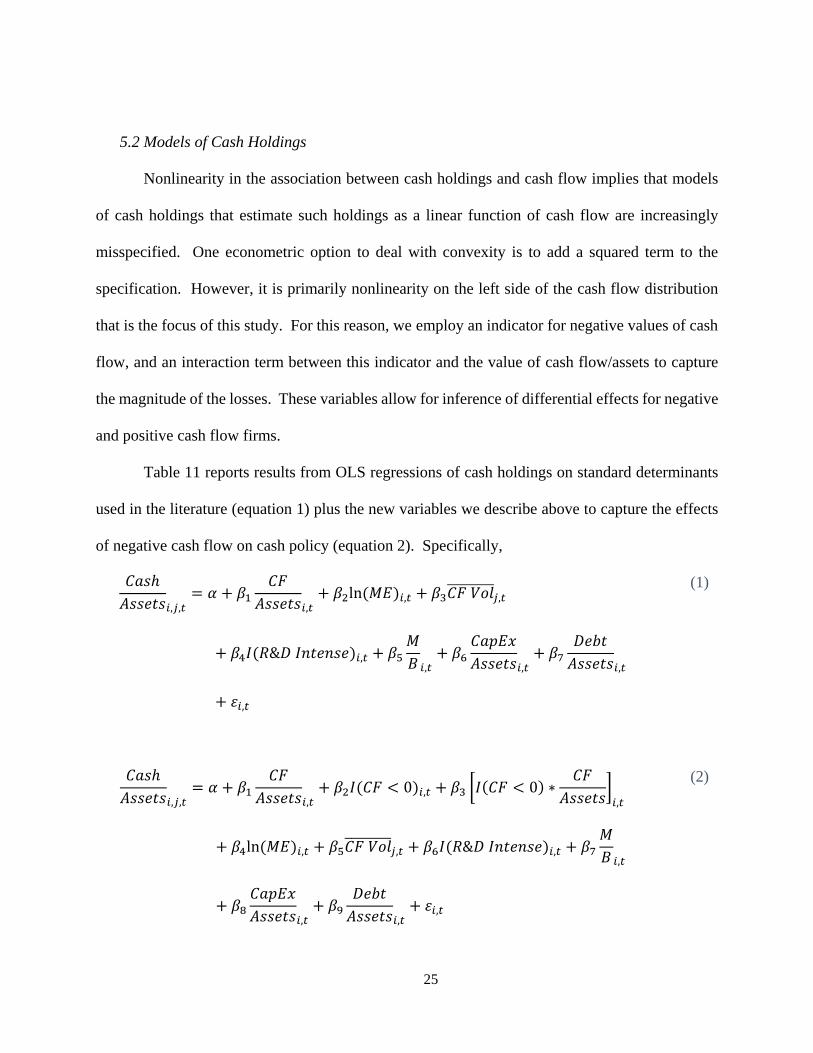
5.2 Models of Cash Holdings
Nonlinearity in the association between cash holdings and cash flow implies that models
of cash holdings that estimate such holdings as a linear function of cash flow are increasingly
misspecified. One econometric option to deal with convexity is to add a squared term to the
specification. However, it is primarily nonlinearity on the left side of the cash flow distribution
that is the focus of this study. For this reason, we employ an indicator for negative values of cash
flow, and an interaction term between this indicator and the value of cash flow/assets to capture
the magnitude of the losses. These variables allow for inference of differential effects for negative
and positive cash flow firms.
Table 11 reports results from OLS regressions of cash holdings on standard determinants
used in the literature (equation 1) plus the new variables we describe above to capture the effects
of negative cash flow on cash policy (equation 2). Specifically,
, , ,ln , ,
& ,, , ,
,
(1)
, , ,0 , 0 ∗
,
ln , , & ,,
, ,,
(2)

26
Both specifications control for factors related to precaution. Specifically, Size to capture
financing constraints, Industry Cash Flow Volatility to capture probability of a negative shock to
cash flow, an indicator of high R&D intensity and market-to-book ratio, both of which are related
to growth opportunities. To isolate the effect of precaution related to R&D from the cash flow
effect of R&D, we control for the existence of an R&D intensive investment agenda, but not the
level of R&D, which is an operating expense.
In column 1 of Table 11, Cash Flow carries a large negative coefficient, consistent with
several prior studies, but challenging to interpret in light of the nonlinearity between cash flow and
cash. Column 2 reveals the importance of including variables that capture operating needs. Both
the negative earnings indicator and the interaction term are highly significant determinants of
corporate cash holdings. Moreover, after controlling for operating losses, the coefficient on Cash
Flow reverses and is highly significant in the opposite direction. One implication is that the model
with the negative earnings variables should also improve model fit on the right side of the cash
flow distribution, where large positive cash flows are otherwise penalized in predictions of cash
holdings if cash flow is forced into a linear specification where it carries a negative coefficient.
A common variation of Equation (1) adds fixed effects to capture variation through time
and/or across industries. Columns 3 and 4 add year fixed effects to the models and columns 5 and
6 add year and industry fixed effects. Neither fixed effects specification picks up the impact of
negative cash flow firms. In both cases, the sign of the coefficient on Cash Flow in the linear
specification is negative and significant, whereas the specification with indicators for negative
cash flow flips the sign on the Cash Flow variable, implying that the relation between cash flow
and cash holdings depends greatly on the sign of the cash flows.
27
In Figures 10A and 10B, we detail the effects of functional form misspecification on
prediction error. Figure 10A compares average prediction error within each decile in the full
sample panel regressions. The comparison is between the standard model and the model that
captures nonlinearity by adding the negative indicator and interaction term as in (2). The
improvement is most evident in the tails of the distribution, which is not surprising due to the
convex relation. Overall, improvement is noted in seven of the ten deciles. These results are
consistent with the finding in Table 11 that the linear specification does not do a good job of
characterizing the relation between cash and cash flow.
Figure 10B compares three prediction models designed to account for time varying changes
in cash holdings. The first is the standard model with year fixed effects added, the second adds
both year and industry fixed effects. The third is the nonlinear model estimated in annual cross-
sections for each year of the sample to allow the coefficients to vary through time, similar to the
technique used in Harford et al. (2009) to predict leverage targets.
Both fixed effects models create larger prediction errors in most deciles, again particularly
in the tails. In the case of year fixed effects, the annual cross sections perform better in eight of
the 10 deciles, and when compared to the model with year and industry fixed effects the annual
cross sections perform better in every decile. The reason is intuitive: the lion’s share of the increase
in cash holdings has occurred in the tails of cash flow, but year fixed effects impact the predicted
value uniformly across the distribution. Overall, the results support the use of the indicator and
interaction terms and suggest caution in estimating fixed effects models in which movement in the
dependent variable is driven in part by an unspecified nonlinear component of one of the
explanatory variables.
28
Finally, in Table 12, we use the augmented cash holdings model to provide a ‘back of the
envelope’ estimate of the relative contribution of cash flow levels versus cash flow volatility to
predicted cash holdings for negative cash flow firms. The first two columns report coefficients
from estimating Equation (2) over five-year subperiods at the beginning (1970–1974) and end
(2011–2015) of the sample period: The third and fourth columns report the subperiod median
values of each variable for firms that report negative operating cash flow. The predicted
contribution to cash holdings, reported in the final two columns, is the product of the coefficients
and median observed values.
The effect of cash flow levels on predicted cash holdings is revealed by the cash flow
variables. In this example, the level variables contribute over twice as much to the increase in
predicted cash as the volatility variable. Thirty percent the increase in predicted cash/assets is
attributable to cash flow levels, while 13% of the increase is attributable to cash flow volatility.
5.3.Cash Flow Sensitivity of Cash
Our findings speak primarily to cash levels, but a related facet of corporate policy is how
cash changes with cash flow. Almeida, et al. (2004) measure the cash flow sensitivity of cash
holdings using a sample of manufacturing firms over 1971–2000. They find that cash is sensitive
to cash flow for financially constrained firms, but not for financially unconstrained firms. Such
findings are consistent with constrained firms saving cash out of cash flow in high cash flow states
and drawing down cash holdings when cash flow is negative.7
Our evidence implies, however, that in recent years, an increasing proportion of firms
exhibit negative cash flows and increase their cash holdings by stockpiling a portion of the funds
7 Also consistent with this view, Opler et al. (1999) find that operating losses are the primary explanation for large decreases in excess cash for their sample firm over the period 1971-1994.

29
raised through equity issues. Such behavior will attenuate the positive cash flow sensitivity of
cash documented in earlier periods and failing to control for the different sensitivity of negative
cash flow firms could have a material impact on measured cash-cash flow sensitivities.8
To investigate this possibility, Table 13 reports the results of tests in which we estimate the
cash flow sensitivity of cash over the first ten years of our sample period (1970–1979) and the last
ten years of the sample period (2006–2015). In columns (1) and (3), we constrain the cash flow
sensitivity of cash to be the same for firms with positive and negative cash flow, while in Columns
(2) and (4) we allow the sensitivity to differ. During the 1970–1979 subperiod, negative cash flow
firms are less common. Not surprisingly, therefore, we find in Column (2) that allowing
sensitivities to differ for negative earnings firms has only a modest impact on the estimated cash-
cash flow sensitivities of positive cash flow firms. In other words, pooling positive and negative
cash flow firms has little impact on inferences.
By contrast, Column 4 reveals that sensitivities for positive cash flow firms are
substantially higher once cash flow sensitivities are allowed to differ for positive and negative cash
flow firms in the 2006–2015 subperiod. The reason for this is clear. Negative cash flow firms
account for an increased proportion of the sample and these firms do not exhibit the same positive
sensitivity of cash-to-cash flow.
6. Conclusion
The population of U.S. firms is increasingly comprised of firms with persistent, large
negative cash flows. Such characteristics create ongoing liquidity needs that are directly tied to
current and near-term operations. Correspondingly, we find that cash balances have increased
8 This possibility is recognized by Almeida et al. (2004) and they show that the sensitivity they document is robust to exclusion of negative cash flow firms.
30
much more substantially in recent decades for these firms than for the rest of the population.
Perhaps most strikingly, we find that over the past four decades, average cash holdings have risen
by over 615% for firms with negative cash flow, as compared with 95% for firms with positive
cash flow. Our evidence thus supports the view that the recent growth in cash balances among
U.S. firms is not solely a reflection of increased precautionary demands due to cash flow volatility,
increased disincentives to repatriate foreign earnings, or increased agency problems. Rather, for
an increasing proportion of firms, higher cash balances reflect near-term operational needs under
an expectation of negative cash flows.
Additionally, we find that equity issuance activity is increasingly dominated by firms with
negative cash flows. Although firms are saving a substantial proportion of equity issuance
proceeds in cash, they are also burning cash at an unprecedented rate. As a result, there is virtually
no time trend in estimates of cash runway over the last 25 years. Since 2000, firms with negative
operating cash flows issue equity almost once every year and appear to mitigate the large fixed
costs of SEOs by primarily raising equity through private placements. Such behavior is consistent
with a supply-driven public market staging of finance of the type studied in Hertzel et al. (2012).
Our study is silent on the underlying forces that drive the increase in the proportion of
public firms with persistent operating losses. We conjecture that there are two broad categories of
explanation, which are not mutually exclusive. First, the time-series shift could be due to specific
financial innovations that have made it easier for early stage, unprofitable firms to obtain public
financing. For example, the rise of venture capital beginning in the 1980’s created an early-stage
funding source for firms with negative earnings and perhaps we are simply observing spillover in
the public markets from VC-backed firms. We note, however, we note that the dearth of IPOs in
recent years suggests that this is unlikely to be a complete explanation. Second, the trend towards
31
a greater number of firms with persistent losses could be driven by a shift in the underlying
economics of new economy firms, particularly with regards to growth patterns. Historically, firms
grew linearly with investment. Investments in property, plant, and equipment converted to sales
relatively quickly. Today, investment more often takes the form of R&D, organizational capital,
and other types of intangibles. There can be a long lag between investment in intangibles and
resultant sales; however, intangible assets can scale in ways that tangible assets cannot. Growth
can be quite rapid many years after the investment. The result is convexity in the relation between
sales and investment. One consequence of this is that it may appear that investment is less
responsive to Q in the time series, but this could simply be a function of the challenges inherent in
measuring intangible investment. We leave these topics to future research.

32
References
Bates, T. W., Kahle, K. M., & Stulz, R. M. 2009. Why do US firms hold so much more cash than they used to?. The Journal of Finance 64, 1985–2021.
Begenau, J., & Palazzo, B. 2015. Firm Selection and Corporate Cash Holdings. Working Paper.
Brown, J. R., Fazzari, S. M., & Petersen, B. C. 2009. Financing innovation and growth: Cash flow, external equity, and the 1990s R&D boom. The Journal of Finance 64, 151–185.
Brown, J. R., & Petersen, B. C. 2011. Cash holdings and R&D smoothing. Journal of Corporate Finance 17, 694–709.
Custodio, C., Ferreira, M.A., and Laureano, L. 2013. Why are US firms using more short-term debt? Ournal of Financial Economics 108, 182–212.
DeAngelo, H., DeAngelo, L., and Skinner, D. J. 1992. Dividends and losses. The Journal of Finance 47, 1837-1863.
DeAngelo, H., DeAngelo, L. and Skinner, D.J., 2004. Are dividends disappearing? Dividend concentration and the consolidation of earnings. Journal of Financial Economics 72, 425–456.
DeAngelo, H., DeAngelo, L., & Stulz, R. M. 2010. Seasoned equity offerings, market timing, and the corporate lifecycle. Journal of Financial Economics 95, 275–295.
Duchin, R. (2010). Cash holdings and corporate diversification. The Journal of Finance 65, 955–992.
Duchin, R., Gilbert, T., Harford, J., & Hrdlicka, C. M. 2015. Precautionary savings with risky assets: When cash is not cash. Working paper, University of Washington.
Falato, A., Kadyrzhanova, D., & Sim, J. 2013. Rising intangible capital, shrinking debt capacity, and the US corporate savings glut. Working paper.
Falato, A., & Sim, J. 2014. Why do innovative firms hold so much cash? Evidence from changes in state R&D tax credits. Working paper.
Fama, E.F., and French, K.R., 2004, New lists: Fundamentals and survival rates, Journal of Financial Economics 73, 229–269.
Foley, C. F., Hartzell, J. C., Titman, S., & Twite, G. 2007. Why do firms hold so much cash? A tax-based explanation. Journal of Financial Economics 86, 579–607.
Fresard, L. (2010). Financial strength and product market behavior: The real effects of corporate cash holdings. The Journal of Finance 65, 1097–1122.
Gompers, P. (1995). Optimal investment monitoring and the staging of venture capital. The Journal of Finance 50, 1461-1490.
33
Han, Seungjin, and Jiaping Qiu, 2007, Corporate precautionary cash holdings, Journal of Corporate Finance 13, 43–57.
Harford, J., Klasa, S., & Maxwell, W. F. 2014. Refinancing risk and cash holdings. The Journal of Finance, 69(3), 975–1012.
Harford, J., Klasa, S., & Walcott, N. 2009. Do firms have leverage targets? Evidence from acquisitions. Journal of Financial Economics, 93, 1–14.
Harford, Jarrad, Sattar Mansi, and William Maxwell, 2008, Corporate governance and firm cash holdings in the U.S., Journal of Financial Economics 87, 535–555.
Hertzel, M. G., Huson, M. R., & Parrino, R. 2012. Public market staging: The timing of capital infusions in newly public firms. Journal of Financial Economics 106, 72–90.
Huang, R., and J. R. Ritter, 2016, Corporate cash shortfalls and financing decisions. Working paper.
Kahle, K. and R. M. Stulz, 2016, Is the American public corporation in trouble? Working Paper, Ohio State University.
Keynes, John Maynard, 1936, The General Theory of Employment, Interest and Money (Harcourt Brace, London).
Klasa, S., Maxwell, W. F., & Ortiz-Molina, H. 2009. The strategic use of corporate cash holdings in collective bargaining with labor unions. Journal of Financial Economics 92, 421–442.
Kim, W., & Weisbach, M. S. 2008. Motivations for public equity offers: An international perspective. Journal of Financial Economics 87, 281–307.
Lins, K. V., Servaes, H., & Tufano, P., 2010. What drives corporate liquidity? An international survey of cash holdings and lines of credit. Journal of Financial Economics 98, 160–176.
McKeon, S.B., 2015. Employee Option Exercise and Equity Issuance Motives. SSRN Working paper.
McLean, R. D., 2011. Share issuance and cash savings. Journal of Financial Economics 99, 693–715.
McLean, R. D., Palazzo, B., 2016, Precautionary finance: Evidence from the timing and size of debt and equity issues. Working paper.
Opler, Tim, Lee Pinkowitz, Rene Stulz, and Rohan Williamson, 1999, The determinants and implications of corporate cash holdings, Journal of Financial Economics 52, 3–46.
Pinkowitz, L., Stulz, R.M., and R. Williamson, 2016, Do U.S. firms hold more cash than foreign firms? Review of Financial Studies 29, 309–348.
Walker, M. D., Wu, Q., & Zhao, J. 2015. SEOs When in Distress. Working paper.

34
Appendix A: Variable Descriptions
Cash Holdings CHE/ATEBITDA EBITDA/ATEBITDARD [EBITDA+XRD]/AT. XRD is coded to 0 if missing.
Operating Cash FlowOANCF.If missing, replaced by NI+DPC+TXDC+ESUBC+SPPIV+FOPO+FSRCO+WCAPC+APALCH+INVCH+RECCH
I(CF<0) Indicator that takes a value of 1 when Cash Flow<0, and 0 otherwiseCash Flow x I(CF<0) Interaction that takes the value of Cash Flow when Cash Flow<0, and 0 otherwiseSize Natural Log of AT
Industry CF Vol Standard deviation of cash flows is measured for each firm over up to 10 years (minimum 3). Values are averaged based on Fama French 48 industries annually.
R&D XRD. Coded to 0 if missing.I(R&D Intense) Indicator that takes a value of 1 when [XRD/AT]>0.02, and 0 otherwiseM/B (AT+MKTVAL-SEQ)/AT. MKTVAL is replaced by CSHO*PRCC_C if missing.Capital Expenditures CAPX. Coded to 0 if missing.Leverage (Book) [DLTT+DLC]/ATLeverage (Market) [DLTT+DLC]/(AT-SEQ+MKVALT)
Revenue Growth [REVt-REVt-1]/REVt-1
Employee Growth [EMPt-EMPt-1]/EMPt-1
Dividend Yield DVC/MKVALTFirm-initiatedEquity Issuance SSTK when [SSTK/MKTVAL]>0.03Net Equity Issuance SSTK-PRSTK
Net Debt Issuance [DLTT+DLC]t-[DLTT+DLC]t-1
Burn Rate -[Operating Cash Flow-DVC-CAPX]. Divided by 12 for monthly burn rate.Runway CHE/Monthly Burn Rate
All variable mnemonics are from Compustat, Industrial Annual FileAll ratios are winsorized at the 1st and 99th percentiles.

35
Table 1Evolution of cash flow by decile
CFdecile 1970-79 1980-89 1990-99 2000-15
1 (0.09) (0.25) (0.38) (0.55) 2 0.04 (0.02) (0.10) (0.14) 3 0.08 0.04 (0.02) (0.03) 4 0.10 0.08 0.02 0.02 5 0.12 0.11 0.04 0.05 6 0.14 0.13 0.07 0.07 7 0.16 0.16 0.09 0.10 8 0.19 0.20 0.12 0.12 9 0.23 0.25 0.16 0.16
10 0.35 0.43 0.24 0.25
This table reports mean values of CF/assets for deciles formedannually. The full sample is 227,745 firm year observations over theperiod 1970-2015. Values are averaged over all firm yearobservations within the decile during the specified subperiod.

36
Table 2Summary statistics for negative cash flow firms
1970's 1980's 1990's 2000'sN 2,847 8,247 15,819 19,352 Firm Age 6.5 7.7 7.7 11.0
6 5 5 8
Total Assets (2015$) 430 274 247 462109 33 42 54
Mkt Cap (2015$) 103 118 290 35932 25 55 69
M/B 1.16 1.86 2.73 2.700.92 1.23 1.73 1.70
Book Leverage 0.386 0.348 0.248 0.2240.382 0.328 0.180 0.095
Mkt Leverage 0.387 0.273 0.170 0.1390.403 0.246 0.093 0.047
R&D/TA 0.015 0.041 0.092 0.1460.000 0.000 0.007 0.061
Revenue Growth -1.7% 15.9% 35.1% 29.4%-3.8% -1.3% 10.4% 3.0%
Employee Growth -5.7% 0.7% 18.9% 7.7%-6.7% -4.6% 5.3% 0.0%
Dividend Yield 1.07% 0.47% 0.20% 0.17%0.0% 0.0% 0.0% 0.0%
This table reports mean (median) values for firms with negative cash flow. Allvariables are defined in the appendix. The full sample is 227,745 firm yearobservations over the period 1970-2015.

37
Table 3Evolution of average cash holdings by cash flow decile
1 2 3-101970 0.065 0.062 0.0841971 0.068 0.072 0.0931972 0.070 0.067 0.0931973 0.065 0.064 0.0831974 0.054 0.061 0.0751975 0.061 0.059 0.0951976 0.061 0.065 0.1001977 0.061 0.062 0.0931978 0.056 0.055 0.0891979 0.057 0.062 0.0821980 0.061 0.059 0.0991981 0.065 0.061 0.1111982 0.081 0.077 0.1141983 0.085 0.108 0.1491984 0.138 0.124 0.1161985 0.146 0.110 0.1231986 0.148 0.155 0.1351987 0.189 0.134 0.1301988 0.174 0.101 0.1221989 0.180 0.104 0.1221990 0.211 0.110 0.1161991 0.272 0.148 0.1301992 0.322 0.156 0.1341993 0.384 0.192 0.1391994 0.343 0.155 0.1291995 0.343 0.186 0.1421996 0.415 0.278 0.1511997 0.404 0.244 0.1531998 0.385 0.236 0.1401999 0.430 0.321 0.1522000 0.420 0.345 0.1612001 0.449 0.347 0.1612002 0.446 0.337 0.1652003 0.499 0.299 0.1842004 0.517 0.327 0.1942005 0.517 0.307 0.1942006 0.522 0.323 0.1912007 0.554 0.312 0.1912008 0.499 0.272 0.1742009 0.489 0.274 0.1902010 0.551 0.254 0.1912011 0.558 0.255 0.1772012 0.546 0.270 0.1722013 0.573 0.369 0.1772014 0.610 0.436 0.1752015 0.637 0.479 0.169
Growth: 1970 to 2015 878% 676% 101%
Deciles
This table reports mean values of cash/assets for cash flow deciles formed annually. The full sample is227,745 firm year observations over the period 1970-2015. Values are averaged over all firm yearobservations within each decile each year.
38
Table 4Cash Flow and R&D
Panel A: Joint Distribution of Cash Flow and R&D DecilesLowest CF Highest CF
1 2 3 4 5 6 7 8 9 101 0.5% 0.8% 1.1% 1.2% 1.3% 1.3% 1.1% 1.1% 0.9% 0.7%2 0.4% 0.8% 0.9% 1.1% 1.3% 1.3% 1.3% 1.2% 1.0% 0.7%3 0.5% 0.8% 0.9% 1.0% 1.1% 1.3% 1.3% 1.3% 1.1% 0.8%
R&D 4 0.6% 0.9% 1.0% 1.0% 1.0% 1.2% 1.2% 1.2% 1.0% 0.9%Decile 5 0.7% 0.9% 1.0% 1.0% 0.9% 1.1% 1.1% 1.1% 1.1% 1.0%
6 0.8% 1.1% 1.1% 0.9% 1.0% 1.0% 1.0% 1.0% 1.1% 1.1%7 1.0% 1.2% 1.0% 0.9% 0.9% 0.9% 1.0% 0.9% 1.1% 1.2%8 1.3% 1.5% 1.0% 0.8% 0.8% 0.8% 0.8% 0.9% 1.0% 1.1%9 2.6% 1.6% 0.9% 0.6% 0.6% 0.6% 0.6% 0.6% 0.8% 1.1%
10 5.5% 1.0% 0.5% 0.3% 0.3% 0.3% 0.3% 0.4% 0.5% 0.8%
Panel B: Average Cash Holdings for High R&D Firms
Growth1 828%2 344%3 164%
Cash Flow 4 88%Decile 5 62%
6 34%7 39%8 28%9 33%
10 52%
0.07 0.120.08 0.11
0.14 0.22
0.09 0.120.10 0.130.11 0.15
0.07 0.290.07 0.180.07 0.13
Panel A reports the joint distribution of cash flow and R&D deciles over the sample period. The full sample is 227,745 firm year observations over the period 1970-2015. Panel B reports average cash holdings by cash flow decile for the top two deciles of R&D.
1970-1979 2006-20150.06 0.59

39
Table 5Cash Holdings in First Year of Negative Cash Flow
New Firms Fallen Angels New Firms Fallen Angels1970s 0.040 0.046 0.044 0.0431980s 0.118 0.075 0.079 0.0541990s 0.385 0.358 0.128 0.0912000s 0.528 0.400 0.184 0.117
This table reports median values of cash/assets observed in the first yearthat the firm reports negative cash flow. The subgroups are formed for eachdecade based on the persistence of negative cash flows and cash flowhistory. The full sample is 227,745 firm year observations over the period1970-2015. The Persistent category is made up of firms that are entering a runof negative cash flow that is at least three years in duration. The Transitorysubgroup is made up of firms that return to positive cash flow the followingyear. New Firms are those that are less than three years old. Fallen Angelsare firms that reported at least five years of positive cash flow beforeentering the negative cash flow sample.
Persistent Transitory
40
Table 6Proceeds from the Sale of Debt, Equity and PPE
Net Equity/Assets
Net Debt/Assets
Sale of PPE/Assets
Net Equity/Assets
Net Debt/Assets
Sale of PPE/Assets
1 0.004 0.011 0.015 0.371 0.023 0.002 2 0.001 0.024 0.011 0.137 0.023 0.003 3 0.003 0.024 0.009 0.054 0.024 0.003 4 0.002 0.023 0.009 0.025 0.027 0.003
Cash Flow 5 0.003 0.026 0.009 0.011 0.022 0.003 Decile 6 0.004 0.023 0.009 0.007 0.015 0.003
7 0.006 0.020 0.009 0.000 0.011 0.003 8 0.008 0.020 0.009 (0.005) 0.006 0.004 9 0.012 0.023 0.009 (0.015) 0.001 0.004
10 0.036 0.013 0.011 (0.026) (0.014) 0.004
This table reports the average annual proceeds from equity issuance, debt issuance, and the sale offixed assets, scaled by total assets, for firms in each cash flow decile. The full sample is 227,745 firm year observations over the period 1970-2015. The first ten years and last ten years of the sample are reportedfor comparison.
1970-79 2006-15
41
Table 7Equity Issuance Frequency
1985-1989 1990-1999 2000-2009 2010-20151 0.35 0.74 0.70 0.89 2 0.25 0.48 0.38 0.54 3 0.22 0.33 0.23 0.24 4 0.20 0.27 0.18 0.15
Cash Flow 5 0.19 0.23 0.14 0.12 Decile 6 0.18 0.18 0.12 0.12
7 0.16 0.15 0.10 0.08 8 0.18 0.13 0.09 0.07 9 0.23 0.12 0.08 0.06
10 0.30 0.13 0.08 0.06
This table reports the average number of firm-initiated equity issuances per firm peryear, compiled from quarterly data. Quarterly issuance data is available over the period1985-2015.
42
Table 8Equity Issuance Mechanisms
Year Public Private Public Private1995 77% 23% 95% 5%1996 80% 20% 95% 5%1997 60% 40% 94% 6%1998 45% 55% 96% 4%1999 40% 60% 91% 9%2000 30% 70% 77% 23%2001 21% 79% 67% 33%2002 16% 84% 72% 28%2003 19% 81% 64% 36%2004 22% 78% 64% 36%2005 22% 78% 60% 40%2006 20% 80% 62% 38%2007 19% 81% 57% 43%2008 14% 86% 46% 54%2009 12% 88% 67% 33%2010 12% 88% 51% 49%2011 7% 93% 58% 43%2012 9% 91% 51% 49%2013 12% 88% 71% 29%
Negative CF
This table reports the proportion of seasoned equity issuances that are public versusprivate placements. The full sample is 227,745 firm year observations over the period1970-2015. Data on equity issuance mechanisms is available from 1995 to 2013.
Positive CF

43
Table 9Annual Burn Rate for Equity Issuers
Period % burned1971-75 8.2%1976-80 7.7%1981-85 13.1%1986-90 12.5%1991-95 13.5%1996-2000 18.8%2001-05 21.5%2006-10 23.2%2011-15 25.9%
This table reports the percentage of assets depleted annually by equity issuerswith positive burn rates. Burn rate is defined as [-Operating Cash Flow+dividends+capital expenditures]. The full sample is227,745 firm year observations over the period 1970-2015.
44
Table 10Distribution and Characteristics of Firm-initiated Equity Issues by Cash Flow decile
Lowest CF Highest CFYear N 1 2 3 4 5 6 7 8 9 10
1971-1980 Eq Iss Distribution 3,428 9% 7% 8% 9% 9% 8% 9% 10% 11% 21%
Cumulative 9% 16% 24% 32% 41% 49% 58% 68% 79% 100%
2006-2015 Eq Iss Distribution 6,864 32% 20% 11% 8% 6% 5% 5% 4% 4% 4%Cumulative 32% 52% 63% 72% 78% 83% 88% 92% 96% 100%
Mean M/B 3.84 2.32 1.69 1.48 1.48 1.56 1.68 1.87 2.21 3.03Mean Age 11.5 14.4 17.4 21.1 22.6 23.7 24.2 24.0 22.8 18.8
This table reports the distribution of equity issuers by cash flow decile over the period 1971-1980 and 2006-2015.Mean market-to-book asset ratios and mean firm age is reported for the period 2006-15.

45
Table 11Determinants of cash holdings
(1) (2) (3) (4) (5) (6)Cash Flow -0.134 *** 0.117 *** -0.131 *** 0.132 *** -0.116 *** 0.122 ***
(<0.001) (<0.001) (<0.001) (<0.001) (<0.001) (<0.001)
I(CF<0) 0.040 *** 0.039 *** 0.036 ***(<0.001) (<0.001) (<0.001)
CF x I(CF<0) -0.331 *** -0.343 *** -0.311 ***(<0.001) (<0.001) (<0.001)
Size -0.007 *** -0.004 *** -0.007 *** -0.005 *** -0.008 *** -0.006 ***(<0.001) (<0.001) (<0.001) (<0.001) (<0.001) (<0.001)
Industry CF Vol 0.545 *** 0.529 *** 0.553 *** 0.516 *** 0.224 *** 0.208 ***(<0.001) (<0.001) (<0.001) (<0.001) (<0.001) (<0.001)
I(R&D Intense) 0.070 *** 0.065 *** 0.068 *** 0.064 *** 0.064 *** 0.061 ***(<0.001) (<0.001) (<0.001) (<0.001) (<0.001) (<0.001)
M/B 0.031 *** 0.027 *** 0.031 *** 0.027 *** 0.028 *** 0.024 ***(<0.001) (<0.001) (<0.001) (<0.001) (<0.001) (<0.001)
Cap Ex -0.201 *** -0.244 *** -0.197 *** -0.233 *** -0.231 *** -0.264 ***(<0.001) (<0.001) (<0.001) (<0.001) (<0.001) (<0.001)
Leverage -0.270 *** -0.263 *** -0.272 *** -0.264 *** -0.274 *** -0.267 ***(<0.001) (<0.001) (<0.001) (<0.001) (<0.001) (<0.001)
Constant 0.154 *** 0.116 *** 0.156 *** 0.121 *** 0.167 *** 0.149 ***(<0.001) (<0.001) (<0.001) (<0.001) (<0.001) (<0.001)
Fixed Effects None None Year Year
N 175,407 175,407 175,407 175,407 175,407 175,407 R2 0.408 0.421 0.412 0.425 0.443 0.453
Year, Industry Year, Industry
This table reports results from OLS regressions of cash holdings (cash/assets) on various determinants. The full sampleis 227,745 firm year observations over the period 1970-2015. Columns 1, 3, and 5 use a linear specification for cash flowwhile columns 2, 4, and 6 allow for non-linearity when earnings are negative by adding an indicator of negative earningsand an interaction that takes the value of CF/assets when it is negative and zero otherwise. Variables are defined in theappendix. Standard errors are clustered by firm and year. *, **, and *** indicate significance at the 10%, 5% and 1%levels respectively.

46
Table 12Numerical example: What drives growth in cash holdings in low cash flow firms?
1970-1974 2011-2015 1970-1974 2011-2015 (1) (2)Cash Flow 0.118 0.322 -0.061 -0.159 (0.007) (0.051) I(CF<0) 0.013 0.084 1 1 0.013 0.084 Cash Flow x I(CF<0) -0.160 -0.386 -0.061 -0.159 0.010 0.062 Industry CF Vol 0.295 0.274 0.029 0.157 0.009 0.043 Size -0.004 -0.001 2.153 4.340 (0.009) (0.006) R&D -0.363 0.640 0.000 0.080 - 0.051 M/B 0.023 0.022 0.926 1.900 0.021 0.042 Cap Ex -0.078 -0.457 0.042 0.014 (0.003) (0.006) Leverage -0.142 -0.243 0.397 0.085 (0.056) (0.021) Constant 0.088 0.130 0.088 0.130
Increase %Predicted cash 0.064 0.327 0.263
Contribution from level of cash flow 0.015 0.094 0.079 30%Contribution from cash flow volatility 0.009 0.043 0.034 13%
This table reports predicted cash holdings for the median firm characteristics from the lowest decile of CF/assets during theperiods (i) 1970-74 and (ii) 2011-2015 using coefficients from OLS regressions of cash holdings (cash/assets) on variousdeterminants defined in the appendix. The full sample is 227,745 firm year observations over the period 1970-2015.Predicted cash is the product of the coefficients and median values for each respective subperiod.
Coefficients Predicted CashMedian Values
CF<0

47
Table 13Cash Flow Sensitivity of Cash
1 2 3 4 5 6All All All All
Cash Flow 0.085 *** 0.124 *** 0.082 *** 0.186 *** 0.056 *** 0.278 ***0.000 0.000 0.000 0.000 0.000 0.000
I(CF<0) 0.005 *** -0.004(0.002) (0.122)
CF x I(CF<0) -0.140 *** -0.147 ***0.000 0.000
M/B -0.004 *** -0.005 *** 0.001 -0.001 0.004 *** -0.001(0.010) (0.003) (0.140) (0.334) (0.001) (0.487)
ln(Assets) 0.000 0.001 -0.002 *** -0.002 *** 0.004 ** (0.008) ***(0.554) (0.144) 0.000 0.000 (0.020) 0.000
Constant -0.01 ** -0.019 *** 0.002 -0.004 -0.035 *** 0.013(0.041) 0.000 (0.731) (0.399) 0.000 (0.108)
N 26,870 26,870 32,729 32,729 5,195 4,060 R2 0.038 0.049 0.029 0.037 0.017 0.071
CF<0 CF>0
This table reports results from OLS regressions estimated over the 1st 10 years and last 10 years of thesample (1970-79 and 2006-2015). Columns 1 and 3 report change in cash/assets regressed on cash flow and aconstant. Columns 2 and 4 allow for non-linearity when cash flow are negative by adding an indicator ofnegative earnings and an interaction that takes the value of CF/assets when it is negative and zerootherwise. Columns 5 and 6 constrain the sample to the lowest three deciles of size (constrained firms) andestimate the model separately for positive and negative cash flow firms. Variables are defined in theappendix. Standard errors are clustered by firm and year. *, **, and *** indicate significance at the 10%, 5% and 1% levels respectively.
1970-79 2006-2015
Size Dec<=3 Size Dec<=3

48
Figure 1. Prevalence of Negative Cash Flow. This chart reports the percentage of Compustat listed firms that report negative operating cash flow. –OCF is negative operating cash flow, -OCFRD is negative operating cash flow after adding back R&D expense. Detailed variable descriptions are available in the appendix.
0%
5%
10%
15%
20%
25%
30%
35%
40%
45%
1960
1962
1964
1966
1968
1970
1972
1974
1976
1978
1980
1982
1984
1986
1988
1990
1992
1994
1996
1998
2000
2002
2004
2006
2008
2010
2012
2014
% of firm
s reporting negative cash flow
‐OCF ‐OCFRD

49
Figure 2. Persistence of Negative Cash Flow. Panel A: Proportion of Negative cash flow firms that report positive cash flow in the following year. Panel B: Average number of consecutive years of negative cash flow for firms that report negative cash flow.
0%
10%
20%
30%
40%
50%
60%
70%
80%
90%
1971
1973
1975
1977
1979
1981
1983
1985
1987
1989
1991
1993
1995
1997
1999
2001
2003
2005
2007
2009
2011
2013
% of negative cash flow firms that rep
ort +CF in
following year
1.0
1.5
2.0
2.5
3.0
3.5
4.0
1970
1972
1974
1976
1978
1980
1982
1984
1986
1988
1990
1992
1994
1996
1998
2000
2002
2004
2006
2008
2010
2012
2014
Years of Negative Cash Flow
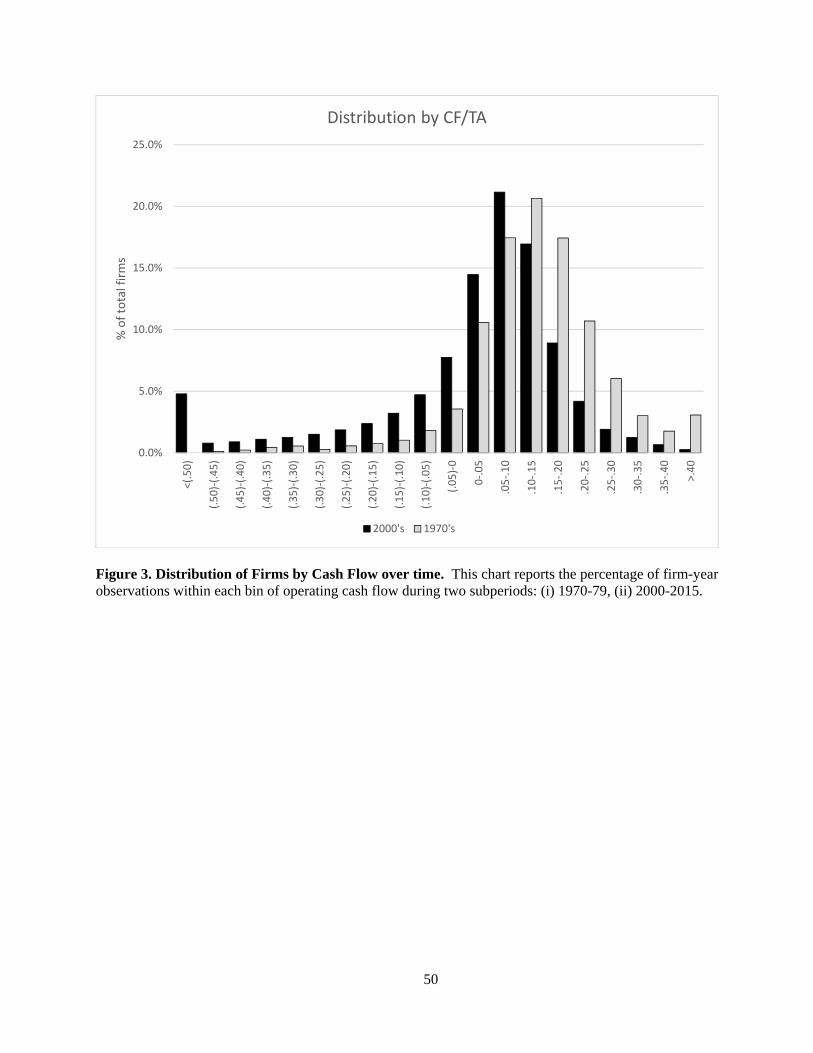
50
Figure 3. Distribution of Firms by Cash Flow over time. This chart reports the percentage of firm-year observations within each bin of operating cash flow during two subperiods: (i) 1970-79, (ii) 2000-2015.
0.0%
5.0%
10.0%
15.0%
20.0%
25.0%
<(.50)
(.50)‐(.45)
(.45)‐(.40)
(.40)‐(.35)
(.35)‐(.30)
(.30)‐(.25)
(.25)‐(.20)
(.20)‐(.15)
(.15)‐(.10)
(.10)‐(.05)
(.05)‐0
0‐.05
.05‐.10
.10‐.15
.15‐.20
.20‐.25
.25‐.30
.30‐.35
.35‐.40
>.40
% of total firms
Distribution by CF/TA
2000's 1970's
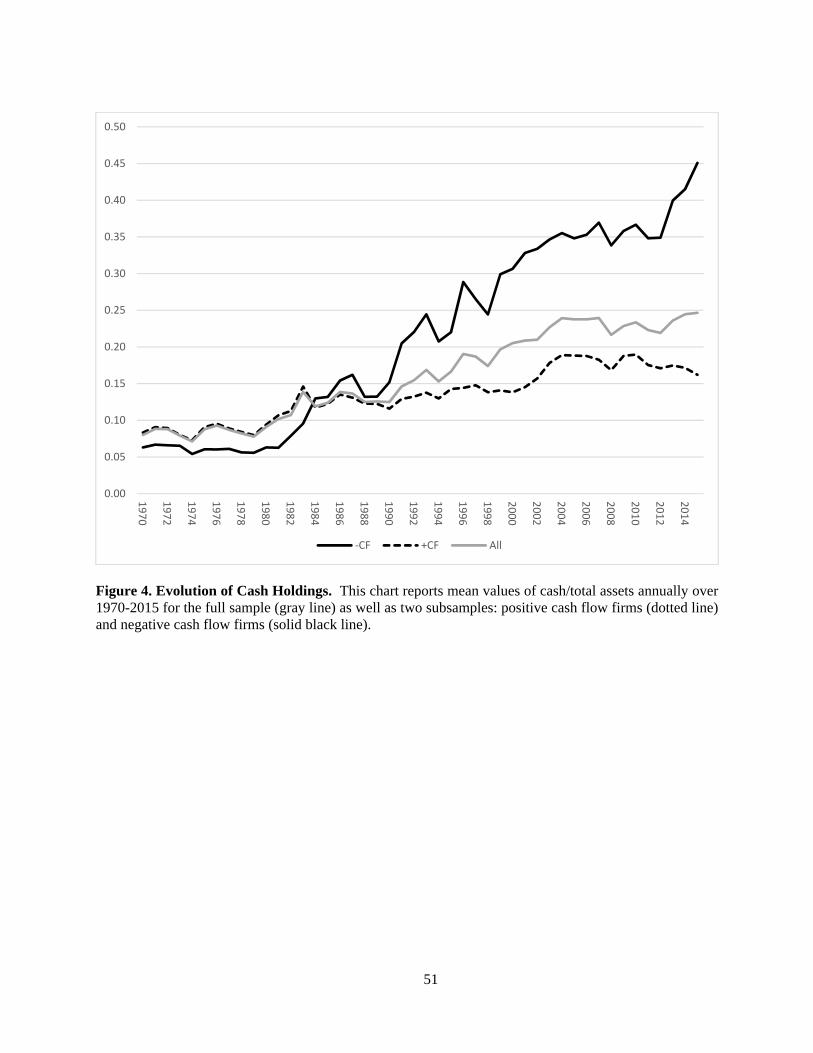
51
Figure 4. Evolution of Cash Holdings. This chart reports mean values of cash/total assets annually over 1970-2015 for the full sample (gray line) as well as two subsamples: positive cash flow firms (dotted line) and negative cash flow firms (solid black line).
0.00
0.05
0.10
0.15
0.20
0.25
0.30
0.35
0.40
0.45
0.50
1970
1972
1974
1976
1978
1980
1982
1984
1986
1988
1990
1992
1994
1996
1998
2000
2002
2004
2006
2008
2010
2012
2014
‐CF +CF All
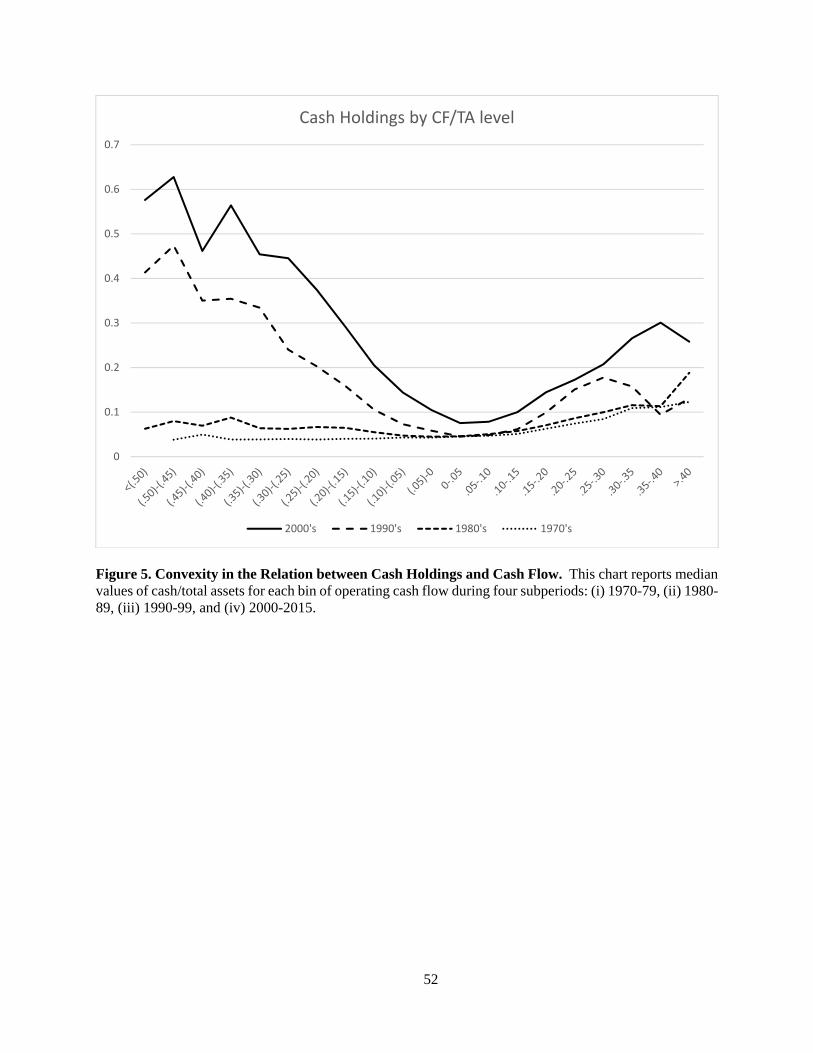
52
Figure 5. Convexity in the Relation between Cash Holdings and Cash Flow. This chart reports median values of cash/total assets for each bin of operating cash flow during four subperiods: (i) 1970-79, (ii) 1980-89, (iii) 1990-99, and (iv) 2000-2015.
0
0.1
0.2
0.3
0.4
0.5
0.6
0.7
Cash Holdings by CF/TA level
2000's 1990's 1980's 1970's
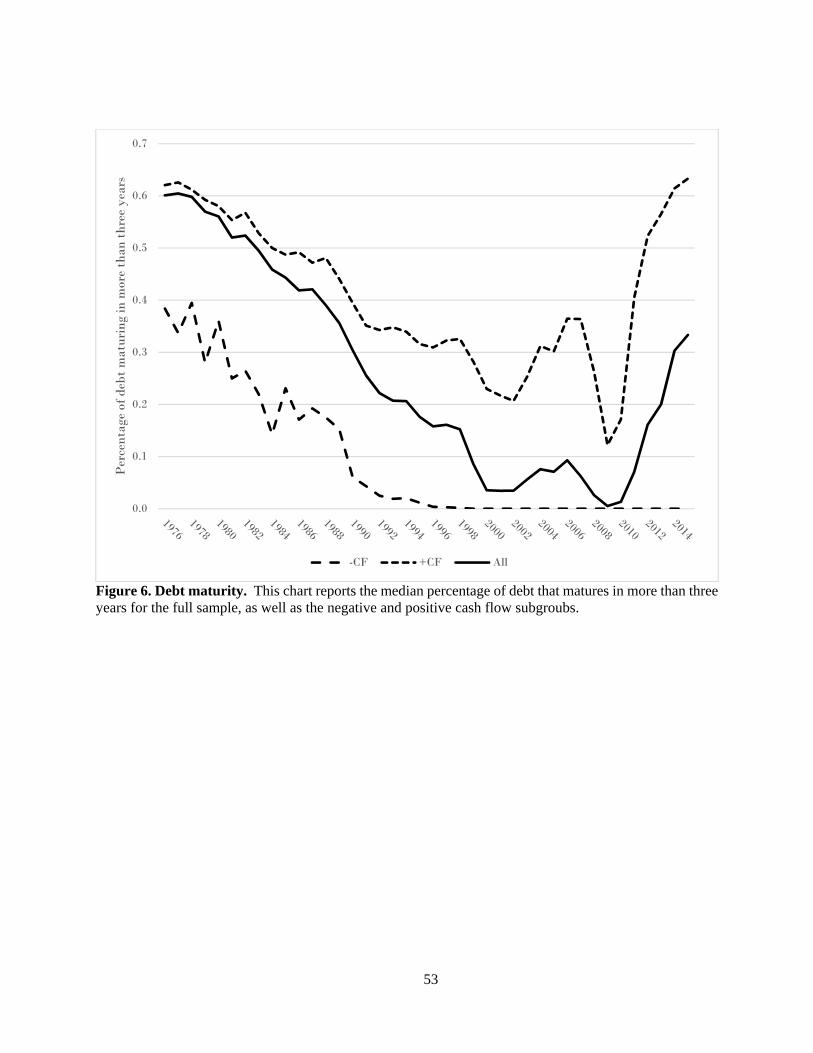
53
Figure 6. Debt maturity. This chart reports the median percentage of debt that matures in more than three years for the full sample, as well as the negative and positive cash flow subgroubs.
0.0
0.1
0.2
0.3
0.4
0.5
0.6
0.7
Per
cent
age
of d
ebt
mat
urin
g in
mor
e th
an t
hree
yea
rs
-CF +CF All
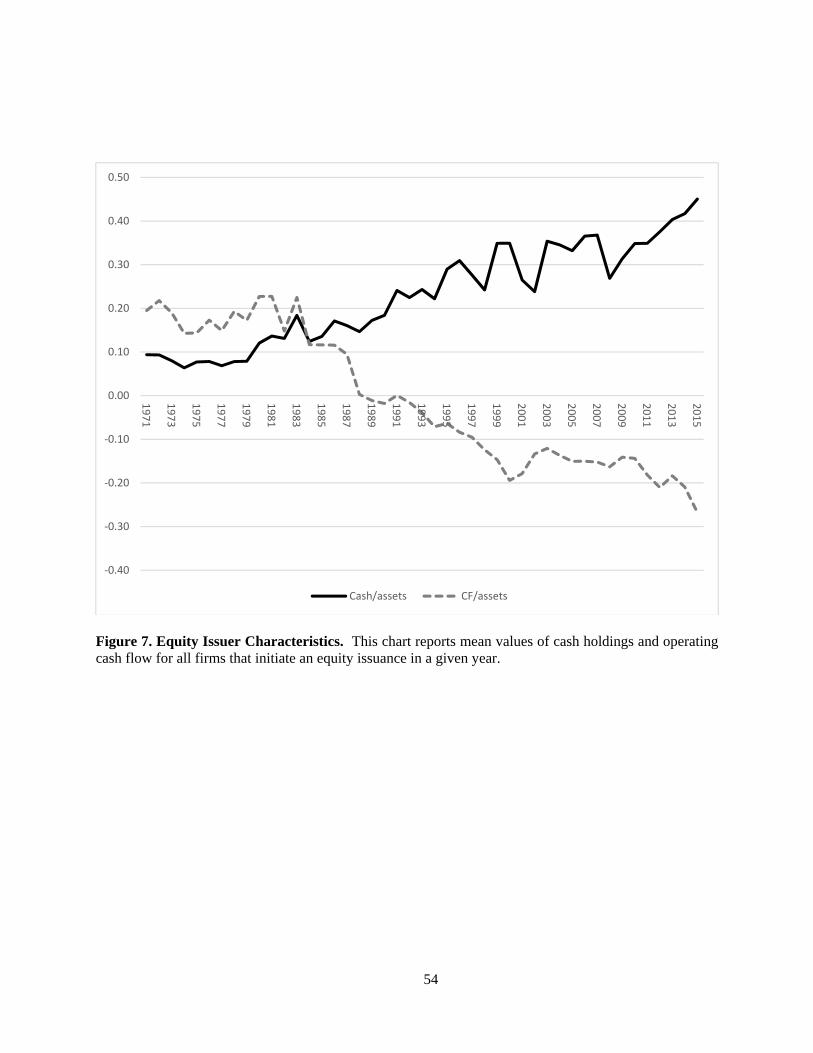
54
Figure 7. Equity Issuer Characteristics. This chart reports mean values of cash holdings and operating cash flow for all firms that initiate an equity issuance in a given year.
‐0.40
‐0.30
‐0.20
‐0.10
0.00
0.10
0.20
0.30
0.40
0.50
1971
1973
1975
1977
1979
1981
1983
1985
1987
1989
1991
1993
1995
1997
1999
2001
2003
2005
2007
2009
2011
2013
2015
Cash/assets CF/assets

55
Figure 8. Cash Minus Issuance. This chart reports the proportion of equity issuers that held all proceeds in cash at the end of the year during which the issuance occurs.
0%
10%
20%
30%
40%
50%
60%
70%
1971
1973
1975
1977
1979
1981
1983
1985
1987
1989
1991
1993
1995
1997
1999
2001
2003
2005
2007
2009
2011
2013
2015
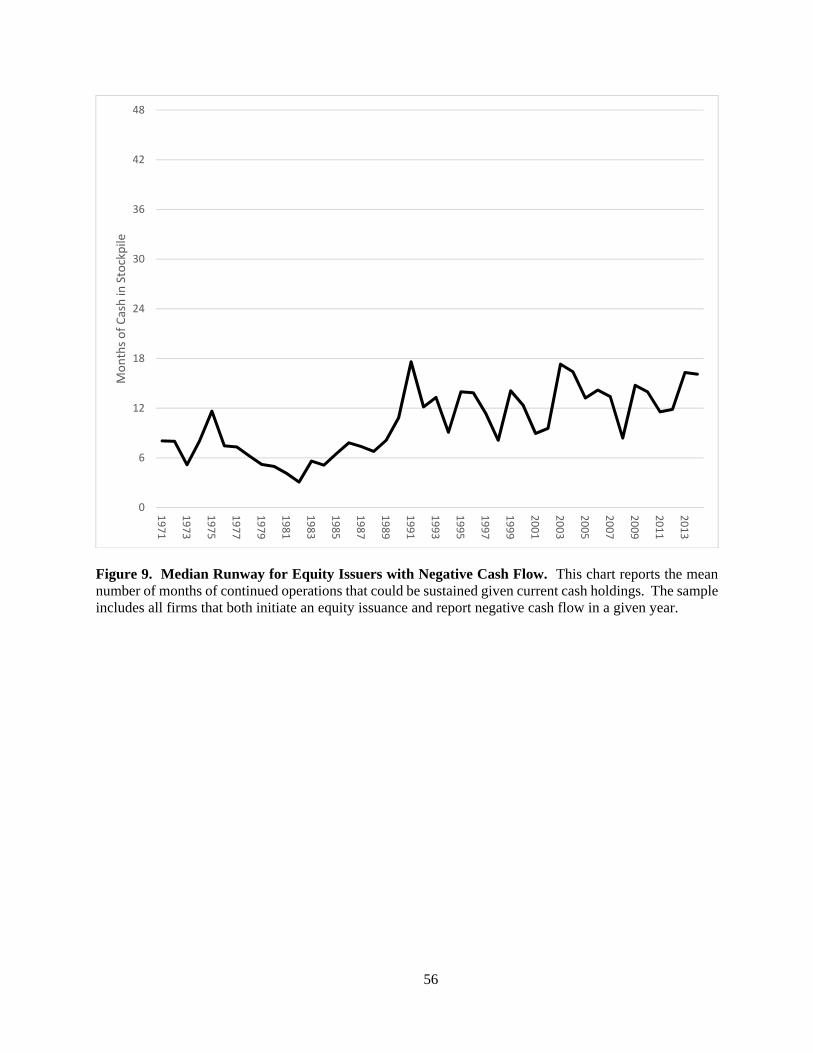
56
Figure 9. Median Runway for Equity Issuers with Negative Cash Flow. This chart reports the mean number of months of continued operations that could be sustained given current cash holdings. The sample includes all firms that both initiate an equity issuance and report negative cash flow in a given year.
0
6
12
18
24
30
36
42
48
1971
1973
1975
1977
1979
1981
1983
1985
1987
1989
1991
1993
1995
1997
1999
2001
2003
2005
2007
2009
2011
2013
Months of Cash in Stockpile

57
Figure 10. Prediction Error in Models of Cash Holdings. Panel A reports average prediction error from a standard model of cash/assets including cash flow, size, leverage, R&D intensity, industry cash flow volatility, capital expenditures and market-to-book ratio. The second series in panel A adds an indicator variable for negative cash flow and an interaction between negative cash flow and level of cash flow. Panel B reports prediction error from estimates using (i) the standard model with year fixed effects, (ii) year and industry fixed effects, and (iii) the negative earnings model from panel A estimated on annual cross sections. Both panels report average error sorted by cash flow decile where 1 is the lowest level of cash flow and 10 is the highest.
‐0.050
‐0.040
‐0.030
‐0.020
‐0.010
0.000
0.010
0.020
1 2 3 4 5 6 7 8 9 10
Average Prediction Error
Standard model Neg CF model
‐0.050
‐0.040
‐0.030
‐0.020
‐0.010
0.000
0.010
0.020
0.030
1 2 3 4 5 6 7 8 9 10
Average Prediction Error
Year FE Year & Ind FE Neg CF model ‐ Annual