Embed Size (px)
Citation preview

The HealthcareSource User ConferenceNovember 6-9, 2016JW MARRIOTT • WASHINGTON, DC
TALENT ACQUISITIONMAKING THE BUSINESS CASE FOR INCREASED RECRUITMENT INVESTMENTDavid Szary,Sr. Vice President and General Manager, Recruiting ServicesLean Human Capital by HealthcareSource

JOIN THE CONVERSATION
• Be sure to tweet and post what you’ve learned in this presentation!- Twitter: @quality_talent - Instagram: @healthcaresource- #TalentSymposium16
• Attendees that are active on social media will be entered to win FUN prizes during the conference!

DAVID SZARY• “Fell” into recruiting in 1989!
• First half of career, recruited (and managed teams) in “high tech” industry for a publicly-held “high-growth” IT Service provider
• In 1997, founded The RIO Group (www.riogrp.com) & The Recruiter Academy (www.recruiteracademy.com). In 2009 founded Lean Human Capital (www.leanhumancapital.com), combining The Recruiter Academy educational solution with analytic and process optimization best practices
• Has worked with over 10,000 recruiters from thousands of companies across the entire United States, Canada, South America, Europe, Asia and the Middle East, including some of the most respected organizations in the world
• Unique opportunity to work with recruiters and recruitment organizations performing in all types of market conditions within all major industries
• Creator of the Healthcare Recruitment Metrics Benchmark Study, with over 800 hospitals from over 200 different organizations participating over the last six years!

FOUNDATION OF OUR RESEARCH/INTELLIGENCE
Lean Human Capital Healthcare Community Recruitment Metrics Benchmark Study
800+ hospitals have participated in our Healthcare Recruitment Metrics Benchmark Study over the last 7 years.

COMMUNITY | BENCHMARK STUDY PARTICIPANTS2009 - 2016

AGENDA
•Market Conditions •Mixed Signals?•Making a Business Case for Increase Investment in Recruitment

MARKET CONDITIONS

MARKET DRIVERS IMPACTING RECRUITING
BLS: http://www.bls.gov/news.release/archives/jolts_03172016.htm
Year over year change (in millions)
808 1,023 Open Jobs; +26.6% growth521 508 Hires; -2.5% decline469 470 Separations; 0.0% change

THE INCREASING DEMAND FOR WORKERS
• By 2020:- 1 million new jobs in home health and
personal care aids
- 40% increase in physical therapy assistants and aids
- 400,000 LPNs and 500,000 new medical secretaries
• By 2022:- Over 1 million openings for nurses by
2022 (19% are RNs)
• Supply- AACN reported only a 2.6% enrollment
increase in entry level nursing programs
- Nursing/medical school enrollment isn’t growing fast enough to meet demand
- Almost 700,000 nurses are projected to retire by 2024
- Physician shortage is projected to reach 90,000 by 2025

HEALTHCARE RECRUITMENT – 2017
“THIS IS NO PLACE FOR A NERVOUS PERSON . . .”- MICKEY REDMOND

MIXED SIGNALS? INVESTMENT IN RECRUITMENT
What HR and Talent Acquisition Leaders Say*:- 83% - Talent is #1 priority at their company
- 83% - They meet with the C-suite Regularly
- 75% - Team is key to the company’s workforce planning
* Source: LinkedIn Global Recruiting Trends - 2017
MIXED SIGNALS?INVESTMENT IN RECRUITMENTWhat the C-Suite is saying . . . “Why can’t we be more
like Google?”
“We are caregivers . . . and caregiving is all about the people.”

INVESTMENT COMPARISON BY INDUSTRY
$4,323 $4,300 $4,325$3,033
$1,065 $627$0
$1,000$2,000$3,000$4,000$5,000$6,000$7,000$8,000$9,000
$10,000
Cost Per Hire Analysis25%
7.50% 8.0% 6.7% 5.7% 6.2% 4.7%2.7% 1.5%
0%
5%
10%
15%
20%
25%
30%
Recruitment Cost Ratio
Observations:
- Compared to other industries, healthcare organization investment in recruitment is very low.
- Top performing organizations are investment more money in Recruitment*.
- When you compare healthcare RCR (1.5%) to other industries and/or the cost of an RPO (5-10%) or search firm (20-30%), we believe internal recruitment teams perform well considering the lack of capital investment.

INVESTMENT IN RECRUITMENT – IMPACT ON PERFORMANCE
INVESTMENT IN RECRUITMENT IN HEALTHCARE . . . MY ANALOGY
“RUNNING A MARATHON ON ONLY 500 CALORIES . . .”

INVESTMENT COMPARISON – IMPACT ON PERFORMANCE
Observations:- Increased capital
investment in recruitment correlates to reduction in New Hire Turnover and TTF.
Source: Bersin by Deloitte & Lean Human Capital
Cost
Cost Per Hire
$6,465
Cost Per Hire
$3,258 Cost Per Hire$903
Cost Per Hire$606

MAKING THE BUSINESS CASE FOR INCREASED INVESTMENT
1. Understand what is important to them
2. Use Data/Fact to quantify the issue and/or need based on what is important to them.
3. Quantify what you need to improve performance
4. Quantify Expected ROI
5. Track Results

MAKING THE BUSINESS CASE FOR INCREASED INVESTMENT
• -W. Edwards Deming
“Metrics are Meaningless, What You Do with Them is Priceless!”
“Without data you’re just another person with an opinion”
• -David Szary

WHAT IS IMPORTANT TO OUR CUSTOMERS?
•What do Hiring Managers and key stakeholders expect from you?

MAKE A BUSINESS CASE BASED ON WHAT IS IMPORTANT TO THE CUSTOMER
CRITICAL VOC PERFORMANCE DIMENSIONS
Cost
Responsivenessand Speed
Quality of Hire
Efficiency andProductivity
Quality of Service

WHAT IS IMPORTANT TO OUR CUSTOMERS!
•Responsiveness and Speed
•Quality of Hire
•Cost
•Quality Service/Customer Satisfaction
•Process Efficiency
•Staff Productivity

RESPONSIVENESS/SPEED
Why Is Speed So Important?

IMPACT SPEED HAS ON THE ORGANIZATIONWhy reduce the time to hire and onboard a new employee?
• Patient Safety/Satisfaction
• Employee Morale/Engagement
• Improve Customer Satisfaction (hiring manager, new hire, non-hired).
• Revenue lost from not being able to provide patient services.
• Reduce Cost of Vacancy!
• Reduce Turnover (and cost associated with it)

STRUCTURAL FLAW IN ORGANIZATIONAL MODEL –2016 BENCHMARK DATA | MEDIAN (TOP 25%)
• Organizations underestimate time to outbound source and pipeline candidates for difficult to fill positions.
• Almost 3 of every 10 positions take on average 116 (Top 25% is 113) days to fill. These positions have a significant negative impact on cost of vacancy, patient safety/experience, clinical outcomes and employee engagement.
Ave TTF
47 (43) days
72% (77%) < 60 Days
116 (113) days23 (21) days
28% (23%) ≥ 60 Days
Zero hours outbound sourcing required per candidate routed to HM
7+ hours sourcing percandidate routed to HM for
consideration
CDVs
Optimum –Openings per Recruite:35-40

REDUCING TTF & ELIMINATING INVENTORY -CDV REQUISITIONS
10-25%
5-15%
60-85%Lack of Qualified Candidates
Requisition/Position Control
Process/Position Management(s)
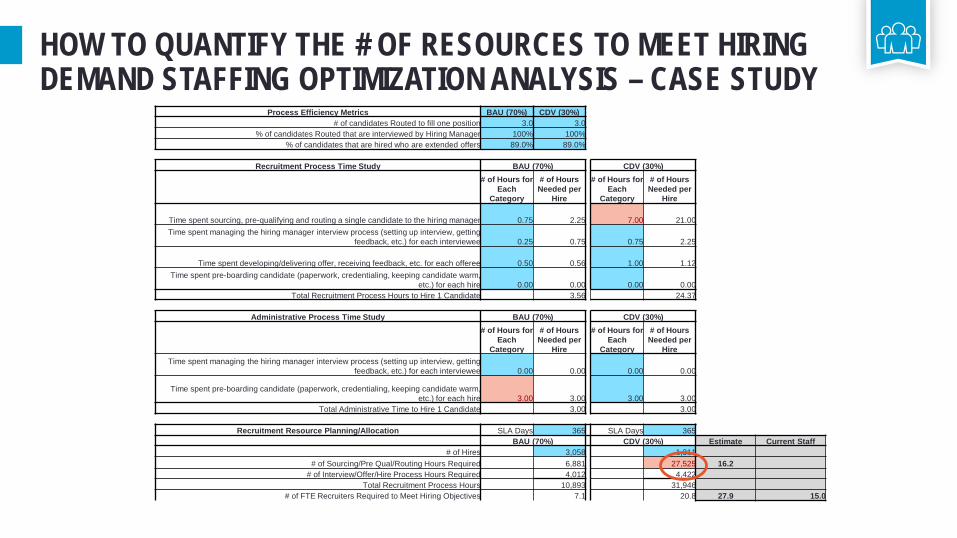
HOW TO QUANTIFY THE # OF RESOURCES TO MEET HIRING DEMAND STAFFING OPTIMIZATION ANALYSIS – CASE STUDY
Process Efficiency Metrics BAU (70%) CDV (30%)# of candidates Routed to fill one position 3.0 3.0
% of candidates Routed that are interviewed by Hiring Manager 100% 100%% of candidates that are hired who are extended offers 89.0% 89.0%
Recruitment Process Time Study BAU (70%) CDV (30%)# of Hours for
Each Category
# of Hours Needed per
Hire
# of Hours for Each
Category
# of Hours Needed per
Hire
Time spent sourcing, pre-qualifying and routing a single candidate to the hiring manager 0.75 2.25 7.00 21.00Time spent managing the hiring manager interview process (setting up interview, getting
feedback, etc.) for each interviewee 0.25 0.75 0.75 2.25
Time spent developing/delivering offer, receiving feedback, etc. for each offeree 0.50 0.56 1.00 1.12Time spent pre-boarding candidate (paperwork, credentialing, keeping candidate warm,
etc.) for each hire 0.00 0.00 0.00 0.00Total Recruitment Process Hours to Hire 1 Candidate 3.56 24.37
Administrative Process Time Study BAU (70%) CDV (30%)# of Hours for
Each Category
# of Hours Needed per
Hire
# of Hours for Each
Category
# of Hours Needed per
HireTime spent managing the hiring manager interview process (setting up interview, getting
feedback, etc.) for each interviewee 0.00 0.00 0.00 0.00
Time spent pre-boarding candidate (paperwork, credentialing, keeping candidate warm, etc.) for each hire 3.00 3.00 3.00 3.00
Total Administrative Time to Hire 1 Candidate 3.00 3.00
Recruitment Resource Planning/Allocation SLA Days 365 SLA Days 365BAU (70%) CDV (30%) Estimate Current Staff
# of Hires 3,058 1,311# of Sourcing/Pre Qual/Routing Hours Required 6,881 27,525 16.2
# of Interview/Offer/Hire Process Hours Required 4,012 4,422Total Recruitment Process Hours 10,893 31,946
# of FTE Recruiters Required to Meet Hiring Objectives 7.1 20.8 27.9 15.0

STAFFING OPTIMIZATION ANALYSIS – CASE STUDY
• Approximate # of outbound sourcing hours to meet hiring demand and fill positions in 27 days:
- 27,525 hours
• Currently – Recruitment team is sourcing approximately 3,600 hours per year: - 15 recruiter x 5 hours week x 48 weeks

COST OF VACANCY IMPACT –AGENCY AND PREMIUM PAY – CASE STUDY
Projected FY2016Annualized Gross
Costs DIRECT CARE RNs
Net Cost DIRECT CARE RNs (50% Premium for OT: 25% Premium for
Agency)
Annualized Net Cost DIRECT CARE RNs -
2016
Overtime $37,906,873 $ 12,635,624 $ 12,635,624 Agency $14,291,310 $ 2,858,262 $ 2,858,262 Totals $ 15,493,886
Average Direct Care RN Net Cost of Vacancy per 12 hour shift: $178
Non Nursing - Projected FY2016 Annualized Gross Costs
Net Cost (50% Premium for OT)
Annualized Net Cost 2016
Overtime $46,745,598 $ 15,581,866 $ 15,581,866

QUALITY METRICS
Quality hires drives HCAPHS!

IMPACT OF PATIENT-CARE ON FINANCIALS
• As of 2016, 1.75% of Medicare reimbursements are at stake
• In 2017, it will be 2% at stake
Quality Improvements and Patient Satisfaction
HCAHPS25%
Core Measures75%
Clinical Process10%
Outcomes40%
Efficiency25%

RECRUITMENT TRANSFORMATION JOURNEY 1.0QUANTIFYING ROI

INVESTMENT IN SOURCING TO REDUCE COST OF VACANCY - CASE STUDY
LHC—Cost of Vacancy Analysis – Investment in 2 Sourcing FTE’s (150k) Daily Cost of Vacancy (EXAMPLE DATA) Hard Cost Productivity
Lost Overall Cost
Direct Care RN—OT $274 $0 $274
Direct Care RN—Agency $219 $131 $350
Direct Care RN—PD $9 $0 $9
Blended Daily Cost of Vacancy ($274 + $350 + $9) = $211 $211
# of Direct Care RN positions filled in MORE than 60 days (2013) 240
Average TTF for positions filled in MORE than 60 days (2013) 136
Total COV (assuming vacancy) $6,887,040
Average TTF Reduced by 25%
New Average TTF moving forward 102
Total COV $5,165,280
Cost Savings!!! $1,721,760

INVESTING IN RECRUITMENT TO REDUCE DIRECT COST OF TURNOVER - CASE STUDY
Assumptions Case Study
# of external new employees hired (projected for CY2015) 5800
Turnover % 20.1%
Total number of replacement employees 1166
Average annual compensation $ 57,000
Average tax and benefit cost as % of salary (25% is average) 25%
Average loaded hourly admin labor costs $ 19
Average loaded hourly HR/recruiter labor costs $ 45
Average loaded hourly hiring manager labor costs $ 60
Average time spent by HR manager for exit interviews 0
Average time spent by admin for termination processing 120
Separation pay (# of weeks offered) $ -
Time spent Sourcing to find one candidate for a difficult to fill positions 5
Average # of applications received to fill 1 position 22
Average time spent dispositioning applicants 2
Average # of candidates Pre-screened by Recruiting/HR 7.24
Average time spent by HR Phone/Interview candidates 30
Cost pre pre-assessment test (manpower) $ 6
Average # of candidates routed to Hiring Managers for consideration 5
Average # of candidates interviewed by hiring manager to fill 1 position 3.04
Average time spent by hiring manager interviewing candidates 60
Average time spent by HR to creating/deliver/processing offers 60
Cost per source of hire (media, posting, agency, etc.) $ 788
Background check/drug/medical exam costs per hire $ 531
Average candidate travel costs per hire $ -
Moving expenses $ -
Post offer onboarding admin expenses 120
Average sign on bonus per hire $ -
# of hours spent in formal training/onboarding per new hire. 8
Learning curve - # of months to full ramp up 2
Lost productivity % during learning curve period 50%
Turnover categories Case study
Separation CostsTotal labor costs for exit interviewer's time $ -
Total admin labor costs for termination processing $ 43,671 Total separation pay $ -
Total separation costs across all replaced employees $ 43,671
Recruitment Replacement CostsTotal costs - source of hire $ 918,650
Total Labor Costs to source candidates $ 1,311,525 Total labor costs to disposition all applicants $ 38,471 Total labor cost for pre-screening candidates $ 189,909
Total pre-assessment testing costs $ 48,532 Total labor cost for hiring manager interviews $ 212,642
Total labor cost for HR/recruiter to create/deliver offer $ 52,461 Total recruitment replacement costs $ 2,772,191
Onboarding Replacement CostsBackground check/drug/medical exam costs per hire $ 619,040
Average candidate travel costs per hire $ -Moving expenses $ -
Post offer onboarding admin expenses $ 43,671 Average sign on bonus per hire $ -
Total Onboarding Costs $ 662,711
Total Training CostsNew hire labor costs during Training/onboarding $ 319,474
Total learning curve costs $ 6,921,938 Total Training Costs $ 7,241,412
TOTAL TURNOVER COSTS $ 10,719,984
% decrease in Turnover Rate 23.5%Median First year TO Rate 15.4%
Total savings from reduction in turnover $ 2,519,196
58020.1% 1166
23.5%15.4%
$2,519,196
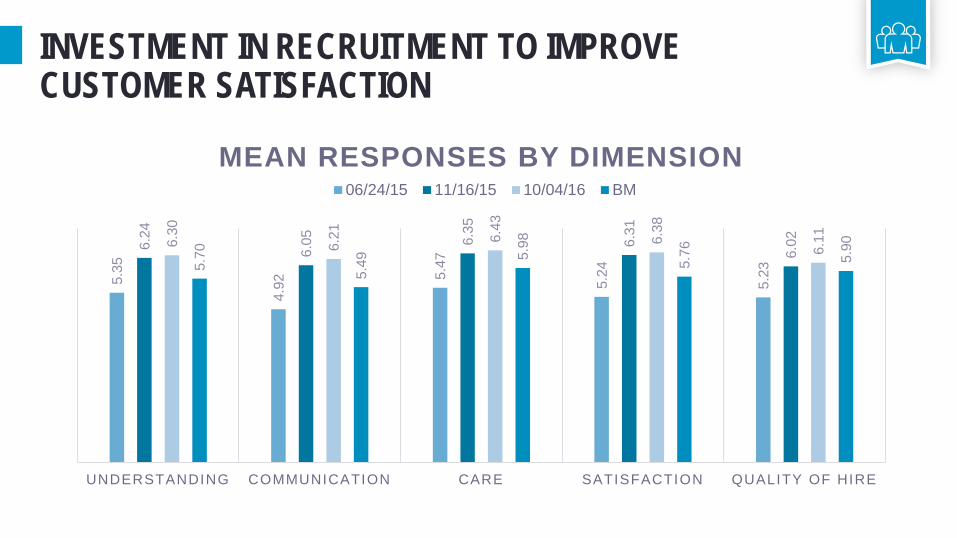
INVESTMENT IN RECRUITMENT TO IMPROVE CUSTOMER SATISFACTION
5.35
4.92
5.47
5.24
5.23
6.24
6.05 6.
35
6.31
6.026.
30
6.21 6.
43
6.38
6.11
5.70
5.49 5.
98
5.76 5.90
UNDERSTANDING COMMUNICATION CARE SATISFACTION QUALITY OF HIRE
MEAN RESPONSES BY DIMENSION06/24/15 11/16/15 10/04/16 BM

INVESTMENT IN RECRUITMENT TO IMPROVE CUSTOMER SATISFACTION
54.2
%
45.0
% 57.7
%
52.1
%
45.5
%
82.2
%
78.6
% 87.7
%
84.1
%
76.7
%85.7
%
82.1
% 91.3
%
88.2
%
79.4
%
68.3
%
63.2
% 76.7
%
70.7
%
73.7
%
UNDERSTANDING COMMUNICATION CARE SATISFACTION QUALITY OF HIRE
% OF RAVING FANS BY DIMENSION (RESPONSES 6-7)06/24/15 11/16/15 10/04/16 BM

INVESTMENT IN RECRUITMENT TO IMPROVE CUSTOMER SATISFACTION
15.3
%
24.3
%
7.7%
17.2
%
10.2
%
1.7%
5.7%
1.3%
1.7%
1.0%1.8% 3.
8%
0.2% 2.
5%
1.5%
10.4
% 15.6
%
4.4%
12.0
%
4.3%
UNDERSTANDING COMMUNICATION CARE SATISFACTION QUALITY OF HIRE
% OF DISSATISFIED CUSTOMERS BY DIMENSION (RESPONSES 1-3)
06/24/15 11/16/15 10/04/16 BM

COST METRICS
Being Fiscally Responsible

INVESTMENT COMPARISON BY INDUSTRY
$4,323 $4,300 $4,325$3,033
$1,065 $627$0
$1,000$2,000$3,000$4,000$5,000$6,000$7,000$8,000$9,000
$10,000
Cost Per Hire Analysis25%
7.50% 8.0% 6.7% 5.7% 6.2% 4.7%2.7% 1.5%
0%
5%
10%
15%
20%
25%
30%
Recruitment Cost Ratio
Observations:
- Compared to other industries, healthcare organization investment in recruitment is very low.
- Top performing organizations are investment more money in Recruitment*.
- When you compare healthcare RCR (1.5%) to other industries and/or the cost of an RPO (5-10%) or search firm (20-30%), we believe internal recruitment teams perform well considering the lack of capital investment.
Questions?Presenter Contact Information for Additional Questions:
REMEMBER! Rate each session you attend in the
Mobile App
★ ★ ★ ★ ★1-5 Stars,
5 being the best.
THANK YOU!
David SzarySr. Vice President and General Manager, Recruiting Services
Lean Human Capital by [email protected]