Embed Size (px)
Citation preview
Day 3
2x2 Table
1
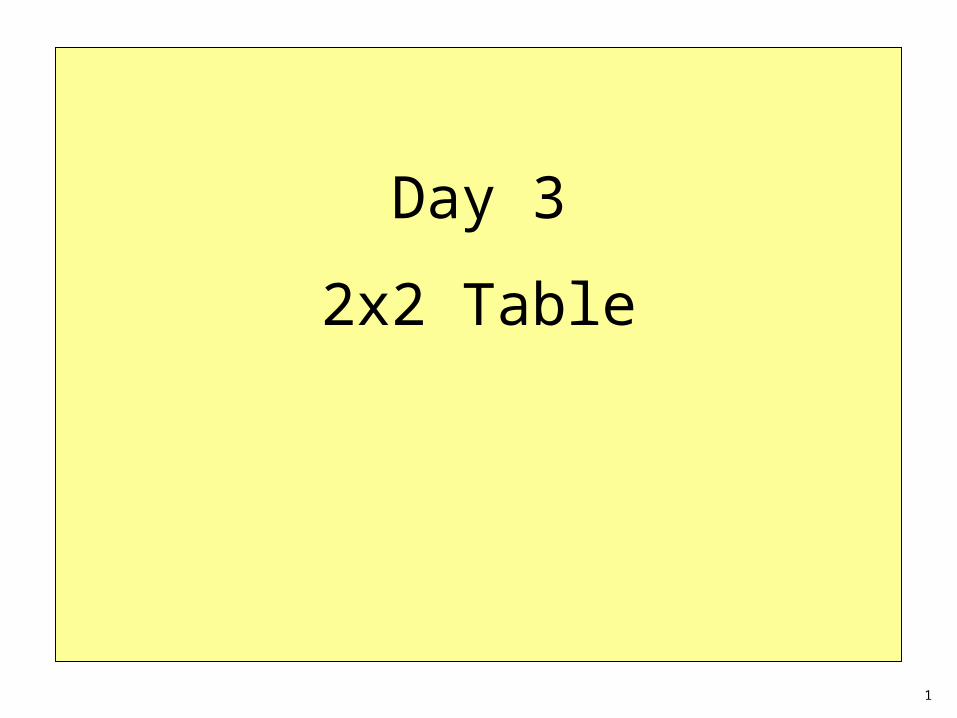
What are you curious about?
From curiosity to a hypothesis
From a hypothesis to questions
From questions to answers
From answers to counts
From counts to prevalence
From prevalence to statements
Interpretation – Conclusions - Communication
2

3
Three main tools
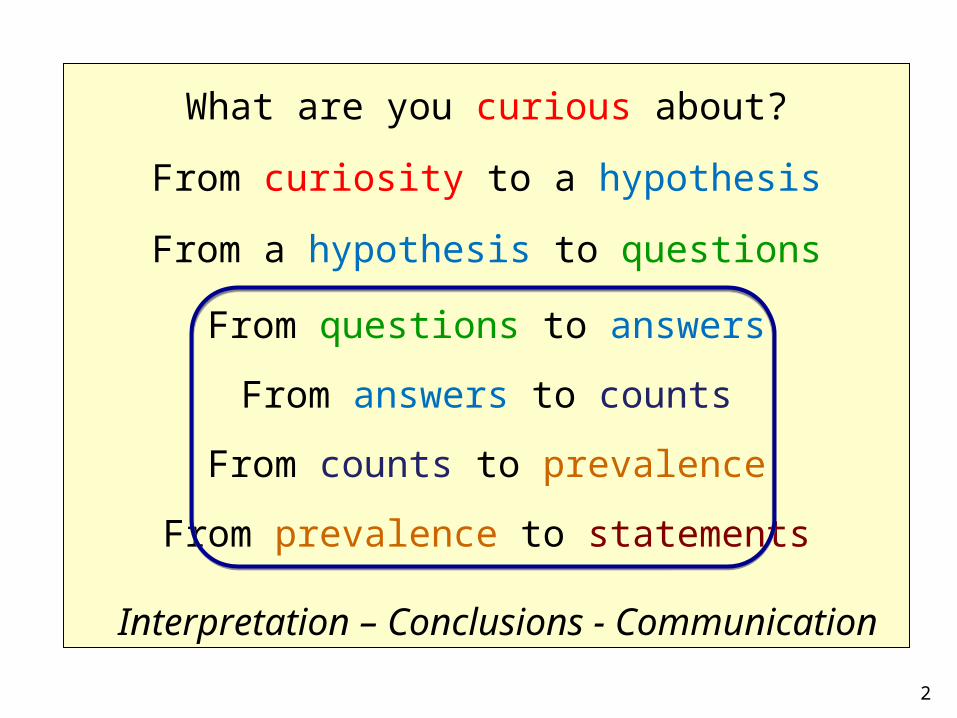
1. Cross-sectional study design: a relatively quick way to test a hypothesis
4
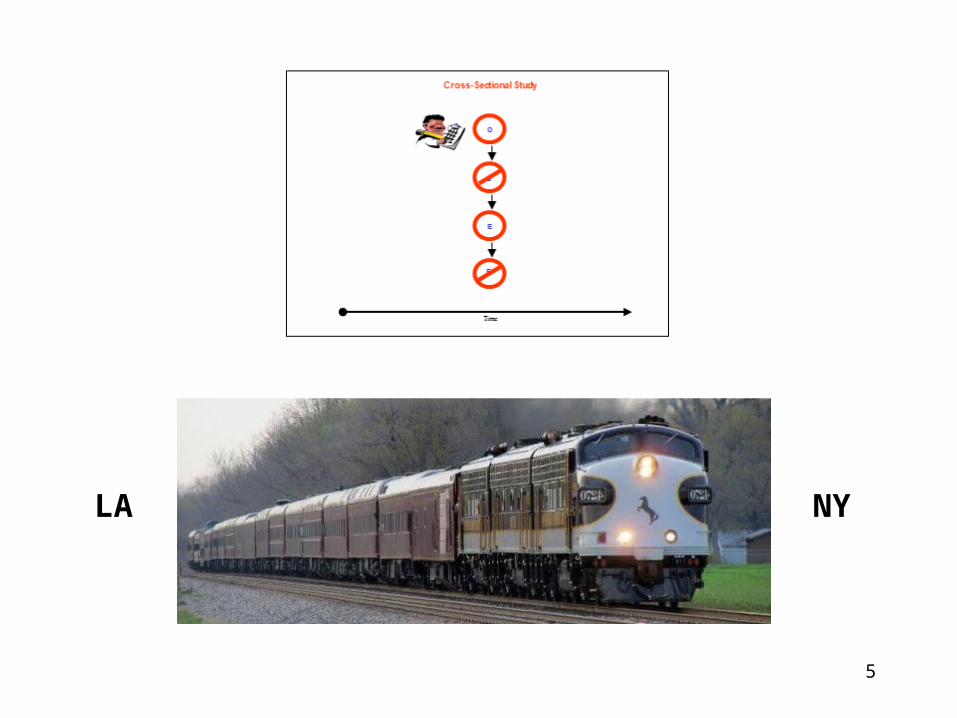
An observational study
A snapshot of what is going on
Sometimes called a
prevalence study
One point in time
5
LA NY

Cross-sectional studies are carried out to investigate possible associations between hypothesized exposures and outcomes.
People in the study take a survey and give answers to questions about exposure and about outcome at the same time.
From Epi Textbooks
6
What are you curious about?
From curiosity to a hypothesis
From a hypothesis to questions
From questions to answers
From answers to counts
From counts to prevalence
From prevalence to statements
Interpretation – Conclusions - Communication7
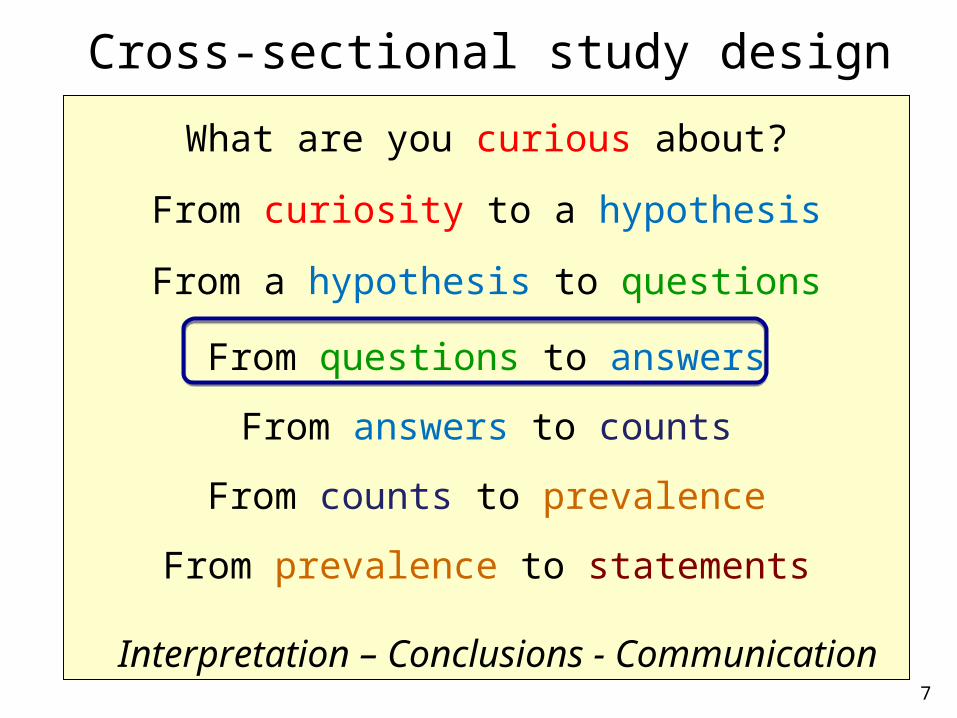
Cross-sectional study design
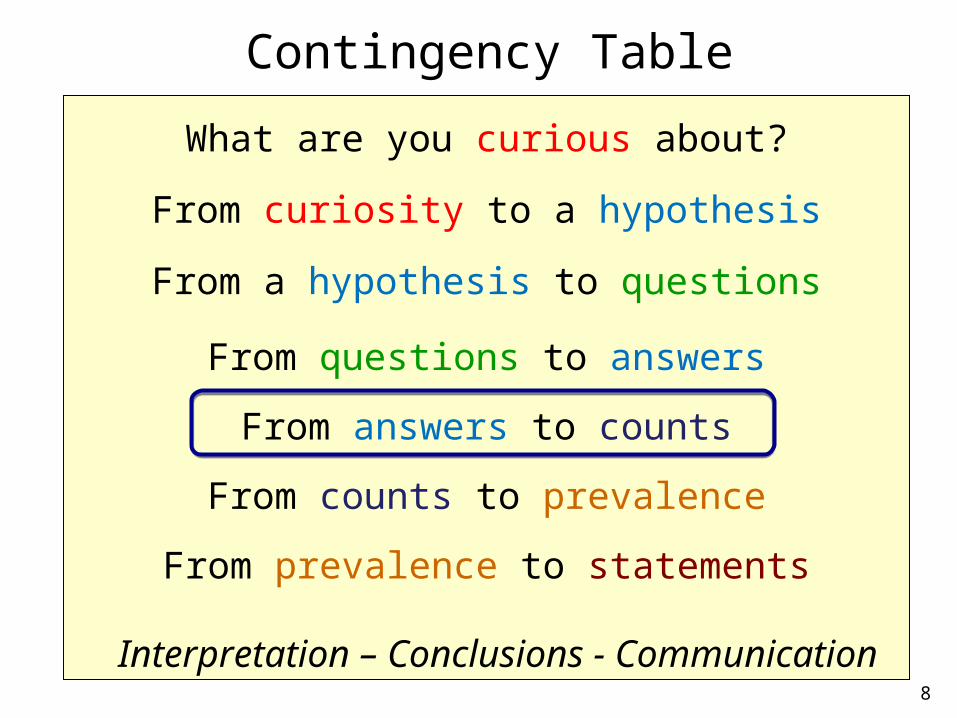
What are you curious about?
From curiosity to a hypothesis
From a hypothesis to questions
From questions to answers
From answers to counts
From counts to prevalence
From prevalence to statements
Interpretation – Conclusions - Communication8
Contingency Table
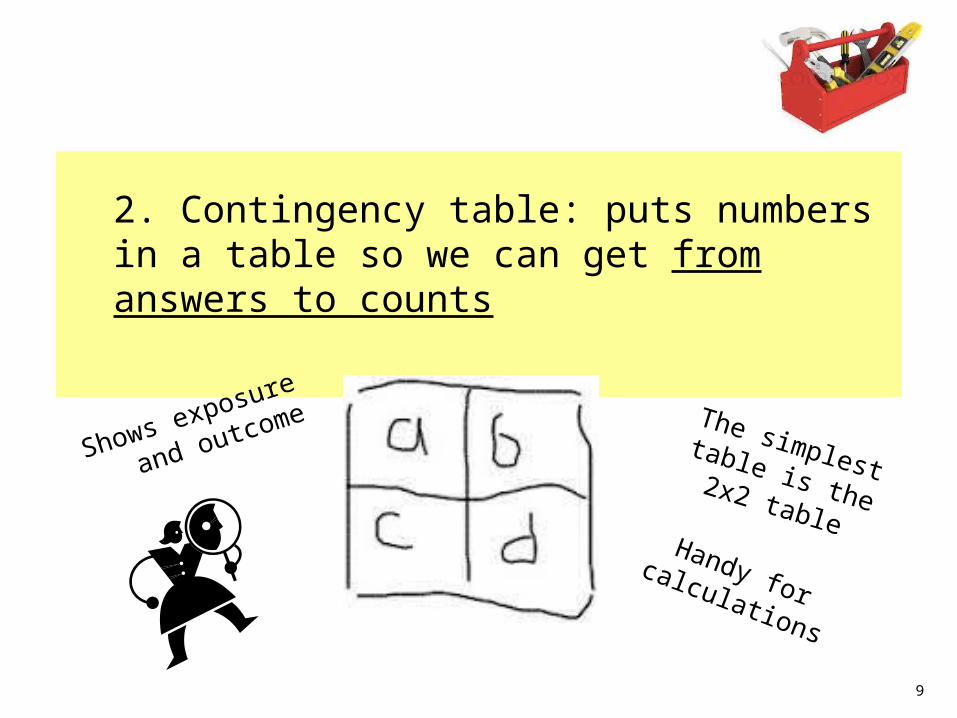
2. Contingency table: puts numbers in a table so we can get from answers to counts
9
Handy for calculations
The simplest table is the 2x2 table
Shows exposure
and outcome
From Epi Textbooks
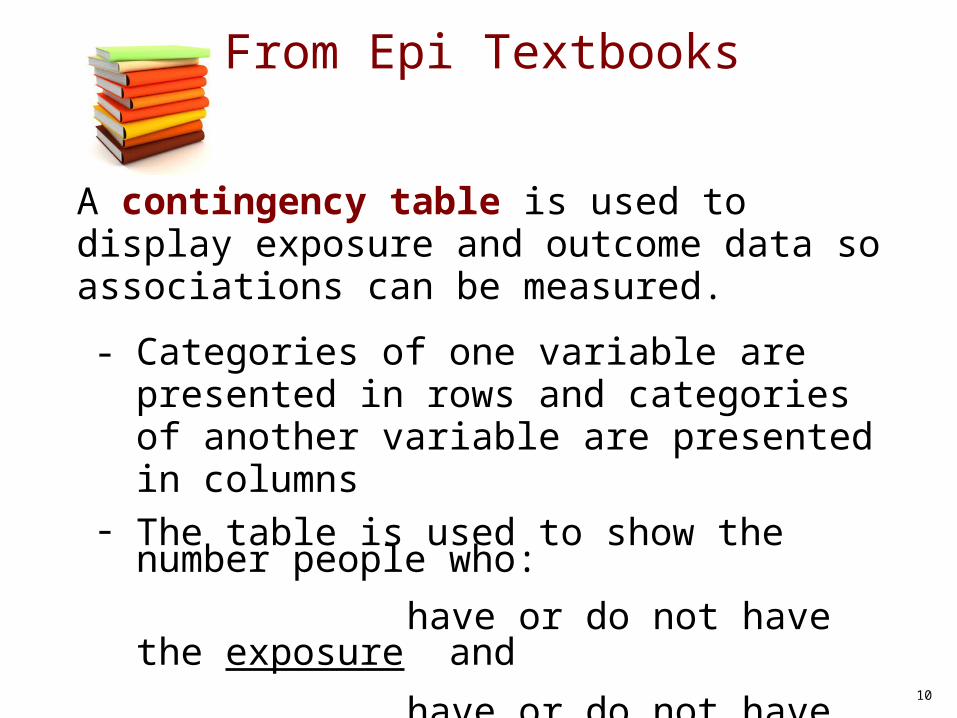
A contingency table is used to display exposure and outcome data so associations can be measured.
- Categories of one variable are presented in rows and categories of another variable are presented in columns
- The table is used to show the number people who:
have or do not have the exposure and
have or do not have the outcome.
- The simplest contingency table is the 2x2 table
10
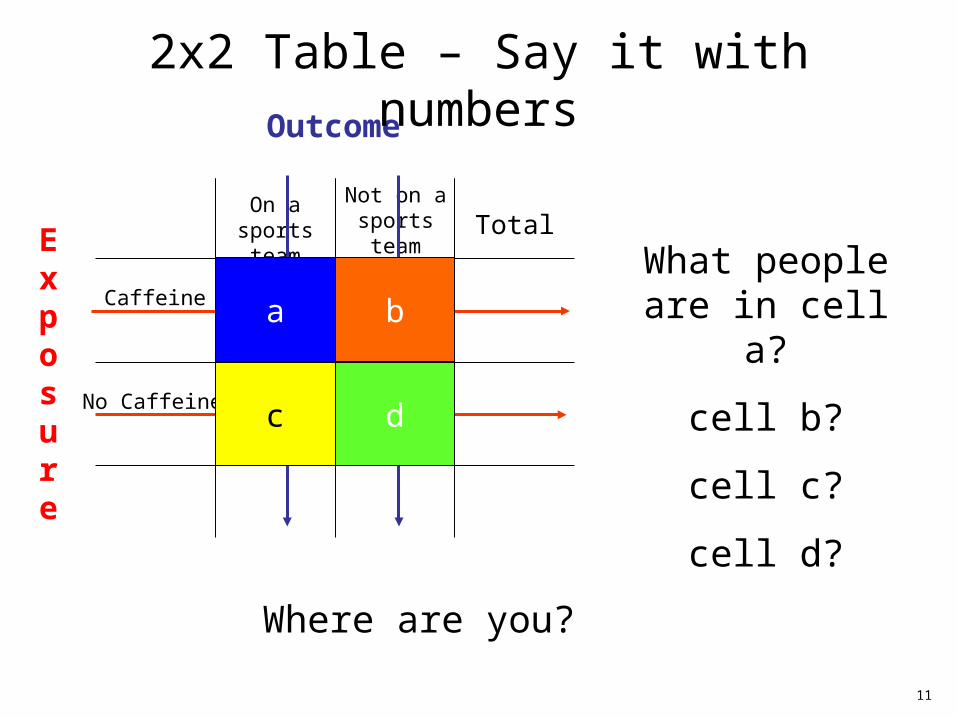
TotalOn a sports
team
Not on a sports team
Caffeine
No Caffeine
Exposure
Outcome
a b
c d
2x2 Table – Say it with numbers
What people are in cell a?
cell b?
cell c?
cell d?
11
Where are you?
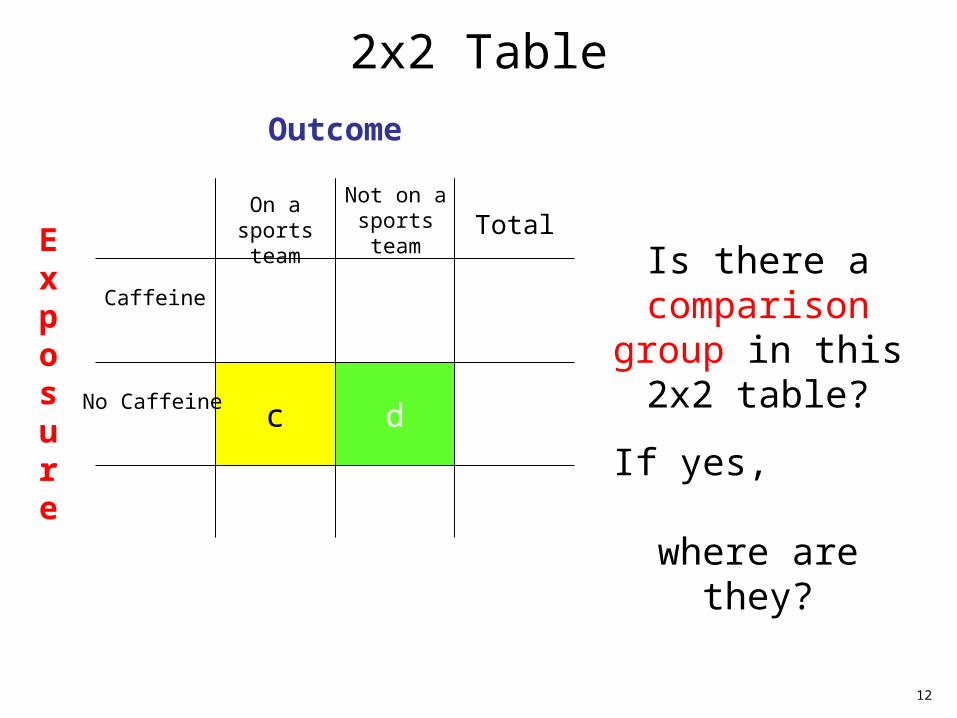
TotalExposure
Outcome
c d
Is there a comparison group in this 2x2 table?
If yes, where are they?
12
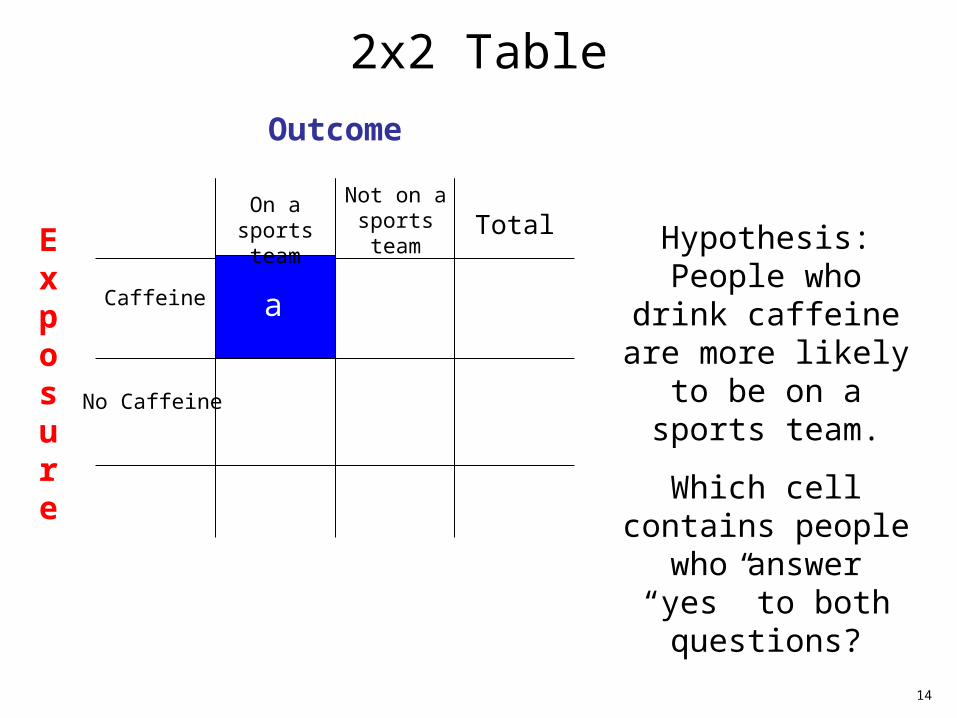
2x2 Table
On a sports team
Not on a sports team
Caffeine
No Caffeine
13
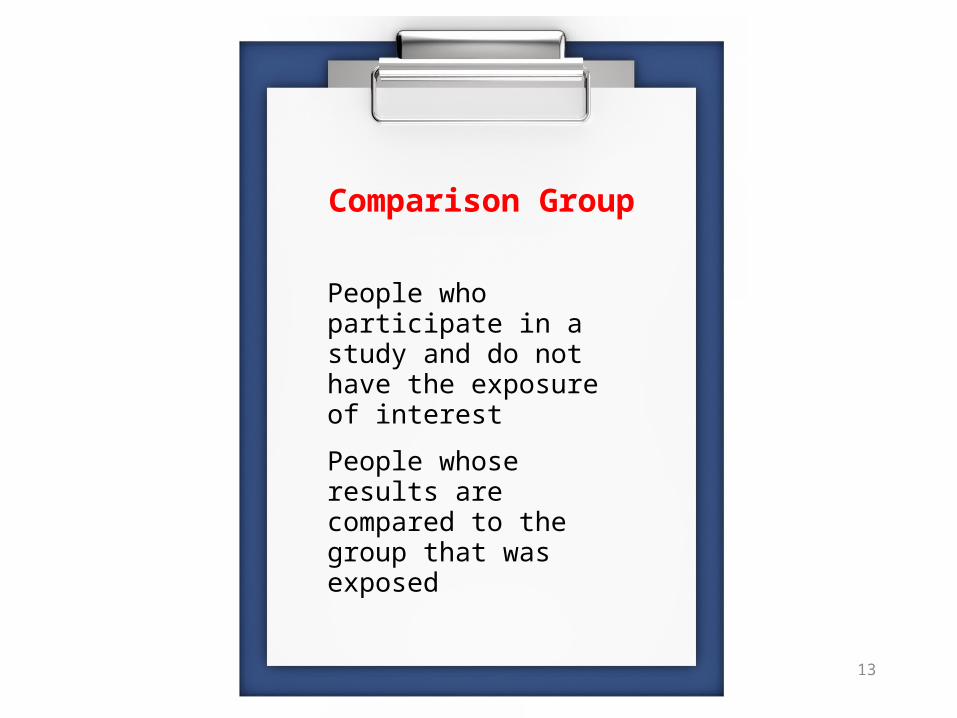
Comparison Group
People who participate in a study and do not have the exposure of interest
People whose results are compared to the group that was exposed
TotalExposure
Outcome
Hypothesis: People who drink caffeine
are more likely to be on a sports team.
Which cell contains people who answer
“yes” to both questions?
14
2x2 Table
On a sports team
Not on a sports team
Caffeine
No Caffeine
a
Epi Team Challenge
a
b
c
d
a b
dc
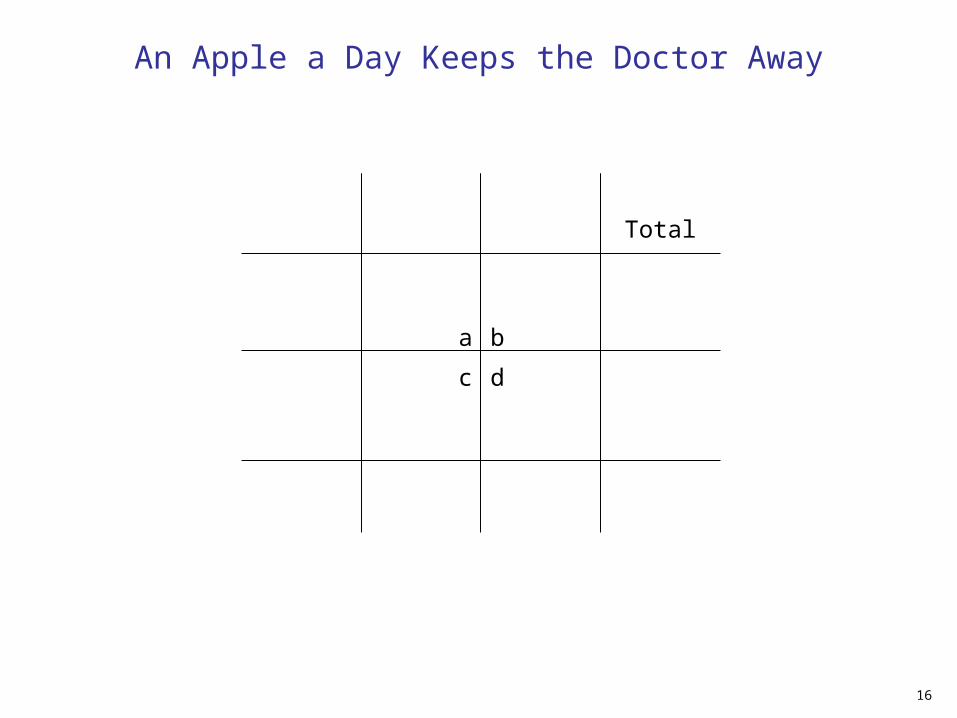
An Apple a Day Keeps the Doctor Away
Total
16
a b
dc
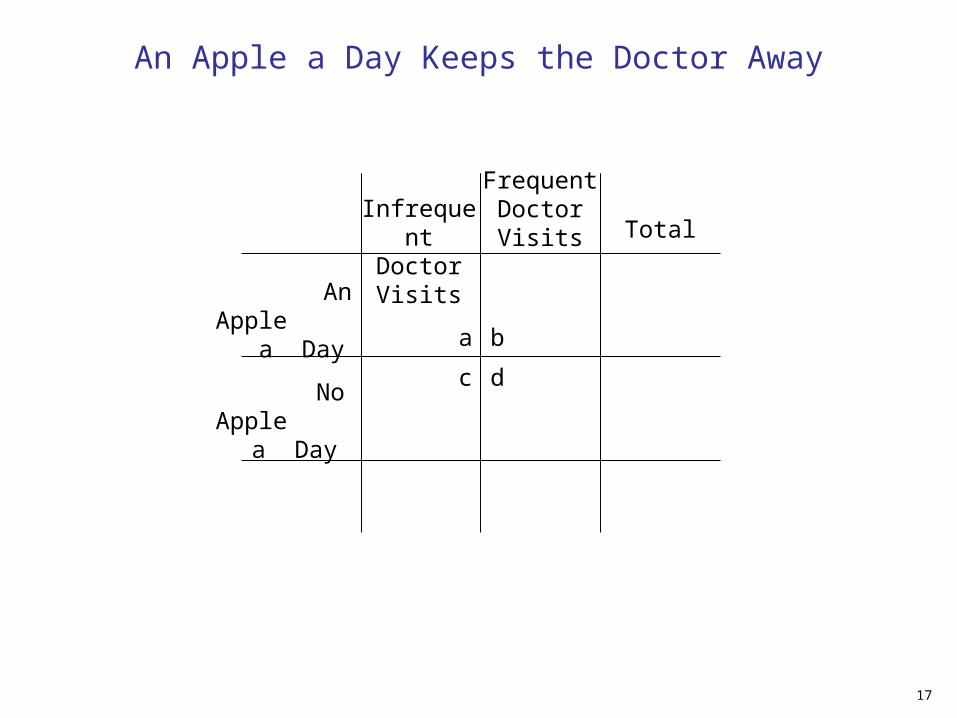
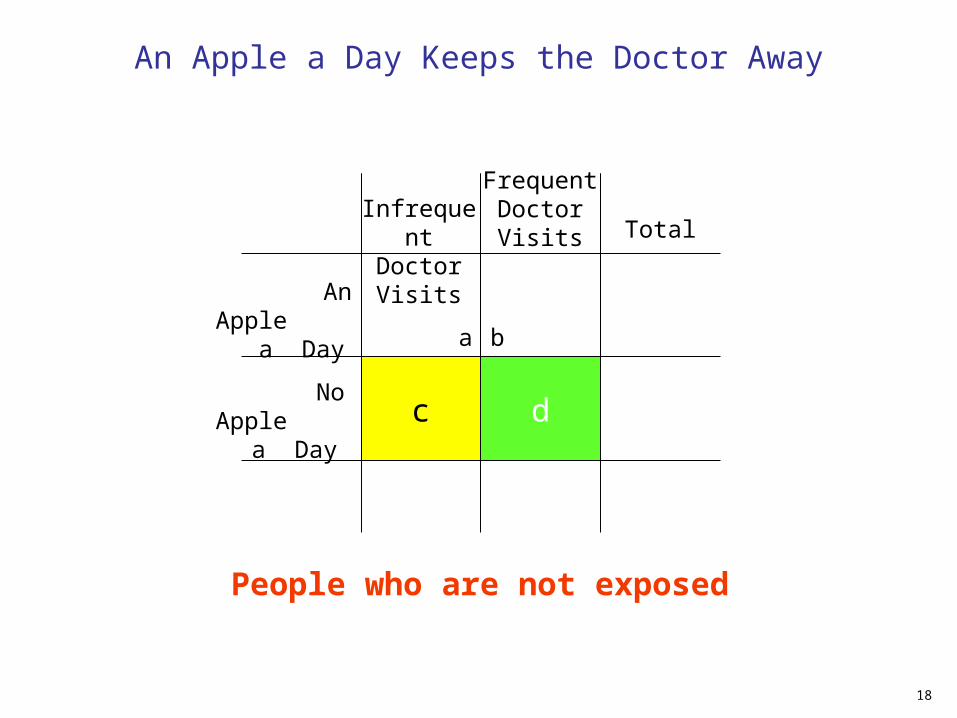
An Apple a Day Keeps the Doctor Away
An Apple a Day
Infrequent Doctor Visits
No Apple a Day
Frequent Doctor Visits Total
17
a b
dc
People who are not exposed
dc
An Apple a Day Keeps the Doctor Away
Total
18
An Apple a Day
Infrequent Doctor Visits
No Apple a Day
Frequent Doctor Visits
Total
a b
dc
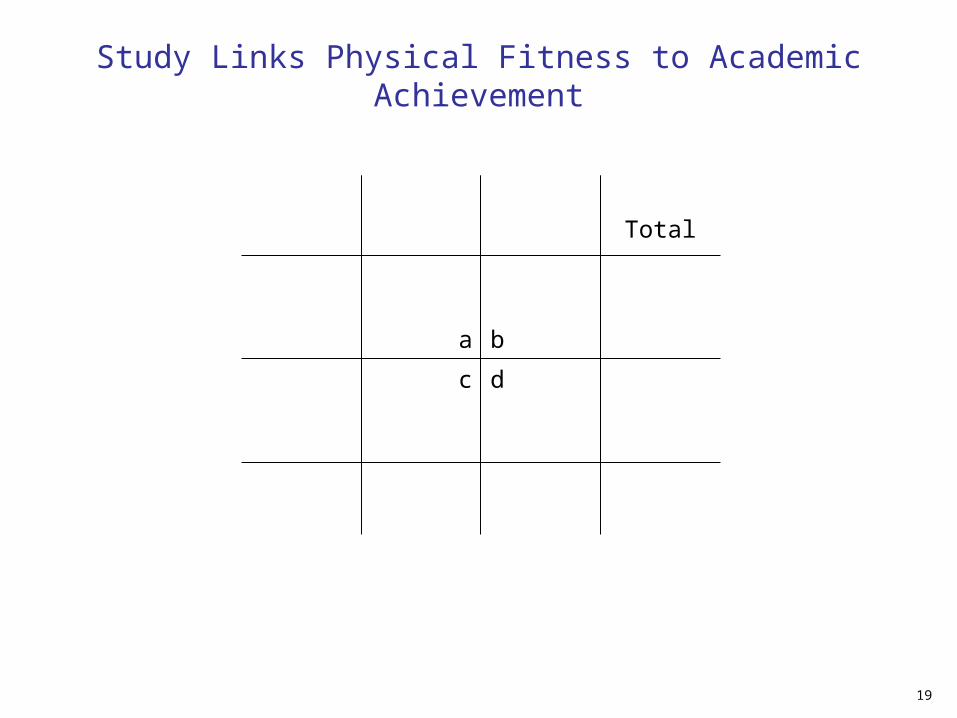
Study Links Physical Fitness to Academic Achievement
19
Total
a b
dc
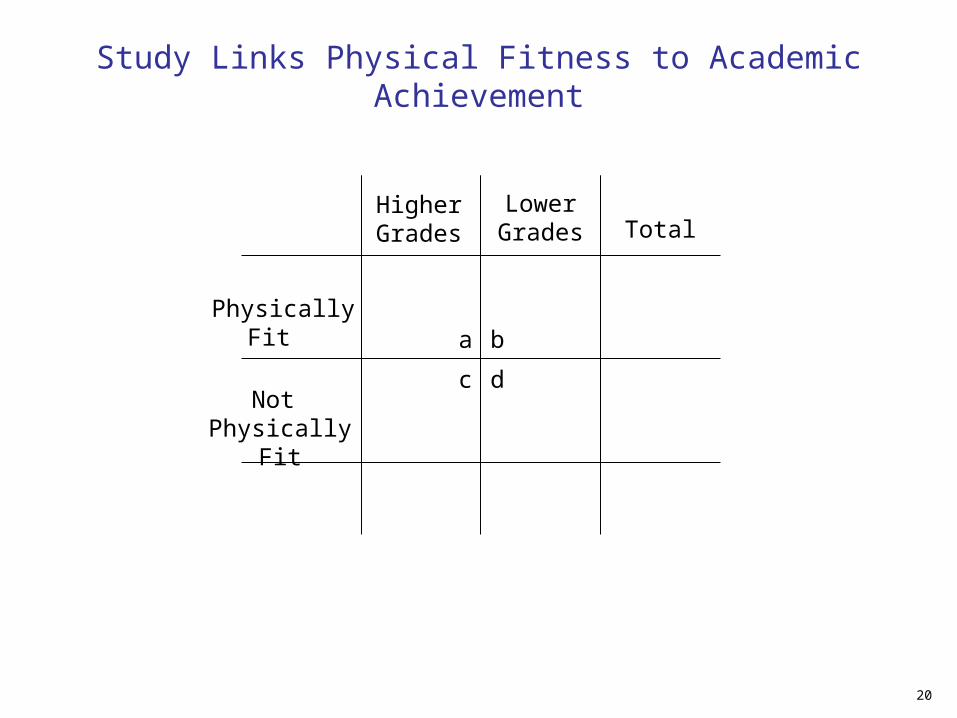
Study Links Physical Fitness to Academic Achievement
Lower Grades
Higher Grades
20
Physically Fit
Not Physically Fit
Total
a b
dc
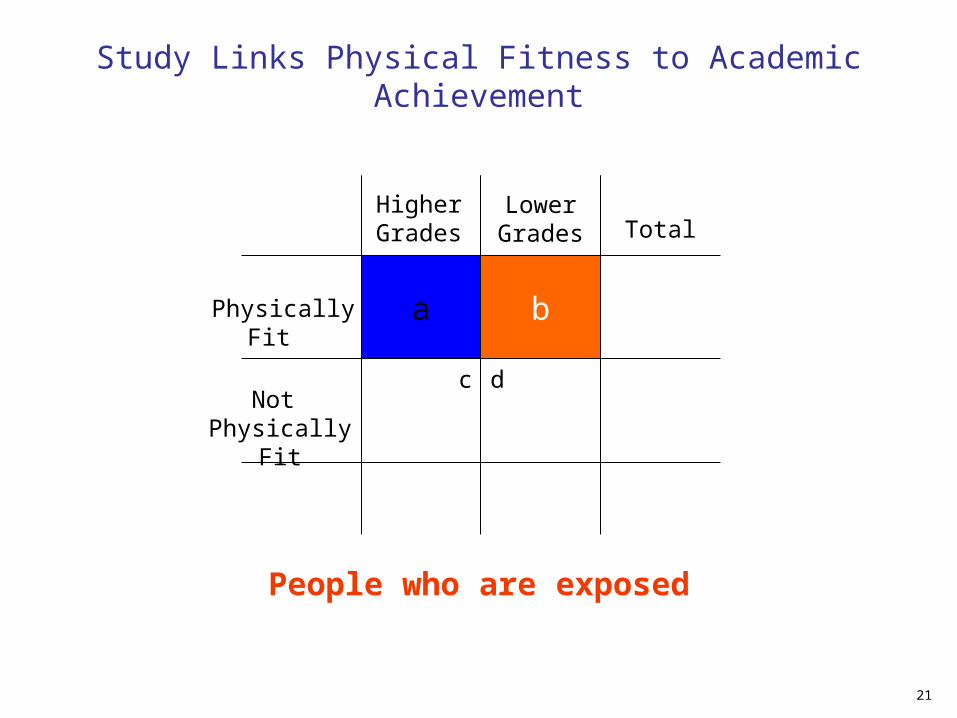
People who are exposed
a b
Study Links Physical Fitness to Academic Achievement
Physically Fit
Lower Grades
Higher Grades
Not Physically Fit
21
a b
dc
Total
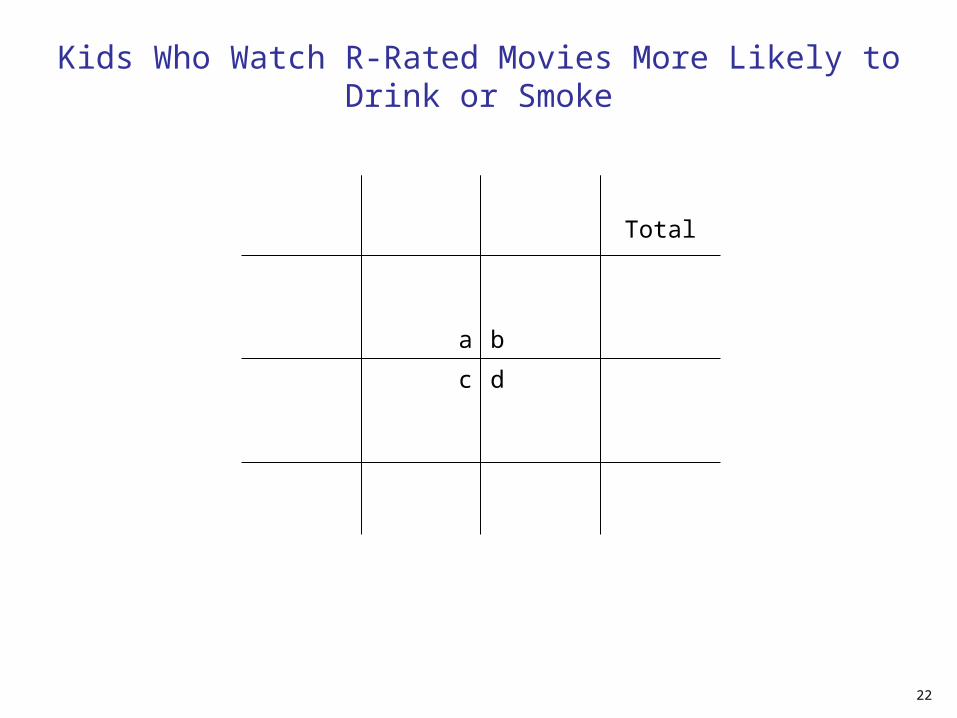
Kids Who Watch R-Rated Movies More Likely to Drink or Smoke
22
a b
dc
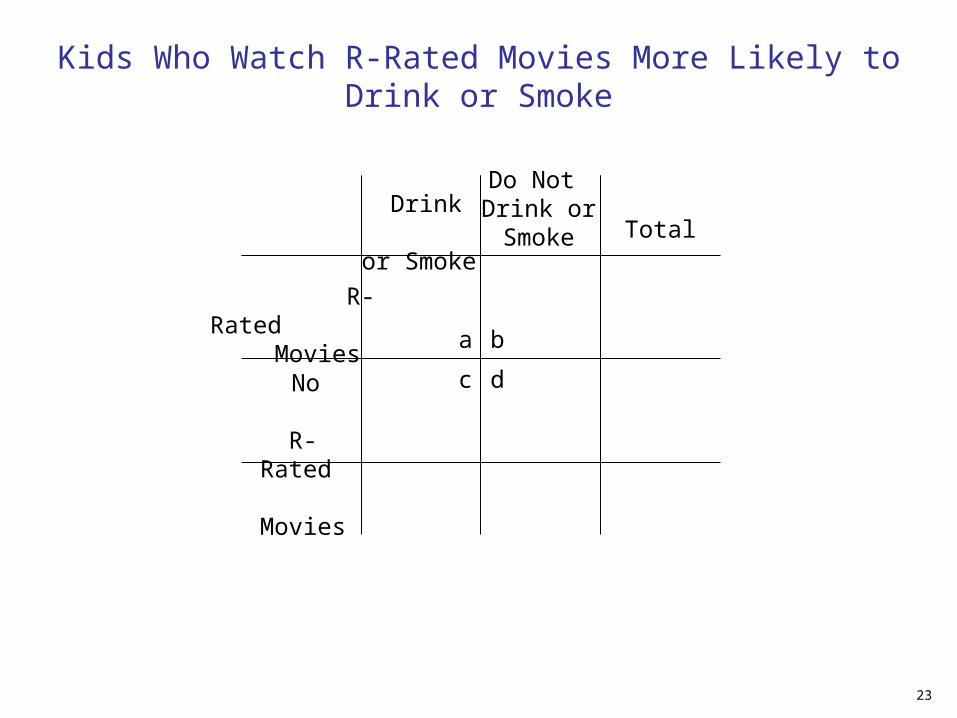
R-Rated Movies
Total Drink or Smoke
Kids Who Watch R-Rated Movies More Likely to Drink or Smoke
Do Not Drink or Smoke
No R-
Rated
Movies
23
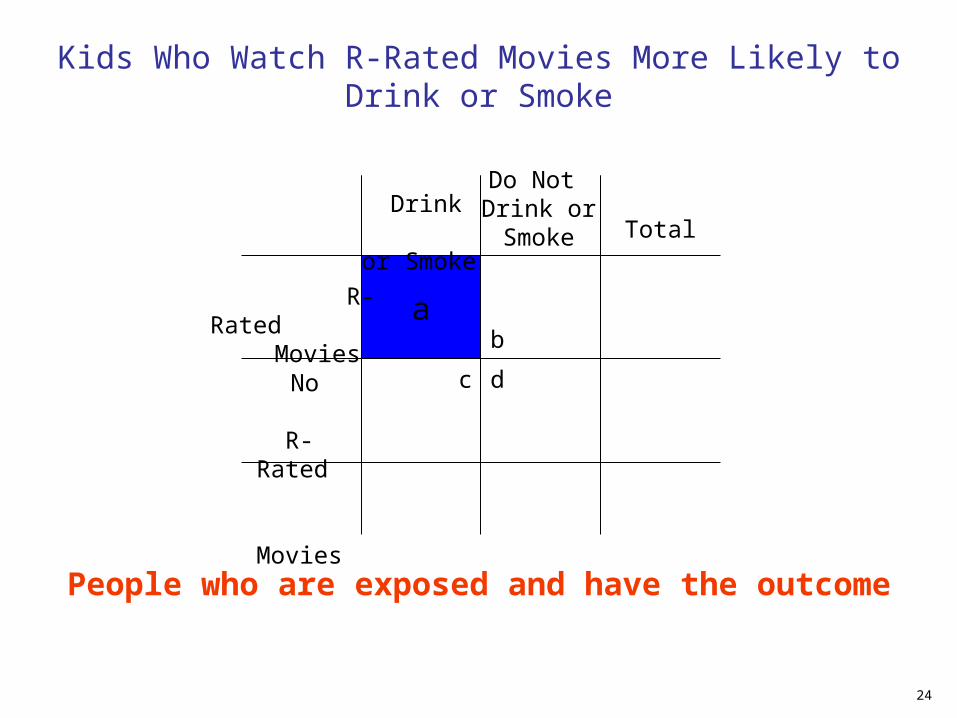
a b
dc
People who are exposed and have the outcome
a
Total
Kids Who Watch R-Rated Movies More Likely to Drink or Smoke
24
R-Rated Movies
Drink or Smoke
Do Not Drink or Smoke
No R-Rated Movies
a b
dc
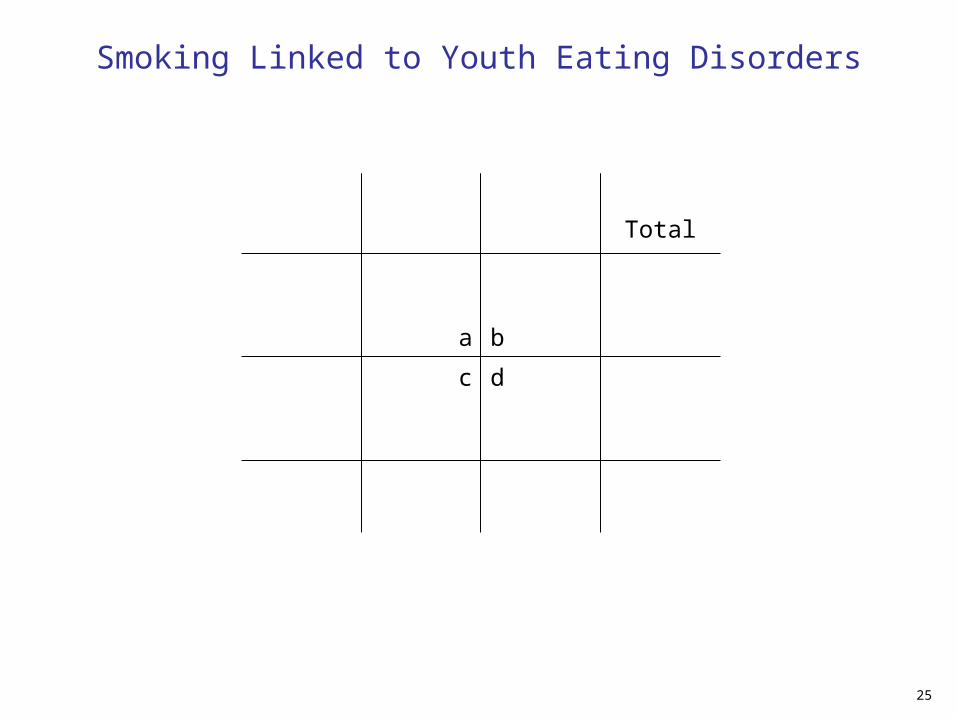
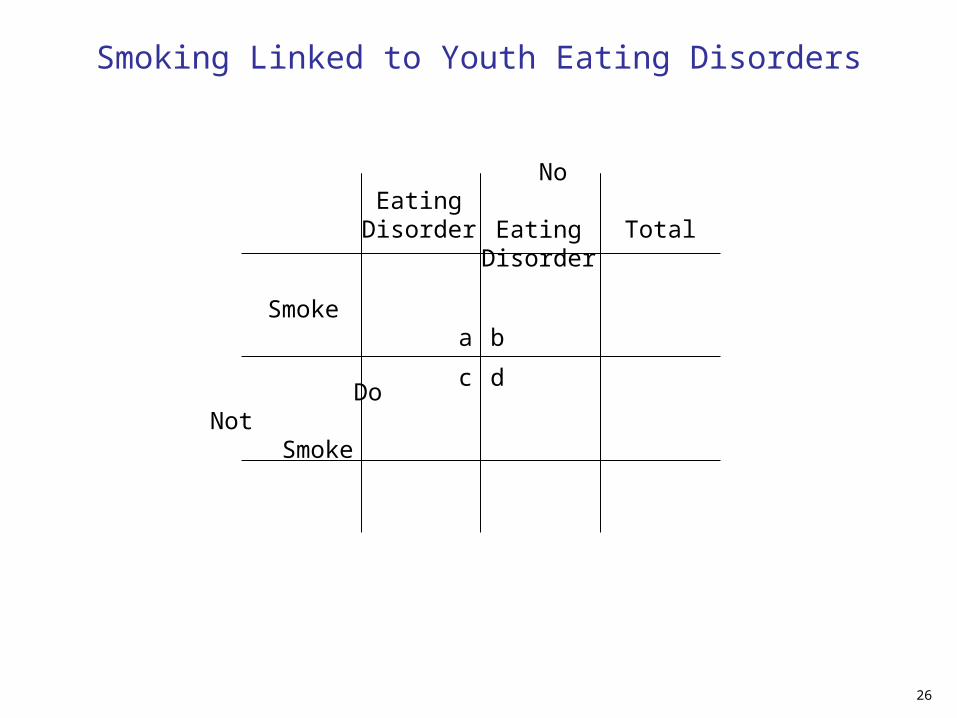
Smoking Linked to Youth Eating Disorders
Total
25
a b
dc
Smoking Linked to Youth Eating Disorders
Smoke
Eating Disorder
Do Not Smoke
No Eating Disorder Total
26
a b
dc
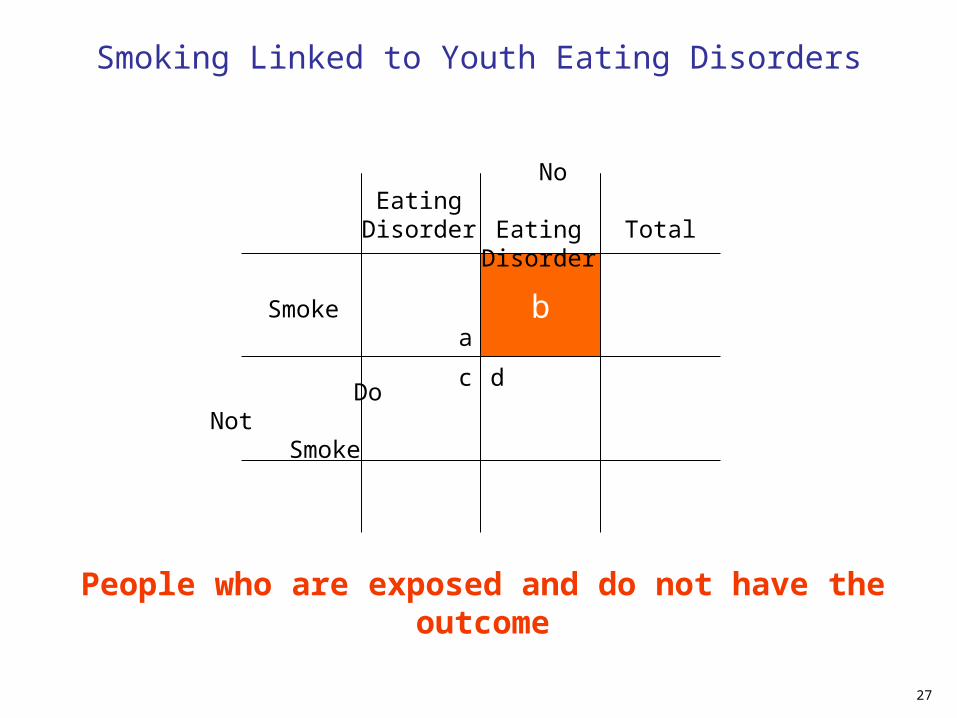
People who are exposed and do not have the outcome
b
Smoking Linked to Youth Eating Disorders
Smoke
Eating Disorder
Do Not Smoke
No Eating Disorder Total
27
a b
dc
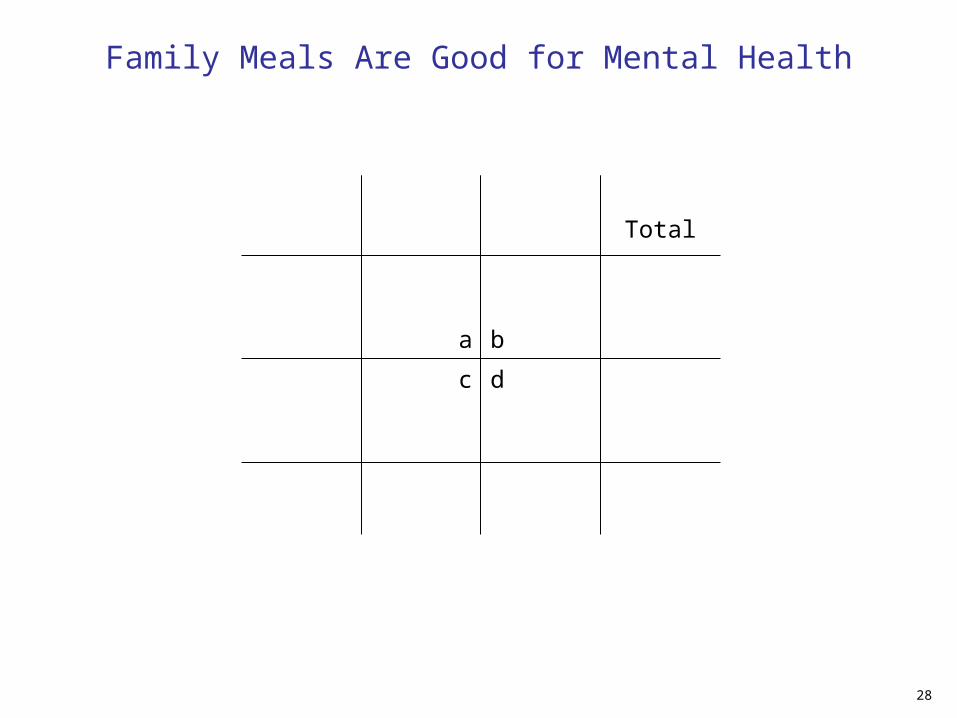
Family Meals Are Good for Mental Health
Total
28
a b
dc
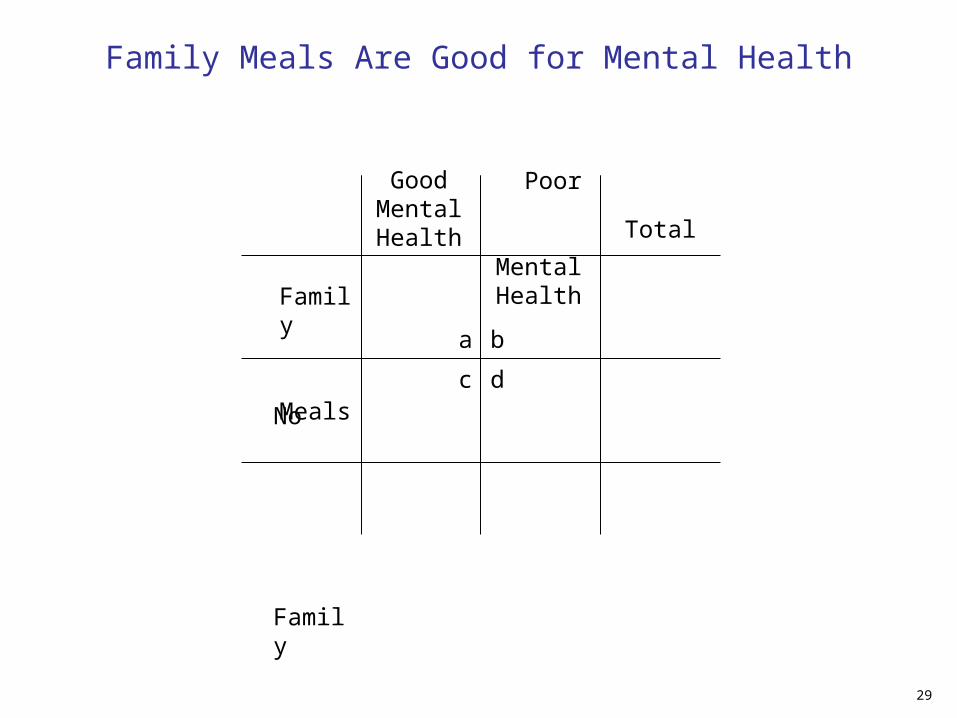
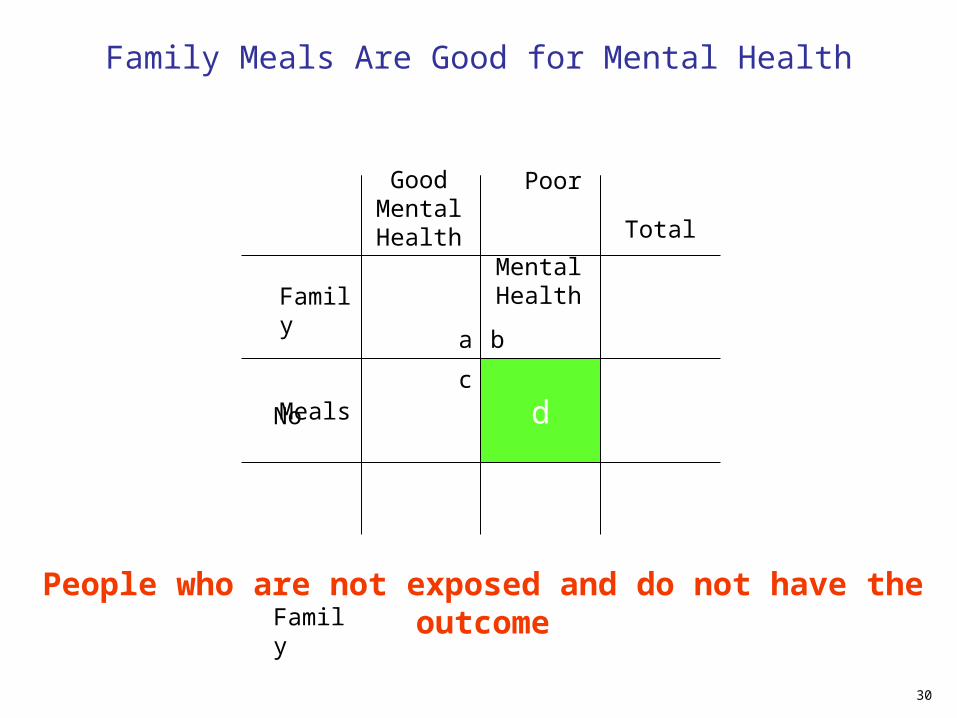
Family Meals Are Good for Mental Health
Family Meals
Total
Good Mental Health
Poor
Mental Health
No
Family Meals
29
a b
dc
People who are not exposed and do not have the outcome
d
Family Meals Are Good for Mental Health
Total
Good Mental Health
Poor
Mental Health
30
Family Meals
No
Family Meals
a b
dc
Study Links Iron Deficiency to Math Scores
Total
31
a b
dc
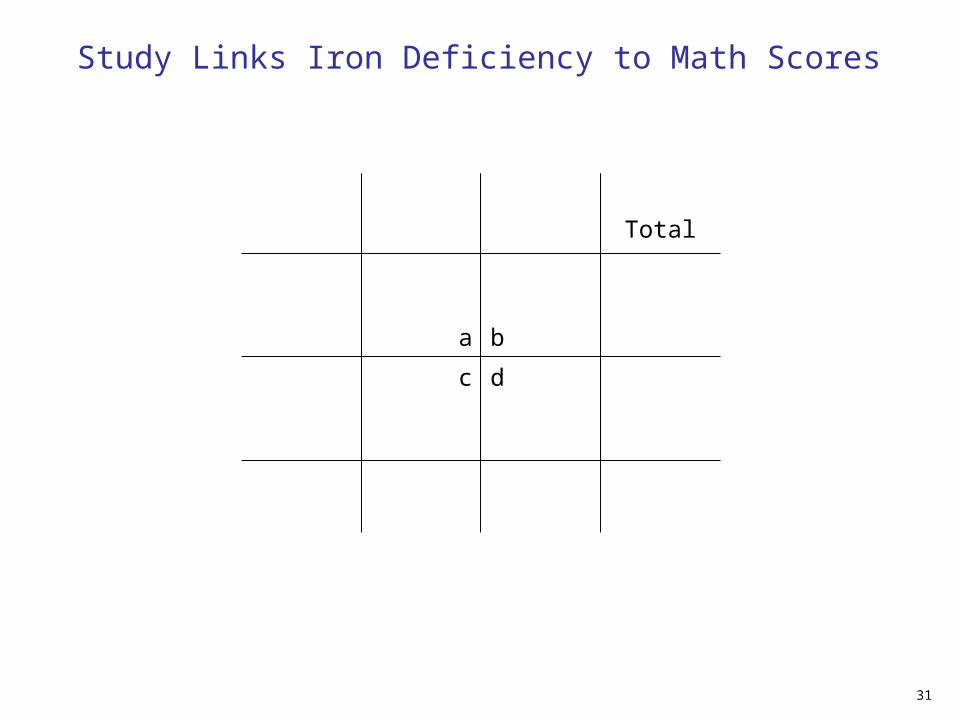
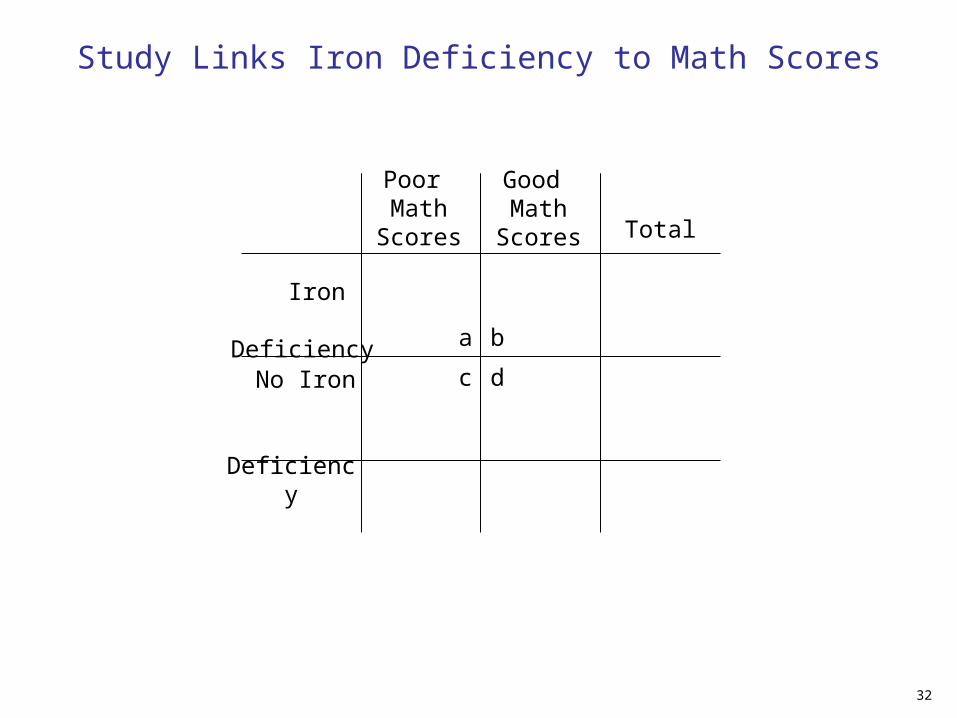
Study Links Iron Deficiency to Math Scores
Iron Deficiency
Poor Math
Scores
No Iron
Deficiency
Good Math
Scores Total
32
a b
dc
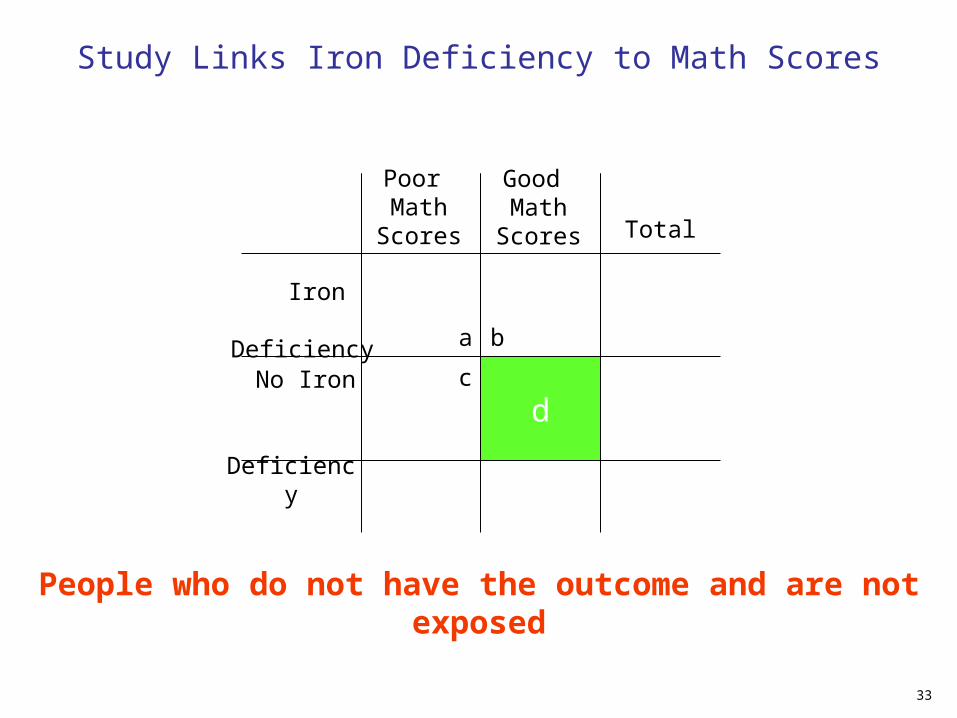
People who do not have the outcome and are not exposed
d
Study Links Iron Deficiency to Math Scores
Poor Math
Scores
Good Math
Scores Total
33
No Iron
Deficiency
Iron Deficiency
a b
dc
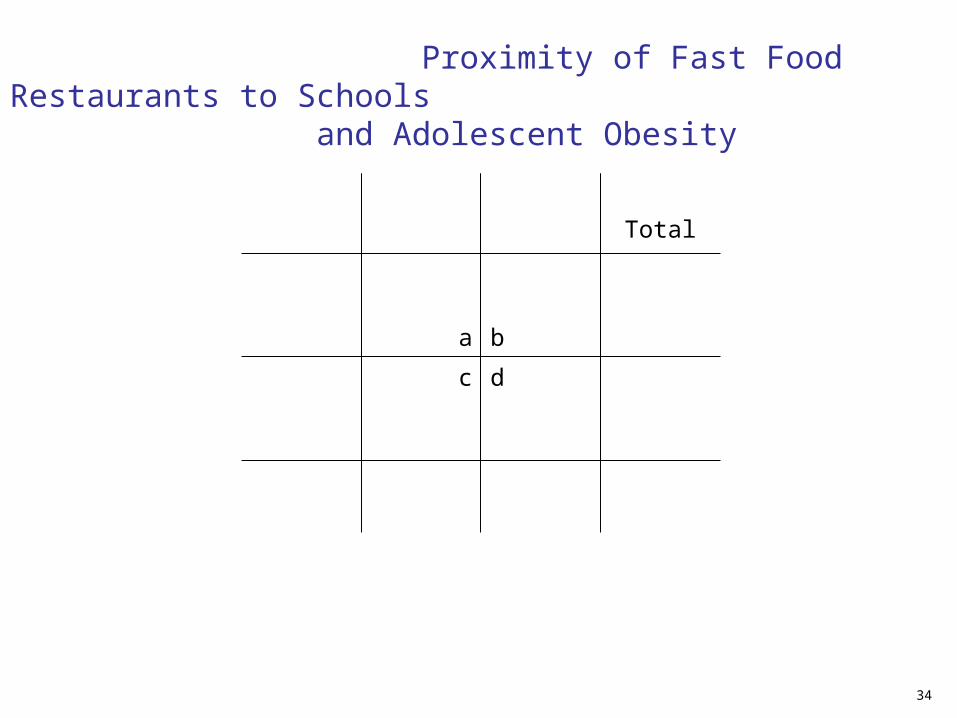
Proximity of Fast Food Restaurants to Schools and Adolescent Obesity
Total
34
a b
dc
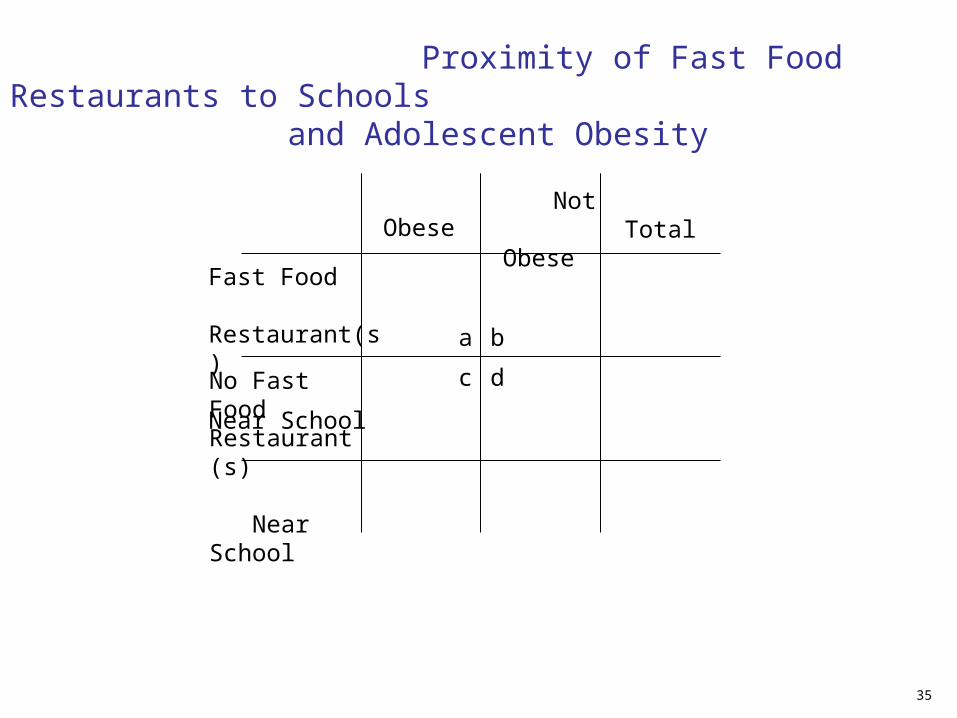
Proximity of Fast Food Restaurants to Schools and Adolescent Obesity
Obese Not Obese Total
35
Fast Food Restaurant(s) Near SchoolNo Fast Food Restaurant(s) Near School
a b
dc
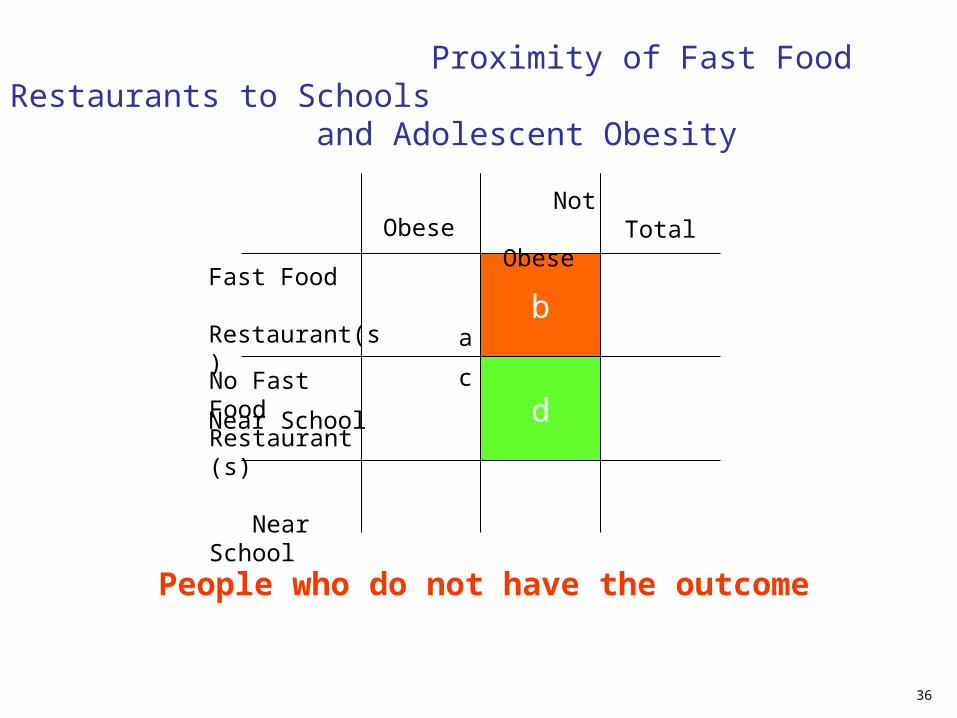
People who do not have the outcome
d
b
Proximity of Fast Food Restaurants to Schools and Adolescent Obesity
Obese Not Obese Total
36
Fast Food Restaurant(s) Near SchoolNo Fast Food Restaurant(s) Near School
a b
dc
Total
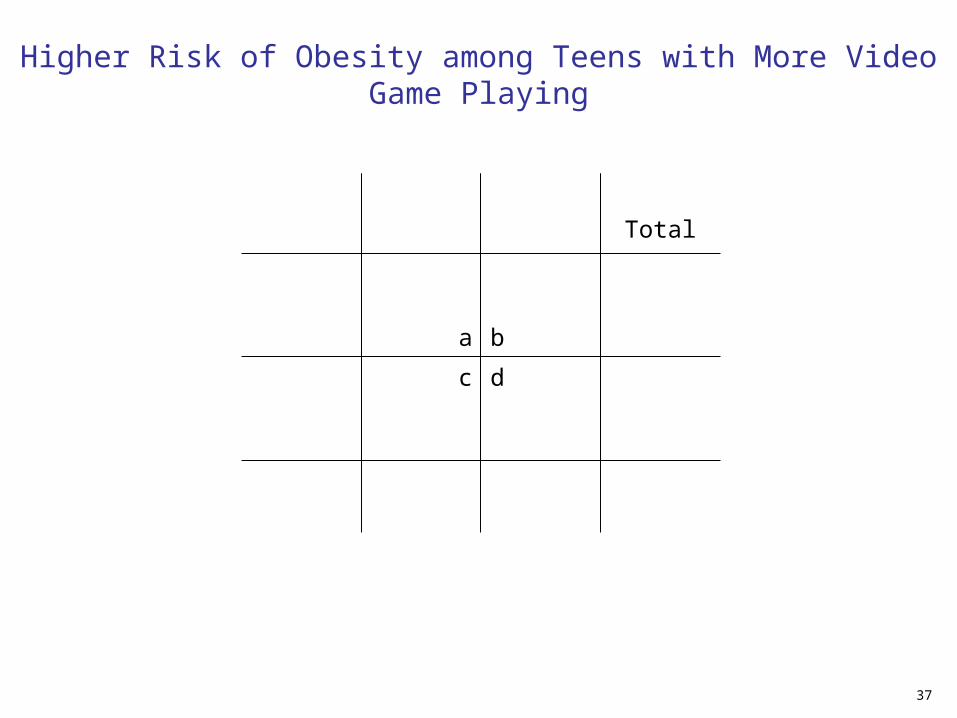
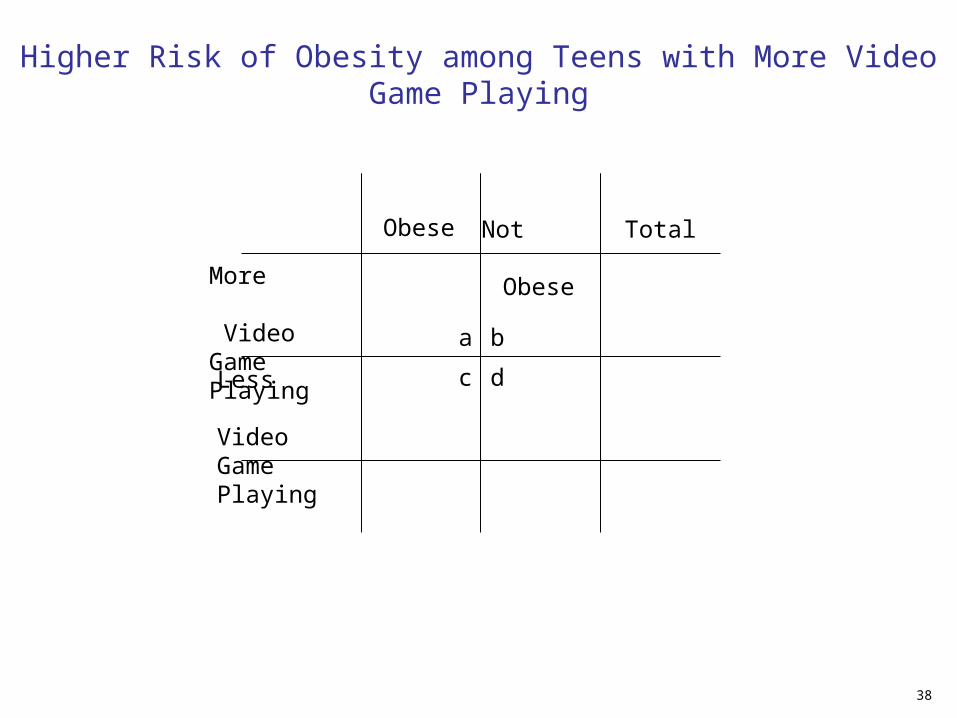
Higher Risk of Obesity among Teens with More Video Game Playing
37
a b
dc
More Video Game Playing
Obese
Less Video Game Playing
Not
ObeseTotal
38
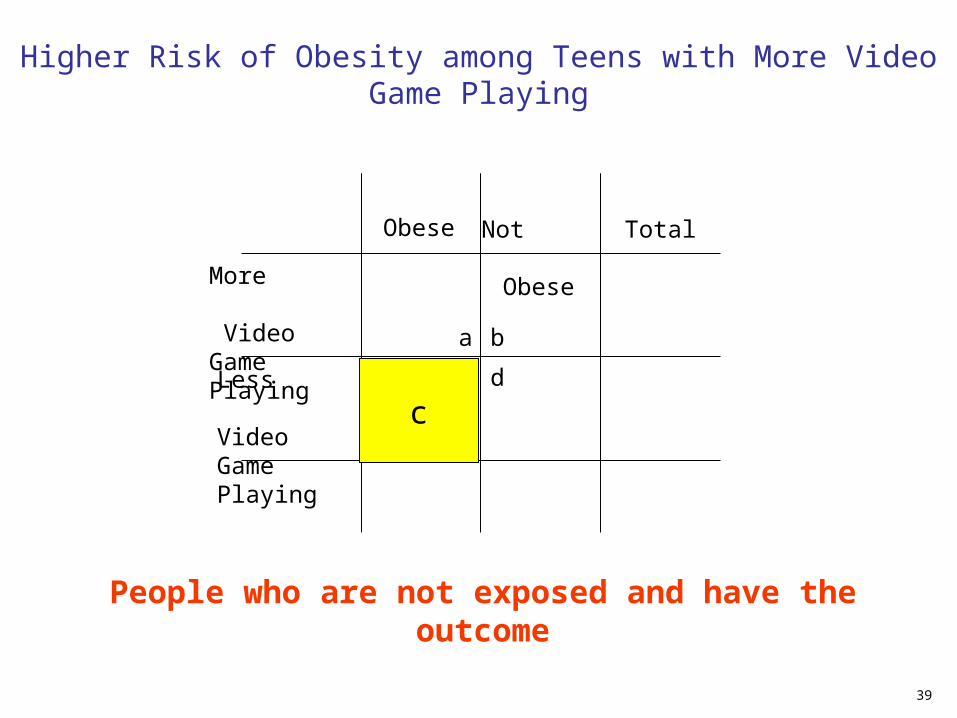
Higher Risk of Obesity among Teens with More Video Game Playing
a b
dc
Obese Not Obese Total
People who are not exposed and have the outcome
c
39
Higher Risk of Obesity among Teens with More Video Game Playing
More Video Game Playing
Less Video Game Playing
40
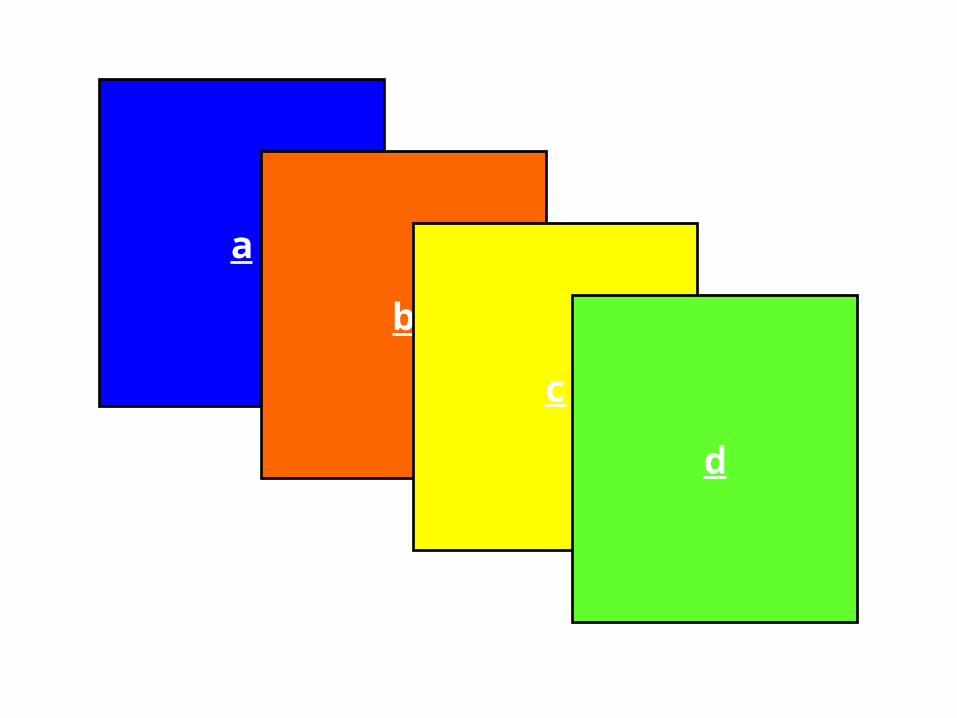
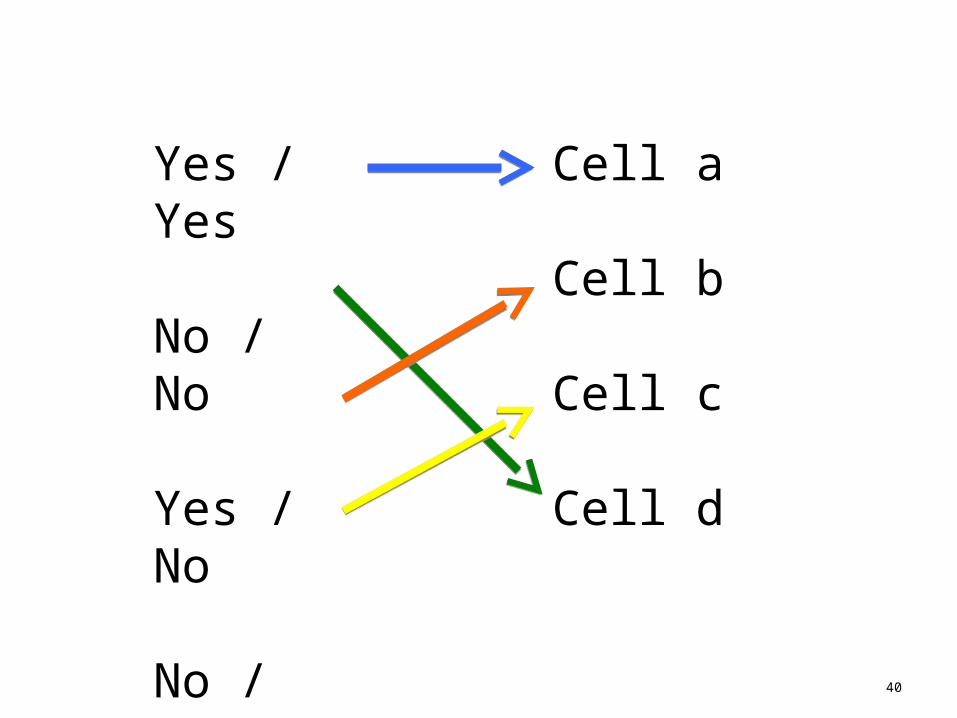
Yes / Yes
No / No
Yes / No
No / Yes
Cell a
Cell b
Cell c
Cell d
41
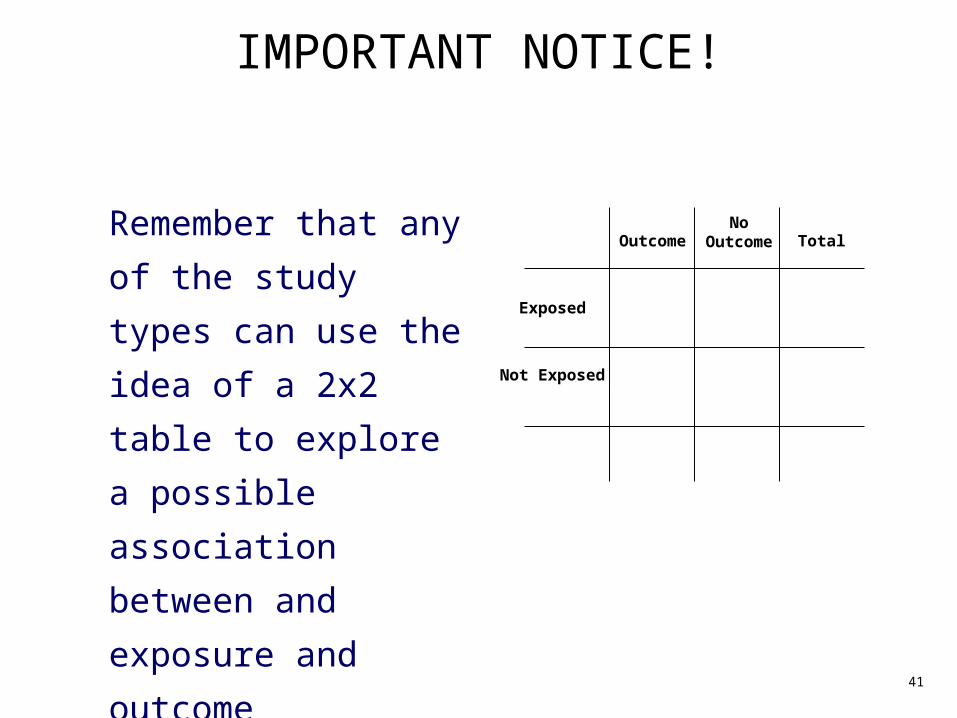
Exposed
Not Exposed
OutcomeNo
Outcome Total
IMPORTANT NOTICE!
Remember that any of
the study types can
use the idea of a 2x2
table to explore a
possible association
between and exposure
and outcome
Breakout Assignment
2x2 table
42
From answers to counts
Data into 2x2 Table
CDC
43
44
-
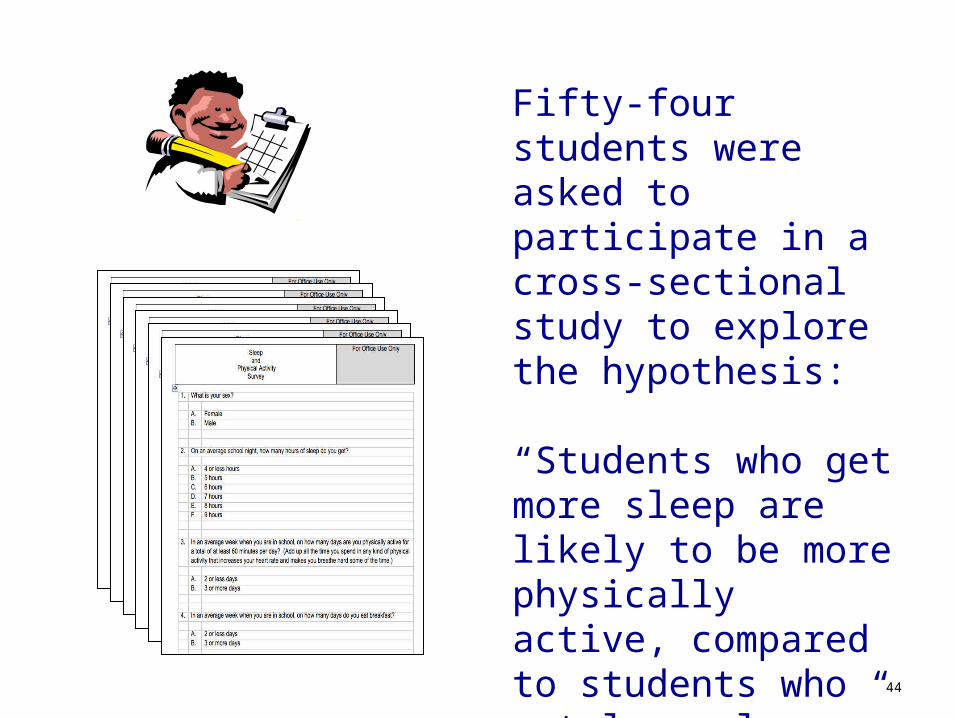
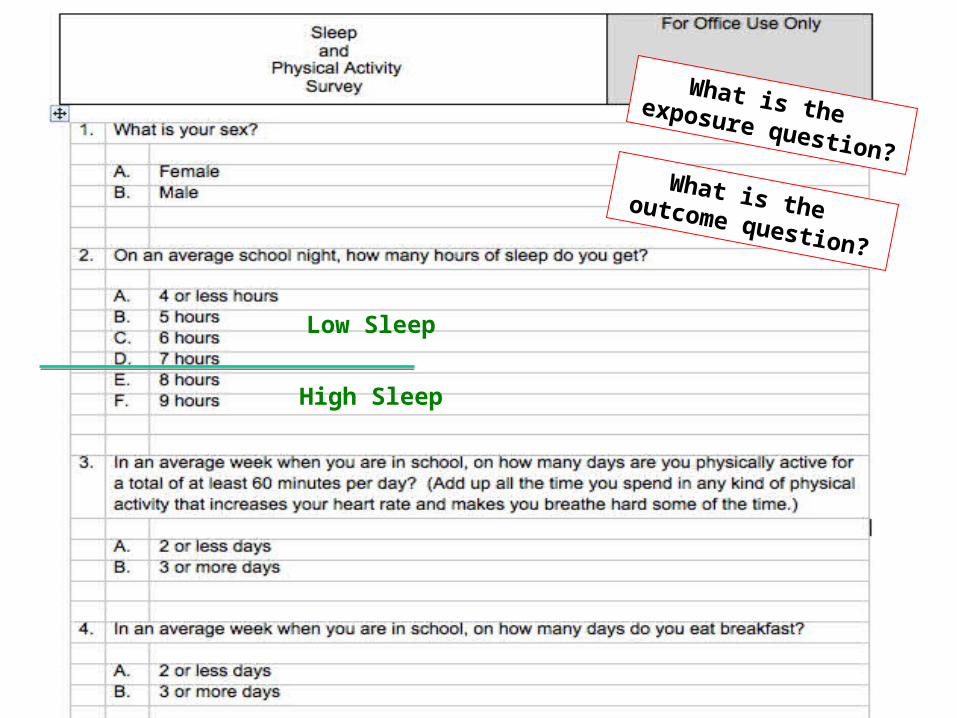
Fifty-four students were asked to participate in a cross-sectional study to explore the hypothesis:
“Students who get more sleep are likely to be more physically active, compared to students who get less sleep.”

What is the exposure question?
What is the outcome question?
46
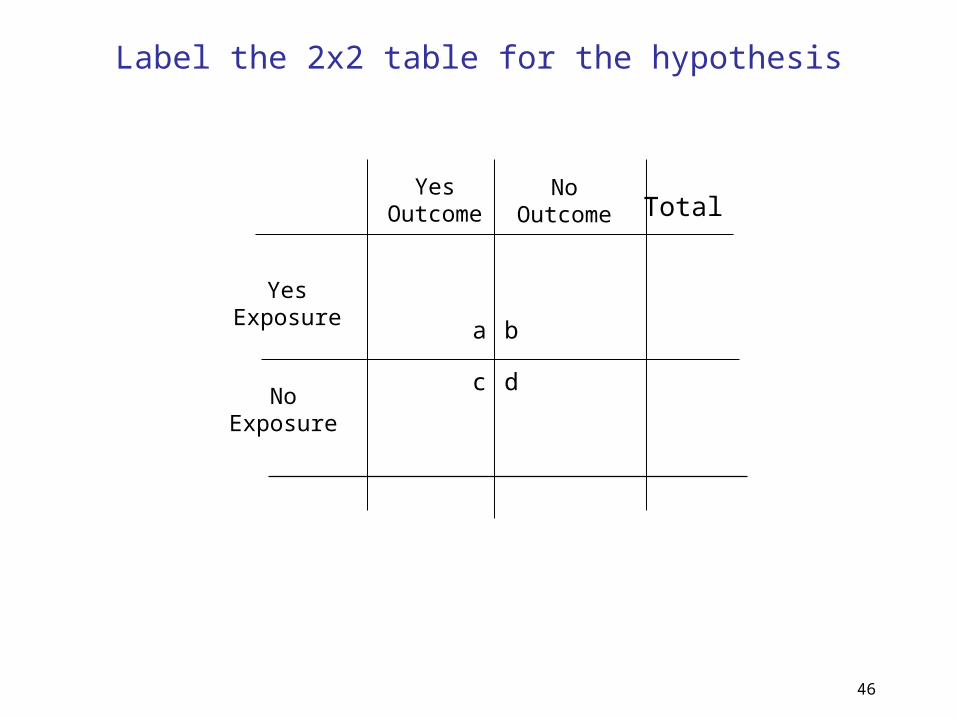
Yes Exposure
Yes Outcome Total
No Outcome
No Exposure
a b
dc
Label the 2x2 table for the hypothesis
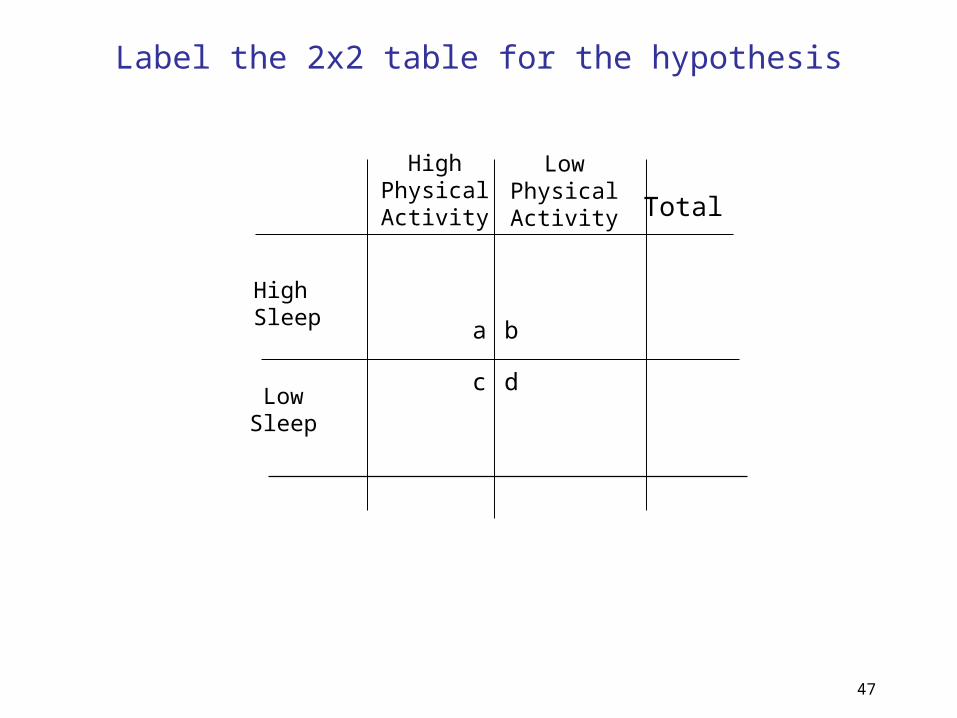
47
High Sleep
High Physical Activity Total
Low Physical Activity
Low Sleep
a b
dc
Label the 2x2 table for the hypothesis
What is the exposure question?
What is the outcome question?
Low Sleep
High Sleep
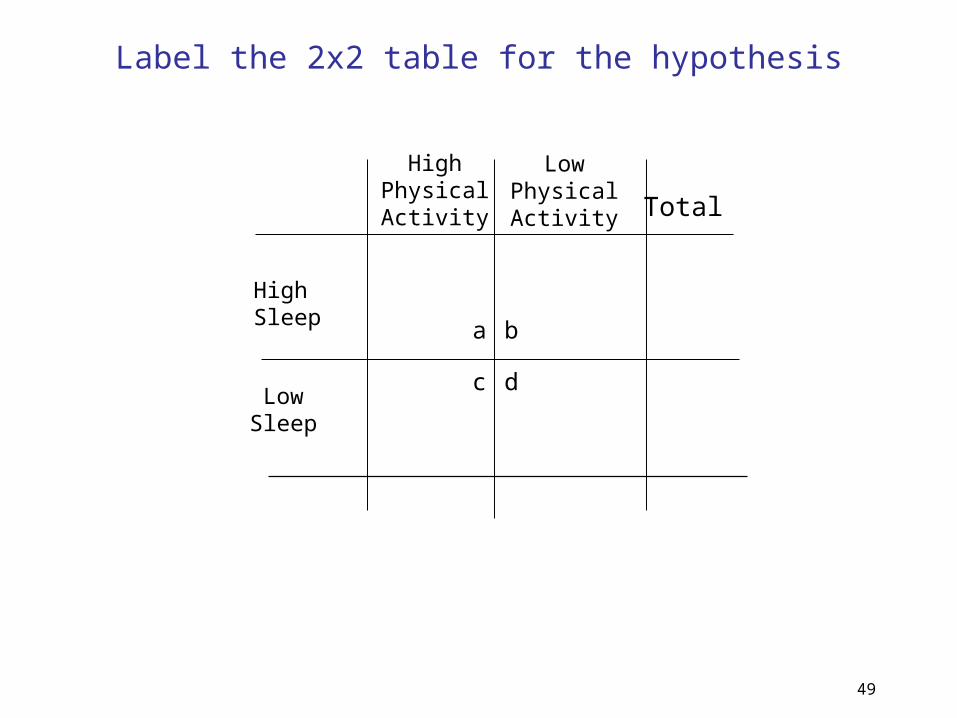
49
High Sleep
High Physical Activity Total
Low Physical Activity
Low Sleep
a b
dc
Label the 2x2 table for the hypothesis
50
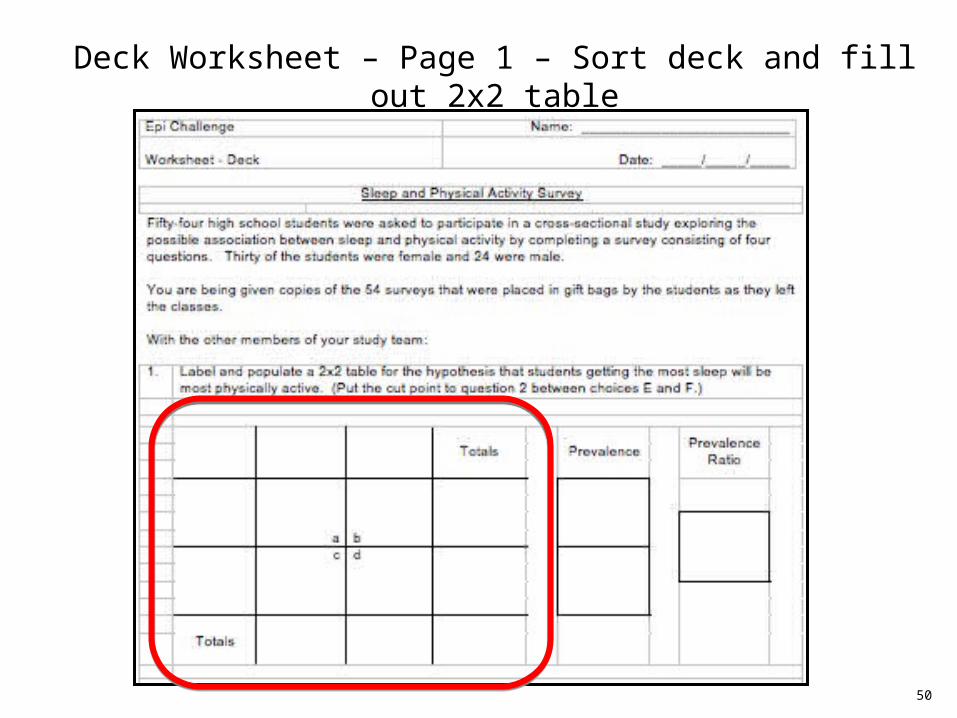
Deck Worksheet – Page 1 – Sort deck and fill out 2x2 table
51
• For each survey, figure out which 2x2 table cell the respondent belongs (a, b, c, or d
• Write the correct letter of the cell in the upper left hand corner of each sheet
• Sort the 54 cards by cell letter
• Add up the numbers for each cell and fill in the 2x2 table accordingly
-
52
Missing answers?
-

53
Compare answers from the other
teams in your school.
-