Embed Size (px)
Citation preview

Dayton Water Quality and Infrastructure Review
Prepared for:
Dayton Water User
Committee
FINAL
October 11, 2021

Dayton Water Quality and Infrastructure Review
Page | ii
Blank Page

Dayton Water Quality and Infrastructure Review
FINAL
Prepared for:
Dayton Water User Committee
October 11, 2021

Dayton Water Quality and Infrastructure Review
Page | iv
Blank page

Dayton Water Quality and Infrastructure Review October 11, 2021
Page | v
TABLE OF CONTENTS
1 Introduction ................................................................1
1.1 Objectives ............................................................................ 1
1.2 Background ......................................................................... 2
1.3 Methods ............................................................................... 5
1.4 Key Take Aways................................................................... 5
2 Infrastructure Review ................................................ 7
2.1 System Description ............................................................. 7
2.2 Recent Water System Outages ........................................... 7
2.3 Water Treatment Plants ..................................................... 8
2.4 Distribution System ............................................................ 9
2.5 Water Storage Tanks ......................................................... 10
2.6 Water Distribution System Hydraulic Model ................... 11
2.7 Distribution System Surge Analysis................................. 13
2.8 Large Diameter Transmission Main Condition Assessment ....................................................................... 13
2.9 Regulatory Compliance Review ....................................... 13
2.10 Asset Management Plan ................................................. 14
2.11 Capital Improvement Plan ............................................. 15
2.12 Valve Exercising Program .............................................. 16
2.13 Emergency Preparedness ............................................... 16
2.14 System Operation and Controls ..................................... 17
2.15 Cyber Security ................................................................. 17
2.16 Gap Analysis .................................................................... 17
3 Groundwater .............................................................19
3.1 Source Water Protection................................................... 19
3.1.1 Ordinances ............................................................... 21
3.1.2 Groundwater Monitoring........................................ 21
3.1.3 2015 SWPP Amendment ......................................... 22
3.1.4 Source Water Protection Delineation Model ......... 22
3.2 Water Quality Monitoring ................................................ 26
3.2.1 Ohio EPA ................................................................. 26
3.2.2 City of Dayton .......................................................... 27
3.2.3 Montgomery County ...............................................28
3.2.4 Miami Conservancy District ...................................28
3.2.5 Groundwater Consortium (Cincinnati area) ......... 29
3.3 Water Quality Challenges ................................................. 29
3.3.1 Pharmaceuticals ...................................................... 29
3.3.2 Nitrate ..................................................................... 30
3.3.3 PFAS Substances ..................................................... 31
3.3.4 City of Dayton PFAS Related Lawsuits .................. 36
3.4 PFAS Regulation ............................................................... 36

Dayton Water Quality and Infrastructure Review October 11, 2021
Page | vi
4 Surface Water ........................................................... 39
4.1 Existing Conditions ........................................................... 39
4.2 Water Quality Monitoring ............................................... 40
4.2.1 Hydrology ............................................................... 40
4.2.2 Water Quality .......................................................... 42
4.3 Issues ................................................................................. 44
4.3.1 Risks to the BVA from the Great Miami River ...... 45
4.3.2 Risks to the Great Miami River (and Tributaries) from the BVA ............................................................. 45
4.3.3 Cross-Contamination Mechanisms ........................ 45
5 Conclusions ............................................................... 51
5.1 Infrastructure .................................................................... 51
5.2 Source Water Quality ........................................................ 52
6 Dayton Water User Committee ................................. 55
7 References ................................................................ 57
LIST OF FIGURES
Figure 1. Great Miami Watershed and Buried Valley Aquifer. ..... 3 Figure 2. City of Dayton Well Fields (City of Dayton, 2012 Water
Quality Report). ....................................................................... 4 Figure 3. City of Dayton Source Water Protection Area (City of
Dayton). ................................................................................ 20 Figure 4. City of Dayton well fields/monitoring locations and
time-of-travel (TOT) boundaries based on 2011 modeling
results (City of Dayton, 2021 Communication). .................. 23 Figure 5. USGS 2007 model output showing simulated recharge
areas and flow pathlines for select production wells and well
clusters in the Dayton area. .................................................. 25 Figure 6. Ohio EPA Groundwater Monitoring Locations in the
Dayton region (OEPA interactive map (dark
green=interbedded carbonate/shale, light green=carbonate
aquifer, blue circles=unconsolidated (sand and gravel)
wells, green triangles=carbonate wells). .............................. 26 Figure 7. MCD Groundwater Monitoring Well Locations (MCD,
2020). .....................................................................................28 Figure 8. Nitrate concentrations detected in MCD monitoring
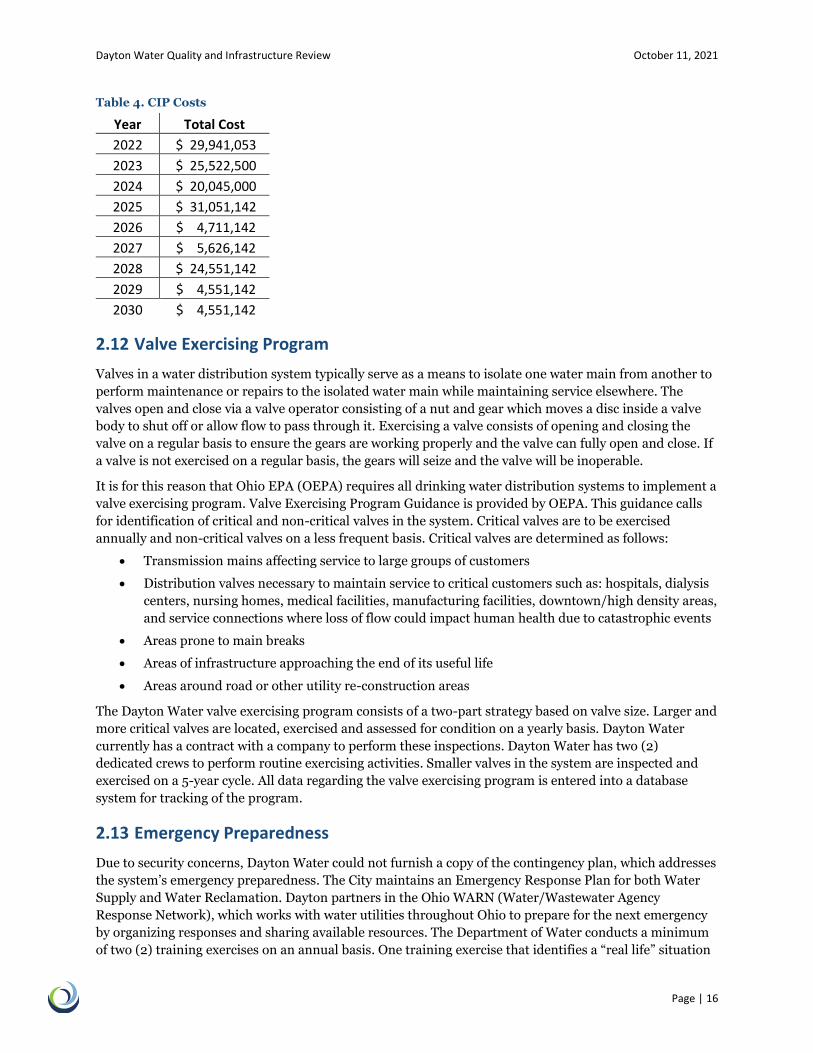
wells from 2014 to 2020. ...................................................... 31 Figure 9. Ottawa Water Treatment Plant PFAS Results (2019-
2021). ..................................................................................... 32 Figure 10. Mad River Well Field Location Map (Wood, 2018). .. 32 Figure 11. Aqueous Film Forming Foam (AFFF) areas (yellow
shaded) at WPARB (WPARB, 2020 - presentation). .......... 34
Figure 12. WPAFB areas included in the Remedial Investigation
(in purple) (WPAFB 2020 Presentation). ............................ 35

Dayton Water Quality and Infrastructure Review October 11, 2021
Page | vii
Figure 13. Connection between Great Miami River and Buried
Valley Aquifer (source: City of Dayton). .............................. 39
Figure 14. USGS Gages on the Great Miami River and its
Tributaries. ............................................................................ 41
Figure 15. Real-time Hydrograph Conditions at the USGS Gage
on the Great Miami River (03270500) in Dayton, OH. ...... 42 Figure 16. Water Quality Sampling Locations in the Great Miami
River Watershed. ................................................................... 43 Figure 17. Wastewater-Related Potential Pollution Pathways of
Contamination. ...................................................................... 47
Figure 18. Potential Pollution Pathways by NPDES Point
Sources. ................................................................................. 48 Figure 19. Stormwater-Related Potential Pollution Pathways of
Contamination. ...................................................................... 49
Figure 20. Potential Pollution Pathways Due to Spills and
Releases Reported to OEPA Since 2017. .............................. 50
LIST OF TABLES
Table 1. City of Dayton – Water Tank Storage. ............................ 10 Table 2. City of Dayton – Water Reservoir Storage. ..................... 11 Table 3. Dayton Water System Storage Analysis. ........................ 12 Table 4. CIP Costs .......................................................................... 16 Table 5. Preliminary Cost Estimate for Redundancy at GMWS . 18 Table 6. OEPA Ambient Ground Water Monitoring Locations .. 26 Table 7. City of Dayton PFAS Sampling Results. ......................... 27 Table 8. PFAS Concentrations at City of Dayton Fire Training
Center (Wood, 2018). ............................................................ 35 Table 9. PFAS Action Levels for Ohio. ......................................... 37

Dayton Water Quality and Infrastructure Review October 11, 2021
Page | viii
Blank page

Dayton Water Quality and Infrastructure Review October 11, 2021
Page | 1
1 Introduction
In 2020 a regional committee of business members was put in place by Congressman Mike Turner, and
tasked with review of the City of Dayton’s water utility management practices relative to water quality and
related long-term infrastructure management. The purpose of the Dayton Water User Committee is to
ensure and/or validate the overall sufficiency of water utility management practices to support ongoing
economic and quality of life factors for businesses and residents in the Dayton metropolitan area.
LimnoTech and American Structurepoint were hired by the committee to conduct the review and to
summarize the current and future preparedness of regional utilities to deliver high water quality through
reliable and resilient infrastructure for decades to come. The economic success and quality of life for
metropolitan Dayton depends upon access to a reliable supply of safe high-quality water for residents and
businesses in the region. Water is not only essential to maintain life and a quality of life for residents, but
also for the overall economic vitality of the region. The stated intent of the study is to answer the question:
are the region’s water systems built, being maintained, and changing to meet the area’s needs today and
50 years from today?
1.1 Objectives
The Committee members stated the following needs and concerns:
• The results of this review will be used to address funding requirements for identified needs.
• It is important to build better confidence for the water users in the business community, which
will aid in economic development.
• Residents need to feel safe and know that their drinking water is of high quality.
• There is a concern that drinking water quality issues will ultimately require improvements that
can affect the water price.
• There are concerns related to the aging infrastructure and the cost of potential issues related to
the aging infrastructure.
The purpose of this report is to document the LimnoTech team findings with respect to these needs and
concerns. This was accomplished by reviewing available information and conducting interviews with key
people in the region to gain an understanding of the condition of the Buried Valley Aquifer (BVA), which
serves as the sole source of the City’s drinking water, identify potential threats to the BVA, assess the
condition and resiliency of the City of Dayton water utility, and identify gaps in or potential threats to the
resiliency of the BVA as a source water and the drinking water. Additional funding may provide a means
to effectively address the gaps and looming threats.
The report includes the following sections:
• Infrastructure Review and Assessment
• Groundwater Quality Review and Assessment
• Surface Water Quality Review and Assessment
• Conclusions

Dayton Water Quality and Infrastructure Review October 11, 2021
Page | 2
1.2 Background
The headwaters of the Great Miami River are near Indian Lake, located approximately 70 miles northeast
of Dayton, Ohio. The river flows 170 miles southwest to the confluence with the Ohio River, west of
Cincinnati, Ohio. The Great Miami River watershed covers 3,946 square miles in southwest Ohio and
includes all or part of 16 counties. Land use in the watershed is 68% agricultural, 18% developed urban
and 14% of the area is forested, open water, wetlands and other. There are 6,600 miles of rivers and
streams within the watershed.
The Great Miami Buried Valley Aquifer (BVA) is one of the most productive sources of groundwater in the
Midwestern United States and essentially follows the course of the Great Miami River (Figure 1). The
aquifer averages two miles in width and 150 to 200 feet in depth. It consists of unconsolidated sand and
gravel units developed in valleys that were cut from bedrock by pre-glacial and glacial streams,
subsequently backfilled with deposits of sand, gravel and other glacial drift by glacial and alluvial
processes as the glaciers advanced and receded. This geology means that the aquifer can both store a lot of
water and be readily replenished or recharged when water is pumped out. The aquifer stores 1.5 trillion
gallons of water and yields are in excess of 2,000 gallons per minute in wells located near large streams.
The entire BVA supplies drinking water to more than 2.3 million people.
The City of Dayton, Ohio provides drinking water to approximately 440,000 people in Montgomery
County and beyond, from the Great Miami Buried Valley Aquifer. Water is pumped to two drinking water
treatment plants from the Miami Well Field and the Mad River Well Field (Figure 2). Near the well fields,
the aquifer is unconfined to semi-confined with a depth to groundwater ranging from 10 to 55 feet below
ground surface. The United States Geological Survey (USGS) has reported that the water table fluctuates
approximately 5 to 15 feet annually, generally rising during the winter and spring and falling during the
summer and autumn. The fluctuation is greatest in the areas where groundwater is being pumped or
where the aquifer is semi-confined.
The City of Dayton has over 100 large capacity, gravel packed production wells, which makes Dayton one
of the largest systems in the country relying on groundwater. The pumping capacity of each well ranges
from 1 to 4 million gallons per day (MGD). The City enhances the aquifer recharge in the vicinity of the
well fields with artificial/induced recharge lagoons and ponds. The Mad River Well Field recharge lagoons
are the prominent ponds adjacent to the river in Figure 2. The Great Miami River and Mad River each
feed a series of excavated channels to infiltration lagoons and ponds throughout the Miami and Mad River
Well Field properties, respectively. This practice has been in place since the 1920s.

Dayton Water Quality and Infrastructure Review October 11, 2021
Page | 3
Figure 1. Great Miami Watershed and Buried Valley Aquifer.

Dayton Water Quality and Infrastructure Review October 11, 2021
Page | 4
Figure 2. City of Dayton Well Fields (City of Dayton, 2012 Water Quality Report).

Dayton Water Quality and Infrastructure Review October 11, 2021
Page | 5
1.3 Methods
The Water Quality and Infrastructure Review was conducted by reviewing available documents related to
BVA studies, as well as planning documents and performance studies from Dayton Water. In addition,
interviews were conducted with key technical experts to obtain information regarding the current state of
water quality and infrastructure, their reliability and resiliency for the region and suggestions for
documents or supporting information to review. Current practices were also reviewed to: 1) Compare
emergency preparedness to industry standards; 2) determine Asset Management Plan compliance; and 3)
determine regulatory compliance.
Over the course of the study the team reviewed over 100 documents from the following sources:
Ohio EPA
City Reports and Sample Results
Miami Conservancy District
WPAFB Reports
USGS Reports
The team also interviewed representatives of the following groups:
City of Dayton Environmental Group
City of Dayton Operational Group
Montgomery County
Ohio EPA
Miami Conservancy District
WPARB
City of Dayton Hydrogeologist
Dr. Mohamed Reza Soltanian (UC)
Dr. Robert Ritzi (WSU)
In May 2021 the team also participated in a tour of the Ottawa and Miami Water Treatment Plants as well
as the well fields.
1.4 Key Take Aways
The key take aways identified by the water quality and infrastructure review include the following:
• The qualities that make the Buried Valley Aquifer such a valuable source of drinking water to the
area-abundance, ease of access and pumping, fast recharge-also make it vulnerable.
• The amount of monitoring to detect contamination and intervene is very high, indicating that
threats to the water supply can be caught early and adjustments to operations made accordingly.
• PFAS is emerging as the most challenging water quality concern, due to its ubiquitousness, the
lack of regulatory standards, and the strained relationship between the City and the Wright
Patterson Air Force Base in addressing the existing PFAS contamination. Nevertheless, nitrate,
identified for years as a key pollution threat, also remains an important concern.
• The potential for lower PFAS action levels or standards could become an issue for the Ottawa
Water Treatment Plant.

Dayton Water Quality and Infrastructure Review October 11, 2021
Page | 6
• Because the BVA and Great Miami River have a strong hydrogeologic connection, surface water
contamination has the potential to also affect the BVA. The primary pollutants of concern to the
Great Miami River and its tributaries are E. coli and phosphorus, which are less of a concern in
the BVA. Nitrate, chloride, PFAS and other emerging contaminants are also concerns in local
surface waters and bear watching because of the potential for migration to the BVA.
• The City’s distribution infrastructure scores well using standard metrics. Maintaining the asset
management program and continued investment are key to long-term resiliency of the drinking
water system.
• Based on this initial assessment of the data, the City of Dayton has a lot of redundancy built into
their treatment and distribution systems, which gives them great flexibility to manage their
operations and address issues. However, catastrophic events such as the 2019 tornados has
exposed the vulnerable areas of the water system where improvements may be needed.
• Investments on the order of $64 million have been identified to support system resiliency in
terms of power redundancy, water distribution redundancy, etc., within the Montgomery County
Greater Moraine Service Area.

Dayton Water Quality and Infrastructure Review October 11, 2021
Page | 7
2 Infrastructure Review
2.1 System Description
The City of Dayton, Department of Water (Dayton Water) owns and operates two (2) water treatment
facilities, the Miami and Ottawa Water Treatment Plants (WTP). Each WTP has a design capacity of 96
million gallons per day (MGD). Treated water is distributed to the City of Dayton, Montgomery County
Greater Moraine Service Area, and surrounding areas. The system provides wholesale water to the
following surrounding communities:
• Brookville
• Clayton
• Green County
• Miamisburg (emergency standby)
• Oakwood (emergency standby)
• Trotwood
• Vandalia (emergency standby)
• West Carrollton (only a small area within West Carrollton, near the West Carrollton High School, uses Dayton water. Dayton’s water to this area is supplied by Montgomery County.
The combined system is comprised of both the City of Dayton and Montgomery County and includes the
following assets:
• Four (4) clear wells at the two (2) WTP sites,
o 20 MG of storage capacity at the Miami WTP and
o 10.8 MG at the Ottawa WTP
• Three (3) pump stations to supply water from the treatment plants to the distribution system
• Twenty One (21) pump stations in the distribution system
• Twenty Eight (28) storage tanks/reservoirs with sizes varying from 0.5 MG to 16 MG, and
• 2,100 miles of water main ranging in size from 4-inch to 54-inch.
2.2 Recent Water System Outages
There have been three (3) recent events that have caused major water system outages to the Dayton Water
customers. Below is a summary of each event.
1. 36-inch Water Main Break
On February 13, 2019 the City of Dayton experienced a break to a section of a 36-inch high pressure water
main that runs parallel to the Great Miami River. This break resulted in the loss of nearly 150,000,000
gallons of water before the repair was completed. The system returned to normal operations on February
15, 2019.
2. The Memorial Day Tornados of 2019
A series of tornados swept through the area causing damages that resulted in the loss of power to both of
the City of Dayton’s Water Treatment Plants. The loss of power at the Miami Treatment Plant, coupled
with severe flooding and equipment damage to the Ottawa Treatment Plant, resulted in the loss of water
supply to the distribution system for 13.5 hours requiring a boil advisory for nearly 400,000 customers.
The City of Dayton’s staff preparedness for emergencies led to quick recovery from the devastation: the

Dayton Water Quality and Infrastructure Review October 11, 2021
Page | 8
Ottawa Treatment Plant began supplying water to the distribution system within 38 hours and the Miami
Treatment Plant within 13.5 hours. Around the clock in-house plant and distribution testing ensured that
the boil advisory was lifted for individual areas as test results confirmed the water was safe. The City of
Dayton quickly prepared a GIS mapping tool for customers within the City of Dayton limits to determine
that the boil advisory was lifted for a particular address. This tool was expanded to include Montgomery
County customers.
3. 48-inch Water Main Break
In August 2020, the City of Dayton experienced a water main break at Keowee near Ottawa WTP which
resulted in a disruption of service.
The primary objective of the infrastructure review is to gain insight as to how these events occurred, and
develop of framework of considerations moving forward to identify areas of improvement to prevent
events of this magnitude from happening again.
2.3 Water Treatment Plants
The City of Dayton has two (2) well fields, Mad River Well Field and Miami Well Field, that supply
groundwater to the two (2) WTPs. The WTPs are considered to be groundwater under direct influence of
surface water and therefore must comply with surface water treatement rules and regulations. At the
WTPs, the raw ground water goes through lime softening, settling, filtration and gaseous chlorine
disinfection processes to make finished water. Finished water is then pumped to transmission mains,
storage and distribution mains leading to the service connections of each customer. The finished water
has a pH of 8.6 to 8.8 which adds scaling to the distribution mains for lead and copper control.
Average daily water demand ranges between 60-65 MGD and as previously mentioned, each WTP has a
design treatment capacity of 96 MGD. The City’s two WTPs are arranged to be 100% redundant of each
other for short durations. Each WTP has utility power redundancy so that if power from one supplier is
lost, power is provided from the other supplier automatically. Dayton Water does not have complete
stand-by or back-up power.
Shortly after the Memorial Day tornado event that disrupted power to both plants, a technical memo was
prepared for Dayton Water to provide an overview of the WTP emergency power. The Dayton Water
System power supply strategy was compared to similar size systems within the State of Ohio such as
Columbus, Cleveland, Cincinnati, Toledo and Akron. Although Dayton’s system has treatment and power
redundancy, it does not have true stand-by or back-up generators to power the WTP processes and
pumping during rare probability events such as tornados. Of the other major Ohio cities, only Cleveland
compares to Dayton’s 100% redundancy in WTP capacity. Dayton’s full WTP redundancy reduces the risk
of an entire system interruption. Although at the time of the Memorial Day Tornado’s Dayton did not have
complete stand-by or back-up power, it had sufficient back-up power for all but a very rare probability of
total power interruption. Dayton has other advantages such as stored finished water in the distribution
system and arrangements with other utilities for generators that enables Dayton to effectively manage a
large percentage of power interruptions. With the introduction of the new generator’s thru the EDA
grant, Dayton will have an increased level of redundancy in both water treatment capacity and electricity
back-up.
An AACE Class 5 conceptual level cost estimate to provide stand-by power to both WTPs was estimated to
be approximately $9.2 Million for each WTP for a total of $18.4 Million. The cost to provide permanent
standby power to the wellfields is approximately $26.4 Million. Providing 100% back-up power from
generators at Ottawa and Miami Water Treatment Plants and well fields would cost approximately $44.8
million.

Dayton Water Quality and Infrastructure Review October 11, 2021
Page | 9
After the 2019 tornadoes, the City of Dayton was awarded a Grant of $3,600,000 with a match from the
City of $900,000 for improvements to accommodate back-up power to provide a minimum level of
service of 40 MGD (20 MGD per treatment plant). This minimum level of service is intended to provide
fire protection while also establishing water conservation efforts during a system outage.
The project will install five (5) generators described as follows:
• Miami Treatment Admin/Testing Facility – 350 kW Generator with 480 Volt Switch Gear to
support interior lighting and testing equipment.
• Miami Treatment Plant – 1000 kW Generator with 4160 Volt Switch Gear to support treatment
operations including chemical feed automation and SCADA.
• Miami Pump Station – 1500 kW Generator with 4160 Volt Switch Gear to support pumping
operations to the water distribution system to maintain a minimal level of service (pressure
requirements and fire protection).
• Ottawa Treatment Plant - 1000 kW Generator with 4160 Volt Switch Gear to support treatment
operations including chemical feed automation and SCADA.
• Ottawa Pump Station - 1500 kW Generator with 4160 Volt Switch Gear to support pumping
operations to the water distribution system to maintain a minimal level of service (pressure
requirements and fire protection).
Understanding the need for additional power resiliency in response to changing weather patterns, Dayton
Water will be implementing additional measures to provide back-up generators at booster stations and
reservoirs. The Anderson, Beatrice, Burkhardt, Germantown, McCall, Reade & Westbrook booster
stations do not have permanent generators installed. The Water Facilities Master Plan that is currently in
progress will include reviewing back-up power at the stations listed. Dayton Water is in the design stages
to install back-up power at the Anderson Reservoir, which is currently under rehabilitation.
2.4 Distribution System
The Dayton Water uses the AWWA Water Integrity Rate (WIR) as a benchmark for performance of the
distribution system. The WIR is defined by the number of pipe leaks in addition to the number of pipe
breaks divided by total miles of pipe within the distribution system. In this scoring system, a lower value
corresponds to a stronger rating than a higher value. The City of Dayton’s distribution system has
approximately 800 miles of water main. The AWWA target for water integrity within a distribution
system is between 22.9 and 78.7. The City’s 2019 water integrity rate was 20.7. These water integrity rates
exceed the standards recommended by AWWA.
The City’s plan for 2021 is to continue to maintain and upgrade the water distribution system to minimize
breaks and leaks in addition to maintaining their water valve maintenance program. The valve
maintenance program will aid the City in the repair and rehabilitation of large diameter water mains. The
City’s current scoring criteria to identifying risk of water main failure include the location, size,
redundancy, threat to public safety, impact on customers, material, and the probability of failure based on
the water model of each main. Ultimately, the risk score is equal to the consequence of failure multiplied
by the likelihood of failure.
In 2020, Dayton Water responded to 46 water main breaks within their distribution system within 90
minutes while responding to all complaints within 24 hours. Of the 347 water service leaks investigated,
Dayton Water replaced 170 services. The annual number of breaks since 1998 is declining, however the
number of breaks will vary from year to year. The number of breaks can deviate by 30 to 40 breaks per

Dayton Water Quality and Infrastructure Review October 11, 2021
Page | 10
year depending on the two years compared. Using a ten-year average from 2000 to 2020, the number of
annual breaks has declined from 130.4 to 113.6, a ~15% reduction.
In 2018, the City entered into a Professional Service Agreement with Pure Technologies to condition
assess the 48” water main between Miami WTP and Ottawa WTP. The work was completed in 2019 and
the contract was closed in September 2019. The City is preparing an RFP to perform electromagnetic
inspections of large diameter mains. Dayton is also in the process of awarding a “smart meter” contract to
review existing meters and install additional sensors and meters across the distribution network to better
understand the large diameter network and where improvements may be necessary.
Although the number of breaks is on the decline, a major break occurred on a 36-inch water main that
runs along the Great Miami River Corridor. This break seems to be related to river bank erosion that
could have been exacerbated by the construction means and methods of a bridge contractor. The 36-inch
main runs parallel to the Great Miami River along the river bank. Although this event could be an isolated
incident, river bank erosion is a risk to be considered to avoid future failures such as these from occurring.
In recent years, three (3) water main crossings have been designed and constructed to eliminate the risk
of a pipe becoming exposed to the Great Miami River. These projects used horizontal directional drilling
methods 20 feet below the riverbed to ensure structural integrity.
2.5 Water Storage Tanks
The City of Dayton owns and maintains five (5) elevated storage tanks and one (1) stand pipe as shown in
the table below (Table 1). The Wilmington tank is owned by Montgomery County but maintenance is the
responsibility of the City of Dayton. In Table 1 the “Area Served” refers to the pressure district to which
water is supplied. The total storage volume of all tanks combined is ten million gallons (10 MG).
Table 1. City of Dayton – Water Tank Storage.
Tank Name Capacity
Area Served Condition Year of
Inspection (MG)
Airport 0.5 Super High Good 2014
Burkhardt
standpipe 1 High Good 2016
Kitridge 0.5 High Good 2014
Mount Auburn 2 High Fair* 2012
Nordale 2 High Good 2016
Strand 2 High Good 2012
Wilmington 2 High Poor** 2004
Total Storage 10
* Following the 2012 inspection, the City of Dayton commissioned rehabilitation of the Mount Auburn tank later in 2012.
** Capital improvements at the Wilmington tank are the responsibility of Montgomery County and the tank was rehabilitated in
2011 at a cost of $956,00.
The AWWA Manual M42 recommends that water storage tanks be inspected every three years. The City of
Dayton in-house staff perform inspections as part of standard asset management procedures. Contract
inspections are conducted on a planned periodic basis. Additionally, the EPA conducts a Sanitary Survey
Dayton Water Quality and Infrastructure Review October 11, 2021
Page | 11
every three years, most recently in 2021, which includes tank inspection. The most recent contracted tank
inspections were performed on the Burkhardt and Nordale tanks in 2016. Based on the most contracted
recent inspections performed on the Airport, Burkhardt, Kitridge, Nordale, and Strand elevated storage
tanks, Dixon Engineering Inc. indicated each tank was in good condition. Based on the most recent
contracted inspections performed on the Wilmington tank, Dixon Engineering Inc. indicated the tank was
in poor condition, however this tank was rehabilitated in 2011. Per the 2012 WEMP, the City has recently
completed repainting of all storage assets and little investment is required over the next 20 years.
The City of Dayton owns and maintains four (4) reservoirs with a total capacity of 46 million gallons, in
addition to a reservoir at each treatment plant as shown in the table below (Table 2).
Table 2. City of Dayton – Water Reservoir Storage.
Reservoir Name Capacity
Area Served (MG)
Anderson 10 Low
Burkhardt 10 Low
Calvary 10 Low
Germantown 16 Low
Miami WTP 20 High
Ottawa WTP 10.8 Low
Total Storage 76.8
2.6 Water Distribution System Hydraulic Model
The City’s hydraulics model was built in 2005 by CH2M HILL using the software InfoWater. Most of the
data used to build this model was obtained through the City’s GIS in the form of a personal geodatabase.
The final model was skeletonized from almost 39,000 pipes to 11,000 pipes in order to achieve quicker
and cost-effective calibration and model simulation runs. Average day demands used in this calibration
were based on billing data and estimated miscellaneous water consumption in 2004. The three largest
water customers at the time of this calibration were Cargill, Tate & Lyle, and Delphi Automotive. The field
data used for the steady-state hydraulic calculation was collected during fire hydrant flow tests performed
in 2005. The model, last analyzed in 2006 by CH2M HILL, found that under the then current peak hour
conditions, low pressures occurred in the Belmont District in the southeast. These pressures were in the
low 30’s psi, and CH2M HILL stated this was due to small diameter and old water mains. Under average
day demands, when the Miami pump station is shut down for 24 hours, the model simulated unacceptably
low pressures in most of the northern high service area. During these scenarios, the Kitridge and Mt.
Auburn tanks were emptied very quickly and unable to recover. When the Ottawa pump station is shut
down for 24 hours, no low pressures were simulated in the system during peak hour demand.
Since the model was last analyzed, a direct pipeline connection from the City of Dayton to the Dayton
airport was installed in 2007. The Dayton airport prior to 2007 was served through the City of Vandalia.
Vandalia, as of 2007, left the City of Dayton’s distribution system. As a result, the Brantford reservoir,
which was used to supply water to the super high service area that included the City of Vandalia and the
Dayton airport, was taken offline in 2009.

Dayton Water Quality and Infrastructure Review October 11, 2021
Page | 12
The most current hydraulic model was updated and calibrated during the Water Efficiency Master Plan
(WEMP) of 2012, as a joint study between the City of Dayton and Montgomery County. As previously
mentioned, the City of Dayton is in the process of awarding a “smart meter” contract to review existing
meters and install additional sensors and meters across the distribution network which will provide
additional information for a more detailed calibration. A joint hydraulic model between Dayton and
Montgomery County is important since the system is one comprehensive distribution network. City
Council is planning the next update to this model in the 2021/2022 Water Master Plan.
Nine out of twenty fire locations identified in the Water Distribution Master Plan of 2006 failed to meet
desired fire flows while maintaining a minimum pressure of 20 psi in the system. These results represent
a snapshot of the system and may potentially differ if operations can be adjusted in the event of a fire.
Therefore, these locations that failed during the model run do not necessarily indicate fire flow cannot be
met at all times. Since 2006, the City of Dayton has completed or planned water main improvements in
the areas that were shown not to have met the desired fire flow criteria.
Table 3 below shows that there is sufficient storage in Dayton’s system based on the average day demand
of 68.4 MGD for the City in 2004. The Wilmington tank is owned by Montgomery County but water is
supplied by Dayton.
Table 3. Dayton Water System Storage Analysis.
Tanks and Reservoirs Storage
Capacity (MG)
High Service
Area
Low Service
Area
Super High
Service
Area
Airport tank 0.5 X
Kitridge tank 0.5 X
Mt. Auburn tank 2.0 X
Nordale tank 2.0 X
Strand tank 2.0 X
Burkhardt standpipe 1.0 X
Wilmington 2.0 X
*Miami WTP reservoir 20 X X
*Ottawa WTP reservoir 10.8 X X
Burkhardt reservoir 10 X
Germantown reservoir 16 X
Anderson reservoir 10 X
Calvary reservoir 10 X
Total Available Storage, MG 40.3 76.8 0.14
Existing Average Day Demand, MGD 35.2 31.4
2025 Average Day Demand, MGD 38.7 32.8
*Storage capacities listed for the reservoirs at the Miami and Ottawa WTPs are available only if pumping is
provided. In the event of power loss to the pumping stations, these reservoirs will not be able to supply water to
the high pressure system.

Dayton Water Quality and Infrastructure Review October 11, 2021
Page | 13
According to the Dayton- MCWS Water Efficiency Master Plan Task 3- Water Demand Projections
prepared by Arcadis, Southern Montgomery County has a storage deficiency of 7.3 MGD, however this can
be offset by the 10 MGD excess storage in the City of Dayton and Northern Montgomery County system.
As stated in the WEMP of 2012, the City and County have a combined water model. This model uses the
City’s average day demand from the 2005 model and the County’s average day demand from 2010. The
total average day demand for 2010 in the combined model is 66.11 MGD. Since the 2005 calibration, one
large water user, Delphi Automotive, is no longer a customer. The Demand Development Workshop
attended by both City and County staff in 2012 determined projected demands on the combined system
for the year 2030. The City and County are in the process of finalizing an RFP to update the existing
hydraulic model.
2.7 Distribution System Surge Analysis
As outlined in the City of Dayton Distribution System SURGE Modeling prepared by Scott Williams in
2006, the City of Dayton has experienced numerous pipe breaks between the Miami WTP and the Mt.
Auburn elevated storage tank. The SURGE analysis for the high service area was carried out based on
pump trip due to pump station power failure. Based on 2005 maximum day peak hour flows, the
simulation was carried out for 120 seconds with transient pressures calculated 46 times per second. This
modeled simulation found 4,600 linear feet of water main to be below atmospheric pressure (0 psi) and
100 linear feet at cavitation pressure (-14.5 psi). Reaching cavitation pressure can cause significant
damage to the water main due to column separation. This cavity formation occurred on the north
transmission line between the Miami WTP high service pumps and the Mt. Auburn tank. This damage can
lead to contaminated groundwater being drawn into the pipeline, as well as water main breaks. The
SURGE Modeling Technical Memorandum recommended the installation of a 40,000 gallon standpipe in
order to control the potential surge pressures and maintain adequate service pressures. In response to this
surge analysis, the City of Dayton performed maintenance on the existing surge tanks at the Miami WTP.
A joint hydraulic model between Dayton and Montgomery County will better address if improvements are
needed to address surge protection in the event power is lost and the pumps shut down.
2.8 Large Diameter Transmission Main Condition Assessment
Large diameter transmission mains are the back bone of the water distribution system. Transmission
main failure will result in pressure loss and disruption of the needed water supply for average demands
and potential fire flow needs. Isolation of a transmission main to perform dry inspections is typically not
feasible given the nature that water supply needs to be maintained and there typically aren’t redundant
mains to supply the water. There are technologies available where condition assessments can be done
while water is being conveyed through the pipe. Dayton Water is utilizing these technologies, for example,
in 2018, Pure Technologies completed a condition assessment of the 48” water main between Miami WTP
and Ottawa WTP. The City is preparing an RFP to perform additional electromagnetic inspections of large
diameter mains. The City is also in the process of awarding a “smart meter” contract to review existing
meters and install additional sensors and meters across the distribution network to better understand
large diameter main conditions.
2.9 Regulatory Compliance Review
Dayton Water meets all current regulatory requirements for water quality. Dayton Water utilizes best
industry practices for their compliance program such as the following:
• Empower all responsible parties to prevent, detect and resolve violation of regulatory issues
• Establish systems which allow responsible parties to raise concerns about compliance issues

Dayton Water Quality and Infrastructure Review October 11, 2021
Page | 14
• Provide oversight for the resolution of identified problems or potential risk areas
• Ensure compliance with all applicable local, state, federal, rules, regulations, and laws
• Ensure internal controls are established and effective
Per the most recent five (5) consumer confidence reports (CCR), Dayton Water has complied with all
current maximum contaminant level (MCL) standards for drinking water.
2.10 Asset Management Plan
Dayton Water first implemented an asset management program in 2012 to better understand the water
system’s needs and develop a proactive way to prioritize improvements. In 2017, Senate Bill 2 passed in
the Ohio State Legislature which required all water systems to develop a formal asset management
program.
The Environment Protection Agency (EPA) provided guidance for the minimum requirements that are to
be included in the Asset Management Plan (AMP). This guidance is separated into three (3) areas which
demonstrate the managerial, technical, and financial capability to reliably deliver safe drinking water
during both normal and emergency operations. Dayton’s Department has an Asset Management
Leadership Team that identifies risk, tracks existing projects, investigates new technologies, and evaluates
partnering with outside utilities.
Dayton Water’s computerized maintenance management system (CMMS) inventories water infrastructure
assets including installation dates, status, and relevant information for operation of the system.
Preventative maintenance schedules are established in CMMS and work orders are issued according to
established schedules. Prioritization, criticality, and estimated remaining useful life of assets is evaluated
and determined by InfoMaster which pulls asset data from Infor Public Sector. The recurring use of these
systems, coupled with Dayton’s daily operational practices ensure Dayton is accurately improving
decisions about rehabilitations, repair, and replacements while simultaneously prolonging the asset life
and reducing overall costs of the system. The annual update to Dayton’s Emergency Response Plan aids in
improving responses to emergencies.
In 2020, Dayton Water responded to 46 water main breaks within their distribution system within 90
minutes while responding to all complaints within 24 hours. Based on the Water Efficiency Master Plan of
2012, the projected demand on the system for the year 2030 is 60.5 MGD. The existing two plants
currently have a combined capacity of 192 MGD and will be able to meet consumer demands. The City of
Dayton and Montgomery County are planning the next update to the City’s model in the 2021/2022 Water
Master Plan to further understand and re-evaluate the potential needs of the system. The Ottawa WTP
uses a kiln to repurpose lime used during softening of the ground water, eliminating the need to purchase
new lime and leading to a sustainable process. Financial capability regarding increases in user rates is
established in the City’s Water Rate Ordinance which is evaluated annually. Dayton Water maintains a
minimum of three months operating expenses as a financial reserve. After evaluating the asset
management plan Dayton region utilities prove responsible for making sure their systems stay in
acceptable working order.
Dayton is in the process of awarding two projects to enhance the asset management program. The first
project will improve system monitoring as new sensors will be installed to monitor system pressures. The
second project is a large valve maintenance program which will improve valve operability when
performing a repair or rehabilitation of large diameter water mains.
After review of Dayton’s AMP, Dayton Water has met the requirements set by the EPA with the exception
of the following item:

Dayton Water Quality and Infrastructure Review October 11, 2021
Page | 15
• In the managerial capability section, provide a list if external contacts. Section 1.6 of the Dayton
AMP seems to address external “contracts” and the intent is to list the external “contacts”.
Dayton Water has met the EPA requirements for the following AMP items, however, the information was
not submitted to the system review consultants due to security constraints:
• In the technical capability section, provide an up-to-date system map of their distribution system.
• In the managerial capability section, provide a description of job duties.
2.11 Capital Improvement Plan A capital improvement plan (CIP) is a plan which identifies and prioritizes projects needed for capital
improvement, as well as options for financing the projects selected. The following are water main capital
improvement projects that are currently or soon to be in design:
• Brandt Pike
• Centre/Bell/Ringgold
• East Stewart Street
• Germantown Phase 2
• Inner East area
• Keowee and Ottawa
• Leo Street
• S. Broadway
• S. Jersey and Gerlaugh
• S. Main Street Phase 2
• South Park Phase 2
• South Park Phase 3
• Twin Towers area
• Wayne Phase 4
• Morton and Garret
• Huffman area
Additional CIP projects that are currently or soon to be in design include: Mad River conversion dam
replacement, Ottawa yards substation replacement, WS&T Generator Project, WS&T Water Treatment
Lab upgrades.
Since completion of the 2012 WEMP, Dayton Water has updated its financial model to include
improvements identified in its Asset Management and Capital Improvement Plans. Ordinance 50.02
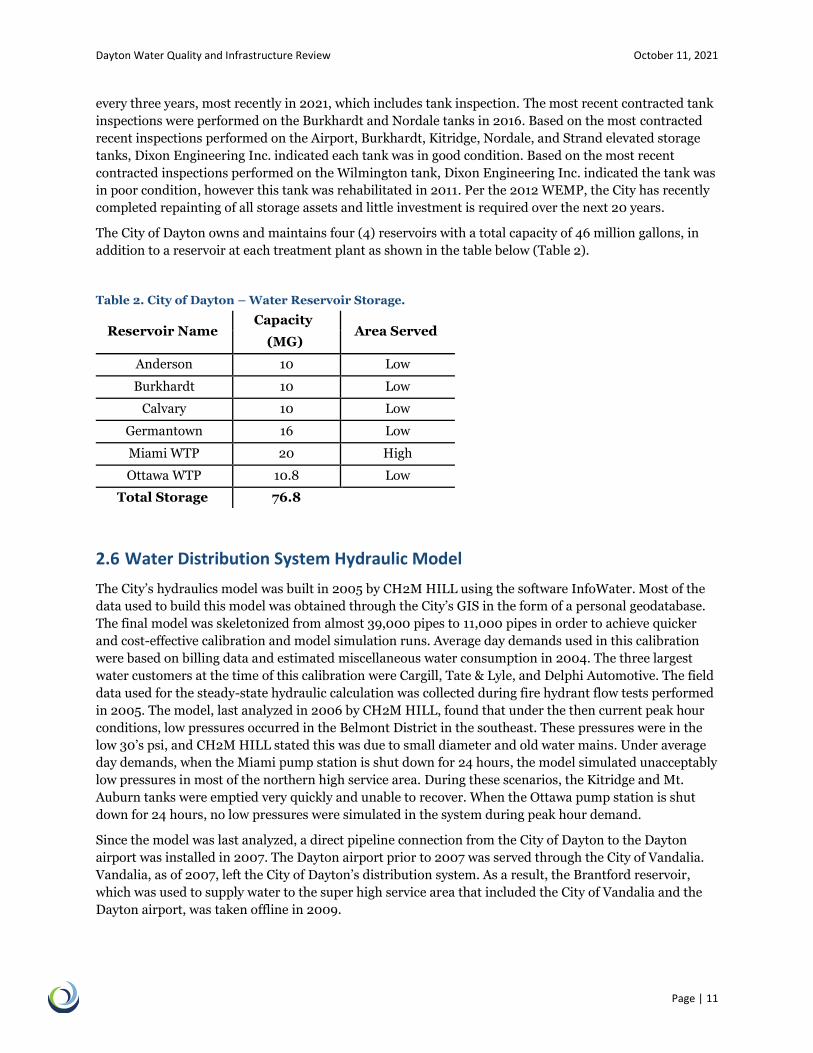
outlines rate increases for 2020, 2021 and 2022 approved by the Dayton City Commission. Table 4
provides the projected annual capital costs through 2030.
Dayton Water Quality and Infrastructure Review October 11, 2021
Page | 16
Table 4. CIP Costs
Year Total Cost
2022 $ 29,941,053
2023 $ 25,522,500
2024 $ 20,045,000
2025 $ 31,051,142
2026 $ 4,711,142
2027 $ 5,626,142
2028 $ 24,551,142
2029 $ 4,551,142
2030 $ 4,551,142
2.12 Valve Exercising Program
Valves in a water distribution system typically serve as a means to isolate one water main from another to
perform maintenance or repairs to the isolated water main while maintaining service elsewhere. The
valves open and close via a valve operator consisting of a nut and gear which moves a disc inside a valve
body to shut off or allow flow to pass through it. Exercising a valve consists of opening and closing the
valve on a regular basis to ensure the gears are working properly and the valve can fully open and close. If
a valve is not exercised on a regular basis, the gears will seize and the valve will be inoperable.
It is for this reason that Ohio EPA (OEPA) requires all drinking water distribution systems to implement a
valve exercising program. Valve Exercising Program Guidance is provided by OEPA. This guidance calls
for identification of critical and non-critical valves in the system. Critical valves are to be exercised
annually and non-critical valves on a less frequent basis. Critical valves are determined as follows:
• Transmission mains affecting service to large groups of customers
• Distribution valves necessary to maintain service to critical customers such as: hospitals, dialysis
centers, nursing homes, medical facilities, manufacturing facilities, downtown/high density areas,
and service connections where loss of flow could impact human health due to catastrophic events
• Areas prone to main breaks
• Areas of infrastructure approaching the end of its useful life
• Areas around road or other utility re-construction areas
The Dayton Water valve exercising program consists of a two-part strategy based on valve size. Larger and
more critical valves are located, exercised and assessed for condition on a yearly basis. Dayton Water
currently has a contract with a company to perform these inspections. Dayton Water has two (2)
dedicated crews to perform routine exercising activities. Smaller valves in the system are inspected and
exercised on a 5-year cycle. All data regarding the valve exercising program is entered into a database
system for tracking of the program.
2.13 Emergency Preparedness
Due to security concerns, Dayton Water could not furnish a copy of the contingency plan, which addresses
the system’s emergency preparedness. The City maintains an Emergency Response Plan for both Water
Supply and Water Reclamation. Dayton partners in the Ohio WARN (Water/Wastewater Agency
Response Network), which works with water utilities throughout Ohio to prepare for the next emergency
by organizing responses and sharing available resources. The Department of Water conducts a minimum
of two (2) training exercises on an annual basis. One training exercise that identifies a “real life” situation

Dayton Water Quality and Infrastructure Review October 11, 2021
Page | 17
is completed with Montgomery County. For the second training exercise, the Department of Water
coordinates an annual emergency exercise with the Dayton Fire Department, Dayton Police Department,
private stake holders, and other entities specific to the planned exercise. This exercise has been based off
of both natural disasters and human-caused emergencies. The Department of Water maintains training
records for employees trained for NIMS/ICS and other applicable courses. Chlorine gas scrubbers are
installed at the treatment plants to prevent the spread of hazardous chlorine gas in the event of a leak.
2.14 System Operation and Controls
Per the City of Dayton Water Distribution Master Plan – System Operation Summary dated January 19th
2005, the majority of the remote booster stations are manually controlled by water levels in the storage
facilities. This means the operators manually turn on and off the pumps according to the operation
guidelines. There are three (3) booster stations that fill elevated storage tanks to supply water to the south
side of Montgomery County’s distribution system. The current operating procedure for filling tanks in this
area is manual. When a tank level drops, Montgomery County contacts Dayton Water to turn on a booster
pump via SCADA. This standard operating procedure can be improved with greater automation of the
booster stations and water storage tank level. The booster station pumps can be programmed to turn on
automatically if tank levels are low and shut off automatically when the tank is full. This will require
additional instrumentation and control programming and coordination between Dayton Water and
Montgomery County.
2.15 Cyber Security
The City of Dayton Department of Water recognizes threats due to cyber security and have put safeguards
in place to reduce the likelihood and consequence of attacks on unauthorized connections to the network’s
infrastructure. Safeguards include a multitude of ongoing actions and implementations to harden and
monitor the network, both Operational Technology (OT, SCADA) and Business. It also involves isolating
critical network assets. There are no internet connections to OT. The only access to SCADA is on site and
all facilities have physical barriers. Water quality is continuously monitored and tracked via the SCADA
system. The City’s server has a backup generator which is located near the distribution center. The Water
Department has created an Incident Response Plan that outlines steps and actions for a broad range of
events. Additionally, annual emergency exercises that include technology disruption are performed by the
Water Department. The City has recently worked with the Department of Homeland Security to perform a
Dependency Analysis. This analysis assists in determining the most vulnerable assets in relation to
consequences. Dayton Water has 24-hour monitoring within the well fields. During normal business
hours, Dayton Water staff monitors the well field grounds, and during after hours, Dayton hires a private
security company to provide routine passes through the water facilities and well fields.
2.16 Gap Analysis The gap analysis is intended to identify, based on this high-level review, where improvements or further
evaluations are needed to the Dayton Water System to maintain a reliable and safe delivery of finished
water to the consumers. Below is a list of recommendations based on the gaps that have been identified as
part of the infrastructure review:
1. Provide Standby Power at Wellfields and WTPs for at least a minimum level of
service.
2. Provide System Redundancy at GMWS. WEMP identified lack of redundancy to the Greater
Moraine System (GMWS), or southern Montgomery County. This area includes Kettering,
Centerville, Washington and Miami Township, and portions of Greene County. GMWS is serviced
by 3 pump stations, DM-1,2,3 all owned by Montgomery County and serviced by Dayton. GMWS

Dayton Water Quality and Infrastructure Review October 11, 2021
Page | 18
has average daily flows (ADF) greater than 15 MGD but relies primarily on a single pump station
(DM-1). The WEMP advised to build a new pump station, DM-5 between Dayton and GMWS.
This project cost is estimated at approximately $64 million using February 2019 dollars.
Preliminary cost estimates were based on conceptual level plans. Table 5 shows the preliminary
cost estimate. The Water Service Agreement of 2018 determined DM-5 construction costs are the
responsibility of Montgomery County and Dayton agreed to provide a separate feed for DM-1 and
DM-5.
Table 5. Preliminary Cost Estimate for Redundancy at GMWS
Item Total Cost
Pump Stations and Transmission Main Construction $ 50,530,000
Property and Easements $ 505,300
Design $ 4,799,400
Soft Costs and Inspection $ 3,104,600
Project Contingency $ 5,053,000
Total $ 63,992,300
3. Water Distribution System Model Calibration. It is our understanding that the City of
Dayton and Montgomery Countyare planning the next hydraulic model update in the 2021/2022
Water Master Plan.
4. Water Surge Protection and Fire Flow Analysis. This is an item that will need additional
investigation and hydraulic analysis. It is likely to be a joint effort between Dayton Water and
Montgomery County as the systems are part of one comprehensive network.
5. Provide an updated evaluation of the Water Supply and Treatment System. Dayton
Water is in the process of developing the Water Facilities Master Plan (WFMP) as referenced
throughout this document. The scope of this project per the RFP dated June 2020 is as follows:
Task 1: Levels of Service and Alternative Analysis
Task 2: Electric
Task 3: Water Loss
Task 4: Space/Facility Planning
Task 5: Staffing
Task 6: Energy Survey and Analysis
Task 7: Review and Improve Emergency plan, Risk Management Plan, and Asset
Management Plan
Task 8: Capital Improvement Needs and Implementation Plan
Task 9: Master Plan Administration
The WFMP is intended to be a comprehensive evaluation of the water supply and treatment
systems for the Dayton Water System and is anticipated to be completed by late 2022/early 2023.
6. Provide updated cost estimates and rate impacts as a result of the WFMP
recommendations.

Dayton Water Quality and Infrastructure Review October 11, 2021
Page | 19
3 Groundwater
3.1 Source Water Protection
As discussed above, the City of Dayton, Ohio provides drinking water to approximately 440,000 people in
Montgomery County and beyond, from the Great Miami Buried Valley Aquifer. The aquifer was
designated as a Sole Source Aquifer by the OEPA in May 1988. This designation applies to aquifers that
serve as the only or principal source of drinking water for an area and signifies that contamination of the
aquifer would create a significant hazard to public health. All federally funded projects constructed near
the aquifer are, therefore, subject to USEPA review to ensure that a hazard to public health is not created.
Source water protection became a priority in the 1980s with the 1986 amendments to the federal Safe
Drinking Water Act (SDWA). The SDWA established health and treatment standards for public drinking
water systems. A 1995 OEPA survey found that the people of Ohio ranked drinking water quality as one of
the top three environmental concerns facing Ohio (Ohio EPA, 1995). Another survey conducted in 1998
found that 90% of Ohioans consider the quality of drinking water to be a “very important” water resource
issue (Ohio Water Resources Council, 1998).
The Ohio EPA has designated the aquifer that supplies drinking water to the City of Dayton’s well fields as
having a high susceptibility to contamination. This rating is based on the number and types of potential
contaminant sources within the well field area and the aquifer’s sensitivity to contamination via:
1. Groundwater which is under the influence of surface water due to the artificial recharge system to
maintain the water table elevation.
2. Underlying soils that are very sandy, allowing for a significant amount of precipitation to infiltrate
into the aquifer instead of running off the ground surface.
The Dayton Multi-Jurisdictional Source Water Protection Program (SWPP) was developed with
community input and was implemented in August 1988, in accordance with the OEPA source water
protection guidance. The goal of the SWPP is to protect and preserve the groundwater resources that
supply Dayton’s drinking water. The program balances economic development and source water
protection using a multi-faceted approach to risk: management, prevention, mitigation and reduction.
The program involves the adoption of three ordinances, which are discussed in additional detail below.
The Multi-Jurisdictional Source Water Protection Area was delineated and includes One-Year (red
outline) and Five-Year (green line) Time of Travel areas in Dayton, Harrison Township, Riverside,
Vandalia, Huber Heights, and Wright-Patterson Air Force Base (Figure 3).

Dayton Water Quality and Infrastructure Review October 11, 2021
Page | 20
Figure 3. City of Dayton Source Water Protection Area (City of Dayton).
The reduction of risk to the public water supply is accomplished through:
• Unique zoning approaches and land use control
• Partnerships formed with Source Water Protection Area businesses (SWPA)
• Inspections and site assessments
• Emergency preparedness
• Improved management of chemical handling and Best Management Practices
• Groundwater monitoring and remediation efforts
There are nine types of potential contamination sources of concern identified in the Dayton SWPP:
1. Businesses: addressed through zoning land-use controls, reports and inspections, and financial
incentives for risk reduction projects.
2. Plumes: groundwater contaminant plumes addressed through Ohio EPA actions and through
existing and new groundwater monitoring.
3. Surface Water Intakes: located on the Mad and the Great Miami Rivers. The recharge water
quality is monitored through sample analysis. Upstream dischargers are supplied with
spill/discharge emergency notification information so the intakes can be closed to prevent any
impact to the recharge system.
4. Dry Wells and Storm Water runoff: Dry wells and other sources of potential contamination via
storm water runoff issues are identified during Source Water Protection inspections.
5. Spills: SWPP staff, local fire departments, the Regional Hazmat team, and the Ohio EPA are on
call 24/7 responding to releases that have impacted or have the potential to impact groundwater,

Dayton Water Quality and Infrastructure Review October 11, 2021
Page | 21
surface water and soil. Groundwater investigations and remedial measures are implemented as
appropriate.
6. Transportation: Highway, Railcars, Terminals, and fuel lines are located in the SWPA.
7. Direct conduits to groundwater include: Underground storage tanks, dry wells, septic systems,
retention/detention ponds, subsurface pipelines, abandoned wells, and abandoned underground
infrastructure.
8. Contaminated Sites: sites are under federal and state administrative orders, abandoned/vacant
sites, Brownfield sites, and sites on the Superfund/National Priorities List are located in the
SWPA.
9. Upstream surface water sources: determined through conjunctive delineation extending ten miles
upstream from the surface water intakes and 1,000 feet upstream from tributaries.
A zoning ordinance was enacted in 1988, which created two zoning districts:
1. Water Operations District (WO) - defined as the property under control of the water supplier
where the production wells are located
2. Water Protection District (WP) - includes all additional property within the one-year time of
travel.
The WO/WP regulations supplement the uses permitted in the Zoning ordinance and include chemical
quantity and use restrictions. The Water Resource Area (WR), added in the SWPP 2015 amendments, is
not enforced under the Zoning Code and does not include chemical quantity and use restrictions. The WR
represents the outer protection area and is bounded by the five-year time of travel.
3.1.1 Ordinances
Three ordinances were put into effect as part of the Dayton SWPP that established specific requirements
to reduce the risk of groundwater contamination from specific potential contaminant sources (Chapter
150 of the Revised Code of General Ordinances, Zoning Regulations). Land use control zoning is the major
focus of the ordinances. The Zoning Code limits the quantity of regulated substances that a business will
store on site through the Total Maximum Daily Inventory (maximum amount of regulated substances
allowed at any point in time) and the Facility Hazard Potential Rating (toxicity rating between one and
nine, with nine being the most toxic). The City of Dayton Source Water Protection Program, Chapter 53,
Water Department Regulations also establish additional requirements such as: inspections by staff,
chemical reporting of inventory, emergency notification, fines, cessation of use, conservation easements,
and a risk screening ranking.
3.1.2 Groundwater Monitoring
The SWPP also includes groundwater monitoring strategies to track and prevent the introduction of
adverse impacts to water quality into the production wells:
1. Monitor groundwater within and surrounding the well fields to provide an early warning system
of impending water quality problems. These wells are routinely sampled. Many monitoring wells
are located down gradient from known or potential sources of contamination.
2. Monitoring to investigate groundwater plumes within the one-year and five-year time of travel
areas, using a monitoring well network that identifies potential risks and possible sources of
contamination through plume delineation, sampling and data management to provide for
contaminant tracking.
Groundwater monitoring is discussed further in the Section 3.2.

Dayton Water Quality and Infrastructure Review October 11, 2021
Page | 22
3.1.3 2015 SWPP Amendment
In 2015 the Zoning Code and Water Ordinances were amended. The ordinances objectives continued to
protect and preserve the groundwater resources that supply Dayton’s drinking water by preventing
increased risk and reducing existing risk. The changes in the plan reduced the protected area by 40%,
from 8,335 acres to 5,214 acres. Commercial and industrial sites regulated by the plan decreased from 441
facilities to 197 facilities. However, the amount of chemicals allowed on site were reduced from 129
million pounds to 5.8 million pounds for those facilities still regulated, corresponding to a reduction of
96% or 123 million pounds. More prohibited uses were also put into place, such as vehicle fueling stations,
junkyards, and plating facilities. The business community had long felt that the restrictions had limited
business growth. The new plan allowed more flexibility and allows for minor variances.
Others in the community expressed concerns about the reduction in the protection area, which could
ultimately lead to impacts to the aquifer from facilities not regulated by the SWPP. The Miami
Conservancy District (MCD) stated that the new policy did not seem to adequately consider the possibility
of a catastrophic groundwater contamination incident. However, over the last six years it does not appear
there have been many complaints during the implementation of the amended ordinances.
3.1.4 Source Water Protection Delineation Model
3.1.4.a Summary of Modeling History, Configuration, and Corroboration
The City of Dayton’s water supply wellfields are located along the Great Miami River and its tributaries in
the high-yielding Buried Valley Aquifer downgradient of relatively developed areas that can be sources of
contamination. Operation of the wellfields includes active management of aquifer recharge from riverbeds
and engineered basins, surveillance of upgradient water quality via regular sampling of over 500
monitoring wells (Figure 4), and intensive and mature wellhead protection programs and policies (since
1988)..
Multiple generations of numerical models have been developed to delineate capture zones and travel
times for water supply wells and wellfields. These include a 1987 Geraghty & Miller model (Mad River
wellfield only), as well as 1986, 1993, and 2011 CH2M HILL models. As summarized in the table below,
the 2011 model update (“Recent Model”) represented a significant improvement on the previous

Dayton Water Quality and Infrastructure Review October 11, 2021
Page | 23
operational models in terms of spatial extent, vertical resolution, data used for setup and corroboration,
and scenarios assessed.
Figure 4. City of Dayton well fields/monitoring locations and time-of-travel (TOT) boundaries based on 2011 modeling results (City of Dayton, 2021 Communication).
Comparison of older models with 2011 model update, as reported by the City of Dayton in Fall 2015 (https://www.daytonohio.gov/DocumentCenter/View/1705/PROGRESS-News-2015-Fall---Program-Updates ).

Dayton Water Quality and Infrastructure Review October 11, 2021
Page | 24
The 2011 CH2M HILL analysis was performed using USGS MODPATH Version 1, a particle-tracking
postprocessing package that was developed to compute three-dimensional flow paths using output from
steady-state or transient ground-water flow simulations by MODFLOW, the USGS finite-difference
groundwater flow model. Three model run scenarios listed below produced a range of 1- and 5-year
capture zones for the well fields:
• Average hydraulic conditions and pumping at “safe yield” rates.
• Average hydraulic conditions and pumping at 5-year peak average plus 1% increment for 10
years rates.
• Drought conditions and pumping at “safe yield” rates.
Vertically, the model is divided into five layers. Three of the model layers represent sand and gravel units
and two represent the intervening till units, which are less permeable and act as aquitards. Layer 1
represents the surficial aquifer, while Layer 3 and Layer 5 represent the intermediate and deep/lower
aquifers, respectively. Layer 2 and Layer 4 represent the subsurface till layers between the aquifers.
The model development and corroboration/validation included grid sensitivity analysis described as
follows:
In order to evaluate if the model is sensitive to reduction in grid spacing, the model grid
spacing was reduced and the residual statistic compared to the calibrated and verified
model residual statistics. The horizontal grid has 119 rows and 142 columns. The rows
and columns are spaced at 2250 feet and 1650 feet respectively in the peripheral model
areas and transition to 300 feet to 250 feet in the area of the well fields…sensitivity
analysis was limited to a single model run in which the grid spacing was halved.
This is a basic but reasonable approach to development and testing of the grid, which optimizes model run
time and grid density. Consideration of available data density to constrain grid cell parameters is also
important, as a very dense grid that is unconstrained by actual subsurface hydrogeological data at a
comparable scale can produce misleading model output. Model sensitivity was determined by comparison
of statistics on resulting water table elevations or pressure heads with actual data from monitoring wells.
The grid configuration that was ultimately used for scenario runs appeared to provide adequate
agreement with corroboration data.
The 2015 changes in the Dayton Source Water Protection Plan and ordinances described in Section 3.1.3,
were based in part on new modeling results. Specific technical critiques of model setup, scenarios, or
application were not identified or considered in detail as part of this review.
In summary:
• The 2011 CH2M HILL model was built on earlier 1986/1993 models
• The 2011 model had more layers and data for setup and corroboration than older models (surface,
till, intermediate, till, lower, bedrock)
• The model domain included all well fields, unlike earlier models
• Hydrogeological properties were constrained by more data allowing for greater and more realistic
spatial variability in parameterization of grid cell properties
• Updated software was used, including flow path determination capabilities
• Sensitivity analyses were performed, including of grid spacing

Dayton Water Quality and Infrastructure Review October 11, 2021
Page | 25
• Multiple pumping and recharge scenarios (e.g., drought) were evaluated with conservative
assumptions (e.g., higher demand than present)
• Ohio EPA draft guidance (2009) was followed on 1-yr and 5-yr time-of-travel delineation
Additional research models of the area were developed by USGS in 1998 and 2007. The 2007 model
produced the output shown below (Figure 5) using MODFLOW and updated USGS MODPATH Version 3
code (no Version 2 was produced). It is unclear how information from these studies or model outputs
have been used in the past by the City of Dayton or its consultants in developing their own models or
source water protection policies. The 2011 model report did not cite the USGS model references. Although
these USGS models were developed, in part, to inform water management decisions, the USGS tends to
focus on longer temporal scales and larger spatial scales in its studies, which may not be optimal for
developing local policies and procedures. Hydrogeological data that have been acquired subsequent to
model development, especially related to PFAS investigations, were not available at the time the 2007 and
2011 models were developed, and may alter interpretations of some results, policies, or configuration of
subsequent models.
Figure 5. USGS 2007 model output showing simulated recharge areas and flow pathlines for select production wells and well clusters in the Dayton area.

Dayton Water Quality and Infrastructure Review October 11, 2021
Page | 26
3.2 Water Quality Monitoring Groundwater monitoring is conducted by numerous entities in the Dayton region.
3.2.1 Ohio EPA
The OEPA maintains the Ambient Ground Water Monitoring network, which was established in 1967, to
characterize groundwater conditions in Ohio. The program currently includes over 200 wells statewide,
with 85% of which are public water systems and 15% are industrial or commercial enterprises or
residential. Raw water is analyzed for a list of inorganic parameters every six, 18 or 36 months. Samples
are also analyzed for VOCs once every 18 or 36 months. Information on the monitoring wells located in
the Dayton region are provided in Table 6 and shown in Figure 6.
Table 6. OEPA Ambient Ground Water Monitoring Locations
Aquifer Well
Well
No. Location County Lithology Aquifer
Depth
(ft)
10R Dayton Miami Well Field Montgomery Unconsolidated GMR 150
4R Dayton Ottawa Well Field Montgomery Unconsolidated Mad River 115
8 Miamisburg WTP Montgomery Unconsolidated GMR 150
7 Franklin Well Field Warren Unconsolidated GMR 112
2 Enon Well Field Clark Unconsolidated Mad River 78
Figure 6. Ohio EPA Groundwater Monitoring Locations in the Dayton region (OEPA interactive map (dark green=interbedded carbonate/shale, light green=carbonate aquifer, blue circles=unconsolidated (sand and gravel) wells, green triangles=carbonate wells).
The OEPA has also conducted per- and poly-fluoroalkyl substances (PFAS) sampling in almost 1,550
public drinking water systems, under the Ohio PFAS Action Plan. This sampling was conducted on the
finished (tap) water produced by each public drinking water system sampled. This work began in
4R
Enon
Miamisburg
10R
Franklin

Dayton Water Quality and Infrastructure Review October 11, 2021
Page | 27
February 2020 and was completed in December 2020. Nearly 94% of the public drinking water systems
tested had no detection of PFAS compounds. Low levels of PFAS compounds, well below the health
advisory level of 70 parts per trillion (ppt) or ng/L, were detected in 6% of the systems. The City of Dayton
Ottawa Drinking Water Plant had a reported PFAS concentration of 7.68 ppt in the finished water.
3.2.2 City of Dayton
The City of Dayton has a network of over 500 early warning monitoring wells that surround both of the
city well fields (Figure 4). Approximately 700 samples are collected per year and analyzed for hardness,
alkalinity, pH, turbidity, temperature, metals, total organic carbon, VOCs, solids, chlorides, conductivity,
oxidation reduction potential (ORP), bacteria, nitrate, nitrite, sulfates, and silica.
The City also conducts PFAS sampling at a varying number of monitoring well locations. The results for
eight sampling events conducted in 2020 are provided in Table 7. A total of 18 PFAS chemicals are
analyzed, but Table 7 contains the PFOA + PFOS results. These were compared to the EPA Health
Advisory Limit for PFOA and PFOS, which is 70 parts per trillion (ppt). The samples where the PFOA +
PFAS concentration exceeds the Health Advisory Limit are highlighted in gray. Monitoring well MW-122S
was the only location where one or more of the sampling events exceeded the Health Advisory Limit based
on the sum of PFAS and PFOA. Treated primary effluent concentrations for PFOS and PFOA from both
the Ottawa and Miami plants were well below the 70 ppt threshold.
Table 7. City of Dayton 2020 PFAS Sampling Results.
Sample
Location
MIAMI
WTP Influent ND ND ND ND ND ND ND ND
PW-14 -- 10.30 -- 9.32 -- 7.30 -- --
PW-12 -- -- -- ND -- ND -- --
OTTAWA
WTP Influent 9.24 8.34 7.18 5.84 9.79 19.50 8.43 7.37
HD-14S -- 10.89 -- ND -- ND -- --
MW-133S -- 6.68 -- 5.00 -- 15.25 -- --
MW-126S -- 14.00 -- 11.30 -- 12.40 -- --
HD-12 -- 15.40 -- 13.50 -- 15.00 -- --
MW-132S -- 12.90 -- 8.46 -- 9.80 -- --
MW-130S -- 37.70 -- 32.70 -- 46.50 -- --
MW-129S -- 5.31 -- ND -- 5.63 -- --
MW-125S -- 15.80 -- ND -- 6.79 -- --
MW-144M 3.57 ND ND ND ND ND ND ND
MW-122S 74.24 86.99 85.82 63.37 69.70 28.70 65.30 69.10
PW-63 16.23 29.00 23.80 21.90 29.30 18.30 25.10 19.60
MW-131M -- 12.27 -- 7.04 -- 6.30 -- --
MW-111S -- -- -- -- -- 54.80 -- --
= PFOA + PFOS exceeds the Health Advisory Limit (70 ppt)
Nov-20Jan-20 Mar-20 May-20 Jun-20 Jul-20 Sep-20 Oct-20

Dayton Water Quality and Infrastructure Review October 11, 2021
Page | 28
3.2.3 Montgomery County
In August 2021, Montgomery County conducted PFAS sampling in the water distribution system. The
results showed PFAS concentrations ranged from non-detectable to 10.9 ppt. These results are below the
EPA’s recommended action level of 70 ppt. Montgomery County plans to test its water for PFAS annually
moving forward.
3.2.4 Miami Conservancy District
The Miami Conservancy District began conducting groundwater monitoring in the Great Miami River
Watershed in 2014. The monitoring is conducted semi-annually to understand the impact of human
activities on groundwater quality. Twelve monitoring wells located in areas surrounded by land uses with
the potential to release contaminants to the aquifer, and installed in unconfined sand and gravel aquifers
with permeable soils at the surface (Figure 7). Five of the wells are situated within 400 feet of a riverbank
and comparison of static water level measurements for those wells with nearby stream gage data suggests
hydraulic interactions occur between the river and the aquifer. The samples were analyzed a range of
parameters including 1,4-dioxane, E. coli, major ions, metals, nutrients, semi-volatiles and volatile
organic compounds and 19 pharmaceutically active compounds.
Figure 7. MCD Groundwater Monitoring Well Locations (MCD, 2020).

Dayton Water Quality and Infrastructure Review October 11, 2021
Page | 29
The results of the 2020 sampling event were similar to results from previous years. These results show
that contaminants originating from human activity such as nitrates, chloride and sodium, VOCs, and
artificial sweeteners are found in groundwater samples from sensitive aquifer areas such as shallow
unconfined sand and gravel aquifers. Naturally occurring contaminants such as arsenic and parameters
such as hardness, iron and manganese are present in groundwater at concentrations exceeding the
secondary drinking water standards. Contaminants present in rivers and streams can also be found in the
BVA.
Generally, the number of exceedances of the primary drinking water standards is low. However,
groundwater in the Great Miami Watershed is generally very hard. In addition, naturally occurring
arsenic is frequently present at detectable concentrations in all major aquifers and concentrations above
drinking water maximum contaminant levels are not uncommon (2011 MCD Water Resources Report).
3.2.5 Groundwater Consortium (Cincinnati area)
The mission of the Groundwater Consortium is to protect public health by preserving the high-quality
water resources through a cooperative Source Water Protection Program, in the Hamilton to New
Baltimore area. The Groundwater Consortium collects static water elevations monthly at 39 monitoring
wells in the Cincinnati area. Groundwater monitoring is conducted twice per year. These samples are
analyzed for nitrates, VOCs, pesticides, herbicides, metals, bacteria, synthetic organic compounds. Temp,
pH, conductivity, DO and alkalinity. To date, no MCLs have been exceeded in any monitoring well.
3.3 Water Quality Challenges
OEPA conducts susceptibility analyses to evaluate the likelihood that a public water source could become
contaminated. The analysis is based on the sensitivity of the aquifer to contamination, the available water
quality data, and the number and types of potential contaminant sources located within the protection
area. The OEPA analysis of the BVA determined that that there was a high susceptibility to contamination
due to the unconfined to semi-confined condition of the aquifer near the Dayton well fields, and the depth
to groundwater ranging from 10 to 55 feet below ground surface in these areas. In addition, the aquifer is
under the influence of surface water and is therefore susceptible to surface water contaminant impacts.
VOCs and nitrate have been detected, with trichloroethene and vinyl chloride having been detected at
concentrations greater than the MCL (in raw water). These detections indicate an impact from human
activities.
The MCD has identified the following challenges to aquifer protection:
1. Nutrients in rivers and streams
2. Road salt and nutrients impact groundwater
3. Other pollutants such as micropollutants, PFAS, pharmaceuticals
3.3.1 Pharmaceuticals
According to the US EPA, Pharmaceuticals and Personal Care Products (PPCPs) refer to any product used
by individuals for personal health or cosmetic reasons, or used by agribusiness to enhance growth or
health of livestock.
PPCPs include:
• Prescription and over the counter drugs
• Veterinary drugs

Dayton Water Quality and Infrastructure Review October 11, 2021
Page | 30
• Fragrances
• Cosmetics
• Sun-screen products
• Diagnostic agents
• Vitamins and supplements
PPCPs have collected in the surface water and groundwater through a few different pathways. Drugs are
not entirely broken down and absorbed by the body and are excreted and passed into wastewater and
subsequently surface water. In areas not served by a sewer system and wastewater treatment, septic
systems are used and can provide a pathway for groundwater contamination by these compounds. PPCPs
also end up in water from different disposal methods such as being flushed down the toilet or being
drained in the sink.
In addition, new analytical techniques can detect very low concentrations of chemicals used in the
pharmaceutical industry and in household consumer products. The results of national studies of source
waters in the US show that pharmaceutical drugs detected nationally include steroids, prescription and
over the counter drugs such as antibiotics, antidepressants, anti-inflammatory drugs, hormones and other
organic chemicals, which are not completely removed in the wastewater treatment process. Personal care
products detected include detergents, insect repellants, plasticizers and fragrances.
PCPPs are not yet regulated by EPA and Ohio has not developed any state regulatory standards for these
compounds in drinking water.
The Miami Conservancy District conducted a PPCP occurrence survey in 201o/2011, collecting samples
from surface water, municipal wells and wastewater treatment plant discharges. Seventeen PPCP
compounds were detected in at least one sampling event during the survey. Measured PPCP
concentrations were highest in wastewater treatment plant effluent. Groundwater samples had the lowest
detection frequencies and the lowest concentrations of PPCPs. A screening level assessment conducted by
MCD for groundwater showed that PPCPs in groundwater do not represent a significant health risk to
local drinking water supplies.
3.3.2 Nitrate
Nitrate is a compound that is formed naturally when nitrogen combines with oxygen or ozone. High levels
of nitrate in drinking water can be dangerous to health, especially for infants and pregnant women.
Nitrate can occur naturally in surface and groundwater at levels that do not generally cause health
problems. High levels of nitrate in groundwater come from the use of nitrogen in agriculture, feedlots,
animal yards, septic systems and domestic or municipal wastewater.
The 2020 groundwater monitoring conducted by MCD detected 10.6 mg/L of nitrate in one monitoring
well (BUT10017 located in Butler County). This concentration exceeds the Maximum Contaminant Level
for nitrate in drinking water of 10 mg/L. The sampling results from monitoring well CLA10018, located in
Clark County near the Mad River, exceeded the MCL in 2016 and 2017. Nitrate concentrations in excess of
3 mg/L in groundwater are often indicative of human activity as the source. The nitrate concentrations
detected by MCD from 2014 to 2020 are shown in Figure 8.
It should be noted that the MCD monitoring wells are outside of the Dayton Source Water Protection
Area’ five year time of travel. The range of nitrate levels detected at the City’s treatment plants in 2020
was 0.194 mg/L to 2.12 mg/L.

Dayton Water Quality and Infrastructure Review October 11, 2021
Page | 31
Figure 8. Nitrate concentrations detected in MCD monitoring wells from 2014 to 2020.
3.3.3 PFAS Substances
At present the greatest risk to the water quality of the BVA is the impacts from PFAS substances. Per- and
polyfluoroalkyl substances (PFAS) are synthetic compounds that were developed in the 1930s and have
been used widely in a variety of industrial and commercial applications since the 1950s. It has been used
as a surfactant, coating, wetting agent, fume suppressant and aqueous film forming foam.
PFAS has been detected in the raw and finished water of Dayton’s Ottawa Water Treatment Plant at
concentrations below 70 ppt, the current EPA Health Advisory Limit. PFAS are not currently subject to
EPA drinking water standards. The PFAS concentrations detected in the Ottawa Water Treatment Plant
effluent is shown in Figure 9.
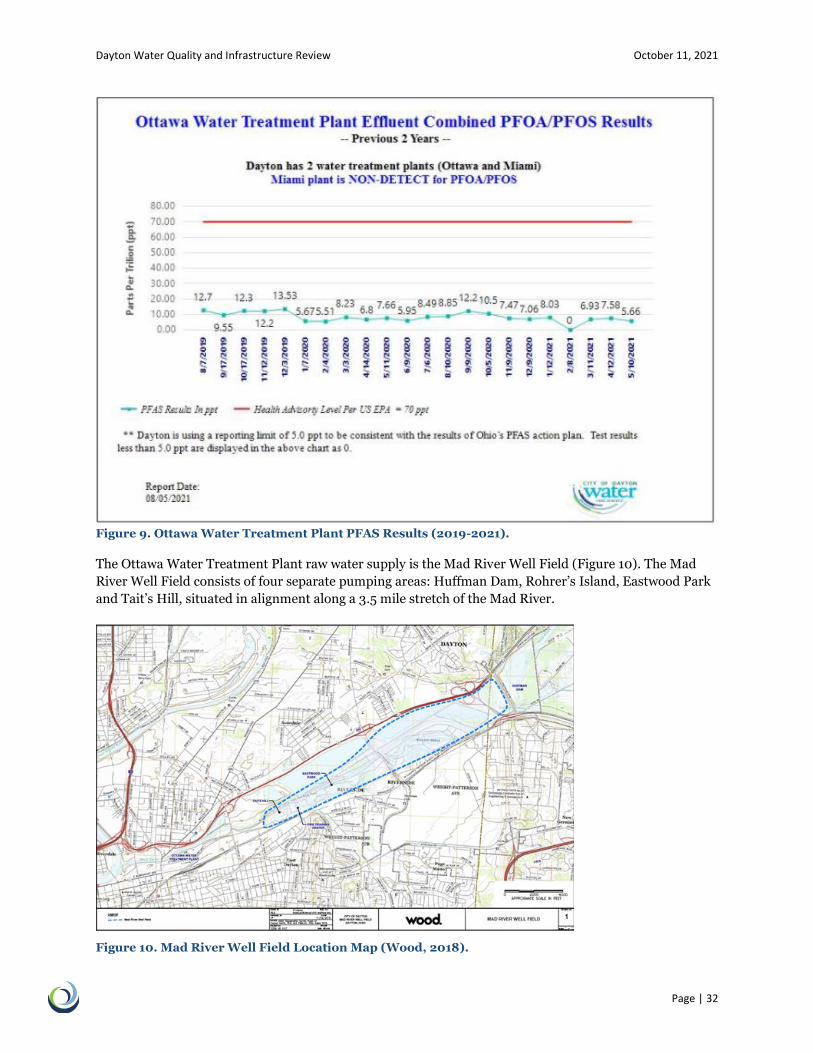
Dayton Water Quality and Infrastructure Review October 11, 2021
Page | 32
Figure 9. Ottawa Water Treatment Plant PFAS Results (2019-2021).
The Ottawa Water Treatment Plant raw water supply is the Mad River Well Field (Figure 10). The Mad
River Well Field consists of four separate pumping areas: Huffman Dam, Rohrer’s Island, Eastwood Park
and Tait’s Hill, situated in alignment along a 3.5 mile stretch of the Mad River.
Figure 10. Mad River Well Field Location Map (Wood, 2018).

Dayton Water Quality and Infrastructure Review October 11, 2021
Page | 33
The City’s Mad River wellfield is located directly adjacent to and downgradient from Wright Patterson Air
Force Base (WPAFB) operations (Figure 10). Because of the northeasterly direction of groundwater flow,
towards the Mad River, any contaminants released onto the ground or into the stormwater drainage
system at WPAFB flow directly towards the Mad River wellfield.
Since at least 1970, WPAFB has used PFAS-containing firefighting foams during fires and in firefighting
exercises and runoff from these activities has migrated into surrounding soils and drained into nearby
ditches and stormwater culverts. WPAFB discontinued use of PFAS containing products in 2018.
WPAFB has their own drinking water system which pumps water from the BVA. In 2014 and 2015, OEPA
directed sampling for PFAS compounds and the monitoring detected PFOA and PFOS in the Area A
distribution system at the Base. (WPARB, 2015). WPAFB performed sampling on all active Base
production wells in March 2016 and discovered that two of the six wells located in Area A had elevated
levels of PFOS/PFOA. In April 2016, monitoring revealed a PFOS level of 110 ppt in the distribution
system. The fire-fighting foam used at the Fire Training Center was the suspected source. In May 2016,
WPAFB shut down the two impacted production wells (200 ppt and 700 ppt, respectively for combined
PFOA and PFOS) and issued a drinking water advisory for Area A informing the public that the PFOS
detection exceeded the HAL of 70 ppt. In June 2017 the granular activated carbon units were installed to
remove PFAS from water being pumped from the contaminated wells located at the Base. The wells were
returned to service at that time. Since placing the activated carbon system online the PFOS/PFOA levels
in the treated drinking water have consistently been well below 70 ppt.
Sampling of the Mad River in August 2016 found two sites near WPAFB’s main airfield that exceeded 70
ppt (82 ppt PFOA, 590 ppt)
Pumping of the Tait’s Hill production wells (part of the Mad River Well Field) and Huffman Dam
production wells was discontinued in 2016 and 2017, respectively due to concerns about PFAS in nearby
monitoring wells. The Tait’s Hill production wells are located adjacent to and hydraulically downgradient
of the City of Dayton’s Fire Training Center. The Huffman Dam production wells are located adjacent to
and hydraulically downgradient of WPAFB.
Results from samples collected by the City of Dayton during August 2018 detected PFAS compounds in
the City’s early warning network of monitoring wells in excess of the USEPA’s Drinking Water Health
Advisory level of 70 ppt. These wells were located directly upgradient from the City’s production wells in
the Mad River wellfield.
In a February 2018 Dayton Daily News article it was reported that the City of Dayton had sent a letter to
the WPAFB stating that recent sampling showed chemical constituents migrating from the base toward
the Huffman Dam production wells. The City stated that shutting down production wells is a short-term
solution and there a more permanent solution was needed to prevent PFAS from moving off site of the
base. The Air Force then stated that in a one-year period of sampling they found only one well at the base
boundary that exceeded 70 ppt and it did not pose a risk to drinking water supplies. The Air Force
position is that no continuous contamination is occurring. Legacy contamination exists and they are
following CERCLA. At that time OEPA agreed that WPAFB was not being proactive enough in response to
the PFAS contamination issue. OEPA had serious concerns and felt it was an unacceptable position for the
Air Force to simply wait until contamination exceeds the HAL in order to address the source.
In January 2017 WPAFB concluded a site inspection, quarterly groundwater monitoring, surface water,
soil and sediment to verify presence of PFOS/PFOA and identify possible contaminant pathways. They
also installed monitoring wells on the base property, quarterly sentinel monitoring wells across the
installation.
In 2018, the Air Force began conducting an Expanded Site Inspection at four of the 15 areas evaluated
under the Site Inspection because of the PFAS concentrations detected and the proximity to, or direct
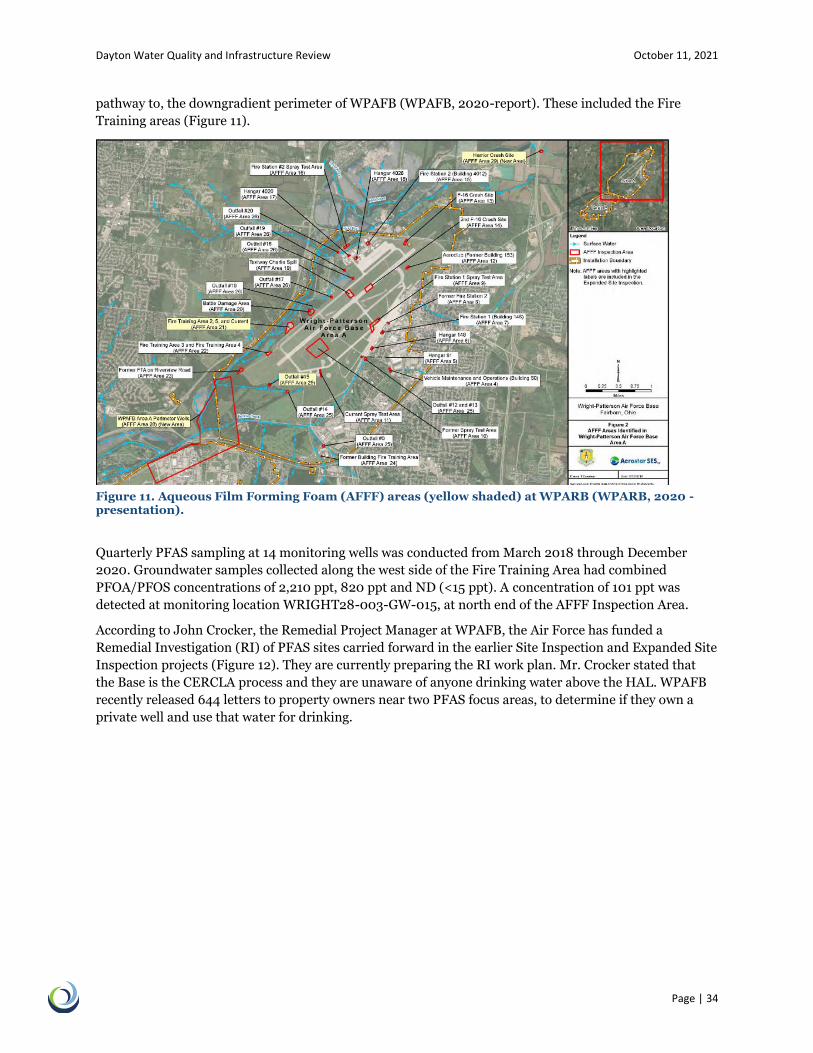
Dayton Water Quality and Infrastructure Review October 11, 2021
Page | 34
pathway to, the downgradient perimeter of WPAFB (WPAFB, 2020-report). These included the Fire
Training areas (Figure 11).
Figure 11. Aqueous Film Forming Foam (AFFF) areas (yellow shaded) at WPARB (WPARB, 2020 - presentation).
Quarterly PFAS sampling at 14 monitoring wells was conducted from March 2018 through December
2020. Groundwater samples collected along the west side of the Fire Training Area had combined
PFOA/PFOS concentrations of 2,210 ppt, 820 ppt and ND (<15 ppt). A concentration of 101 ppt was
detected at monitoring location WRIGHT28-003-GW-015, at north end of the AFFF Inspection Area.
According to John Crocker, the Remedial Project Manager at WPAFB, the Air Force has funded a
Remedial Investigation (RI) of PFAS sites carried forward in the earlier Site Inspection and Expanded Site
Inspection projects (Figure 12). They are currently preparing the RI work plan. Mr. Crocker stated that
the Base is the CERCLA process and they are unaware of anyone drinking water above the HAL. WPAFB
recently released 644 letters to property owners near two PFAS focus areas, to determine if they own a
private well and use that water for drinking.

Dayton Water Quality and Infrastructure Review October 11, 2021
Page | 35
Figure 12. WPAFB areas included in the Remedial Investigation (in purple) (WPAFB 2020 Presentation).
In February 2018, WPAFB informed the OEPA that test results pointed to Dayton’s firefighting training
center as a potential source of PFAS contamination. As a result, OEPA ordered the city to track and
remediate potential contamination from their training center and find the sources of PFAS contamination
at the Dayton’s Ottawa treatment plant in the Mad River well field. The City Fire Training Center is
located at 200 McFadden Avenue. The facility used Class B AFFF containing PFAS for fire control training
activities at this facility.
The City of Dayton conducted a PFAS source determination study in the area of the FTC, in 2018.
Groundwater sampling was conducted at monitoring wells installed to the west of the FTC. The results
are provided in Table 8.
Table 8. PFAS Concentrations at City of Dayton Fire Training Center (Wood, 2018).
Sample Location (Depth) PFOS (ppt) PFOA (ppt)
FT-6 (50) 1,500 22
FT-6 (82) 130 2
FT-7 (44) 450 20
FT-8 (40) 590 18
FT-8 (75) 300 25
MW-122S 130 5.7

Dayton Water Quality and Infrastructure Review October 11, 2021
Page | 36
The Wood (2018) hydrogeological study concluded that AFFF use at the FTC had impacted groundwater
beneath and downgradient of the FTC. The maximum PFAS concentrations detected during the
investigation were at FT-6, which is located along the western boundary of the FTC. PFAS concentrations
in monitoring wells east of the FTC were generally below 10 ng/l with one exception (MW-122S).
The study further concluded that although AFFF use at the FTC has caused PFAS contamination to the
environment, the FTC does not appear to be the source of recent detections of PFAS at the Ottawa Water
Treatment Plant, based on the following evidence:
• Pumping of PW-8 and PW-9 does not alter the natural groundwater flow direction beneath and
downgradient of the FTC, which is to the west.
• Contaminant distribution in the groundwater beneath and downgradient of the FTC is consistent
with a westerly flow direction.
• Production wells to the west of the FTC have not been pumped since April 2016.
• Low level concentrations of PFAS have continued to be detected in raw and finished water of the
Ottawa Treatment Plant after pumping of the Tait’s Hill wells ceased.
3.3.4 City of Dayton PFAS Related Lawsuits
3.3.4.a Wright Patterson Air Force Base
On April 6, 2021, the City of Dayton announced its intent to file a lawsuit against WPAFB and the
Department of Defense. The City says it is their hope that WPAFB and DOD stop the contaminants from
entering the wellfield, fix the current contamination and reimburse the City for damages and costs
incurred from the contamination. Dayton City Manager Shelley Dickstein said that the City has invested
four years attempting to get the WPAFB and DOD to agree to steps to mitigate the ongoing contamination
coming from the Base and into the City’s Mad River Well Field and the aquifer that supplies those wells.
WPAFB and DOD have declined entering into an agreement that would allow continued cooperative work
on the contamination problem.
WPAFB responded that they are invested in ensuring safe drinking water. They stated they are following
all environmental clean-up laws and taking an aggressive approach to remedial activities. They said that
the base has an agreement in place with the OEPA and continues to work collaboratively with Ohio and
the City of Dayton concerning PFAS related issues. WPAFB states that their sampling conducted from
2015 to 2020 shows that PFOS/PFOA concentrations are at steady state and there is no indication of
higher concentrations migrating off base.
In May the City of Dayton formally filed a lawsuit against WPAFB and the Department of Defense, seeking
up to $300 million in damages.
3.3.4.b PFAS Manufacturers
In October 2018, the City of Dayton announced that they had filed a lawsuit against companies who
manufactured products containing PFAS, including the 3M Company. At that time PFAS concentrations
in raw water were between 7 and 15 ppt. In February 2018 the City found elevated PFAS in the water
supply near Huffman Dam.
3.4 PFAS Regulation
As stated above, the EPA Health Advisory Level for PFOA and PFOS, two chemicals in the PFAS family, is
70 ppt. In 2018, the CDC proposed health thresholds for PFOA/PFOS that were about 10 times lower
than EPA level. To date, action has not been taken on this proposal.

Dayton Water Quality and Infrastructure Review October 11, 2021
Page | 37
In July 2021, US EPA announced the draft Contaminant Candidate List 5 (CCL5) for drinking water. This
list identifies priority contaminants to consider for regulation to ensure public health. PFAS has been
included on the CCR5 list as a group of chemicals. US EPA is presently moving forward with national
primary drinking water standards for the individual compounds of PFOA and PFOS.
In 2019, Ohio Governor DeWine (along with 14 other governors) signed a letter to the US Senate calling
for comprehensive national legislation on PFAS. In addition, in December 2019 Ohio PFAS Action Plan
for Drinking Water was published. One of the objectives of this plan is to establish Action Levels for
drinking water in Ohio. At this time Ohio has set the action level for PFOA/PFOS at 70 ppt. Action levels
are used as thresholds to provide guidance to drinking water system operators in mitigating health risks.
The Ohio Action Levels are shown in Table 9.
Table 9. PFAS Action Levels for Ohio.
In comparison, the Michigan Science Advisory Board has stated that 70 ppt might not be sufficiently
protective and have set the screening level at 9 ppt for PFOA and 8 ppt for PFOS.

Dayton Water Quality and Infrastructure Review October 11, 2021
Page | 38
Blank page

Dayton Water Quality and Infrastructure Review October 11, 2021
Page | 39
4 Surface Water
The Great Miami River and its major tributaries (the Mad River, the Stillwater River, and smaller creeks)
overlay a portion of the Buried Valley Aquifer (BVA) (see Figure 1). The river and aquifer are essentially
one waterbody and are strongly connected (Figure 13) due to the proximity of the aquifer to the river and
the high hydraulic conductivity characteristics of the BVA (Ritzi et al, 2000; Levy et al, 2008).
Figure 13. Connection between Great Miami River and Buried Valley Aquifer (source: City of Dayton).
Pollution delivered to the Great Miami River may contaminate the groundwater in the BVA and vice
versa. Therefore, an evaluation of the sustainability and resilience of the BVA depends, to some degree, on
the conditions in the Great Miami River and its potential to contaminate the BVA.
4.1 Existing Conditions
The Great Miami River is an important resource for the City of Dayton and the region. Portions of the
river are designated as exceptional warmwater habitat and are used as public water supply resources for
Dayton and several other communities. Water quality in the Great Miami River and the Mad River
upstream of Dayton is generally good, and better than the water quality in the reach below Dayton.
However, there are water quality concerns across the watershed.
The primary pollutants of concern in the Great Miami River and its tributaries include Escherichia
coliform [E. coli], phosphorus, and nitrate. Of these parameters, nitrate is the most strongly associated
with the underlying groundwater (MCD, 2019a), as concentrations tend to be highest during periods
when the river flow is comprised largely of base flow (MCD, personal communication), which originates at
the surface-groundwater interface. Observed nitrate levels in the vicinity of Dayton in the Great Miami

Dayton Water Quality and Infrastructure Review October 11, 2021
Page | 40
River are typically in the 1 – 2 mg/L-N range (OEPA 2013), well below the State of Ohio public water
supply standard of 10 mg/L and also below the target of 3.08 mg/L used by OEPA to assess impairment.
In the Mad River, nitrate concentrations median concentrations are typically 3-4 mg/L-N (OEPA 2005).
Nitrate can also originate from wastewater discharges to surface waters (USGS 2006). E. coli and
phosphorus are associated with wastewater discharge and stormwater runoff sources (USGS 2006;
LimnoTech, 2017).
Atrazine, a common agricultural pesticide, has also been identified as an impairment in the Great Miami
River near the city of Piqua, which uses the river as its drinking water supply (OEPA 2013). In addition,
emerging contaminants that have demonstrated adverse ecological or human health effects, such as PFAS,
pharmaceuticals and personal care products are also becoming more important in characterizing the
condition of the rivers (MCD, 2011). However, many of these emerging chemicals do not have regulatory
standards, but monitoring to date indicates that levels in the local rivers are either low relative to
published health guidelines or have not been detected.
4.2 Water Quality Monitoring
LimnoTech reviewed a number of water quality and biological studies and sampling program data
conducted by the Ohio EPA (OEPA), Miami Conservancy District (MCD), and United States Geological
Society (USGS) to understand the current water quality conditions in the Great Miami River and its
tributaries.
In addition, several research papers were reviewed to understand exchange processes between the Great
Miami River and BVA (Wallace and Soltanian, 2021a; Wallace and Soltanian, 2021b; Ritzi et al, 2000;
Zhou and Ritzi, 2014). These data provide insight into how easily and how quickly different types of
contaminants can move from the river to the aquifer and vice versa. Finally, because some of the
referenced studies are somewhat dated (e.g. more than five years old), several interviews of local area
experts in groundwater-surface water interactions and water quality were conducted to verify that the
information in the reports and papers were still applicable today.
4.2.1 Hydrology
The Great Miami River and its major tributaries are a well-studied system, with data and research going
back to the 1960s (Spieker et al. 1968) and continuing to the present. The USGS maintains several flow
gages in the Great Miami and its tributaries (Figure 14). Gage data can go back decades. For example, the
gage on the Great Miami River in Dayton (03270500) has water data dating back to 1893.

Dayton Water Quality and Infrastructure Review October 11, 2021
Page | 41
Figure 14. USGS Gages on the Great Miami River and its Tributaries.
The data from these gages also include real-time data on hydrologic conditions throughout the watershed
(https://dashboard.waterdata.usgs.gov/app/nwd/?region=lower48&aoi=default) and flooding status.
Figure 15 provides a screenshot of the USGS real-time dashboard for the gage in downtown Dayton.

Dayton Water Quality and Infrastructure Review October 11, 2021
Page | 42
Figure 15. Real-time Hydrograph Conditions at the USGS Gage on the Great Miami River (03270500) in Dayton, OH.
This is a rich dataset to evaluate changes to hydrology due to changes in the area, such as additional
urban/suburban development, and to document the effects of changing weather patterns, such as the
higher annual rainfall observed over the last five years compared to previous years and resulting effects on
flows and high water events (MCD, 2021 [https://mcdwater.blog/2021/02/01/2020-precipitation-up-
down-and-all-around/].
High river levels are of interest to the overall question of the City of Dayton’s resiliency for the following
reasons:
1. Higher stream flows provide greater hydraulic connectivity between the streams and the BVA,
which can facilitate contaminant exchange.
2. Higher river levels exert additional pressure on infrastructure that crosses the river, such as water
mains, that can compromise the integrity of the infrastructure.
3. Flooding can damage or contaminate assets related to the drinking water supply.
4.2.2 Water Quality
The OEPA has done extensive sampling in the rivers and streams to support their water quality and
biological assessments (OEPA 1995; OEPA 2003; OEPA 2005; OEPA 2009). OEPA uses the data from
these studies to determine whether each surveyed waterbody is impaired and if so, what parameters are
causing the impairment. Water quality data includes measurements of bacteria (E. coli), nitrogen and
phosphorus nutrients, solids, biochemical oxygen demand, metals, pesticides, and other organic
chemicals. Sampling locations are shown in Figure 16. While OEPA sampling covers the geographic area
in great detail, their sampling frequency is limited, spanning at least five years or longer between studies.
As noted above, the purpose of these studies is assess stream impairments and potential causes. The large
number of sampling locations and extensive parameter set allow OEPA to accomplish this purpose.
Although it has been a number of years since some portions of the watershed have been sampled, land use

Dayton Water Quality and Infrastructure Review October 11, 2021
Page | 43
has remained relatively consistent, with agriculture dominating the upper watershed and more
urban/suburban development along the rivers at and downstream of the City of Dayton.
Figure 16. Water Quality Sampling Locations in the Great Miami River Watershed.
There are 27 major wastewater treatment plants in the Great Miami River watershed, including 11
upstream of one or more of the Dayton well fields and/or source water protection areas (Figure 16). The
key water quality concerns of discharges from these facilities include bacteria (E. coli), phosphorus,

Dayton Water Quality and Infrastructure Review October 11, 2021
Page | 44
nitrate and ammonia. Other parameters used as indicators of treatment efficiency, such as total
suspended solids and BOD, are also monitored closely. These facilities are required by their discharge
permits to sample upstream and downstream of their treated effluent discharge location approximately
once a month for key parameters, including bacteria (E. coli), phosphorus and nitrogen nutrients, solids,
and BOD. Other water quality parameters are sampled less frequently, such as quarterly or annually. This
dataset does not have the same level of spatial detail as the OEPA data but are collected more frequently,
providing a more continuous record of data for evaluating trends and seasonal effects in water quality
conditions.
This area benefits from the presence of several forward-thinking water-related organizations, including
the Miami Conservancy District (MCD) and Wright State University. YSI (now part of Xylem, Inc.), an
industry leader in monitoring sensor technology, is also headquartered in nearby Yellow Springs and has
conducted monitoring in the local streams as part of their product testing. MCD and YSI partnered on the
deployment of continuous monitoring sensors at several locations, including one near Huffman Dam on
the Mad River, the Great Miami River near the Taylorsville Dam upstream of Dayton, and below
Miamisburg south of Dayton. The sensors measured physical and biological conditions every 15 minutes,
including temperature, pH, dissolved oxygen, conductivity, turbidity, blue-green algae, chlorophyll a, and
dissolved organic matter. Data spanning 10 years (2010-2019) are available at the Huffman Dam site,
while the Miamisburg and Taylorsville sites have data spanning approximately five years (2009-2013).
These data have been used to assess the daily range and fluctuations of dissolved oxygen, which can have
detrimental impacts on the aquatic life (e.g. fish and macroinvertebrates) when levels drop too low. The
other parameters that were concurrently measured provided information on the influences on DO levels,
which were used to develop source control strategies (LimnoTech, 2017).
More recently, the MCD monitors PFAS levels at Huffman Dam in the Mad River and at Englewood Dam
and Miami Villa locations in the Great Miami River (MCD, personal communication). The Huffman Dam
location is downstream of the Wright-Patterson Air Force Base, where PFAS has been detected in the
groundwater, but upstream of the lagoons used by the City of Dayton to recharge their Mad River well
field. The EPA has issued a health advisory guideline of 70 ng/L (parts per trillion) as the threshold for
either the sum of or as individual compound concentrations of two specific PFAS compounds,
perfluorooctanoic acid (PFOA) and perfluorooctanesulfonic acid (PFOS). The State of Ohio is using these
guidelines as well. The most recent test results at the Huffman Dam site were well below this threshold,
with the sum of PFOA and PFOS being 10.2 ng/L. However, of the three sites sampled, this location had
the highest levels and the most PFAS compounds detected. Based on these data, it does not appear that
PFAS currently poses a threat to the use of the Mad River for recharging the City’s well field via the
lagoons adjacent to the river.
4.3 Issues
As part of the data compilation and synthesis, potential pollution pathways were reviewed. Stressors and
potential risks to the BVA from the Great Miami River. Four types of pollutant source pathways were
considered:
• Wastewater-related: Figure 17 shows the location of the major wastewater treatment plants
(WWTP) and locations identified by OEPA where WWTP biosolids are applied.
• Permitted point sources: Figure 18 shows the location of facilities that have National Pollution
Elimination Discharge System (NPDES) permits to discharge flow and pollutants into the local
waterways.

Dayton Water Quality and Infrastructure Review October 11, 2021
Page | 45
• Stormwater runoff: Figure 19 shows the areas of the watershed that are permitted by municipal
separate storm sewer system (MS4). Also shown are industrial sites that have a stormwater
NPDES permit.
• Spills: Figure 20 shows locations of spills that have been logged by OEPA since 2017. The spill
locations are primarily fuel oil and the locations shown in Figure 9 are spills where a measured
amount was reported.
This information was evaluated to assess 1) the risks to the BVA from the Great Miami River and its
tributaries; 2) the risks to the Great Miami River and its tributaries from the BVA; and 3) the potential
mechanisms for cross contamination between surface water and groundwater. In summary, the high
permeability rates result in a strong hydraulic connectivity between the rivers and the underlying aquifer.
Dissolved constituents are most easily able to pass between surface and groundwater. Chloride, from road
salt application, is an example of a dissolved constituent that can be readily transported from the rivers to
the underlying BVA, whereas the reverse is true for nitrate, another dissolved constituent. This is
described in more detail in the following subsections.
4.3.1 Risks to the BVA from the Great Miami River
In general, the key parameters of concern for impairing water quality in the Great Miami River, E. coli
and eutrophication due to excessive phosphorus, may not be risks to the BVA. E. coli is used to assess the
ability of the surface water for recreation while eutrophication affects aquatic life. Neither of these uses
apply to groundwater and there is no evidence that E. coli or phosphorus have been identified as problems
in the BVA. Nevertheless, there are pollutants and sources that have the potential to affect water quality in
the BVA. Discharges from wastewater treatment plants (WWTPs) are one potential source, particularly
when they contain contaminants that resist conventional treatment, such as PPCPs. Few of these
constituents are currently regulated but many have endocrine-disrupting or other adverse health effects.
Dissolved constituents, such as chloride, can easily migrate into the groundwater aquifer. Chloride is
associated with road salt application and subsequent runoff into surface waters like the Great Miami
River. Finally, uncontrolled releases to the environment can be a pathway for surface contamination of
the aquifer. Uncontrolled releases include chemical spills, sanitary sewer overflows, combined sewer
overflows, and unregulated straight pipe discharges.
4.3.2 Risks to the Great Miami River (and Tributaries) from the BVA
Nitrate is the primary pollutant of concern for surface water contamination by groundwater. Nitrate is a
dissolved constituent so easily migrates with the groundwater flow. Much of the flow in the Great Miami
River is comprised of base flow, which is mostly groundwater in origin. High nitrate levels observed in the
groundwater is evident in the levels measured in the GMR and its tributaries. For example, the Mad River
has some of the highest nitrate levels in the Great Miami River watershed and also has the highest
percentage of annual flow attributed to base flow. Nitrate monitoring was discussed is Section 3.3.2. PFAS
and other contaminants associated with spills or land application can seep into the groundwater and can
eventually migrate to the surface waters and contaminate the local rivers. However, surface runoff during
wet weather is more likely to deliver large amounts of pollutants from the land surfaces to local surface
waterways rather than via the groundwater-surface water interface.
4.3.3 Cross-Contamination Mechanisms
A review of peer-reviewed literature and interviews with local experts on surface-groundwater interaction
pathways indicates that hydraulic connectivity via the high permeability of soils in the area is the most

Dayton Water Quality and Infrastructure Review October 11, 2021
Page | 46
robust pathway for exchange of surface water and groundwater in the Dayton area (Ritzi et al, 2000; Levy
et al, 2008; Soltanien, personal communication; Ritzi, personal communication). However, there are
other potential mechanisms, including BVA contamination from supplying the recharge lagoons with
contaminated river water and unintended connectivity caused by large flooding.

Dayton Water Quality and Infrastructure Review October 11, 2021
Page | 47
Figure 17. Wastewater-Related Potential Pollution Pathways of Contamination.

Dayton Water Quality and Infrastructure Review October 11, 2021
Page | 48
Figure 18. Potential Pollution Pathways by NPDES Point Sources.

Dayton Water Quality and Infrastructure Review October 11, 2021
Page | 49
Figure 19. Stormwater-Related Potential Pollution Pathways of Contamination.

Dayton Water Quality and Infrastructure Review October 11, 2021
Page | 50
Figure 20. Potential Pollution Pathways Due to Spills and Releases Reported to OEPA Since 2017.

Dayton Water Quality and Infrastructure Review October 11, 2021
Page | 51
5 Conclusions
5.1 Infrastructure
The reliable delivery of safe drinking water to the public is critical for public health and safety as well as
economic prosperity for a community. The ability to meet today’s demands as well as projected future
demands is a challenge all water suppliers face. Disruptions in service such as transmission main breaks,
loss of power or cyber threats can be catastrophic, but with preventative measures in place, a water system
can avoid these situations or at least be prepared to address them swiftly when they occur. The primary
objective of this infrastructure review is to assess and document the ability of Dayton’s Water system to
deliver safe drinking water to customers.
The Dayton Water system contains numerous critical infrastructure assets in order to supply water to the
City of Dayton, Montgomery County, and surrounding communities. Upon review of the numerous
records including previous studies, water facilities plans, asset management plans, capital improvement
plans, consumer confidence reports, inspection reports, and other pertinent documents, it is concluded
that Dayton Water is proactive in addressing the infrastructure needs for today and into the future. For
example, a Water Efficiency Master Plan (WEMP) was developed in 2012 by the City in partnership with
Montgomery County to determine improvements needed throughout the system. Some of the
improvements identified in the WEMP are still in progress. Also, the City is in the process of developing
the Water Facilities Master Plan (WFMP) and anticipates completion by late 2022/early 2023. The
WFMP is intended to be a comprehensive evaluation of the water supply and treatment systems. Also,
Dayton Water performs condition assessments of critical water infrastructure, such as transmission
mains, water storage tanks, and booster stations to aid in the prioritization of asset rehabilitation or
replacement.
Dayton Water has safeguards in place to prevent cyber threats and malevolent acts that may compromise
the ability to deliver safe drinking water. As required by OEPA, Dayton Water maintains a contingency
plan which addresses the system’s emergency preparedness. Dayton Water conducts emergency response
training exercises on a routine basis.
As mentioned in more detail in section 2.16, a gap anlaysis was performed to determine improvements
needed to maintain a reliable and safe delivery of finished water. These gaps are summarized as follows:
1. Provide Standby Power at Wellfields and WTPs to provide a minimum level of service.
2. Provide System Redundancy at Greater Moraine Water System.
3. Perform a Water Distribution System Model Calibration.
4. Perform a Water Surge Protection & Fire Flow Analysis.
5. Provide an updated evaluation of the Water Supply and Treatment System as is intended by the
WFMP.
6. Provide updated cost estimates and rate impacts as a result of the WFMP recommendations.

Dayton Water Quality and Infrastructure Review October 11, 2021
Page | 52
5.2 Source Water Quality
The Buried Valley Aquifer is a critical resource for the City of Dayton, Montgomery County, and the
regional area. It’s designation as a Sole Source Aquifer by the OEPA indicates it is the principal source of
drinking water for the area, so contamination would create a significant hazard to public health. OEPA
has designated the BVA as having a high susceptibility to contamination because of potential contaminant
sources within the well field area, and the aquifer’s hydrologic connection to surface water (the Great
Miami River and tributaries) via the recharge system and the sandy soils that promote infiltration to the
aquifer.
The City of Dayton has had a Multi-Jurisdictional Source Water Protection Plan (SWPP) in place since
1988 that describes how the City and other jurisdictions protect and preserve the groundwater that
supplies Dayton’s drinking water. Recognizing the necessity to balance economic development and source
water protection, the source water protection uses a multi-faceted approach to risk: management,
prevention, mitigation and reduction, informed by the one-year and five-year time of travel area
delineations. The City updated the SWPP in 2015 to revise the source water protection area and to reduce
the amount of chemicals that could be stored on site within the protection area.
The City of Dayton, through the Water Department, maintains an extensive network of 500 monitoring
wells in all of the well fields used as source water. These wells can serve as early warning of contaminant
migration into the source water intakes, and the regular monitoring that is conducted provides confidence
that any contamination in the groundwater is at safe levels, and provides a baseline for typical conditions.
The OEPA maintains the Ambient Ground Water Monitoring network, which was established in 1967, to
characterize groundwater conditions in Ohio.The Miami Conservancy District began conducting
semiannual groundwater monitoring at twelve locations in the Great Miami River watershed in 2014, with
the purpose of understanding the impact of human activities on groundwater quality. These wells are
located in areas surrounded by land uses with the potential to release contaminants to the aquifer, and
installed in unconfined sand and gravel aquifers with permeable soils at the surface.
All of this adds up to a lot of monitoring and good understanding of the water quality conditions in the
BVA, especially in the vicinity of the well fields used to supply the source water. The contaminants of most
concern are nitrate, volatile organic compounds, and PFAS (per and poly-fluoroalkyl substances).
Nitrate can occur naturally in surface and groundwater at levels that do not generally cause health
problems. High levels of nitrate in groundwater come from the use of nitrogen in agriculture, feedlots,
animal yards, septic systems and domestic or municipal wastewater. The maximum contaminant level for
nitrate is 10 mg/L. Nitrate levels have exceeded this level several times in several MCD wells since 2014.
Nitrate at high levels have been observed in the Great Miami River and its tributaries, especially the Mad
River, during periods when the flow is comprised primarily of groundwater. Nitrate will likely continue to
be a constituent of concern, given the types of land uses and connectivity between the surface and
groundwater, and will require continuing the close monitoring already being conducted. To date, the data
reviewed for this project indicates that treatment has been effective at reducing nitrate in the finished
(tap) water to safe levels.
Volatile organic compounds (VOCs) are commonly used in industrial and commercial applications, and
often contaminate groundwater through uncontrolled spills. There are several VOC plumes in the BVA
currently being tracked through monitoring and modeling. VOCs are readily removed through the
treatment process used by the City of Dayton and routine required monitoring indicates that levels in the
finished water are non-detect or at very low levels.
PFAS are an emerging contaminant issue in groundwater all over the country and the BVA is no
exception. PFAS are synthetic compounds that were developed in the 1930s and have been used widely in

Dayton Water Quality and Infrastructure Review October 11, 2021
Page | 53
a variety of industrial and commercial applications since the 1950s. It has been used as a surfactant,
coating, wetting agent, fume suppressant and aqueous film forming foam (AFFF).
At present the greatest risk to the water quality of the BVA is the impacts from PFAS substances. PFAS
has been detected in the raw and finished water of Dayton’s Ottawa Water Treatment Plant at
concentrations below 70 ppt, the current EPA Health Advisory Limit. The City’s Mad River wellfield is
located directly adjacent to and downgradient from Wright Patterson Air Force Base (WPAFB)
operations.
Because of the southwesterly direction of groundwater flow, towards the Mad River, any contaminants
released onto the ground or into the stormwater drainage system at WPAFB flow directly towards the
Mad River wellfield. WPAFB has been studying PFAS contamination at the Base since 2016, after
sampling by OEPA in 2014 and 2015 detected high levels in the groundwater in several areas. The City
took several of its production wells offline to limit the rate of migration of the PFAS plume towards the
well field. The City of Dayton also evaluated the potential for the City’s Firefighter Training Area to have
also been a source of PFAS contamination to the groundwater. The City and WPAFB are currently in a
legal dispute over the PFAS contamination. Other potential sources of PFAS include discharges to surface
waters that migrate down to the BVA, failing septic systems, and spills. However, these sources are minor
in terms of the amount of PFAS contamination as compared to the potential magnitude due to use of
AFFF and subsequent releases to the environment.
The City is routinely conducting PFAS sampling at a varying number of monitoring well locations. The
EPA Health Advisory Limit for PFOA and PFOS is 70 parts per trillion (ppt). Monitoring well MW-122S
was the only location where one or more of the sampling events exceeding the EPA Health Advisory Limit
based on the sum of PFAS and PFOA. Treated primary effluent concentrations for PFOS and PFOA from
both the Ottawa and Miami plants were well below the 70 ppt threshold. Nevertheless, is it likely that
once OEPA or EPA establish regulatory limits for safe water quality levels of PFAS, the Water Department
will need to invest in additional treatment technologies to ensure the finished water meets the regulatory
limits.
Overall, the water quality in the BVA is very good. This robust water resource is clearly valued by the
community and the City. Extensive monitoring and implementation of the SWPP have and continue to
provide protection through risk mitigation, early warning of contamination and prompt intervention. The
degree that PFAS affects water quality and treatment control investment requirements is still playing out,
but is where this team expects the most immediate threat to the continued use of the BVA as a drinking
water source.

Dayton Water Quality and Infrastructure Review October 11, 2021
Page | 54
Blank page

Dayton Water Quality and Infrastructure Review October 11, 2021
Page | 55
6 Dayton Water User Committee
Committee Members
Mary Boosalis, Premier Health Partners
Terry Burns, Kettering Health Network
Dave Dickerson, Miller Valentine Group
Shelley Dickstein, City of Dayton
Jeff Hoagland, Dayton Development Coalition
Steve Johnson, Sinclair Community College
Chris Kershner, Dayton Area Chamber of Commerce
Debbie Lieberman, Montgomery County
Hon. Mary McDonald, City of Trotwood
Phil Parker, Dayton Area Chamber of Commerce
Earhardt Preitauer, CareSource
Tom Raga, AES Ohio
Eric Spina, University of Dayton
Committee designees
Frank Debrosse, Office of Congressman Mike Turner
Diane Ewing, Premier Health Partners
Dan McCabe, CareSource
Project and Consultant Management
Mike Ekberg, Miami Conservancy District
Janet Bly, Miami Conservancy District

Dayton Water Quality and Infrastructure Review October 11, 2021
Page | 56
Blank Page

Dayton Water Quality and Infrastructure Review October 11, 2021
Page | 57
7 References
City of Dayton, 2012. Water Quality Report.
City of Dayton Water Quality and Infrastructure Review RFI Summary. February 2021.
City of Dayton Water Distribution Master Plan – Hydraulic Model Development and Calibration
Technical Memorandum. December 2005
City of Dayton Water Distribution Master Plan – System Operation Summary Technical Memorandum.
January 2005
City of Dayton Distribution System SURGE Modeling. June 2006
City of Dayton. Zoning Regulations.
City of Dayton. 2021. Personal Communication
Levy, J., Wojnar, A., Mutiti, S. 2008. Investigating Riverbed Hydraulic Conductivity at Several Well Fields
along the Great Miami River, Southwest Ohio. Final Report. Submitted to the Hamilton to New Baltimore
Groundwater Consortium, the Miami Conservancy District, and the Ohio Water Development Authority.
MCD Report No. 08-11.
LimnoTech. 2017. Lower Great Maimi River Nutrient Management Project. Final Report. Prepared by
LimnoTech for the Miami Conservancy District. February 28, 2017.
Miami Conservancy District (MCD). 2011. Pharmaceuticals and Personal Care Products (PPCPs) in the
Streams and Aquifers of the Great Miami River Basin. Final Report. Prepared by Michael P. Eckberg
(MCD) and Bruce A. Pletsch (MCD). December 31, 2011. MCD Report No. 2011-18.
Miami Conservancy District. 2020. Groundwater Quality Survey.
MCD. 2016. 2016 Groundwater Quality Survey. MCD Report 2016-26.
MCD. 2017. 2017 Groundwater Quality Survey and Contaminant Trends Study Report. MCD Report 2017-
16.
MCD. 2018. 2018 Groundwater Quality Survey and Contaminant Trends Study Report. MCD Report
2018-21.
MCD. 2019a. Dual Isotope Tracing of Nitrate Contaminant Source in Surface and Groundwater in the
Great Miami River Watershed, Southwestern Ohio. Final Report. Prepared by Zelalem Bedaso (University
of Dayton) and Mike Ekberg (MCD). MCD Report No. 2019-12.
MCD. 2019b. 2019 Groundwater Quality Survey and Contaminant Trends Study Report. MCD Report
2019-14.
MCD. 2020. 2020 Groundwater Quality Survey and Contaminant Trends Study Report. MCD Report
2020-45.
Ohio Environmental Protection Agency (OEPA). 1997. Biological and Water Quality Study of the Middle
and Lower Great Miami River and Selected Tributaries, 1995. Montgomery, Warren, Butler and Hamilton
Counties, Ohio. OEPA Technical Report MAS/1996-12-8. Prepared by OEPA Division of Surface Water,
Columbus, OH. December 30, 1997.

Dayton Water Quality and Infrastructure Review October 11, 2021
Page | 58
OEPA. 2005. Biological and Water Quality Study of the Mad River Basin, 2003. Logan, Champaign, Clark,
Miami, Greene, and Montgomery Counties, Ohio. OEPA Technical Report EAS/2005-5-5. Prepared by
OEPA Division of Surface Water, Columbus, OH. May 25, 2005.
OEPA. 2009. Total Maximum Daily Loads for the Mad River Watershed. Prepared by OEPA Division of
Surface Water, Columbus, OH. December 18, 2009.
OEPA. 2013. Biological and Water Quality Study of the Middle Great Miami River and Principal
Tributaries, 2009. Miami, Shelby, Montgomery, and Clark Counties. OEPA Technical Report EAS/2012-1-
2. Prepared by OEPA Division of Surface Water, Columbus, OH. January 29, 2013.
OEPA. Ambient Groundwater Monitoring Interactive Map.
https://www.arcgis.com/apps/webappviewer/index.html?id=b39b9cbeb3834e9ca598d968d16333ce
Review of Existing City Developed and Undeveloped Well Fields. February 2006.
Ritzi, R.W., Dominic, D.F., Slesers, A.J., Greer, C.B., Reboulet, E.C., Telford, J.A., Masters, R.W., Klohe,
C.A., Bogle, J.L, Means, B.P. 2000. Comparing Statistical Models of Physical Heterogeneity in Buried
Valley Aquifers. Water Resources Research, Vol. 36, No. 11, pg. 3179-3192. November 2020.
Sheets, R.A., Darner, R.A., Whitteberry, B.L. 2002. Lag Times of Bank Filtration at a Well Field,
Cincinnati, Ohio, USA. Journal of Hydrology 266 (2002) 162-174.
Spieker, A. 1968. Groundwater Hydrology and Geology of the Lower Great Miami River Valley Ohio.
Geological Survey Professional Paper 605-A. Prepared in cooperation with the Miami Conservancy
District and the Ohio Department of Natural Resources.
United States Geological Survey (USGS). 2006. Simulation of Streamflow and Water Quality to Determine
Fecal Coliform and Nitrate Concentrations and Loads in the Mad River Basin, Ohio. Prepared by David C.
Reutter, Barry M. Puskas, and Martha L. Jagucki. Scientific Investigations Report 2006-5160.
Wallace, C.D., Soltanian, M.R. 2021a. Underlying Riparian Lithology Controls Redox Dynamics During
Stage-Driven Mixing. Journal of Hydrology 595 (2021) 126035.
Wallace, C.D., Soltanian, M.R. 2021b. Surface Water-Groundwater Exchange Dynamics in Buried Valley
Aquifer Systems. Hydrological Processes. 35:e14066.
Water Distribution Master Plan. May 2007
Water Efficiency Master Plan (WEMP). May 2014.
Water Treatment Plant Emergency Power Overview. June 2019.
Wood. 2018. PFAS Source Determination Report, Fire Training Center and Surrounding Area, Dayton,
Ohio.
Wright-Patterson Air Force Base. Final Preliminary Assessment Report for Perfluorinated Compounds
Wright-Patterson Air Force Base Ohio, 2015.
Wright-Patterson Air Force Base, 2020. Presentation
Zhou, Y., Ritzi, R.W., Soltanian, M.R., Dominic, D.F. 2014. The Influence of Streambed Heterogeneity on
Hyporheic Flow in Gravelly Rivers. Groundwater, Vol. 52, No. 2, pg. 206-216. March-April 2014.