Embed Size (px)
Citation preview
DB Seminar Series:HARP: A Hierarchical Algorithm with Automatic Relevant Attribute Selection for Projected Clustering
Presented by:Kevin Yip20 September 2002
2
Short Summary
Our own work (unpublished), supervised by Dr. Cheung and Dr. NgProblem: to cluster datasets of very high dimensionalityAssumption: clusters are formed in subspaces

3
Short Summary
Previous approaches: either have special restrictions on the dataset or target clusters, or cannot determine the dimensionality of the clusters automaticallyOur approach: not restricted by these limitations
4
Presentation Outline
ClusteringProjected clusteringPrevious approaches to projected clusteringOur approach: HARP– Concepts– Implementation: HARP.1– Experiments
Future work and conclusions
5
Clustering
Goal: given a dataset D with N records and d attributes (dimensions), partition the records into k disjoint clusters such that– Intra-cluster similarity is maximized– Inter-cluster similarity is minimized

6
Clustering
How to measure similarity?– Distance-based: Manhattan distance, Euclidean
distance, etc.– Correlation-based: cosine correlation, Pearson
correlation, etc.– Link-based (common neighbors)– Pattern-based
1 2 3 4 5 6
7
Clustering
2 common types of clustering algorithms:– Partitional: selects some representative points for
each cluster, assigns all other points to their closest clusters, and then re-determines the new representative points
– Hierarchical (agglomerative): repeatedly determines the two most similar clusters, and merges them
8
Clustering
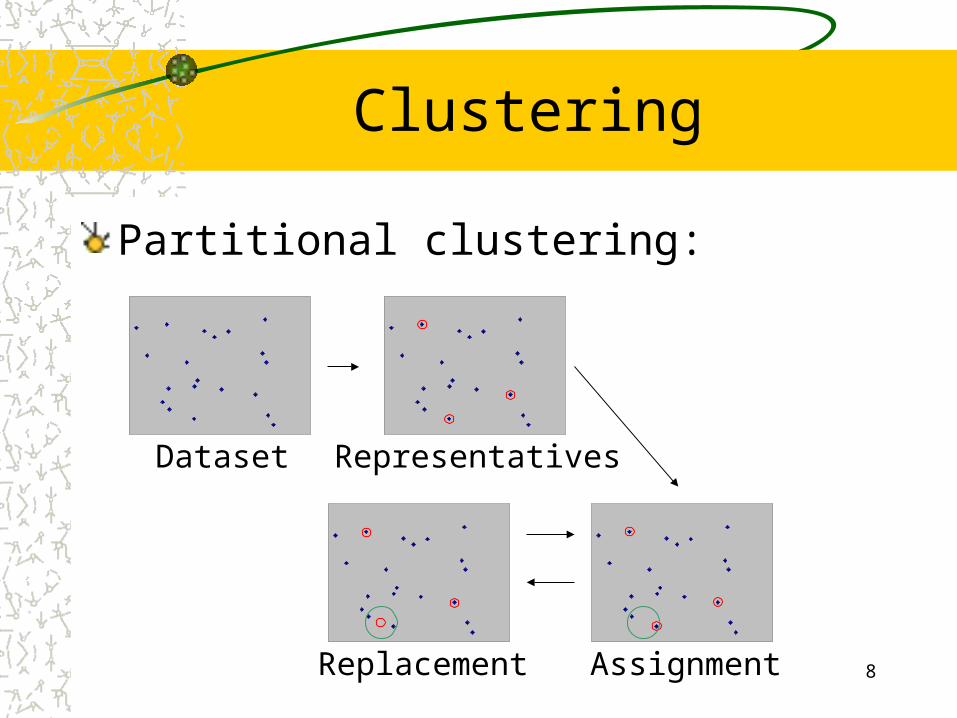
Partitional clustering:
Dataset Representatives
AssignmentReplacement

9
Clustering
Hierarchical clustering:
Dataset Similarity calculation
Best mergedetermination
Merging
10
Projected Clustering
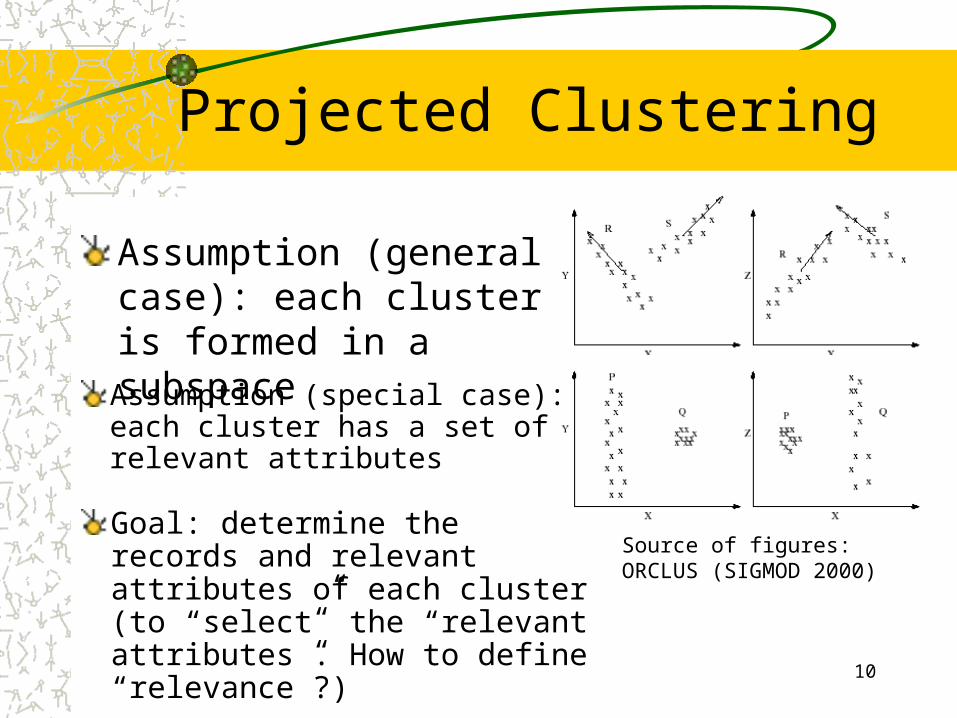
Assumption (general case): each cluster is formed in a subspace
Source of figures:ORCLUS (SIGMOD 2000)
Assumption (special case): each cluster has a set of relevant attributesGoal: determine the records and relevant attributes of each cluster (to “select” the “relevant attributes”. How to define “relevance”?)

11
Projected Clustering
A 3-D view:
Source of figure:
DOC (SIGMOD 2002)

12
Projected Clustering
An example dataset:Person Age Virus Level Blood Type Disease A
1 35 0.6 AB Uninfected
2 64 0.9 AB Uninfected
3 27 1.1 AB Uninfected
4 18 9.8 O Infected
5 42 8.6 AB Infected
6 53 11.3 B Infected
7 37 0.7 O Recovered
8 28 0.4 A Recovered
9 65 0.9 B Recovered
13
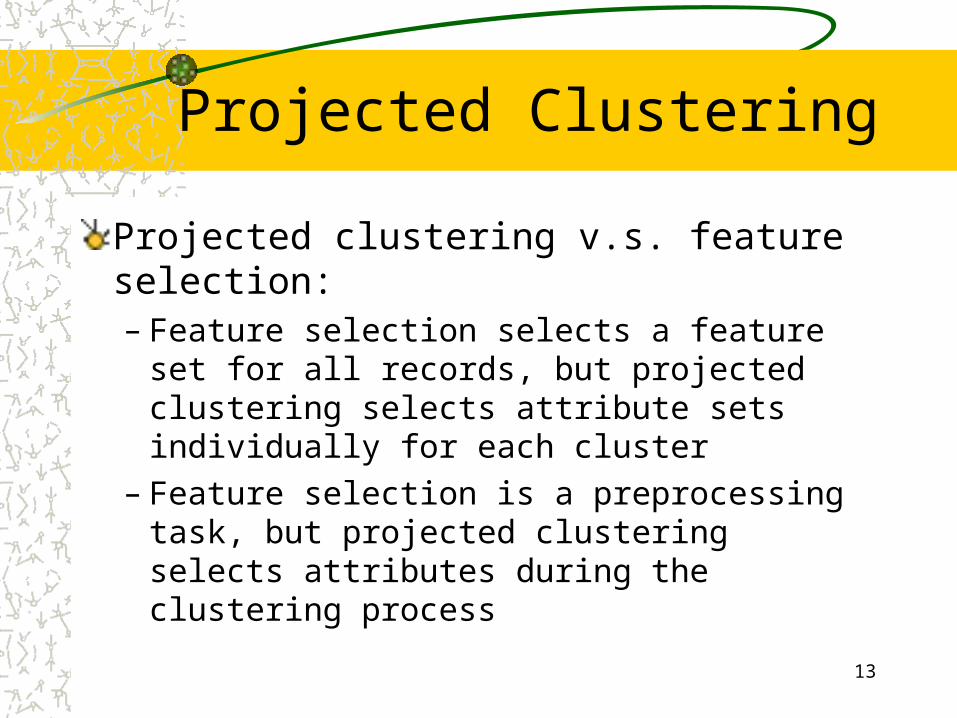
Projected Clustering
Projected clustering v.s. feature selection:– Feature selection selects a feature set for all records,
but projected clustering selects attribute sets individually for each cluster
– Feature selection is a preprocessing task, but projected clustering selects attributes during the clustering process

14
Projected Clustering
Why projected clustering is important?– At high dimensionality, the data points are sparse,
the distance between any two points is almost the same
– There are many noise attributes that we are not interested in
– High dimensionality implies high computational complexity
15
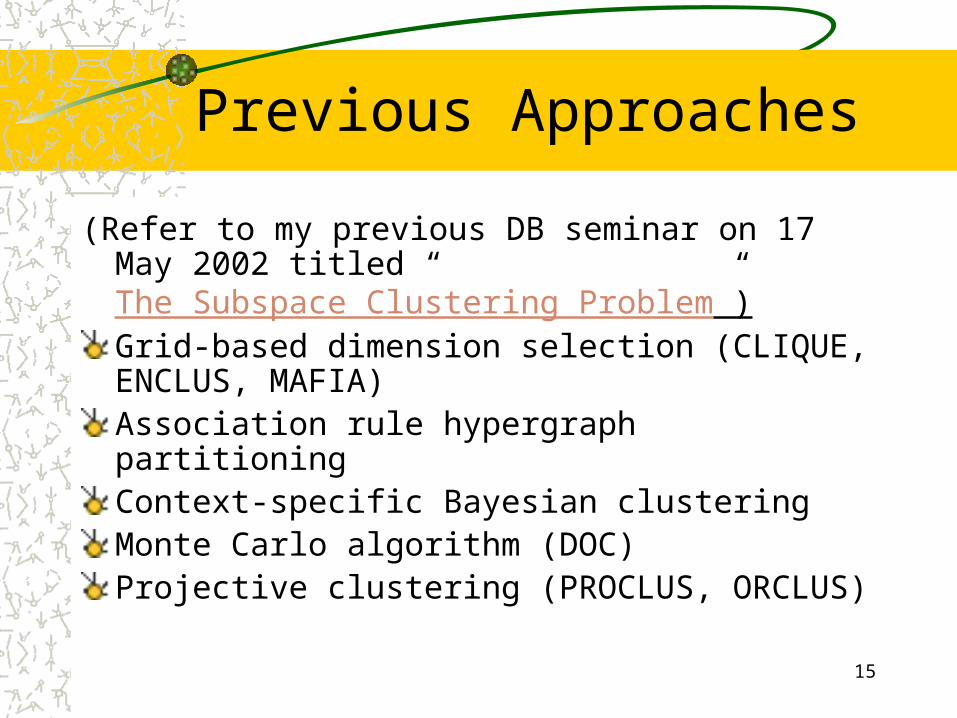
Previous Approaches
(Refer to my previous DB seminar on 17 May 2002 titled “The Subspace Clustering Problem”)Grid-based dimension selection (CLIQUE, ENCLUS, MAFIA)Association rule hypergraph partitioningContext-specific Bayesian clusteringMonte Carlo algorithm (DOC)Projective clustering (PROCLUS, ORCLUS)
16
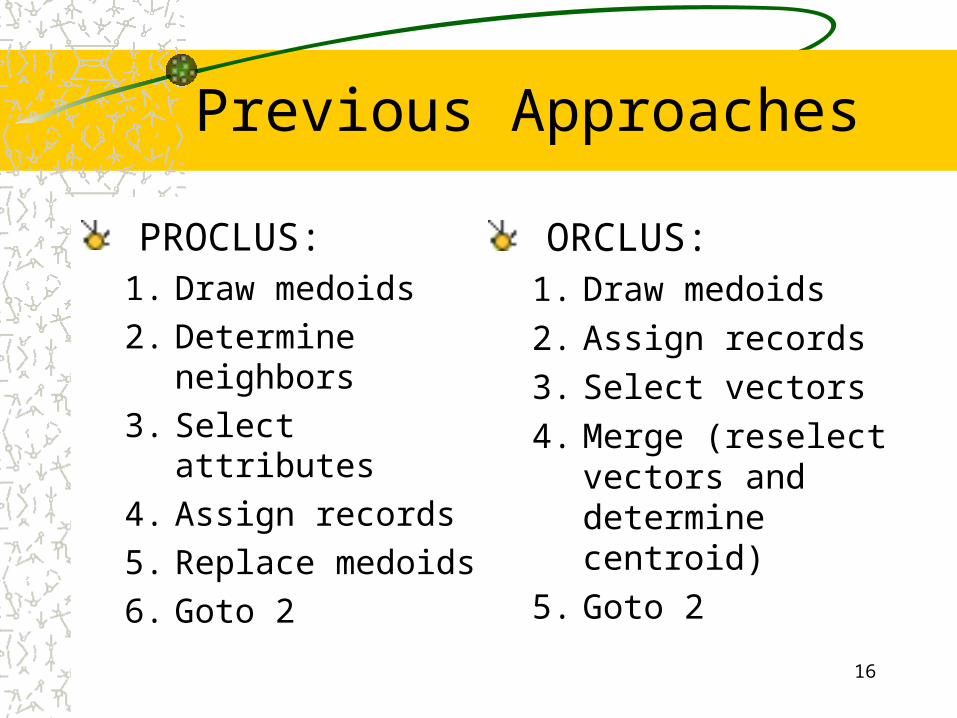
Previous Approaches
PROCLUS:1. Draw medoids2. Determine neighbors3. Select attributes4. Assign records5. Replace medoids6. Goto 2
ORCLUS:1. Draw medoids2. Assign records3. Select vectors4. Merge (reselect vectors
and determine centroid)5. Goto 2
17
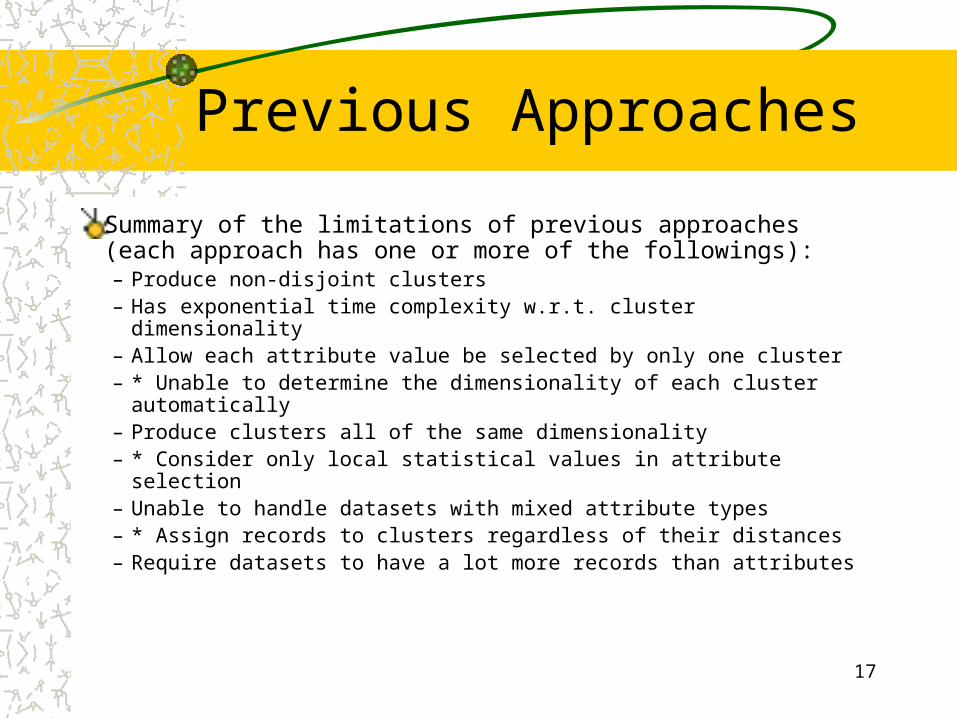
Previous Approaches
Summary of the limitations of previous approaches (each approach has one or more of the followings):– Produce non-disjoint clusters– Has exponential time complexity w.r.t. cluster dimensionality– Allow each attribute value be selected by only one cluster– * Unable to determine the dimensionality of each cluster automatically– Produce clusters all of the same dimensionality– * Consider only local statistical values in attribute selection– Unable to handle datasets with mixed attribute types– * Assign records to clusters regardless of their distances– Require datasets to have a lot more records than attributes
18
Our Approach: HARP
Motivations:– From datasets: we want to study gene expression
profile datasets (usually with thousands of genes and less than a hundred samples)
– From previous algorithms: we want to develop a new algorithm that does not have any of the above limitations
19
Our Approach: HARP
HARP: a Hierarchical algorithm with Automatic Relevant attribute selection for Projected clusteringSpecial features:– Automatic attribute selection– Customizable procedures– Mutual disagreement prevention

20
Our Approach: HARP
Special implementation based on attribute value density, HARP.1:– Use of global statistics in attribute selection– Generic similarity calculations that can handle both
categorical and numeric attributes– Implementing all mutual disagreement mechanisms
defined by HARP– Reduced time complexity by pre-clustering

21
Our Approach: HARP
Basic idea:– In the partitional approaches:
• At the beginning, each record is assigned to a cluster by calculating distances/similarities using all attributes
• Very likely that some assignments are incorrect• No clue to find the dimensionality of the clusters
– Our approach:• Allow only the “best merges” at any time
22
Out Approach: HARP
Basic idea:– “Best”: a merge is permitted only if
• Each selected attribute of the resulting cluster has a relevance of at least dt
• The resulting cluster has more than mapc selected attributes
• The two participating clusters have a mutual disagreement not larger than md
– Mapc, dt, md: threshold variables
23
Our Approach: HARP
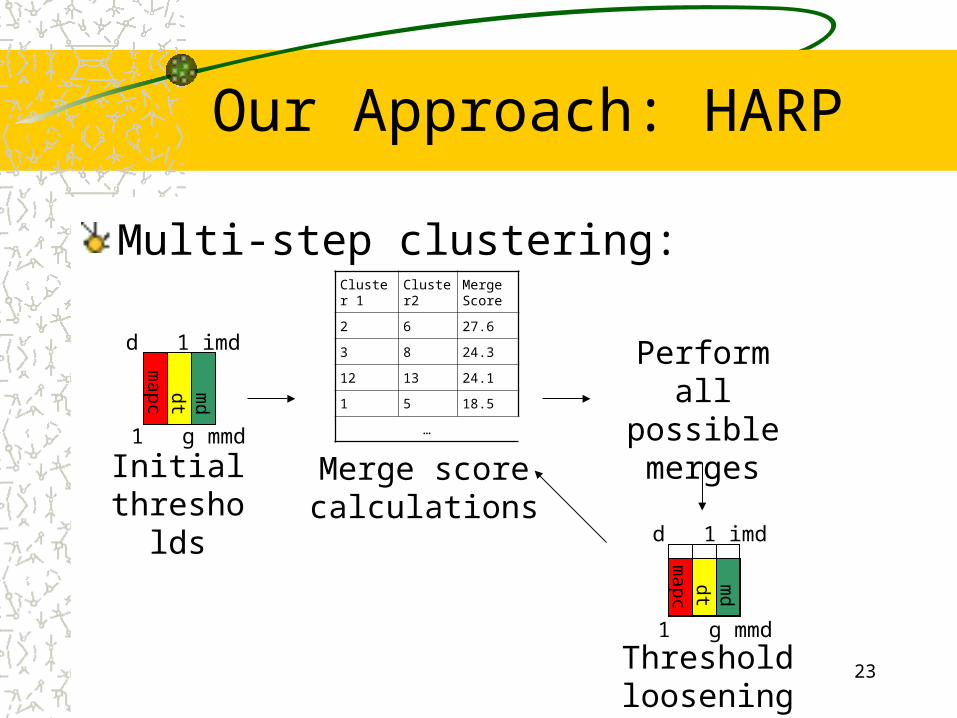
Multi-step clustering:
mapc dtm
d
Initialthresholds
Cluster 1 Cluster2 Merge Score
2 6 27.6
3 8 24.3
12 13 24.1
1 5 18.5
…
Merge scorecalculations
Perform all possible merges
d 1 imd
1 g mmd
mapc dtm
d
Thresholdloosening
1 g mmd
d 1 imd

24
Our Approach: HARP
Expected resulting clusters:– Have all relevant attributes selected (due to mapc)– Selected attributes have high relevance to the cluster
(due to dt)– Not biased by the participating clusters (due to md
and some other mechanisms)
25
Our Approach: HARP
More details: attribute relevance– Depending on the definition of the similarity measure– E.g. the density-based measure defines the
relevance of an attribute to a cluster by the “compactness” of its values in the cluster. Compactness can be reflected by the variance value
26
Our Approach: HARP
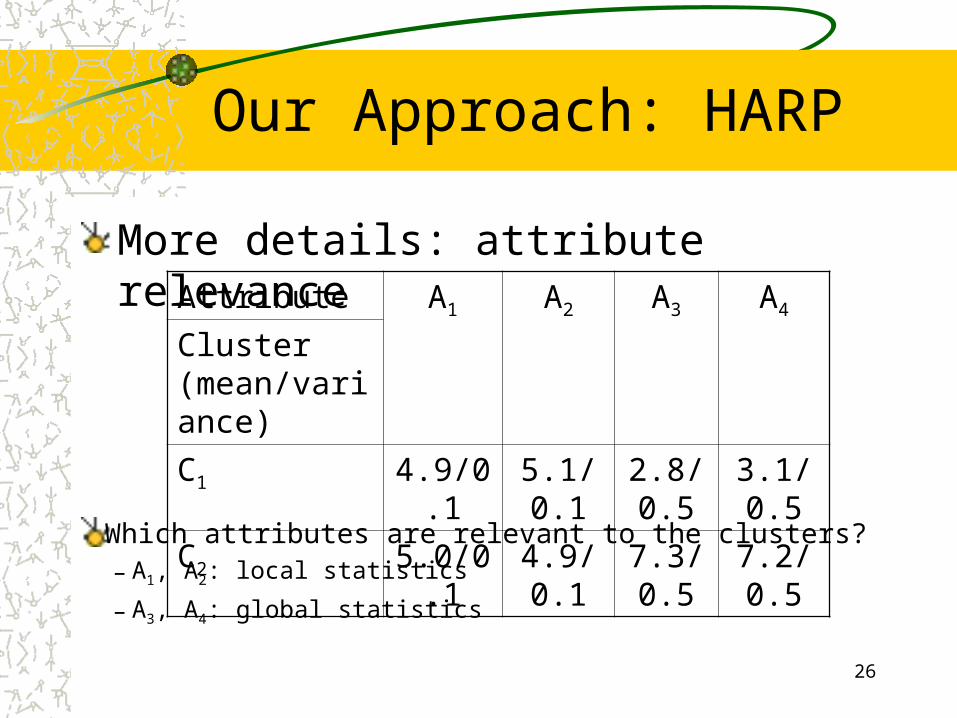
More details: attribute relevanceAttribute A1 A2 A3 A4
Cluster (mean/variance)C1 4.9/0.1 5.1/0.1 2.8/0.5 3.1/0.5
C2 5.0/0.1 4.9/0.1 7.3/0.5 7.2/0.5
Which attributes are relevant to the clusters?– A1, A2: local statistics
– A3, A4: global statistics
27
Our Approach: HARP
More details: mutual disagreement– The two clusters participating in a merge do not
agree with each other
28
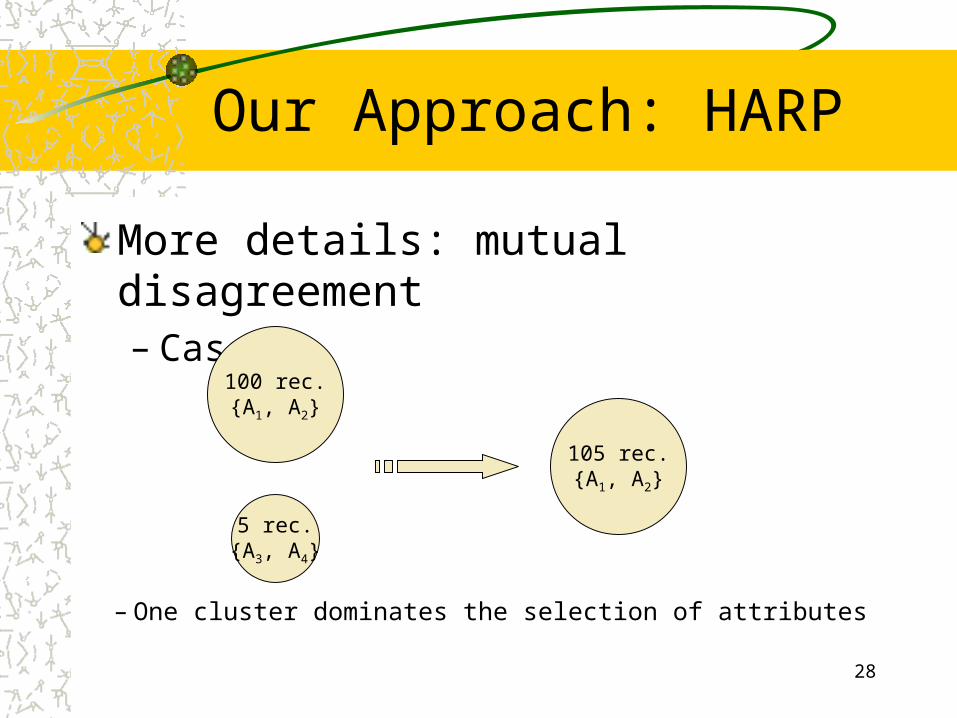
Our Approach: HARP
More details: mutual disagreement– Case 1:
– One cluster dominates the selection of attributes
100 rec.{A1, A2}
5 rec.{A3, A4}
105 rec.{A1, A2}

29
Our Approach: HARP
More details: mutual disagreement– Case 2:
– The clusters lose some information due to the merge
50 rec.{A1, A2}
100 rec.{A1, A2}
50 rec.{A1, A2,…,A6}
30
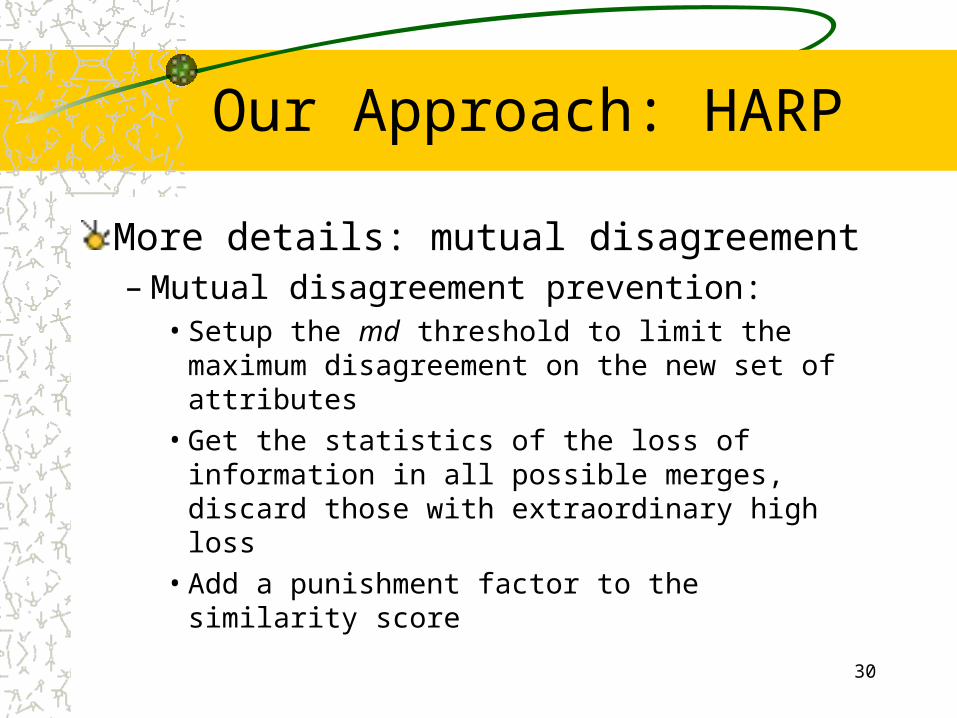
Our Approach: HARP
More details: mutual disagreement– Mutual disagreement prevention:
• Setup the md threshold to limit the maximum disagreement on the new set of attributes
• Get the statistics of the loss of information in all possible merges, discard those with extraordinary high loss
• Add a punishment factor to the similarity score
31
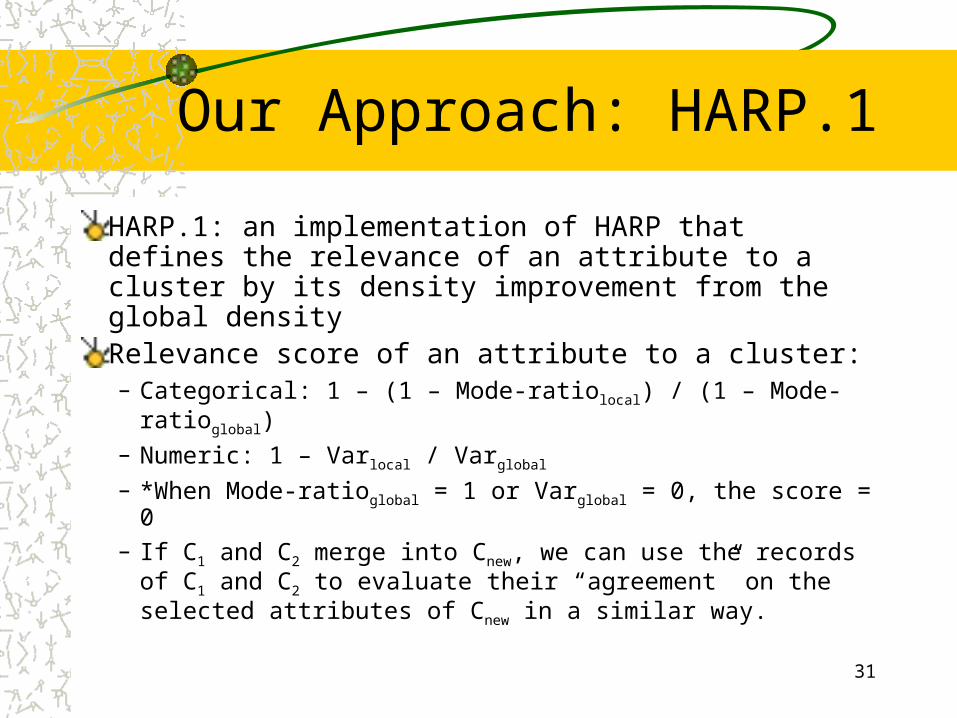
Our Approach: HARP.1
HARP.1: an implementation of HARP that defines the relevance of an attribute to a cluster by its density improvement from the global densityRelevance score of an attribute to a cluster:– Categorical: 1 – (1 – Mode-ratiolocal) / (1 – Mode-ratioglobal)– Numeric: 1 – Varlocal / Varglobal
– *When Mode-ratioglobal = 1 or Varglobal = 0, the score = 0– If C1 and C2 merge into Cnew, we can use the records of C1
and C2 to evaluate their “agreement” on the selected attributes of Cnew in a similar way.
32
Our Approach: HARP.1
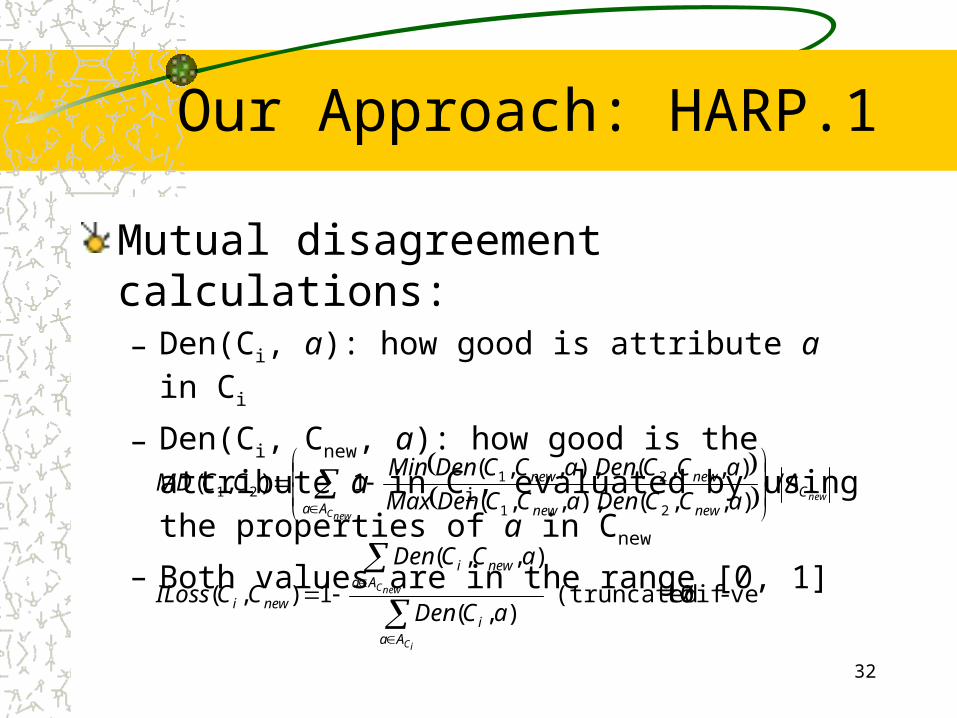
Mutual disagreement calculations:– Den(Ci, a): how good is attribute a in Ci
– Den(Ci, Cnew, a): how good is the attribute a in Ci, evaluated by using the properties of a in Cnew
– Both values are in the range [0, 1] new
newC
CAa newnew
newnew AaCCDenaCCDenMax
aCCDenaCCDenMinCCMD /
),,(),,,(
),,(),,,(1),(
21
2121
ve)- if 0 to(truncated ),(
),,(
1),(
iC
newC
Aai
Aanewi
newi aCDen
aCCDen
CCILoss
33
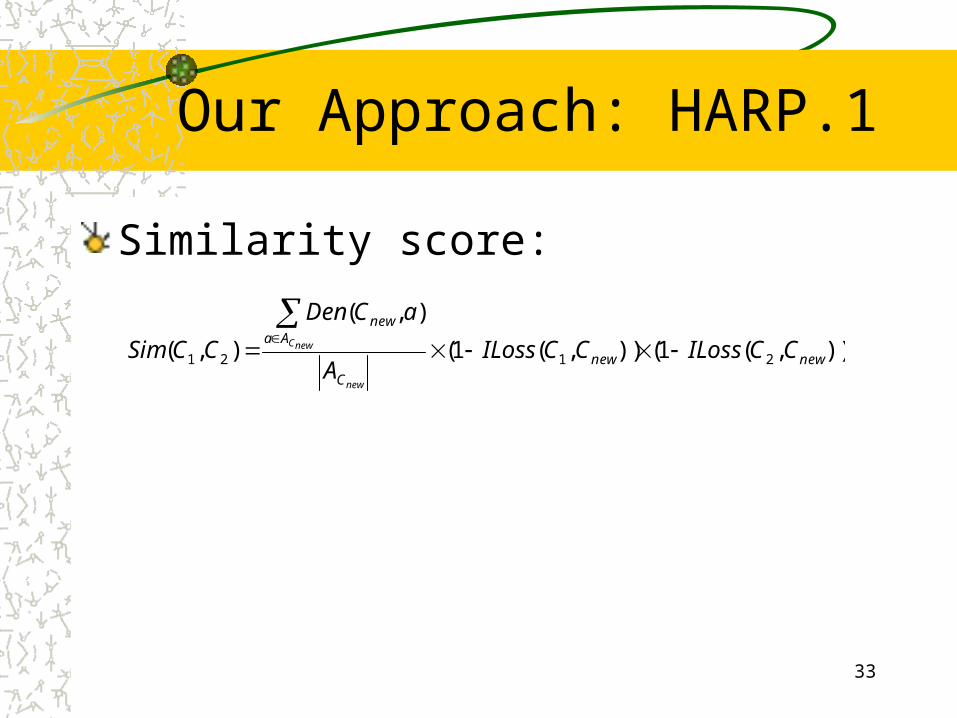
Our Approach: HARP.1
Similarity score:
)),(1()),(1(
),(
),( 2121 newnew
C
Aanew
CCILossCCILossA
aCDen
CCSimnew
newC

34
mapc dtm
d
Thresholdloosening
1 g mmd
d 1 imd
Our Approach: HARP.1
Multi-step clustering:
Initialthresholds
Cluster 1 Cluster2 Merge Score
2 6 27.6
3 8 24.3
12 13 24.1
1 5 18.5
…
Merge scorecalculations
Perform all possible merges1 g mmd
Baseline value for each dt variable: the global statistical value
Initial and baseline values for the md variable: user parameters, default 10 and 50
With mutual disagreement prevention:1. MD(C1,C2) <= md2. Sum of and difference between
ILoss(C1,Cnew) and ILoss(C2,Cnew) not more than a certain s.d. from mean
3. Punishment factor in similarity score
Each cluster keeps a local score list (binary tree) containing merges with all other clusters. The best scores are propagated to a global score list
mapc dtm
d
d 1 imd
35
Our Approach: HARP.1
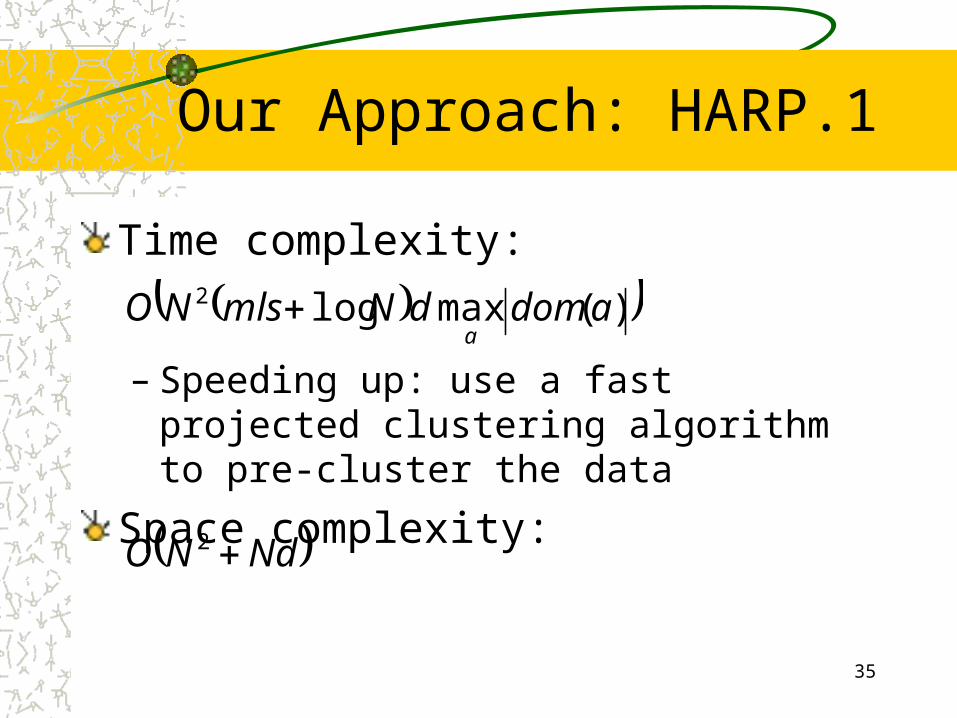
Time complexity:
)(maxlog2 adomdNmlsNOa
– Speeding up: use a fast projected clustering algorithm to pre-cluster the data
Space complexity:
NdNO 2

36
Our Approach: HARP.1
Accuracy experiments (datasets):Name Type Rec. Class Cat./Num. Attr. Avg. Rel. Attr. Outlier (%)
Soybean Real-life 47 4 35 / 0 26 ?
Voting Real-life 435 2 16 / 0 11 ?
Mushroom Real-life 8124 2 22 / 0 15 ?
SynCat1 Synthetic 500 5 20 / 0 12 5
SynMix1 Synthetic 500 5 10 / 10 12 5
SynNum1 Synthetic 500 5 0 / 20 12 5
SynCat2 Synthetic 500 5 20 / 0 7 5
SynMix2 Synthetic 500 5 10 / 10 7 5
SynNum2 Synthetic 500 5 0 / 20 7 5

37
Our Approach: HARP.1
Accuracy experiments (results1):
Dataset HARP.1 PROCLUS Traditional ROCK
Soybean 0.0 / 0.0 0.0 / 0.017.3 / 0.0
2.1 / 0.09.2 / 0.0
No published result
Voting 6.4 / 13.6 2.1 / 55.613.8 / 7.9
13.1 /11.313.1 / 1.9
6.2 / 14.5
Mushroom 1.4 / 0.0 3.2 / 0.09.0 / 0.0
6.0 / 0.05.2 / 0.0
0.4 / 0.0
Best score: error% / outlier%
Average: error% / outlier%

38
Our Approach: HARP.1
Accuracy experiments (results2):Dataset HARP.1 PROCLUS Traditional ORCLUS
SynCat1 0.0 / 5.0 3.6 / 1.46.7 / 3.7
2.6 /26.45.8 / 5.3
N/A
SynMix1 0.4 / 6.8 2.2 / 17.06.8 / 10.1
11.6 /11.27.9 / 4.6
N/A
SynNum1 0.8 / 5.0 1.8 / 21.47.2 / 8.3
4.4 /32.05.9 / 9.2
0.4 / 23.82.31 / 8.15
SynCat2 4.0 / 8.4 11.0 / 31.025.0 / 14.4
17.8 /23.828.5 / 5.4
N/A
SynMix2 11.4 / 4.4 16.6 / 62.225.4 / 32.8
17.6 /38.624.1 /11.6
N/A
SynNum2 18.8 / 4.4 11.6 / 50.818.7 / 20.7
11.6 /28.023.3 /10.9
50.8 / 0.057.2 / 0.0
39
Our Approach: HARP.1
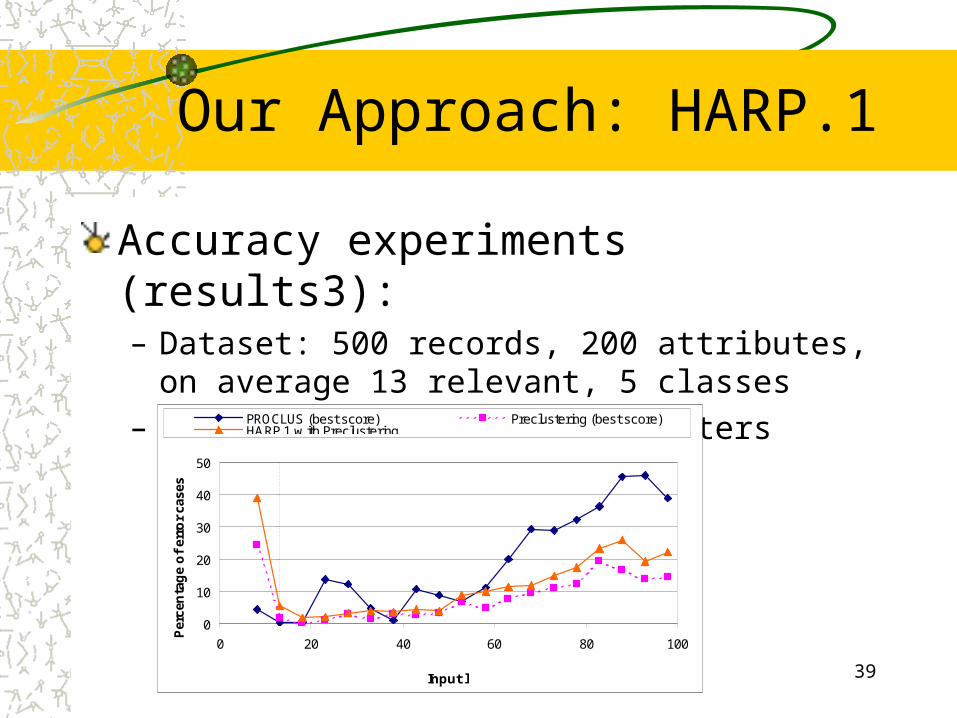
Accuracy experiments (results3):– Dataset: 500 records, 200 attributes, on average 13 relevant,
5 classes– Pre-clustering: form 50 clusters
0
10
20
30
40
50
0 20 40 60 80 100
Input l
Per
cen
tag
e o
f er
ror
case
s
PROCLUS (best score) Preclustering (best score)HARP.1 w ith Preclustering
40
Our Approach: HARP.1
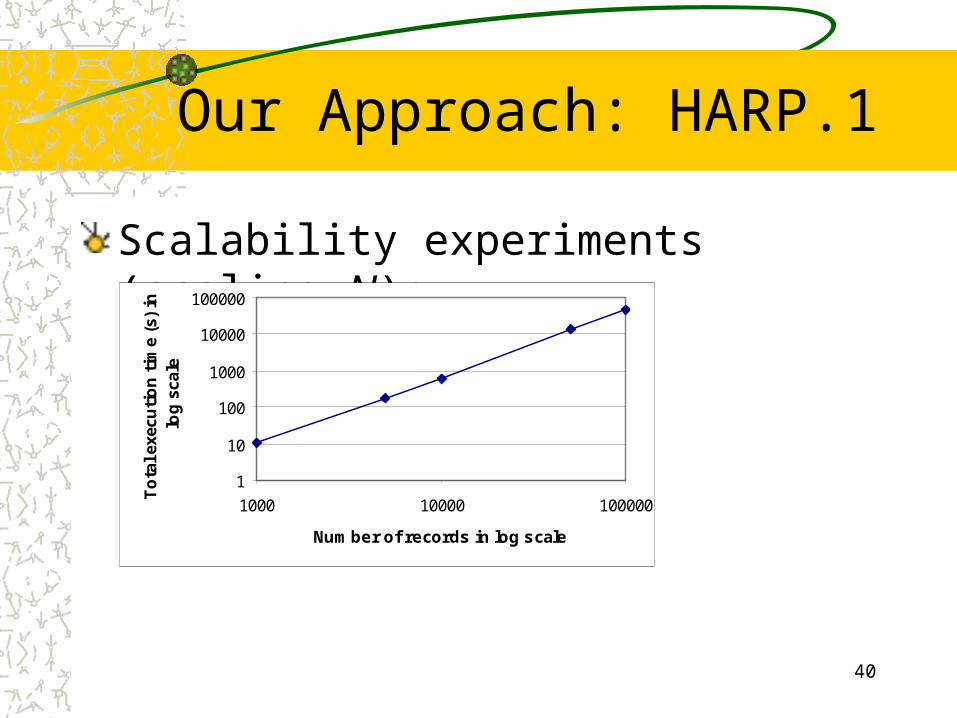
Scalability experiments (scaling N):
1
10
100
1000
10000
100000
1000 10000 100000
Number of records in log scale
To
tal e
xecu
tio
n t
ime
(s)
in
log
sca
le
41
Our Approach: HARP.1
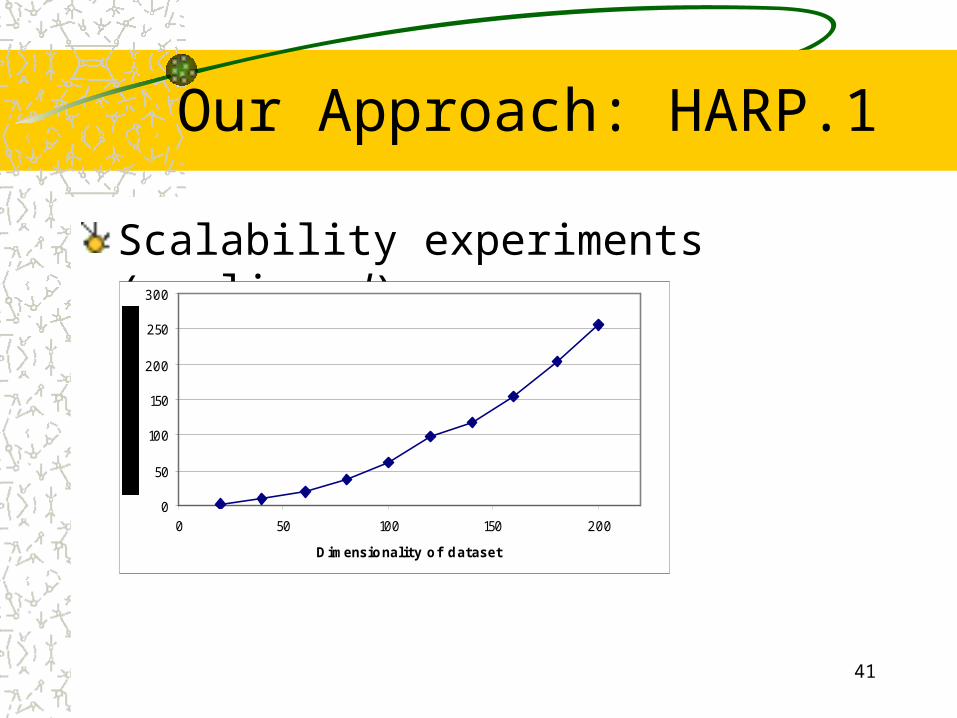
Scalability experiments (scaling d):
0
50
100
150
200
250
300
0 50 100 150 200
Dimensionality of dataset
42
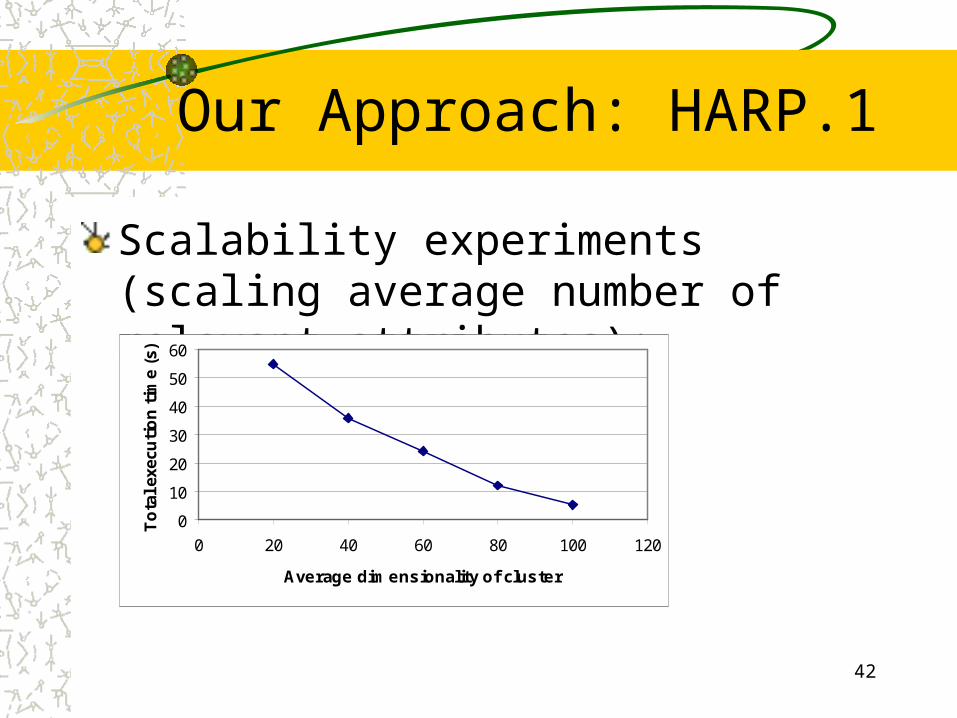
Our Approach: HARP.1
Scalability experiments (scaling average number of relevant attributes):
0
10
20
30
40
50
60
0 20 40 60 80 100 120
Average dimensionality of cluster
To
tal e
xecu
tio
n t
ime
(s)
43
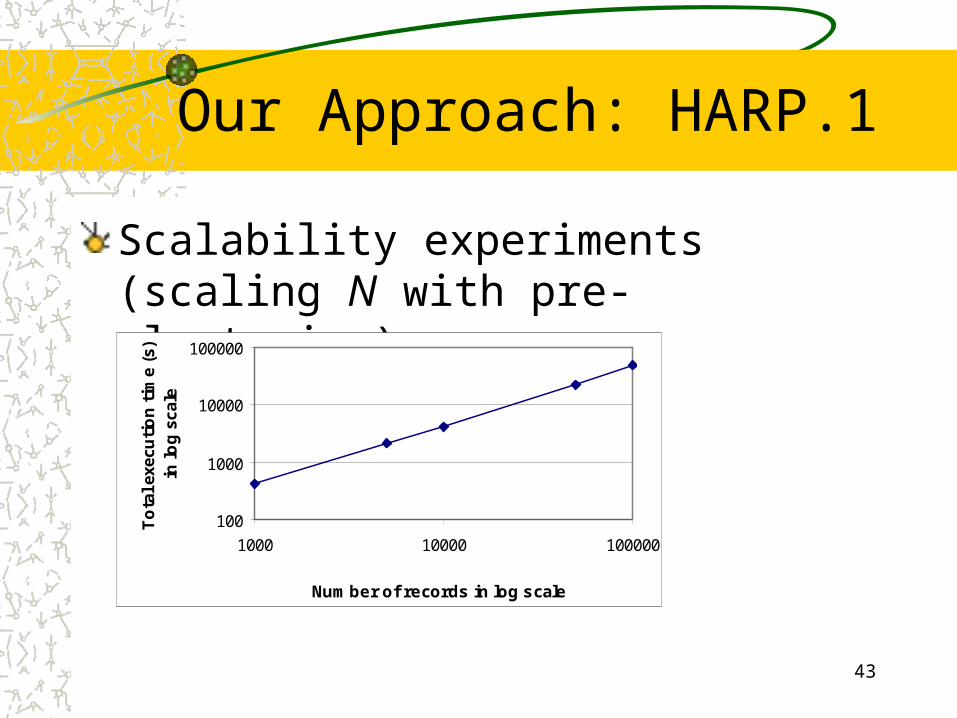
Our Approach: HARP.1
Scalability experiments (scaling N with pre-clustering):
100
1000
10000
100000
1000 10000 100000
Number of records in log scale
To
tal e
xecu
tio
n t
ime
(s)
in lo
g s
cale
44
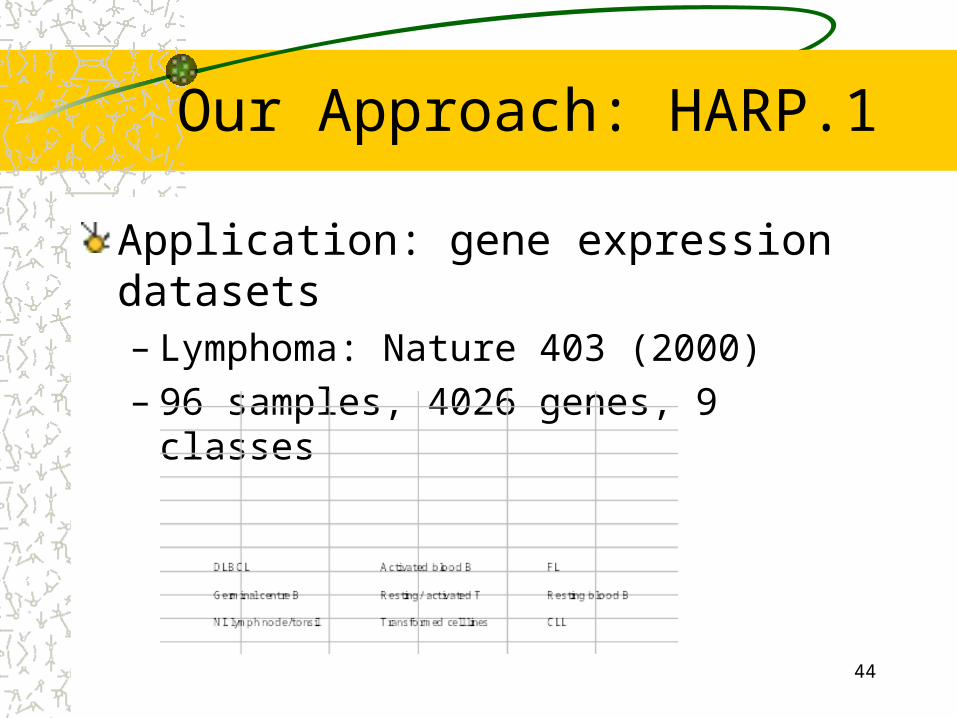
Our Approach: HARP.1
Application: gene expression datasets– Lymphoma: Nature 403 (2000)– 96 samples, 4026 genes, 9 classes
45
Our Approach: HARP.1
Application: gene expression datasets– Can also use genes as records and samples as
attributes:• E.g. use the dendrogram to produce an ordering of all
genes• Based on some domain knowledge, validate the ordering• If the ordering is valid, the position of other genes of
unknown functions can be analyzed
46
Future Work
Produce more implementations based on other similarity measuresStudy the definition of “relevance” in gene expression datasetsConsider very large datasets that cannot fit into main memoryExtend the approach to solve other problems, e.g. k-NN in high dimensional space
47
Conclusions
A hierarchical projected clustering algorithm, HARP, is developed with– Dynamic selection of relevant attributes– Mutual disagreement prevention– Generic similarity calculation
A density-based implementation called HARP.1 is developed with– Good accuracy– Reasonable time complexity– Real applications on gene expression datasets
48
References
C. C. Aggarwal, C. Procopiuc, J. L. Wolf, P. S. Yu, and J. S. Park. Fast algorithms for projected clustering. In ACM SIGMOD International Conference on Management of Data, 1999.C. C. Aggarwal and P. S. Yu. Finding generalized projected clusters in high dimensional spaces. pages 70{81, 2000.R. Agrawal, J. Gehrke, D. Gunopulos, and P. Raghavan. Automatic subspace clustering of high dimensional data for data mining applications. In ACM SIGMOD International Conference on Management of Data, 1998.A. A. Alizadeh, M. B. Eisen, R. E. Davis, C. Ma, I. S. Lossos, A. Rosenwald, J. C. Boldrick, H. Sabet, T. Tran, X. Yu, J. I. Powell, L. Yang, G. E. Marti, T. Moore, J. Hudson, L. Lu, D. B. Lewis, R. Tibshirani, G. Sherlock, W. C. Chan, T. C. Greiner, D. D.Weisenburger, J. O. Armitage, R. Warnke, R. Levy, W. Wilson, M. R. Grever, J. C. Byrd, D. Botstein, P. O. Brown, and L. M. Staudt. Distinct types of diuse large b-cell lymphoma identified by gene expression profiling. Nature, 403(6769):503{511, 2000.Y. Barash and N. Friedman. Context-specific bayesian clustering for gene expression data. In Annual Conference on Research in Computational Molecular Biology, 2001.
49
References
C. H. Cheng, A. W.-C. Fu, and Y. Zhang. Entropy-based subspace clustering for mining numerical data. In Knowledge Discovery and Data Mining, pages 84{93, 1999.S. Guha, R. Rastogi, and K. Shim. ROCK: A robust clustering algorithm for categorical attributes. In 15th International Conference on Data Engineering, 1999.E.-H. Han, G. Karypis, V. Kumar, and B. Mobasher. Clustering based on association rule hypergraphs. In 1997 SIGMOD Workshop on Research Issues on Data Mining and Knowledge Discovery, 1997.G. Karypis, R. Aggarwal, V. Kumar, and S. Shekhar. Multilevel hypergraph partitioning: Applications in VLSI domain. In ACM/IEEE Design Automation Conference, 1997.H. Nagesh, S. Goil, and A. Choudhary. Maa: Efficient and scalable subspace clustering for very large data sets, 1999.C. M. Procopiuc, M. Jones, P. K. Agarwal, and T. M. Murali. A monte carlo algorithm for fast projective clustering. In ACM SIGMOD International Conference on Management of Data, 2002.H. Wang, W. Wang, J. Yang, and P. S. Yu. Clustering by pattern similarity in large data sets. In ACM SIGMOD International Conference on Management of Data, 2002.