Embed Size (px)
Citation preview

DBA Best Practices: A Primer on Managing Oracle Databases
Leng Leng TanVice President, Systems and Applications Management

The following is intended to outline our general product direction. It is intended for information purposes only, and may not be incorporated into any contract. It is not a commitment to deliver any material, code, or functionality, and should not be relied upon in making purchasing decisions.The development, release, and timing of any features or functionality described for Oracle’s products remains at the sole discretion of Oracle.

Top 3 DBA Activities
1. Performance Diagnosis
2. SQL Optimization
3. Space Management
Source: IOUG DBA Survey

Top 3 DBA Activities
1. Performance Diagnosis
2. SQL Optimization
3. Space Management
Source: IOUG DBA Survey
Top 10 Best Practices
for
<Insert Picture Here>
Performance Diagnostics
� Performance Diagnostics� SQL Optimization� Space Management� Q & A

Performance Diagnostics Topics
• Key Concepts• Automatic System Diagnostics• Manual System Diagnostics• Advanced Topics
• Targeted analysis• Comparative analysis

Key Concepts
• DB Time• Total time in database calls by foreground sessions
• Includes CPU time, IO time and non-idle wait time• DB Time <> response time
• Total DB time = sum of DB time for all active sessions
�Goal: To Reduce Total DB time
• Active Session• Session currently spending time in a database call, i.e., accruing DB
time
• Average Active Sessions
• Average Active Sessions is a new metric for measuring DB load
=Wall-Clock (Elapsed) Time
DB Time

Automatic System Diagnostics using ADDM
• Use ADDM (Automatic Database Diagnostic Monitor) for database-wide performance diagnostic
• Self-diagnostic engine in the database
• Helps resolve current and past problems
• In 11g, a RAC specialist as well!• Provides impact and benefit
analysis, non problem areas• Runs proactively out of the box,
reactively when requiredSQLAdvisor
High-load SQL
IO / CPU issues RAC issues
Automatic Diagnostic Engine
Snapshots inAutomatic Workload
Repository
Self-Diagnostic Engine inside DB
System Resource
Advice
Network + DB config
Advice
#10 BP


Manual Performance Diagnostics• EM Performance Page facilitates manual performance
analysis• Method (Advanced):
• Observe Average Active Sessions graph• “Click on the Big Stuff”
• Answers the “who” and “what” of the problem• Who is slowing down the system?• What is that person/process doing? Click!


Targeted Performance Analysis• Use ASH (Active Session History) for targeted performance
analysis into different dimensions:• 1st dimension by a Time, then by
• SQL ID
• Session ID• Wait Class
• Service, Module, Action, Client ID
Performance
Time
*
Range
#9 BP

ASH Report: Over 5 mins by a SQLMain Sections

ASH Report:Top Events for that SQL

ASH Report:Activity for that SQL over the same 5 mins

Comparative Performance Analysis
• Use Automatic Workload Repository (AWR) Baseline for comparative performance analysis to• Guide set alert thresholds• Monitor performance• Compare advisor reports
• Enables performance comparison of two periods
• Makes analysis of workload variations and performance diagnosis easier
• Automatic creation and management of reference AWR baselines
• Out-of-box Moving Window AWR Baseline in 11g
time
Performance
Baseline
Actual
#8 BP

AWR Compare Period Report

AWR Compare Period Report:Configuration

AWR Compare Period Report:Load Profile
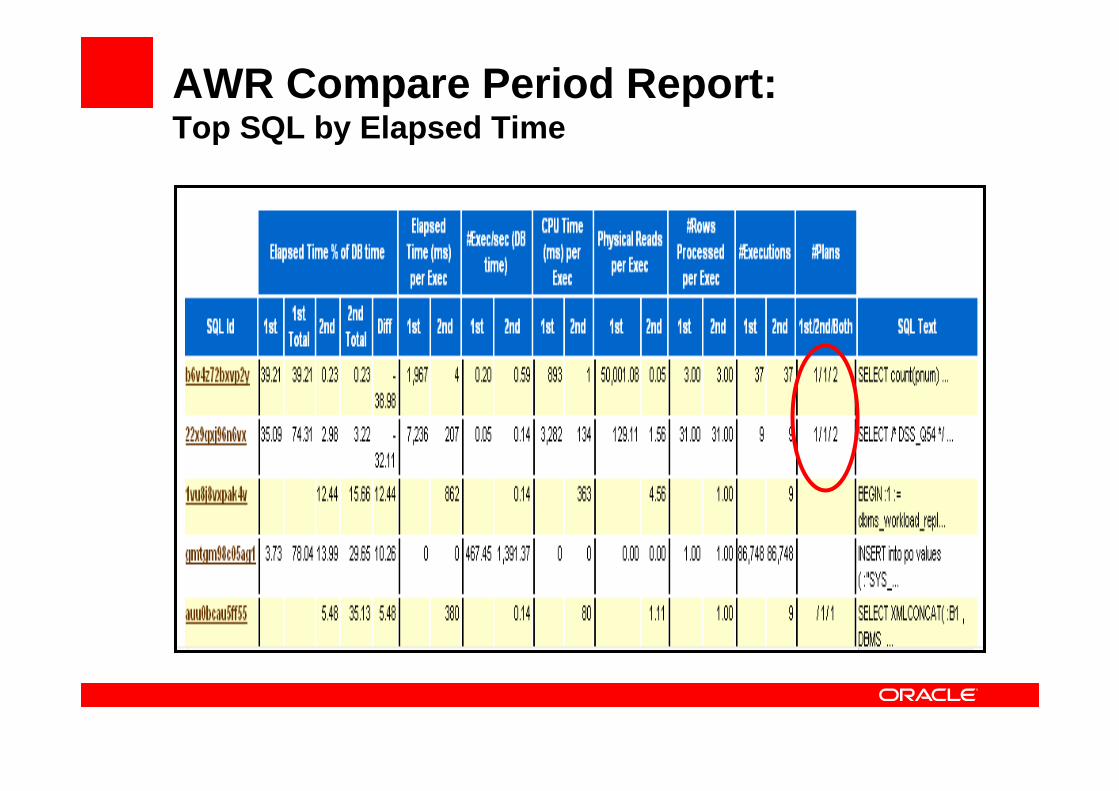
AWR Compare Period Report:Top SQL by Elapsed Time

<Insert Picture Here>
SQL Optimization
� Performance Diagnostics� SQL Optimization� Space Management� Q & A

SQL Optimization Topics
• Manual SQL Tuning• Automatic SQL Tuning• Optimizer Statistics Management

• Shows what’s happening inside SQL execution
• Automatically monitors long running SQL
• Enabled out-of-the-box with no performance impact
• Monitors each SQL execution
• Exposes monitoring statistics• Global execution level• Plan operation level• Parallel Execution level
Use Real-time SQL Monitoring to Understand SQL Execution
#7 BP

Real-time SQL Monitoring
Demo

SQL Monitoring Use Case: Big Plans

SQL Monitoring Use Case: Big Plans

SQL Monitoring Use Case: Big Plans

SQL Monitoring Use Case: Big Plans

Statistics Analysis
Use SQL Tuning Advisor to Tune SQL
Access Structure Analysis (Single SQL)
SQL Design Analysis
Plan Tuning (SQL Profiling)
Comprehensive Analysis
Gather Missing or Stale Statistics
Create a SQL Profile
Add Missing Indexes (B* Tree)
Modify SQL Constructs
RecommendationSQL Tuning Advisor
SQL
#6 BP

Live vs. Remote Tuning
• Resource Consumption• Limited mode: Resource consumption minimal
• Stats, index and SQL restructure analysis is cheap• Average is less than 1 second per SQL statement
• Comprehensive mode: Resource consumption may be significant• SQL Profiling can potentially consume non-trivial resources• Roughly comparable to amount of resources/time consumed when executing
SQL statement(s)
• Live tuning• Run SQL Tuning Advisor in Limited mode only if system does not have spare
resources – otherwise run in Comprehensive mode (recommended)
• Remote tuning• Tuning remotely if
• Cumulative resources/time consumed by all SQL statements significant• System cannot spare resources
• Use SQL Profile and SQL Tuning Set export/import capabilities

More Best Practices when using SQL Tuning Advisor
• Use Automatic SQL Capture feature of SQL Tuning Set (STS) to capture SQL Workload
• Always validate SQL Profiles before enabling them
• For remote tuning, ensure test system is similar to production system
• Schema• Data distribution• Volume
• If test system smaller than production, set optimizer stats manually
DBMS_SQLTUNE.ACCEPT_SQL_PROFILE (task_name => ‘<tun ing task name>’, category => ‘MY_CATEGORY’);
ALTER SESSION SET SQLTUNE_CATEGORY=‘MY_CATEGORY’ ;

Automatic SQL Tuning
• Automatically captures high-load SQL
• Automatically tunes SQL without changing application by creating SQL Profiles
• Automatically validates SQL Profiles by test executing them
• Automatically implements (optional) greatly improved SQL plans
• Automatically reports analysis • Automatically runs during
maintenance window
PackagedApps
Custom Apps
SQL Tuning Advisor
Auto Capture High-Load SQL
SQL Profiles
Nightly
Well-tuned SQL
Automatic implement
Manually implement
SQL Analysis
Report

Optimizer Statistics Management
Use Automatic statistics collection to manage Optimizer Statistics
• Out-of-the box, runs in maintenance window• configuration can be changed• Restartable • Gathers statistics on user and dictionary
objects• Parameters chosen automatically based on
• DML monitoring
• Column usage monitoring
• Iterative sampling• Uses new collection algorithm with accuracy
of compute and speed faster than sampling of 1%
• Incrementally maintains statistics for partitioned tables – very efficient
#5 BP

More Best Practices on Statistics Collection
• Gather statistics for all objects (dictionary and user objects)• Volatile objects
• Gathers statistics when object at max size and then lock table• Delete all statistics and lock table – dynamic sampling will be used
• Restoring old optimizer statistics• Used when new stats result in poor execution plan selection • Scope: Table, schema and database • History maintained for 30 days • API: DBMS_STATS.RESTORE_TABLE_STATS
• Don't use the ANALYZE command• Officially obsolete for optimizer statistics• Cannot gather GLOBAL statistics for partitioned objects • Cannot gather statistics for external tables, fixed tables, etc.• Invalidates/recompiles all dependent cursors at once• DBMS_STATSmarks cursors as unusable and recompiles gradually

Optimizer Statistics Validation
Use SQL Performance Analyzer (SPA) to validate statistics refresh 1. Capture SQL workload in STS using
automatic cursor cache capture capability
2. Execute SPA pre-change trial
3. Refresh statistics using PENDINGoption
4. Execute SPA post-change trial5. Run SPA report comparing SQL
execution statistics
• Before PUBLISHing stats• Remediate individual SQL for plan
few regressions• Revert to old statistics if too many
regressions observed
Analysis Report
Compare SQL Performance
Post-change executions stats
Pre-change executions stats
SQL Workload
SQL Performance Analyzer (SPA)
#4 BP

Real Application Testing applicable for Pre-11g Database Releases
• SQL Performance Analyzer (SPA)• Capture on 9i, 10.1, 10.2 database releases• Test changes in 10.2 & above
• Database Replay• Capture on 9i, 10.2 database releases• Test changes in 11.1 & above
Test Changes InCapture FromFeature
11g10g R2
11g9i R2Database Replay
10g R2 or 11g10g R2
10g R2 or 11g10g R1
10g R2 or 11g9i R2SQL Performance Analyzer
<Insert Picture Here>
Space Management
� Performance Diagnostics� SQL Optimization� Space Management� Q & A

Space Management Topics
• Permanent Tablespace Management• Extent management• Segment space management
• Temporary Tablespace Management• RAC
• Goals• Optimize space usage by eliminating/ minimizing
fragmentation• Optimize data access and transaction performance

• Space managed locally by bitmaps in data file headers
• Eliminates external fragmentation• Efficient space utilization
• Performance• Serialization of space management
at file level• Space management faster by 100-
200%
• Two extent management types• Auto-allocate (recommended):
Extent size determined by database• Uniform: All extents of same size
Permanent Tablespace Management
Use Automatic Segment Space Management for Segment Mgmt• Segment free space managed using
bitmaps
• Easier management: PCTUSED, FREELISTS, FREELIST GROUPS don’t have to be tuned or set
• Superior performance• Automatically manages contention on
meta-data blocks • Inter-instance data block contention
reduced by dynamic instance affinity
• Minimizes internal fragmentation
Use Locally Managed Tablespace for Extent Mgmt
#3 BP

Automatic Segment Space Mgmt (ASSM) vs. Manual Segment Space Mgmt (MSSM)
0
1
2
3
4
1 2 4 8 16 32
ASSMMSSM
Res
po
nse
Tim
e
Insert Workload
0
2
4
6
8
1 2 4 8
ASSMMSSM
Concurrent Users
Res
po
nse
Tim
e
Mixed DML Workload
Concurrent Users

• Fragmentation of space within a segment• Space under-utilization below HWM• Although minimized, can still occur in ASSM tablespace
• Performance Impact: slows certain access paths, e.g., full table scan• Online Segment Shrink remedies internal fragmentation
• ROW MOVEMENT must be ENABLED for heap organized segments• Segment must be in ASSM, locally managed tablespace
• Automatic Segment Advisor evaluates segments for fragmentation and makes appropriate recommendations
Internal Fragmentation
YYNParallel
YNYSegment Level Reorg
NNYDependecyMaintenance
NNYIncremental
NNYIn-place
NYYOnline
Alter MOVEOnline RedefShrinkSpace Operations
Note: For tables with large number of indexes, reorg is faster

Temporary Tablespace Management
• Temporary Data• Data generated by operations like bitmap merges, hash join,
bitmap index creation, sort• Persists only for duration of a transaction or session• Media and instance recovery is not required• High concurrency of space management operations is very
critical• Use Temporary Tablespace for temporary data
• ALTER DATABASE DEFAULT TEMPORARY TABLESPACEtablespace_name;
• Use Locally Managed Temporary Tablespace• Allows high concurrency space management
• In steady state all space metadata cached in SGA• Operations serialized by SGA latch instead of db wide ST enqueue
• Can be shrunk using SHRINK SPACE and/or SHRINK TEMPFILE commands
#2 BP

• Guidelines for choosing extent size • 5M-10M:
• For DSS, OLAP applications involving huge sorts, hash joins • Large temporary lobs are predominant
• 64K or multiple: • Global temporary tables are predominant and amount of data loaded is small• Application is predominantly OLTP
• V$TEMPSEG_USAGE can be used to monitor space usage and workload distribution
SESSION_NUM USERNAME SEGTYPE BLOCKS TABLESPACE----------- -------- --------- ------ ----------
101 SCOTT SORT 128 TEMP102 SCOTT LOB_DATA 128 TEMP103 SYS HASH 256 TEMP
More Best Practices on Temporary Tablespace Management

Best Practices for Temporary Tablespace Management in RAC
• Use a single Temporary Tablespace for entire RAC database
• No special configuration is needed• Each instance dynamically caches extents it has
affinity to in its SGA• Sharing of space between instances happens
transparently and dynamically• Add space when number of waits on SS enqueue
increases

Use Enterprise Manager to Manage Database
• Grid Control or Database Control (out-of-the-box)#1 BP

Top 3 DBA Activities
#10 Use ADDM for database-wide performance diagnostic#9 Use ASH for targeted performance analysis #8 Use AWR Baseline for comparative performance analysis#7 Use Real-time SQL Monitoring to understand SQL execution#6 Use SQL Tuning Advisor to tune SQL#5 Use Automatic statistics collection to manage optimizer statistics#4 Use SQL Performance Analyzer (SPA) to validate statistics refresh#3 Use Locally Managed TS with Auto-Allocate & Automatic Segment
Space Management for Permanent Tablespace#2 Use Locally Managed Temporary Tablespace#1 Use Enterprise Manager to manage database
Top 10 Best Practices
for

Recommended Campground Demos
Moscone West
Exhibit Hall
Change Management & Data Masking for DBAs
Moscone West
Exhibit Hall
Complete Data Center Management
Moscone West Exhibit Hall
Application Quality Management
Moscone West
Exhibit Hall
Self-Managing Database: Automatic Application & SQL Tuning
Moscone West Exhibit Hall
Self-Managing Database: Automatic Fault Diagnostics
Moscone West Exhibit Hall
Self-Managing Database: Automatic Performance Diagnostics
Moscone West
Exhibit Hall
Oracle Real Application Testing: Database Replay and
SQL Performance Analyzer
LocationDemo

Mos South: 10311:30Wed, 9/24Oracle Recovery Manager (RMAN) Best Practices
Mos South: 3031:30Thursday, 9/25Proactive Performance Monitoring with Baselines and Adaptive Thresholds
LocationTimeDateSession TitleMos South: 3022:30Monday, 9/22Performance Fundamentals for Oracle DB 10g and 11g
Mos West : 200311:30Tuesday, 9/23Advanced Performance Diagnostics: What the GUI Doesn't Tell You
Mos West: 20034:00Monday, 9/22Oracle Enterprise Manager: Oracle's Management Solution for Your Enterprise
Mos South: 3039:00Wed, 9/24Storage Monitoring Made Easy: Diagnosing I/O Performance Problems
Mos South: 3035:00Tuesday, 9/23Successful Upgrade Secrets: Preventing Performance Problems with Database Replay
Mos South: 3031:00Tuesday, 9/23Demystifying SQL Tuning: Tips and Techniques for SQL Experts
Mos West: 20011:00Wed, 9/24SQL Tuning Roundtable with the Experts
Recommended Sessions