Embed Size (px)
Citation preview
DBHYDRO Browser User’s Guide South Florida Water Management District
DBHYDRO Browser
User’s Guide
September 2020 (revised)

DBHYDRO Browser User’s Guide South Florida Water Management District
This page intentionally left blank.
Page 1
September 2020
TABLE OF CONTENTS
1.0 INTRODUCTION....................................................................................................... 2 DBHYDRO Overview ................................................................................................................. 2 DBHYDRO Browser ................................................................................................................... 2 Getting Started ............................................................................................................................. 3
2.0 MENU-BASED DATA ACCESS .............................................................................. 6 Hydrologic and Physical Data ..................................................................................................... 6
Charting/Graphing.................................................................................................................. 16 Batch Mode ............................................................................................................................ 24 Groundwater Data .................................................................................................................. 27 WQ Sondes (Continuous) Data .............................................................................................. 28
Water Quality Sample Data ....................................................................................................... 29 Hydrogeologic Data ................................................................................................................... 37 Access by Station Name ............................................................................................................ 47 Access by Site Name ................................................................................................................. 49 Access by Hydrologic Basin ...................................................................................................... 51 Real Time Data .......................................................................................................................... 53 Web Map Access ....................................................................................................................... 57 Data Processing and Validation Utilities ................................................................................... 69
Interval Value Generator ........................................................................................................ 70 DCVP Station Id Listing ........................................................................................................ 71 Streamflow Measurements ..................................................................................................... 72
Metadata/Reference Tables ........................................................................................................ 75 Miscellaneous Items and Reports .............................................................................................. 76
New and Discontinued Data Sets ........................................................................................... 77 District Daily Rainfall Report ................................................................................................ 79 Hydrogeologic Data Loader ................................................................................................... 80 Water Budget ......................................................................................................................... 81 Nutrient Load Computation Application ................................................................................ 82 Nearby Station Look-up ......................................................................................................... 83
3.0 URL-BASED DATA ACCESS ................................................................................ 84 Web Services ............................................................................................................................. 84
Water Quality Results URLs .................................................................................................. 84 Hydrologic Instantaneous and Daily Values URLs ............................................................... 87 Hydrographs URLs ................................................................................................................ 88 Hydrogeologic Data Summaries ............................................................................................ 90
4.0 CONTACT INFORMATION .................................................................................. 91 Application Enhancements ........................................................................................................ 91 Training ...................................................................................................................................... 91 Data Requests and Inquiries ...................................................................................................... 91
5.0 APPENDICES ........................................................................................................... 92 Appendix A - Water Quality Report Column Descriptions ....................................................... 92 Appendix B - Unit Conversions ................................................................................................. 98 Appendix C - Unit Abbreviations/Symbols ............................................................................... 99 Appendix D - Acronyms Used in Metadata ............................................................................. 100

DBHYDRO Browser User’s Guide South Florida Water Management District
Page 2
September 2020
1.0 INTRODUCTION
DBHYDRO Overview
DBHYDRO is the South Florida Water Management District's (District or SFWMD)
hydrologic, water quality, and hydrogeologic data storage and retrieval system. This
system is the source of historical and up-to-date data for the region covered by the
District. The District participates in a cooperative data exchange program with other
agencies, such as the U.S. Geological Survey, Everglades National Park, U.S. Army
Corps of Engineers, Lake Worth Drainage District, and U.S. Department of Agriculture.1
DBHYDRO allows users to access over 190,000 station-years of data, collected at over
17,000 stations in and around the District’s area of responsibility. DBHYDRO contains
hydrologic, water quality, and hydrogeologic data, and stores additional information
about the location and context of where and how data are collected. Descriptions are
available for most locations, giving the user information on hydrologic basin, latitude,
longitude, state plane coordinates, county, section, township, range, and station notes.
One of the more powerful aspects of DBHYDRO is that data can be retrieved in various
ways. For example, it is not necessary to know a specific identification number (ID) of a
particular station; the database can be scanned to locate all stations that meet certain
criteria, such as a given basin, county, or coordinate window. The DBHYDRO database
is an important reference for hydrologic, hydrogeologic, and water quality reports and
investigations in central and south Florida. The application that allows users to specify
search criteria and retrieve data from DBHYDRO is called “DBHYDRO Browser”.
DBHYDRO Browser
The DBHYDRO Browser is a web-based application that allows users to browse the
SFWMD’s corporate environmental database, DBHYDRO, using one or more criteria
to generate a summary listing of time series. The user can then select one or more time
series of interest and have the time series data dynamically displayed in tables or graphs.
In addition to using text-based filters, users may also access station data via a web map.
Currently, DBHYDRO Browser is tested and supported on Internet Explorer 11.
1 The SFWMD provides copies of data stewarded by other agencies as an enhanced service to its users. The
authoritative source of data stewarded by other agencies is the system of record as determined by that
particular agency.

DBHYDRO Browser User’s Guide South Florida Water Management District
Page 3
September 2020
Getting Started
Internet access for DBHYDRO is provided at http://www.sfwmd.gov/dbhydro.
DBHYDRO Browser User’s Guide South Florida Water Management District
Page 4
September 2020
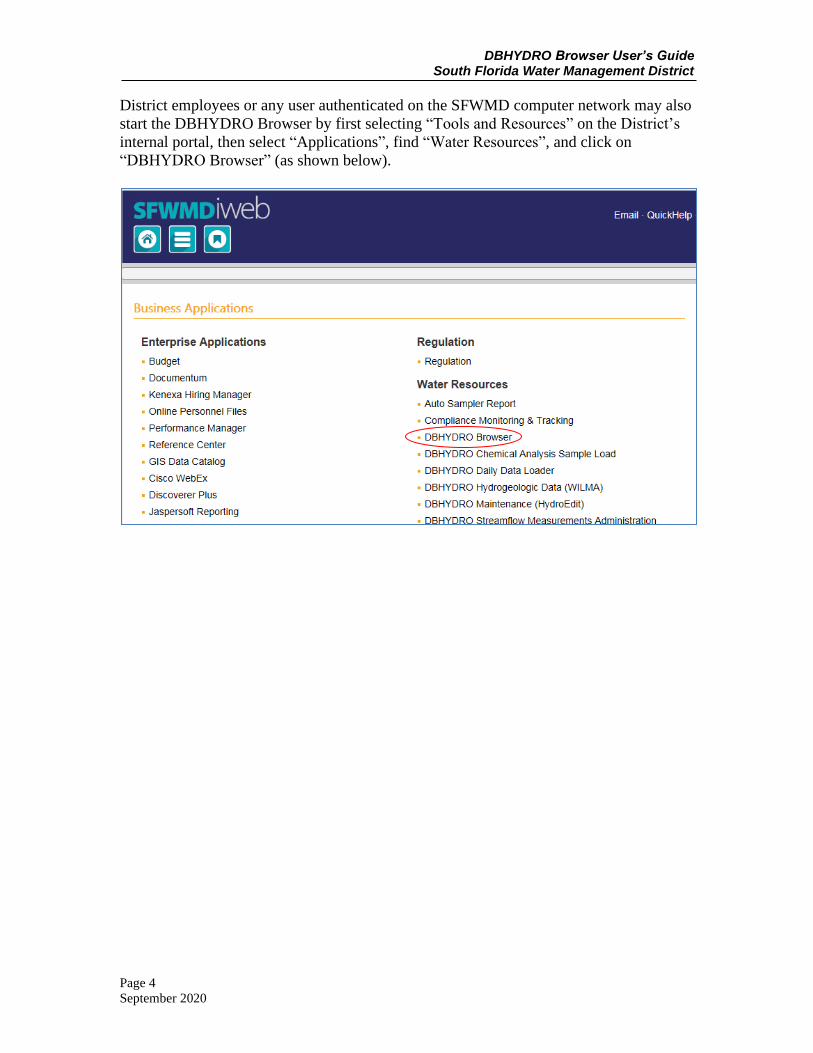
District employees or any user authenticated on the SFWMD computer network may also
start the DBHYDRO Browser by first selecting “Tools and Resources” on the District’s
internal portal, then select “Applications”, find “Water Resources”, and click on
“DBHYDRO Browser” (as shown below).

DBHYDRO Browser User’s Guide South Florida Water Management District
Page 5
September 2020
The DBHYDRO main menu is shown below. Some options are unavailable to users not
authenticated on the District network (i.e., “internal use only”).
Users may check more than one box
at a time Geophysical and
lithologic logs and more
Grab and autosampler data involving chemical
analysis
Look-up lists for all the codes we
use
Get back to this page anywhere
this link is displayed
Read or download this user guide Send us email
When highlighted there have been recent
noteworthy changes

DBHYDRO Browser User’s Guide South Florida Water Management District
Page 6
September 2020
2.0 MENU-BASED DATA ACCESS
Hydrologic and Physical Data
Each hydrologic and physical data set is identified in DBHYDRO with a unique time
series identifier, known as a dbkey. No two data sets will ever share the same dbkey. For
example, a set of instantaneous readings and the mean daily values derived from such
readings have two different dbkeys. DBHYDRO uses the term breakpoint data
synonymously with instantaneous data. Our cooperative program partner, the USGS, uses
the term unit values data.
Multiple data categories may be selected simultaneously; for simplicity, each category is
presented separately in this guide.
For example, checking the “Surface Water” checkbox and then clicking on the “Get
Data” button leads to the following page:
This screen allows the user to select the filters the user wants to use to query the surface
water data. Each search parameter (filter) is hyperlinked to a description of that
parameter. For example, clicking on the word "AGENCY" leads to the following help text:
The heading indicates what area(s) of the
system the user is in
Reload a previously saved set of search
criteria

DBHYDRO Browser User’s Guide South Florida Water Management District
Page 7
September 2020
Closing this window returns the user to the “Surface Water Data/Select Search
Parameter” menu.
In the following example, the “Agency”, “Data Type”, and “County” parameters have
been selected by checking their associated check boxes:

DBHYDRO Browser User’s Guide South Florida Water Management District
Page 8
September 2020
Clicking on the "Submit" button provides the presented information:
In this view, only Data Type, Agency, and County (as requested) and those parameters
specific to surface water data are able to be queried. This filtering feature prevents the list
of query criteria from getting unnecessarily large and generally keeps the presented
information on one page.
Each list of values allows one or more query criteria to be selected using the “CTRL” or
“SHIFT” keys in conjunction with the left mouse button.

DBHYDRO Browser User’s Guide South Florida Water Management District
Page 9
September 2020
The criteria fields are filled in by the selection on the lists of values:
In the above example, SFWMD surface water flows in Palm Beach County are selected.
At this point, the parameter file may be saved, allowing the selected criteria to be stored
in a file on the user’s individual computer or server, such that the criteria may be recalled
for future access. This feature is helpful for frequently run queries to minimize keystrokes
and mouse events required to obtain data. [Note: The web services URL feature may
better suit the needs of users that have frequently repeated database queries.] More
information is provided in Section 3.0, URL-Based Data Access.
By checking the box “Show Active Time Series Only”, the user can filter out older data
sets if the user is only interested in more recent or active data sets. In the example above,
both active and inactive time series are requested because the checkbox is left unchecked.
The user may order (sort) the subsequent output by any of the available output columns.
By default, the output will be in “Station” order.
Frequent users may bypass the next screen to more directly retrieve needed data. This is
useful if the user knows that the query will return only a few data sets interactively or
wants to submit a batch request. To use the bypass feature, select the radio button marked
“Get All Data”. In the example provided, the time series list is not bypassed because
specific data sets need to be selected. More information on batch requests is provided in
Section 2.0, Menu-Based Data Access.

DBHYDRO Browser User’s Guide South Florida Water Management District
Page 10
September 2020
Clicking on the "Submit" button results in the following "Metadata" list:
The user can also click on the heading of any column in order to sort the list by that
particular column. The “Station” column is used by default as indicated by the arrow
above the column heading. Each of the underlined fields is hyperlinked to additional
information that explains its meaning.
SFWMD data quality assurance works on data in
batches. Most hydrologic data sets are quality assured within two weeks of data collection.
Sorted by station. Click on any column heading to sort.
Method of acquisition or derivation
A unique data set ID
Click on any hyperlink for more information

DBHYDRO Browser User’s Guide South Florida Water Management District
Page 11
September 2020
For example, clicking on the word "FLOW" in the data type column leads to the following
screen, which further details flow data including its units of measure:
DBHYDRO Browser similarly links to additional information for all the other
hyperlinked time series attributes.
The “Station” field hyperlink in the previous time series list leads to a screen displaying
the station information. For example, clicking on station "C18W_W" leads to this screen:
Then, the user can display a map with this station marked, generate a list of nearby
stations, or “Get Time Series Data”. If water quality data is available at the selected
station, then a “Get Sample Data” button will be available. If a groundwater well is
located at the selected station, then a “Well Info” link will also be available. If direct field
measurements of discharge data are available a “Get Streamflow Measurements” button
will be available.
See this location on a map
See a list of stations in the
area
View any available attached
documents

DBHYDRO Browser User’s Guide South Florida Water Management District
Page 12
September 2020
Using the C18W_W station example, selecting the "Google Maps" feature provides a
map similar to the following:
This feature takes advantage of publicly available map server technology to learn more
about the area near the station of interest. The map can be drawn at different scales (zoom
in/out) and printed. General directions to the station can also be generated. [Note that the
SFWMD does not endorse the use of any particular commercial map server engine or its
advertisers.]

DBHYDRO Browser User’s Guide South Florida Water Management District
Page 13
September 2020
Alternatively, by clicking on the “Nearby Station” link at the right end of the row, the
user gets a list of other monitoring stations in the vicinity. Such a list may lead the user to
other data that did not appear previously because of selected query criteria. The column
“Distance (miles)” indicates how close other stations are to the selected station (i.e.,
C18W_W in this example).
It is important to note that station locations are determined by various methods, each with
its own inherent accuracy capabilities. Therefore, some coordinates and distances
displayed may only be approximate.

DBHYDRO Browser User’s Guide South Florida Water Management District
Page 14
September 2020
The user must click on the "Back" button twice in the browser to return to the “Time
Series Listing” page, where one or more data sets for display can be selected.
In the example below, data is selected for "G304E_C", using the data set with recorder
type "PREF" - an abbreviation for preferred. Preferred data sets undergo an additional
level of quality assurance (QA) by District staff. It is recommended that "PREF" data are
used if available in the user’s query.
Up to 100 rows of metadata will be displayed on each page. Data from different pages
must be retrieved separately. Alternatively, the user can refine the query so that fewer
metadata rows are displayed to fit on one page. In this case, scroll down and click on the
“Get Data” button that is displayed at the bottom of the screen.
It should be noted that “Clear All” and “Select All” buttons can be used to expedite the
time series selection process. “Clear All” removes check marks from all the checked time
series. “Select All” selects or checks all the time series data records. Notably, data sets
that have no data are not selectable. A data set might not contain data because it has
merely been registered in preparation of receiving data but has not yet received any data.
Again, a parameter file also may be saved at this time.

DBHYDRO Browser User’s Guide South Florida Water Management District
Page 15
September 2020
Once the “Get Data” button is pressed, the date range selection and format selection
screen is now displayed:
This screen allows the user to select the desired period of record for the data set and plot
it on a chart. As indicated above, the “Chart” and “Online” radio buttons have been
selected. There are thirteen different output report formats (names) and five different
output destinations. Note: Not all combinations of Report Format and Destination are
valid, but the user is informed of invalid combinations when attempted.
When the date range choice is “User Specified”, the default start date is the earliest start date in the time series list. The default end date is the most recent end date in the list. Therefore, the default is the entire period of record for all data listed. The dates in the Start Date and End Date fields are ignored when a fixed date range such as “Today and previous 2 days” is selected from the pull-down list.

DBHYDRO Browser User’s Guide South Florida Water Management District
Page 16
September 2020
Charting/Graphing
Clicking on the "Chart" button under “Destination” results in the following type of graph:
This graph is generated directly from the database, ensuring that the user’s results are
updated with the most recent data. The graph may be printed to any available printer.
The resulting chart URL date text can be edited to regenerate a graph covering a different
date range. Chart URLs may be bookmarked and reused directly from the user’s web
browser without navigating to the DBHYDRO menu. Subsequent iterations of a chart
URL will retrieve the most recent data. Hydrographs are created for each selected time
series. Individual axes are created for each data type.
Clicking on the "Back" button on the user’s browser and clicking on the tabular data
option allows the user to choose from several formats. The example below indicates that
the user is ready to retrieve data in a “Month - Year Matrix” tabular report.
Edit the URL to graph a different date range or data set! Save the URL as a favorite and re-fetch the up-to-date data immediately!

DBHYDRO Browser User’s Guide South Florida Water Management District
Page 17
September 2020
The “Month - Year Matrix” fits one year of data to a single page in matrix format, where
columns are shown in months and rows are in days. The “One Value Per Row” format is
a single column output in which each value appears on its own line. The “Multiple Daily
Values Per Row” format is a multi-column output in which the values for multiple time
series appear on a single line corresponding to a single date.

DBHYDRO Browser User’s Guide South Florida Water Management District
Page 18
September 2020
The example below displays results in a monthly format, with one year to a page.
Monthly summary statistics are at the bottom of each year.
This output can be saved explicitly as a .txt file using “File” → “Save As”, or the user
may choose “Edit” → “Select All” and copy and paste the information into another
application.
The codes that may appear adjacent to the values are listed here

DBHYDRO Browser User’s Guide South Florida Water Management District
Page 19
September 2020
The file can also be saved in comma separated value (.csv) format and opened in a
program such as Notepad++ or a spreadsheet program (e.g., Microsoft Excel):
When saving the file, the user’s operating system (e.g., Microsoft Windows) will know
that the user wants this file associated with Microsoft Excel if it is saved with a .csv
extension.

DBHYDRO Browser User’s Guide South Florida Water Management District
Page 20
September 2020
An example of the “One Value Per Row” format is as follows:
Links to quality codes and data processing annotations made during the QA process are
located at the bottom of the listing.
The “Multiple Daily Values Per Row” format (not shown) provides for multiple
simultaneous time series values to be displayed on the same row (date/time stamp). Users
can chart multiple time series in the browser or, with some additional manual effort, the
user may graph multiple time series on the same graph in Excel.
SHEF .E Format (not shown) provides data in Standard Hydrologic Exchange (SHEF) .E
Format. SHEF has been developed jointly by the National Weather Service and U.S.
Army Corps of Engineers, and is a documented set of rules for coding of data in a form
for both visual and computer recognition.
South Florida Water Management District flow data is considered positive when flowing
from the headwater station to tailwater station. Headwater and tailwater stations typically
are named with _H and _T suffixes respectively. The Google Earth interface shows
relative locations of headwater and tailwater stations and is therefore helpful in
determining the compass direction for which flow is considered positive. Positive flow
direction for data from other agencies may need to be confirmed with the respective
agencies. For instance, the USGS NWIS database may have more complete station
descriptions than what is in DBHYDRO.

DBHYDRO Browser User’s Guide South Florida Water Management District
Page 21
September 2020
The user can also run special statistical summary reports as follows:
• Duration Curve, Histogram, and Cumulative Distribution
• Daily Norms
• Month-by-Month Summary
• Composite Monthly Summary
• Year-by-Year Summary
• Period of Record Summary
• Maximum and Minimum Values and their Dates
Charts of the duration curve, histogram, and cumulative distribution statistical analyses
can also be generated by selecting the corresponding report format, as exemplified in the
following graphs, respectively:

DBHYDRO Browser User’s Guide South Florida Water Management District
Page 22
September 2020

DBHYDRO Browser User’s Guide South Florida Water Management District
Page 23
September 2020
Below is an example of the Composite Monthly Summary:
After clicking on the Submit button the following report is generated:
This report can be useful to detect seasonal trends in the data.
The user is encouraged to examine all the available formats and outputs to satisfy specific
reporting needs.

DBHYDRO Browser User’s Guide South Florida Water Management District
Page 24
September 2020
Batch Mode
Checking “Batch” as the “Run Mode” on the Query Date Selection page allows the user
to retrieve large data sets in an off-line manner. Any retrieval that takes longer than five
minutes to run interactively will be subject to a standard time out by the system and will
need to be run as a batch submittal. Most batch jobs are executed immediately.
As shown in the above example, batch jobs will be received by entering the user’s email
address and clicking the “Submit” button.

DBHYDRO Browser User’s Guide South Florida Water Management District
Page 25
September 2020
The user will receive a confirmation that the user’s request was received (as exemplified
below). Importantly, the user should record the data request id in the event of a problem
with email notification or file download.
The user will receive an email similar to the following:
The email will contain a hyperlink that will allow the user to download the file via FTP
when the data request is complete. If the user’s email is not received within 60 minutes,
then District staff should contact the SFWMD IT Help Desk at 561-682-6080. Non-
From: datamgmt
Sent: Thursday, March 28, 2013 9:56 AM
To: Doe, John
Subject: DBHYDRO batch request 3098530
Your data request 3098530 is processed and ready for download.
Your search criteria for this request was:
Enter value for request_id: 3098530
start_date : 20070101
end_date : 20080930
dbkey : 00319
station : s5a%
category : SW
Please click on hyper link below to get your file.
http://my.sfwmd.gov/dbhydro_files/dbhydro_3098530.zip

DBHYDRO Browser User’s Guide South Florida Water Management District
Page 26
September 2020
District users may contact DBHYDRO Technical Support staff at 561-686-8800 ext.
4594.
The user’s file may have been created and be waiting for the user to download it. The
user may have success downloading the file by editing the standard download URL by
entering the user’s data request ID immediately before the .zip:
e.g., http://my.sfwmd.gov/dbhydro_files/dbhydro_3098530.zip

DBHYDRO Browser User’s Guide South Florida Water Management District
Page 27
September 2020
Groundwater Data
Checking "Groundwater" from the main menu leads to the following screen:
The search parameters for groundwater data vary only slightly from surface water data
search parameters.

DBHYDRO Browser User’s Guide South Florida Water Management District
Page 28
September 2020
WQ Sondes (Continuous) Data
A sonde is a cluster of sensors which measure parameters including, but not limited to,
conductivity, temperature, and pressure. The reason to measure conductivity is that it can
be used to determine the salinity. Checking the “WQ Sondes” check box from the main
menu takes the user to the following page:
Data from continuously deployed water quality probes (sondes) are accessed here. These
data are also accessible from the “Water Quality Data” menu → “Deployed Sonde Data”,
or the user can query by station or site name.

DBHYDRO Browser User’s Guide South Florida Water Management District
Page 29
September 2020
Water Quality Sample Data
These data are from field and/or laboratory analyses of water samples, biological tissue,
sediments, or other environmental samples. Field parameters such as pH and water
temperature may be collected and stored with the sample. Data are approved, quality-
assured data that may be published.
Checking "Get Sample Data" from the main menu leads to the following screen:
Most water quality queries have similar characteristics, so the interface for water quality
has been designed to facilitate the most frequently encountered queries.
A “Deployed Sonde” option is available for access to continuously measured water
quality parameters such as pH, and water temperature (sondes), providing a user interface
similar to that of Hydrologic and Physical Data.
The Lab Data On-Line Environmental Chemistry Analyst System (OLECAS) is available
to network-authenticated users for reports on recently analyzed data and its comparisons
to historical trends. OLECAS can help detect anomalies in data that may be investigated
timely for possible analytical rework before the sample holding time expires. Holding
times are the length of time a sample can be stored after collection without significantly
affecting the analytical results.

DBHYDRO Browser User’s Guide South Florida Water Management District
Page 30
September 2020
A typical project-based query is described below. Clicking on “Project” from the water
quality menu leads to this screen in which the user can type in a project code, OR select
one or more project codes from the list of values and then click on the “Next” button.
Hint: Click on any item in the list. Then, quickly type the next letters of the project code and the cursor will “jump” to that item in the list. This “jumping” feature is common to all lists and is helpful if only the leading portion of the text is known.

DBHYDRO Browser User’s Guide South Florida Water Management District
Page 31
September 2020
A list of all the stations for which data has been collected under the given project(s) is
provided. Stations of interest may be selected. The user then clicks on the “Next” button.

DBHYDRO Browser User’s Guide South Florida Water Management District
Page 32
September 2020
Data can be filtered by test name (and associated test number), collection method, and
matrix. The user will need to provide a date range for the query. [Note that the begin date
of 1950 serves as a placeholder to ensure the entire period of record will be retrieved by
default.] The user then clicks on the “Next” button.
For the selected project and/or stations the test names, collection methods, and matrices
available in the list of values are those available in the database. If a test name, collection
method, or matrix does not appear in the list it means that there is no data meeting that
criteria. This feature minimizes the likelihood of users querying the database and ending
up with an empty output file.

DBHYDRO Browser User’s Guide South Florida Water Management District
Page 33
September 2020
The user will then click on “Full Report (all attributes)” from the list of available
reporting types:
Note: “Full Report” includes both sample-level and result-level comments. By default all
data is made available. To exclude data flagged for exclusion in some mandated agency
reports check the box for “Exclude Flagged Data”. To exclude field quality control data
check the box “Exclude Field Quality Control Data”. Refer to the appendices for
definitions of all columns displayed in the full report.

DBHYDRO Browser User’s Guide South Florida Water Management District
Page 34
September 2020
Subsequently, the following report is returned to the user’s web browser:
Definitions for the report columns are provided in Appendix A. Codes for remarks,
validation level, sampling purpose, and data investigation are available via hyperlinks at
the bottom of each report.
Other water quality searches work in a similar manner.
Selecting a file for output, rather than displaying results on the screen, is useful for large
data sets. The fixed-format file and comma-delimited file (.csv) options are useful for
importing into a spreadsheet application, while the .pdf file output can be used for
distributing read-only versions.
Each station visit (indicated by date collected) is considered a “trip”. A single trip may
involve the collection of one or more samples (sample ids). Each sample may be
analyzed for one or more analytes (test names/test numbers).
Cross-tab reports exclude qualifiers. Users do so at their own peril.
The Station Summary Report, for network-authenticated users, provides period of record
statistics based on a number of assumptions and criteria. These assumptions and criteria
are as follows:

DBHYDRO Browser User’s Guide South Florida Water Management District
Page 35
September 2020
1) Flagged data and field quality control (QC) data are filtered out always. Flag must be
null. Sample_type_new must be ‘SAMP’.
2) The report only considers results for samples collected on or after January 1, 1991; the
implementation of Data Validation in Florida Administrative Code 62-160.
3) The report applies a conservative philosophy to the statistical summaries. The
approach is conservative, that is to possibly bias the resulting statistical quantity toward a
greater (larger) value by having no statistical treatment of values below detection. In a
sample population if we have two results say: 0.5 being below detect and 0.1 not below
detect, the MIN will be reported as <0.5 here not 0.1 because <0.5 could be less than 0.1
also. This is what we mean by being conservative. Some analysts like to use one half of
the MDL when a value is below detection. In this report here the MDL itself is used.
SFWMD stores values below detection as -1*MDL (a rather unique practice but it is the
present state). The remark code U also tells us the result was below detect. In some rare
cases there is no U in the remark code and the value is less than the MDL. Test numbers
65, 256, 258, 319, and 978 can have legitimate values below zero so they are treated as
exceptions.
Logic for MIN of a sample population:
Excluding the test numbers 65, 256, 258, 319, and 978, if the sign of the value of
minimum magnitude is negative it means the minimum value is below detection,
therefore prefix it with '<' sign. Use the absolute value of the least negative (closest to
zero) result. For test numbers 65, 256, 258, 319, and 978 simply use the minimum.
Logic for MAX of the sample population:
Excluding the test numbers 65, 256, 258, 319, and 978, if the sign of the value with
maximum absolute value is negative it means the maximum value is below detection,
therefore prefix it with '<' sign. Use the absolute value of the least negative (closest to
zero) result. For test numbers 65 and 319 simply use the minimum.
Logic for AVG (MEAN):
Excluding the test numbers 65, 256, 258, 319, and 978, if the sign of the minimum value
in the sample population is negative or the remark code has a 'U' it means the resulting
summary is affected, therefore prefix it with '<' sign. Use the AVG of the absolute
values. For test numbers 65, 256, 258, 319, and 978 simply use the AVG.
Logic for STDDEV:
Do not give extra consideration to BDL data. Without further knowledge of the
distribution one cannot imply the standard deviation. Standard deviation uses only the
value.
Logic for MEDIAN:
Excluding the test numbers 65, 256, 258, 319, and 978. Use median of absolute values.
The floor and ceiling records are defined as the record(s) in the middle of the ordered
sample population. The floor record and ceiling record may have to be interpolated
between and this is taken care of by the MEDIAN function. If either the floor or ceiling
record, or both, is BDL the median value should have a '<' (less than sign) prefixed. For
test numbers 65, 256, 258, 319, and 978 simply use the median.
NBDL
Keep track of the number of values below detection by counting values < 0 or containing
U in the remark code except for test numbers 65, 256, 258, 319, and 978.

DBHYDRO Browser User’s Guide South Florida Water Management District
Page 36
September 2020
MDL STATEMENT
Identify a change in MDLs by comparing the min mdl to the max mdl. If not equal it
means mdls varied thru time or one or more reported mdls was null. If min and max
MDL are equal then mdls were the same for all results. If MDLs changed thru time it
implies our methods changed and typically methods get more precise thru time. Users
are directed to retrieve the actual results to see the details of how MDLs changed thru
time.
MDLs_USED
Lists the various MDL's used in the sample population (including null when the MDL
cannot be determined).

DBHYDRO Browser User’s Guide South Florida Water Management District
Page 37
September 2020
Hydrogeologic Data
Clicking on the “Get Data” button from the Hydrogeologic Data main menu takes the
user to the following page:
While the search parameters look similar to those in the Groundwater Data menu, queries
under Hydrogeologic Data direct the user to well construction specifications as well as
geophysical, hydraulic, lithologic, and multimedia data.
Once the user has chosen the search criteria, the browser directs the user to a page that
displays that criteria and allows the user to submit or save the user’s parameters to a file.
Use of aquifer as a criterion will result in
exclusion of hydrogeologic information from wells that
do not have monitoring. Use with care. Consider
using a range of total depths instead.

DBHYDRO Browser User’s Guide South Florida Water Management District
Page 38
September 2020
In the example below, a query was done to select all wells in Palm Beach County with
total depths between 300 and 400 feet.
The user can check “County” and “Total Depth” as the search parameters, and then click
on the “Submit” button.

DBHYDRO Browser User’s Guide South Florida Water Management District
Page 39
September 2020
The next screen allows the user to select the specific county or counties and specify the
range of total depth.
Then, the user clicks on the “Submit” button to proceed to the Output Parameters
Selection screen.

DBHYDRO Browser User’s Guide South Florida Water Management District
Page 40
September 2020
This screen allows the user to select the report format and output.
In this example, the Location Details report is chosen.

DBHYDRO Browser User’s Guide South Florida Water Management District
Page 41
September 2020
The report for “Output Format” “Location Details” (shown below) returns a table with
names, locations, and hyperlinks for construction and multimedia data when available.
The Location Details report is wide and users may have to scroll to the right to view links
to screen, and multimedia information. There is also a link to an associated map.
Multimedia may include any kind of document (.pdf, .doc, .xls, etc…) including scanned
field notes, driller reports and logs, photographs, ftp links, and links to other web sites.
Link to more station information
DBHYDRO Browser User’s Guide South Florida Water Management District
Page 42
September 2020
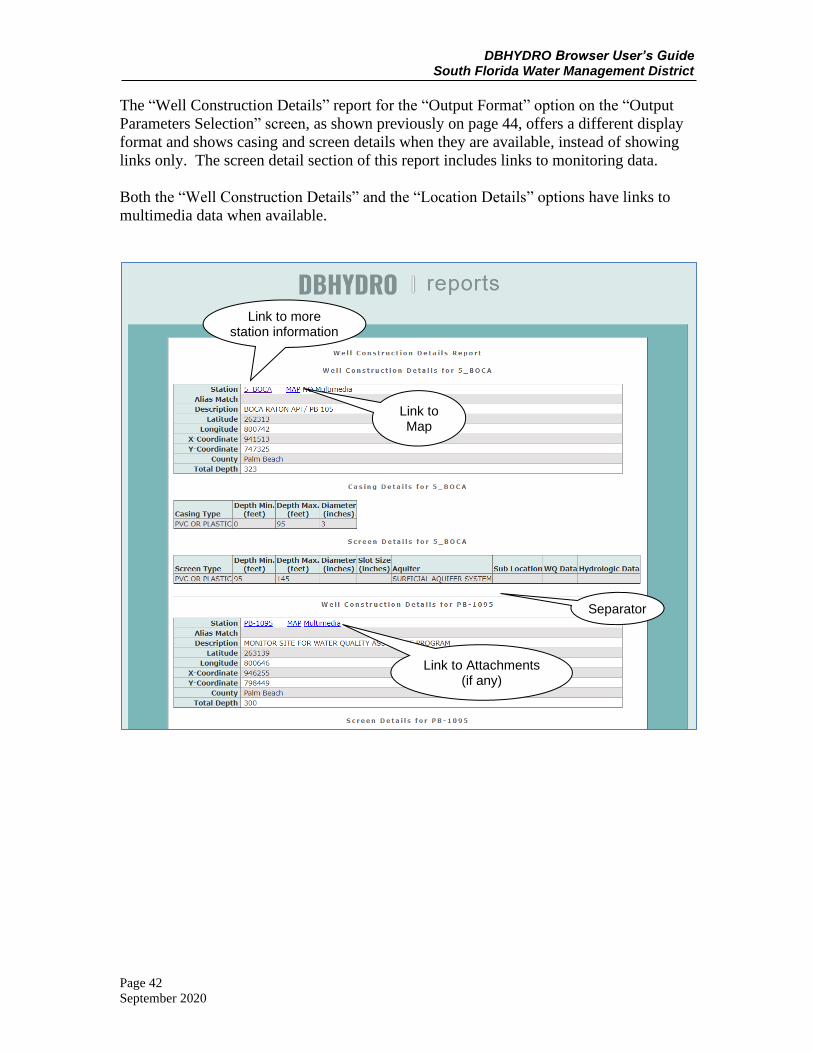
The “Well Construction Details” report for the “Output Format” option on the “Output
Parameters Selection” screen, as shown previously on page 44, offers a different display
format and shows casing and screen details when they are available, instead of showing
links only. The screen detail section of this report includes links to monitoring data.
Both the “Well Construction Details” and the “Location Details” options have links to
multimedia data when available.
Link to Map
Link to Attachments (if any)
Link to more station information
Separator

DBHYDRO Browser User’s Guide South Florida Water Management District
Page 43
September 2020
The Hydrogeologic Data Summary Report (below) shows all the different types of data
available for each well appearing in the query. The Hydrogeologic Data Summary Report
format provides highlighted links to the different data types offered in the hydrogeologic
section of DBHYDRO.
The link to Time Series data is visible when the user scrolls to the right (screenshot
shown below). This link brings up a list of all the time series data available for this
station including water quality and hydrologic data.
Link to more station information
Link to USGS NWISWeb

DBHYDRO Browser User’s Guide South Florida Water Management District
Page 44
September 2020
If lithologic details are available, clicking on the “Yes” link under Lithologic data type
produces a detailed lithologic description as shown below (e.g., Station W-12425). This
information can be saved to a text file (save as .txt) through the web browser file menu.
Clicking on the Hydrogeologic Data Summary Report “Yes” link under the Geophysics
data type takes the user through a series of screens that allow the user to create a file in
Log ASCII Standard (LAS) 2.0 format. LAS is a standard file format, created by the
Canadian Well Logging Society (www.cwls.org), to store wellbore log information. Well
logging is used to characterize subsurface stratigraphy in a wellbore.
Common curves found in a LAS file include gamma ray logging, sonic logging, or
resistivity logging.
Files are delivered in a compressed (.zip) format.

DBHYDRO Browser User’s Guide South Florida Water Management District
Page 45
September 2020
.LAS file
.ZIP file
DBHYDRO Browser User’s Guide South Florida Water Management District
Page 46
September 2020
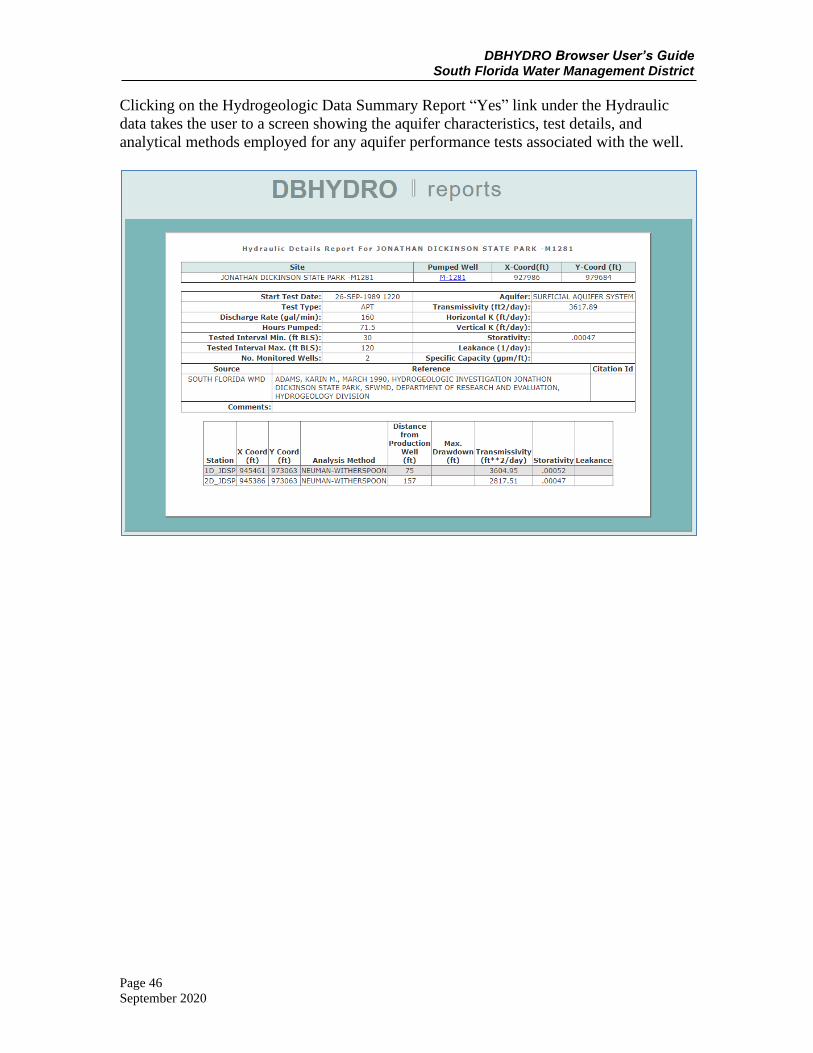
Clicking on the Hydrogeologic Data Summary Report “Yes” link under the Hydraulic
data takes the user to a screen showing the aquifer characteristics, test details, and
analytical methods employed for any aquifer performance tests associated with the well.

DBHYDRO Browser User’s Guide South Florida Water Management District
Page 47
September 2020
Access by Station Name
Clicking on the "by Station" link from the DBHYDRO Browser main menu brings up the
following screen:
On this screen the user can enter the name of the station the user wishes to query. The
percent sign (%) can be used as a wild card if the user is unsure of the exact station name.
The user may alternatively query by entering latitude-longitude or X-Y coordinates
(Note: The SFWMD uses the Florida state plane (feet) NAD83East Zone coordinate
system).

DBHYDRO Browser User’s Guide South Florida Water Management District
Page 48
September 2020
In the example below, the query “T%” was entered, yielding the following results:
Each of the station names is hyperlinked to information about that station (see example
shown in Section 2.0, Menu-Based Data Access. The user can retrieve data by station
through this screen by selecting desired stations and clicking on the “Get Time Series
Data” button at the bottom the page for each station of interest.

DBHYDRO Browser User’s Guide South Florida Water Management District
Page 49
September 2020
Access by Site Name
Sites represent a collection of stations. Therefore, the user can gain access to a group of
related stations by querying a single site. With this relationship, the site listing will
always be shorter than the station listing. Clicking on the "by Site Name" link from the
DBHYDRO Browser menu brings up the following screen:
Like the station query screen, on the Site Listing query screen the user can enter the name
of the site the user wishes to query, or the user may query by entering latitude-longitude
or X-Y coordinates. The percent sign (%) can be used as a wild card if the user is unsure
of the exact station name.

DBHYDRO Browser User’s Guide South Florida Water Management District
Page 50
September 2020
In example below, the query “T%” was entered, yielding the following results:
Like the station query, each of the site names is hyperlinked to information about that site
(see example shown in Section 2.0, Menu-Based Data Access. The user can retrieve data
by selecting desired sites and clicking on the “Get Time Series Data” button at the bottom
the page for each site of interest.

DBHYDRO Browser User’s Guide South Florida Water Management District
Page 51
September 2020
Access by Hydrologic Basin
Station data can be also accessed by clicking on the “by Hydrologic Basin” link on the
DBHYDRO main menu. Basin listings are arranged by alphanumeric grouping, or a basin
name can be manually entered.
In this example, the “B” basin grouping was selected, followed by selection of basin
name BOGGY CR:

DBHYDRO Browser User’s Guide South Florida Water Management District
Page 52
September 2020
The time series listing is displayed below for all basin BOGGY CR data.

DBHYDRO Browser User’s Guide South Florida Water Management District
Page 53
September 2020
Real Time Data
Click on the “Real Time Data” link from the main menu. This option is presently only
available for users whose login credentials have been authenticated on the SFWMD
computer network. If the user is a SFWMD employee and the Real Time Data option
does not appear, click on the “Login” hyperlink on the user’s page footer.
[SFWMD real time data can also be accessed from www.sfwmd.gov → Science & Data
→ Real-Time Data. Real-time weather data can also be accessed from Science & Data
→ Weather]
Real time stages and water control structure operations data are available. For example,
to query real time data at the S-155 spillway, check “Site Name” as the user’s search
parameter, and click on the “Submit” button.

DBHYDRO Browser User’s Guide South Florida Water Management District
Page 54
September 2020
The user then clicks on site S155 from the list of values and clicks on the “Submit”
button.
Subsequently, the user checks off the time series of interest (or uses the Select All button
to get them all) and clicks on the “Get Data” button.

DBHYDRO Browser User’s Guide South Florida Water Management District
Page 55
September 2020
There are six preset date range options. The user may also specify a custom date range.
The user selects “Today and previous 2 days” from the Date Range pull down, clicks
“Chart” on the “Destination” button, and clicks on the “Submit” button.
DBHYDRO Browser User’s Guide South Florida Water Management District
Page 56
September 2020
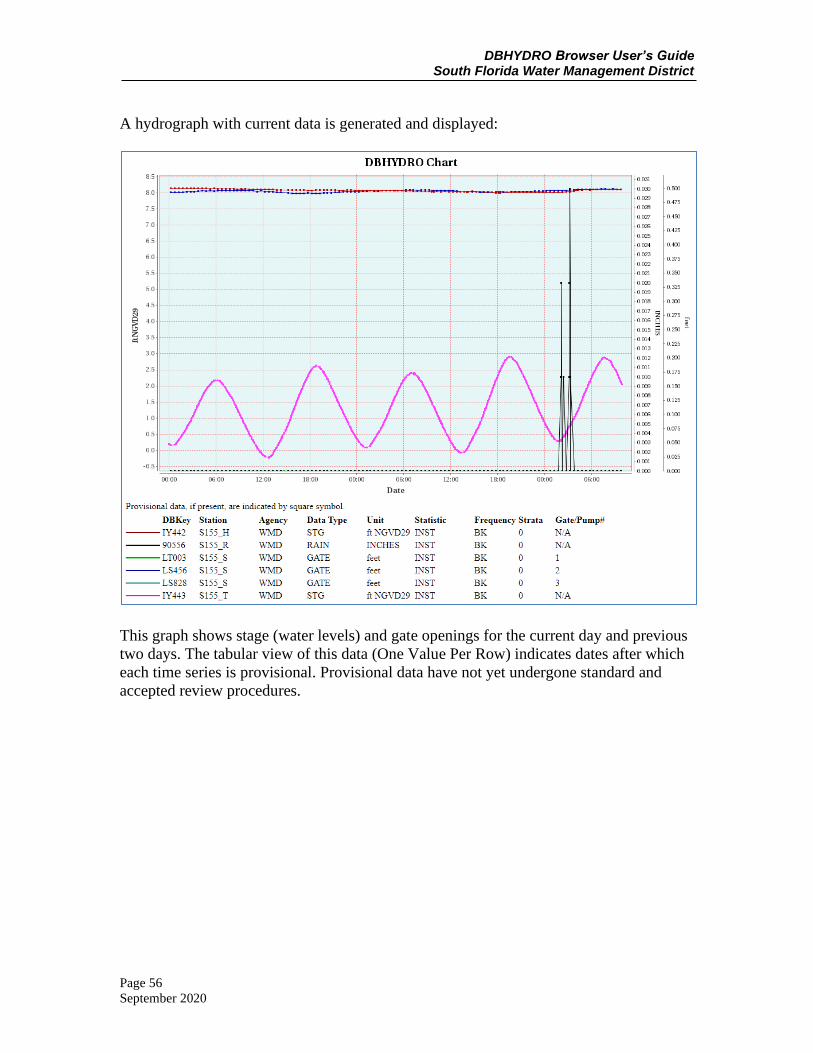
A hydrograph with current data is generated and displayed:
This graph shows stage (water levels) and gate openings for the current day and previous
two days. The tabular view of this data (One Value Per Row) indicates dates after which
each time series is provisional. Provisional data have not yet undergone standard and
accepted review procedures.

DBHYDRO Browser User’s Guide South Florida Water Management District
Page 57
September 2020
Web Map Access
This option is available to all users from the main menu.
At the bottom of the map are the “widgets” to perform specific functions:
Leg
end
Lay
er L
ist
Sea
rch
Fil
ter
Pri
nt
Bas
emap
Gal
lery
Mea
sure
Add D
ata
Dra
w
Att
ribute
Tab
le
Sav
e S
essi
on
Map Locator
About
Zoom to current location on your mobile device
Related Links
Widgets

DBHYDRO Browser User’s Guide South Florida Water Management District
Page 58
September 2020
Legend Widget
The Legend widget displays the legend for layers that are both visible and in scale.
Therefore, the legend is dynamically configured based on what is viewable at the
moment.

DBHYDRO Browser User’s Guide South Florida Water Management District
Page 59
September 2020
The Layer List Widget
The Layer List widget controls which
layers are turned on and off. All
checkboxes in a layer hierarchy must be
checked for that lowest level layer to be
visible. Arrows pointing to the right
indicate there is additional information
to be displayed; either another sub-layer
or the symbol for that layer. Each layer
has their own visibility scale defined so
all layers may not visible at all map
scales.
From the image below we see how the
Legend List only shows the symbols for
the map layers visible.
Selecting a station, by clicking on its
symbol on the map, displays a pop-up
with information about the station and a
link to its data.

DBHYDRO Browser User’s Guide South Florida Water Management District
Page 60
September 2020

DBHYDRO Browser User’s Guide South Florida Water Management District
Page 61
September 2020
Search Widget
The Search widget allows the user to find a station or site based on its name, a structure
by name, a NEXRAD cell by Feature Id, a waterbody by name, a watershed by name, a
canal by name (or alias) or a county by name. In the example below the choice of the C-
6 watershed zooms the map to the watershed, highlights its boundary, and shows all the
features turned on and revealed at that scale.

DBHYDRO Browser User’s Guide South Florida Water Management District
Page 62
September 2020
Print Widget
The Print widget provides the capability to save a quality map in a number of formats
including PDF and JPG and then print it. Map title, author, and copyright are
configurable as are image resolution, size, and extent. Layouts such as portrait or
landscape and paper size can be selected from several choices.

DBHYDRO Browser User’s Guide South Florida Water Management District
Page 63
September 2020
Basemap Gallery Widget
The Basemap Gallery widget allows the user to choose from 13 basemaps including
imagery. The default basemap is Imagery. Some users find topographic useful. It is easy
to switch among basemaps with the basemap widget.

DBHYDRO Browser User’s Guide South Florida Water Management District
Page 64
September 2020
Measure Widget
The Measure widget allows the user to capture point location information and measure
both linear distances and areas in a variety of measurement units.

DBHYDRO Browser User’s Guide South Florida Water Management District
Page 65
September 2020
Add Data Widget
The Add Data widget provides the ability to add:
• ArcGIS Online content,
• ArcGIS Server Web Service, services,
• or your own data files to the map.
You can drop or browse for one the following file types:
• a Shapefile (.zip, ZIP archive containing all shapefile files),
• a CSV File (.csv, with address or latitude, longitude and comma, semi-colon or
tab delimited),
• a GPX File (.gpx, GPS Exchange Format), or
• a GeoJSON File (.geo.json or .geojson).
A maximum of 1000 features is allowed.

DBHYDRO Browser User’s Guide South Florida Water Management District
Page 66
September 2020
Draw Widget
The Draw widget provides the ability to mark-up the map with points, lines, shapes, and
text. Mark-ups are printed when using the Print widget.
Note: The Print widget might want to print layers that are checked but not visible at the
present scale.
Please turn off all layers, and their parents, explicitly that you do not want printed before
using the print widget.

DBHYDRO Browser User’s Guide South Florida Water Management District
Page 67
September 2020
Save Session Widget
The Save Session widget allows you to save your map. Open the widget and type the
name you wish to give the session then click Save. The current map settings are saved.
You may save multiple sessions.
You have the option to Save all sessions to your computer. Click Save to File and browse
to your desired location.
If you want to open a file click on Load from file and browse to that location.
To edit the session name click on the pencil icon.
To delete the session from the list click on the
Delete icon.
To save individual map files click on the desired session
within the list of saved sessions and click on Download
Map.
To bring a particular saved map into view click on the desired session within the
list of saved sessions and click on Load Map.
To recall a previously saved session, select Load from file. Browse to your location. Locate
the .zip file. Unzip the file using a program such as WinZip or 7-Zip. Locate the file
within the .zip named session.json. Extract session.json to the current directory. This file
contains your saved map. Select the file. Open the file. The file was added to your map.
Click OK.
DBHYDRO Browser User’s Guide South Florida Water Management District
Page 68
September 2020
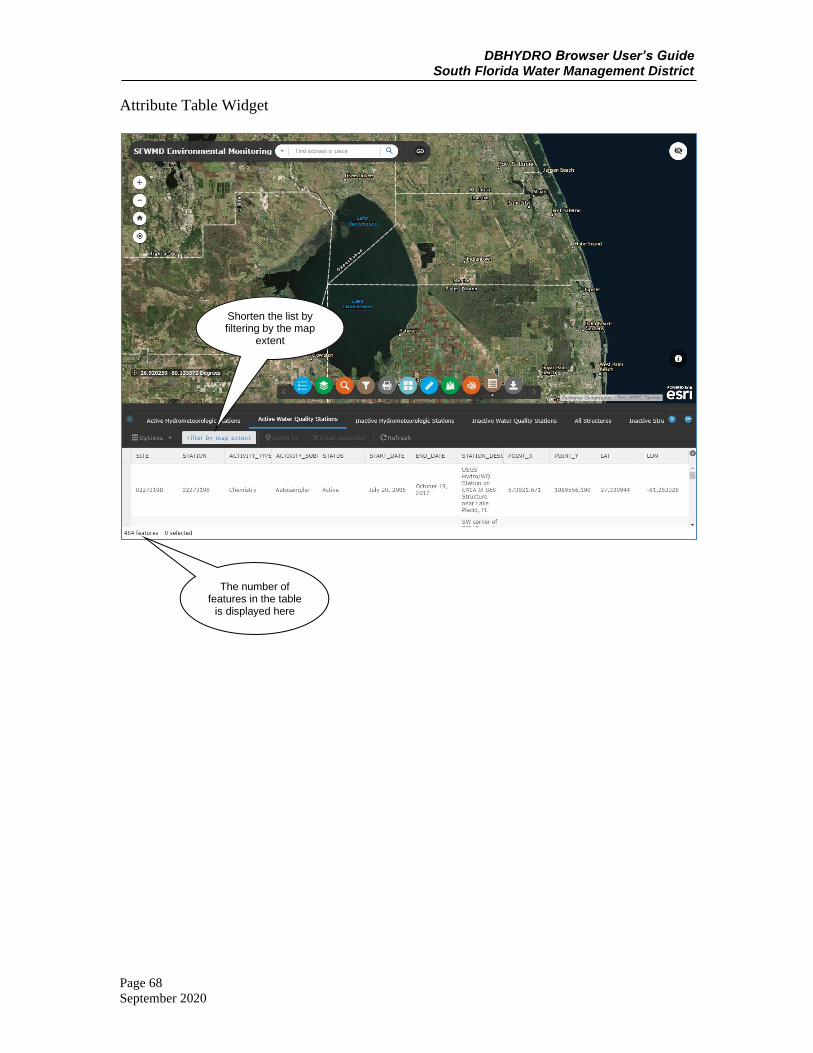
Attribute Table Widget
The number of features in the table
is displayed here
Shorten the list by filtering by the map
extent

DBHYDRO Browser User’s Guide South Florida Water Management District
Page 69
September 2020
Data Processing and Validation Utilities
This option is available on the SFWMD intranet only.
The system in which QA/QC is performed on SFWMD instrument readings is the Data
Collection/Validation Preprocessing (DCVP) system. The utilities on this menu are
primarily used by District staff that performs QA/QC on instrument readings prior to data
archival in DBHYDRO.

DBHYDRO Browser User’s Guide South Florida Water Management District
Page 70
September 2020
Interval Value Generator
Clicking on the “Interval Value Generator” link brings the user to the following screen:
The Interval Value Generator (IVG) program allows the user to generate summarized
statistical information from any individual or group of individual DCVP station_ids. Each
DCVP station _id is a set of readings from a single sensor or device. The DCVP use of
the term “station” is distinct from that used throughout DBHYDRO. One DBHYDRO
station may contain multiple DCVP station_ids. IVG can be used to create mean daily
values, maximum hourly values, minimum monthly values, etc. The user may define any
date range of interest. IVG works with archived, provisional, and real time data. The
output may be online or via batch jobs. Batch jobs will send an email notification when
complete.

DBHYDRO Browser User’s Guide South Florida Water Management District
Page 71
September 2020
DCVP Station Id Listing
Returning to the Data Processing and Validation Utilities menu affords the user other
options. The Data Collection Validation Preprocessing system station reference table may
be accessed by clicking on the “DCVP Station Id Listing” link. The selection leads to this
screen:
The user may select all Station Ids (time series) starting with a given character or query
by Station Id name (using the % as a wild card), application name (the processing
method), parameter code, technician assigned to the station, site name, or agency from
whom the dataare received.

DBHYDRO Browser User’s Guide South Florida Water Management District
Page 72
September 2020
In the example below, entering the letter “T%” generates a list of all DCVP Station Ids
beginning with the letter “T”:
There is an extensive list of DCVP Station Id attributes, several of which are hyperlinked
to other related tables to provide additional information about the particular time series.
For example, the user can find out the name of the person responsible for the validation
of a particular SFWMD data set if there are any questions about the data.
Streamflow Measurements
Direct field measurements of streamflow conducted by SFWMD staff are accessible via
the Streamflow Measurements link. Streamflow measurements are used to create water
control structure rating curves to develop more accurate estimates of water control
structure discharges.

DBHYDRO Browser User’s Guide South Florida Water Management District
Page 73
September 2020
ET Data and Radar-Based Rainfall Data
ET and radar-based rainfall data are available at http://www.sfwmd.gov/nexrad2.
NEXRAD or Nexrad (Next-Generation Radar) is a network of high-resolution, S-band
Doppler weather radars operated by the National Weather Service, an agency of the
National Oceanic and Atmospheric Administration within the United States Department
of Commerce. Its technical name is WSR-88D (Weather Surveillance Radar, 1988,
Doppler). NEXRAD detects precipitation and atmospheric movement or wind. It returns
data which when processed can be displayed in a mosaic map, which shows patterns of
precipitation and its movement (http://en.wikipedia.org/wiki/NEXRAD, accessed April 5,
2013).
At the District, radar rainfall originates with National Weather Service data and is further
gage-adjusted using measured rainfall amounts from the agency’s rain gage monitoring
network. As such, this radar rainfall is also called gage-adjusted radar-rainfall (GARR).
The application, also known as NEXRAD or NEXRAIN, has its own User’s Guide,
which may be accessed from the bottom of the main screen (as shown above) to access
the gage-adjusted radar-rainfall. Both map-based and text-based retrievals are available.
Map-based retrievals result in thematic maps of rainfall amounts defined by the
geographic layer of choice. Text-based retrievals result in data files that may be viewed
or imported into other applications.

DBHYDRO Browser User’s Guide South Florida Water Management District
Page 74
September 2020
Further information about NEXRAD radar data is available at:
https://www.ncdc.noaa.gov/data-access/radar-data/nexrad

DBHYDRO Browser User’s Guide South Florida Water Management District
Page 75
September 2020
Metadata/Reference Tables
Metadata includes descriptive information about the context, quality, and condition, or
characteristics of the data. In the case of DBHYDRO, each of the attributes of a time
series or a measurement is such metadata. The domains from which these attributes are
drawn are accessible by clicking on the Metadata/Reference Tables option from the main
DBHYDRO menu. Upon selection, the following DBHYDRO Metadata screen appears:
Clicking on any one of the items displays an up-to-date list of valid values for that
particular attribute.
DBHYDRO Browser User’s Guide South Florida Water Management District
Page 76
September 2020
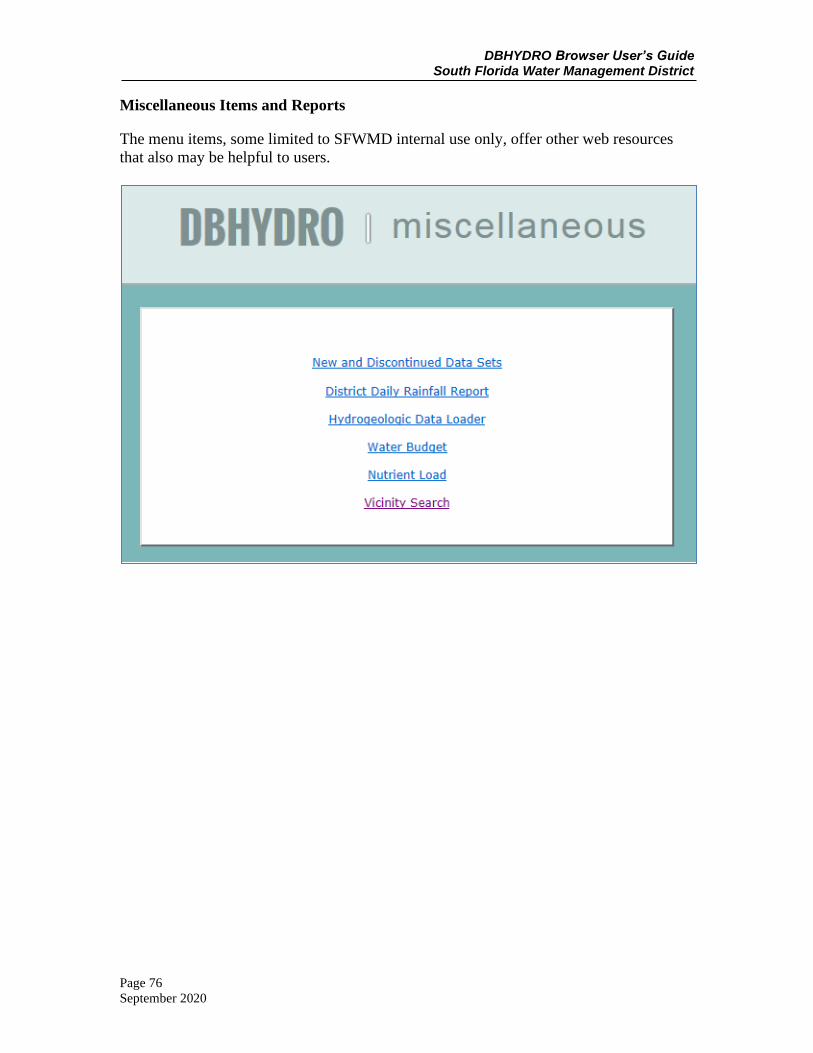
Miscellaneous Items and Reports
The menu items, some limited to SFWMD internal use only, offer other web resources
that also may be helpful to users.

DBHYDRO Browser User’s Guide South Florida Water Management District
Page 77
September 2020
New and Discontinued Data Sets
New data sets are continually added to the database. Monitoring may also be
discontinued or changed from one method to another. This feature provides information
on such additions or changes to the database.
Clicking on the “New and Discontinued Data Sets” link results in the screen below:
Users may choose from various report types, disciplines, and date ranges of interest.
The following screen displays the results of a query of newly created data sets in the
surface water discipline:
By clicking on “Other Data Sets at Station” link on the last column at the right side of
this data query screen, the user can view what other time series are or have been
measured at the station of interest.

DBHYDRO Browser User’s Guide South Florida Water Management District
Page 78
September 2020
All the “headers” for each of the time series at the selected station are displayed:

DBHYDRO Browser User’s Guide South Florida Water Management District
Page 79
September 2020
District Daily Rainfall Report
Several tabbed interfaces to District-wide rainfall data and other web-based climate
resources from the “District Daily Rainfall Report” link from the “Miscellaneous Items
and Reports” menu are available via this page.
DBHYDRO Browser User’s Guide South Florida Water Management District
Page 80
September 2020
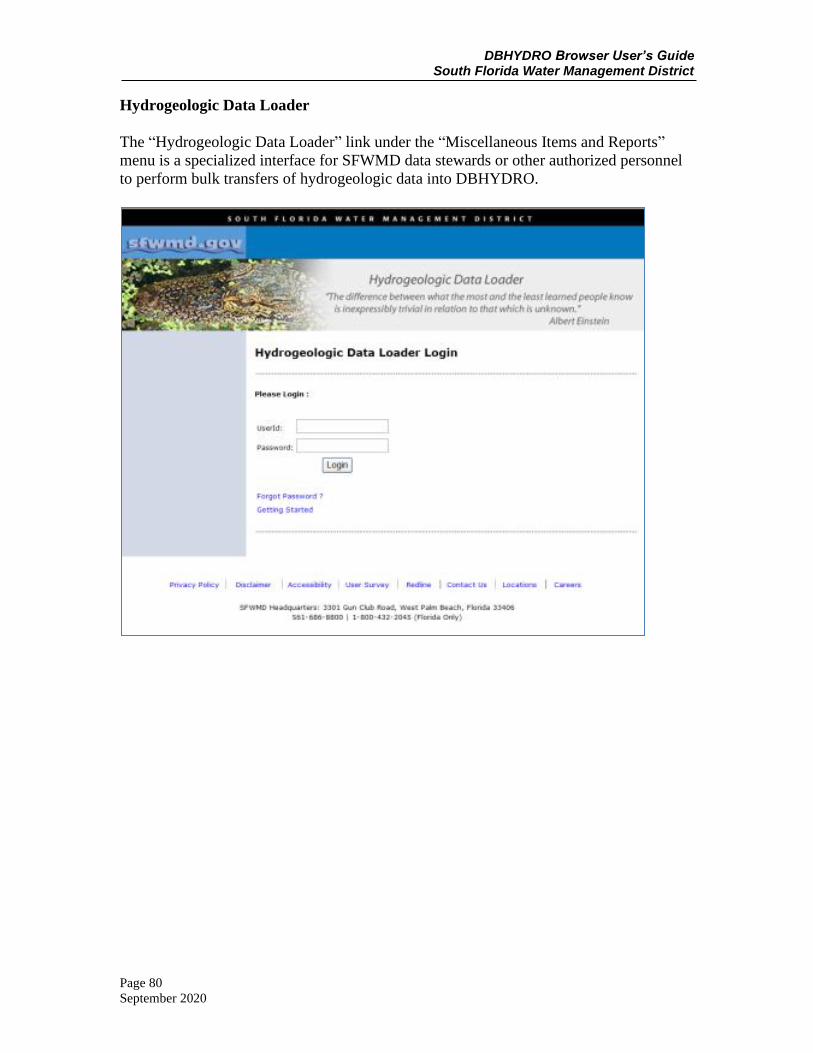
Hydrogeologic Data Loader
The “Hydrogeologic Data Loader” link under the “Miscellaneous Items and Reports”
menu is a specialized interface for SFWMD data stewards or other authorized personnel
to perform bulk transfers of hydrogeologic data into DBHYDRO.

DBHYDRO Browser User’s Guide South Florida Water Management District
Page 81
September 2020
Water Budget
The “Water Budget” function from the “Miscellaneous Items and Reports” menu is
available on the SFWMD intranet only.
The primary purpose of this program is to provide comprehensive water budget
information for Everglades Stormwater Treatment Areas (STAs). However, the program
can be used to develop a water budget for any water body, where daily data are available
from DBHYDRO. The program is capable of performing calibration of water budgets for
STAs and also for each cell within an STA. The water budget application has its own
User’s Guide, which is accessible from the water budget application menu.

DBHYDRO Browser User’s Guide South Florida Water Management District
Page 82
September 2020
Nutrient Load Computation Application
The “Nutrient Load” function from the “Miscellaneous Items and Reports” menu is
available to SFWMD staff on the intranet only.
Key features of the nutrient load application include the ability to calculate loads based
on flow time series and water quality concentration time series pairings. The outputs of
these calculations are not presently stored in DBHYDRO. The nutrient load application
has its own User’s Guide, accessible from the application’s menu.

DBHYDRO Browser User’s Guide South Florida Water Management District
Page 83
September 2020
Nearby Station Look-up
By clicking on the “Vicinity Search” link from the “Miscellaneous Items and Reports”
menu, the user can find out which stations are near a given station or coordinate. A
variable distance in miles may be entered. The output list may be further filtered by
discipline and even further by data type within a discipline.
After clicking on the “Submit” button, a list of stations within the previously specified
distance of one mile is displayed.

DBHYDRO Browser User’s Guide South Florida Water Management District
Page 84
September 2020
3.0 URL-BASED DATA ACCESS
Web Services
If a user frequently accesses a specific DBHYDRO page, the URL can be saved as a
browser bookmark or in any document or other web page as a hyperlink. By embedding
these hyperlinks in bookmarks or applications, the user can avoid having to navigate
through the DBHYDRO menu or Google Earth.
Users have the ability to create their DBHYDRO URLs by knowing the URL syntax.
Note of caution: A valid URL cannot contain a space. What may appear as spaces (“ ”)
in these URL examples are actually underscores (“_”).
Extra note of caution: While the development team will take considerable effort to
maintain the integrity of existing URLs, queries for specific data within DBHYDRO may
not function in the future if the software or database is substantially changed. If these
URLs change, this documentation will be updated.
There are four kinds of DBHYDRO URLs:
• water quality results
• hydrologic instantaneous and daily values
• hydrographs
• hydrogeologic summaries
Water Quality Results URLs
Water quality data access is controlled by:
1) A base URL
Report Base URL
full http://my.sfwmd.gov/dbhydroplsql/water_quality_data.report_full?
cross-tab http://my.sfwmd.gov/dbhydroplsql/water_quality_data.report_process?
and
2) a series of URL variables with their corresponding values
URL variable Definition Valid Values
v_where_clause
a text string defining which
data are to be retrieved and
follows the syntax described in
the examples below.
may contain references to
project_code, station_id,
sample_id, test_number, and
date_collected.
v_target_code
controls the destination of the
output.
screen (output as HTML
to your browser)
file_csv (a comma separated
variable format that is Excel-ready)
pdf (portable document format)

DBHYDRO Browser User’s Guide South Florida Water Management District
Page 85
September 2020
URL variable Definition Valid Values
v_report
used only with the cross-tab
base URL and defines which
type of cross-tab report to
generate
ctr_1_true (cross-tab one line per
sample)
ctr_w (cross-tab wide – also
better than ctr_1_true when using a
single test number but still not as
complete as the full report)
v_exc_qc This will exclude Field QCs; if
not included in the URL, or set
to N, the report will contain
Field QC results. Optional.
N (default)
Y
v_exc_flagged This will exclude Flagged data;
if not included in the URL, or
set to N, the report will contain
flagged data. Optional.
N (default)
Y
Examples
Querying by Project Code
The full report for water quality data that have not been flagged can be generated for any
project_code (ACMEB in the example below) with the following URL: http://my.sfwmd.gov/dbhydroplsql/water_quality_data.report_full?v_where_clause=
where+project_code='ACMEB'&v_target_code=screen
The plus signs are interpreted as spaces because spaces are not allowed in a URL.
Note: The + signs, representing spaces, may alternatively be encoded as %20 to be
properly interpreted by the web server.
Querying by Station
The report for water quality data that have not been flagged can be generated for any
station (ORF-62 in the example below) with the following URL: http://my.sfwmd.gov/dbhydroplsql/water_quality_data.report_full?v_where_clause=
where+station_id='ORF-62'&v_target_code=screen
Querying for Multiple Stations
The report for water quality data that have not been flagged is generated for multiple
stations with the following URL: http://my.sfwmd.gov/dbhydroplsql/water_quality_data.report_full?v_where_clause=
where+station_id+in+('ACRA1','ACRA2')&v_target_code=screen
The station list is enclosed by parentheses with each station in single quotes and
separated by commas.
Querying by Test Number
Here is an URL for querying chemistry results for project ACRA and test numbers 7 and
25 (water temperature and total phosphorus): http://my.sfwmd.gov/dbhydroplsql/water_quality_data.report_full?v_where_clause=
where+project_code='ACRA'+and+test_number+in+(7,25)&v_target_code=screen

DBHYDRO Browser User’s Guide South Florida Water Management District
Page 86
September 2020
Querying by Date Range
The user can restrict date ranges. If the user wants to get data only after a certain date,
add after “v_where_clause=where”, the following string:
+date_collected+>+’01-JAN-2010’+and+
as follows: http://my.sfwmd.gov/dbhydroplsql/water_quality_data.report_full?v_where_clause=
where+date_collected+>+'01-JAN-2010'+and+station_id+in+('ORF-
62','ACRA1')&v_target_code=screen
The user may also use:
+date_collected+<+’01-JAN-2011’+and+
to get data only before a certain date.
Querying by Sample_id
Here is an URL for querying chemistry results having sample_id beginning with P35578: http://my.sfwmd.gov/dbhydroplsql/water_quality_data.report_full?v_where_clause=
where+sample_id+like+'P35578%25'&v_target_code=screen This query may take a minute or more.
Querying Using Wild cards
To display the data for all stations beginning with the characters ACRAWEL: http://my.sfwmd.gov/dbhydroplsql/water_quality_data.report_full?v_where_clause=
where+station_id+like+('ACRAWEL%25')&v_target_code=screen Note: The % wild card character is encoded as %25 so it may be properly interpreted by
the web server.
Saving Results to a .csv File
To write the results directly to a .csv file use a target_code of file_csv as shown here: http://my.sfwmd.gov/dbhydroplsql/water_quality_data.report_full?v_where_clause=
where+date_collected+>+'01-JAN-2010'+and+station_id+in+('ORF-
62','ACRA1')&v_target_code=file_csv
Cross-tab reports exclude qualifiers. Users do so at their own peril.
The crosstab reports have a base URL than the full report and an additional variable
v_report. The crosstab report syntax is: http://my.sfwmd.gov/dbhydroplsql/water_quality_data.report_process?v_report=ctr
_1_true&v_where_clause=where+test_number=25+and+date_collected+%3e=+'01
-JAN-2014'+and+station_id+in+('LOX3')&v_target_code=screen
Note: The v_where_clause variable for water quality results has additional capabilities
not documented here. If you find the capabilities described here insufficient please
contact the District.

DBHYDRO Browser User’s Guide South Florida Water Management District
Page 87
September 2020
Hydrologic Instantaneous and Daily Values URLs
Hydrologic instantaneous and daily values data access is controlled by:
1) A base URL,
http://my.sfwmd.gov/dbhydroplsql/web_io.report_process? and
2) a series of URL variables with their corresponding values
URL variable Definition valid value(s)
v_report_type defines the layout
of the report
format6 (one row per value)
format7 (one row per day - valid for daily values
only)
v_period allows for a date
range from today
backward in time
or
indicates user-
defined explicit
start and end
dates
year (avoid instantaneous dbkeys, use dbkeys of
frequency ‘DA’)
month (the past 30 days from today)
1week (the past 7 days from today)
3day (the past 3 days from today)
today (for instantaneous,, typically provisional, data
series)
uspec (user requires both v_start_date and
v_end_date)
v_start_date required when
v_period=uspec
yyyymmdd (e.g. 20110415)
only valid when v_period=uspec
v_end_date required when
v_period=uspec
yyyymmdd (e.g. 20110516)
only valid when v_period=uspec
v_target_code controls the
destination of the
output
screen (default)
file_csv
v_run_mode onLine (required)
v_js_flag Y (required)
v_dbkey the id(s) for the
time series
one or more dbkeys separated by ‘/’ (forward
slash)
Example
A daily values tabular report is generated for any dbkey (in this example, the dbkey is
15631) and date range with the following URL:
http://my.sfwmd.gov/dbhydroplsql/web_io.report_process?v_period=uspec&v_start_
date=20090101&v_end_date=20110430&v_report_type=format6&v_target_code=sc
reen&v_run_mode=onLine&v_js_flag=Y&v_dbkey=15631
Each input variable name, except for the first one, is preceded by the ampersand character
and followed by the equals sign (‘=’).

DBHYDRO Browser User’s Guide South Florida Water Management District
Page 88
September 2020
Hydrographs URLs
Hydrographs generation is controlled by:
1) A base URL,
http://my.sfwmd.gov/dbhydroGraph/servlet/DbhydroGraphServlet.do? and
2) a series of URL variables with their corresponding values
URL
variable Definition valid value(s)
v_report_type defines the layout
of the report
format6 (required variable but ignored….go
figure!!)
v_period allows for a date
range from today
backward in time
or
indicates user-
defined explicit
start and end dates
year (avoid instantaneous dbkeys, use dbkeys of
frequency ‘DA’)
month (the past 30 days)
1week (the past 7 days)
2week (the past 14 days)
3day (the past 3 days)
today (best for instantaneous data series)
uspec (user is required to specify v_start_date and
v_end_date)
v_start_date required when
v_period=uspec
yyyymmdd (e.g. 20110415) – only valid when
v_period=uspec
v_end_date required when
v_period=uspec
yyyymmdd (e.g. 20110516) – only valid when
v_period=uspec
v_target_code
not applicable
because ‘screen’ is
the only option
v_dbkey the id(s) for the
time series
one or more dbkeys separated by ‘/’ (forward
slash)
Examples
A hydrograph of the past 7 days of instantaneous near real-time values from the four
gages contributing to the Lake Okeechobee daily average is generated as follows:
http://my.sfwmd.gov/dbhydroGraph/servlet/DbhydroGraphServlet.do?v_report_type
=format6&v_period=1week&v_dbkey=IX846/IX865/IX875/IY030
Other options for the period for instantaneous data include ‘3day’ and ‘today’. Increasing
the number of dbkeys and the duration will increase the time it takes to generate the
graph. Multiple dbkeys are separated by the forward slash ( / ) character.
To generate a hydrograph of the past year of daily stage values from four water level
gages on Lake Okeechobee, enter the following URL in the browser:

DBHYDRO Browser User’s Guide South Florida Water Management District
Page 89
September 2020
http://my.sfwmd.gov/dbhydroGraph/servlet/DbhydroGraphServlet.do?v_report_type
=format6&v_period=year&v_dbkey=16022/12509/12519/16265
Each input variable name, except for the first one, is preceded by the ampersand character
and followed by the equals sign (‘=’).
An error may be encountered if there are no data available for the specified period.
Note: If a icon appears where the graph should be, refreshing the user’s page may
solve the problem. The F5 function key also refreshes the screen in Internet Explorer.
To ensure the user will retrieve the most up-to-date data, be sure to clear the user’s web
browser cache prior to executing the same URL a second time within the same browser
session. In Internet Explorer this is accomplished by accessing ‘Tools’ from the Internet
Explorer menu.

DBHYDRO Browser User’s Guide South Florida Water Management District
Page 90
September 2020
Hydrogeologic Data Summaries
Hydrogeologic data summary pages are controlled by:
A base URL,
1) http://my.sfwmd.gov/dbhydroplsql/show_wilma_info.report_process?
and
2) a series of URL variables with their corresponding values
URL variable Definition valid value(s)
v_output_format defines the layout
of the report
list
headerdetail
summary
correspond to the three format choices
provided in the web browser application.
list is Location Details, headerdetail is Well
Construction Details, and summary is
Hydrogeologic Data Summary
v_station station name One or more stations separated by the
forward slash “/”. No wildcards are
allowed here.
Examples:
http://my.sfwmd.gov/dbhydroplsql/show_wilma_info.report_process?v_output_form
at=summary&v_os_code=win&v_station=LYTAL-TW

DBHYDRO Browser User’s Guide South Florida Water Management District
Page 91
September 2020
4.0 CONTACT INFORMATION
Application Enhancements
The District’s Enterprise Scientific Data Manager, Brian Turcotte (561-682-6579;
[email protected]), is the primary point of contact to discuss or suggest areas for
improvement. SFWMD employees may also call the IT Help Desk, send an email to the
“IT Solution Center”, or log their own Remedy Help Desk requests or software bug
reports.
Training
Through a series of succinct videos, participants will learn how the District collects data,
what types of data are available, and the best ways to search the database. You can get
started at: www.sfwmd.gov/dbhydrotraining.
Data Requests and Inquiries
To report questionable data to request data send email to [email protected]

DBHYDRO Browser User’s Guide South Florida Water Management District
Page 92
September 2020
5.0 APPENDICES
Appendix A - Water Quality Report Column Descriptions
PROJECT CODE
A short identifier given to a collection of samples from a group of related stations. The
code identifies project-specific samples. The code is typically derived from the project
description. e.g. "ENRP" is the project code for samples collected in the "Everglades
Nutrient Removal Project". Codes are listed in the metadata/reference tables listings
pages.
STATION ID
Identifies the sampling station name for the water quality data sample collection activity.
SAMPLE ID
Identifies a discrete sample within a project.
FIRST TRIGGER DATE
Populated for autosampler data. Date and time the first sample was triggered to be
collected by the autosampler.
COLLECTION DATE
Date and time the sample was collected by the field person.
SAMPLE TYPE NEW
Code that describes the type of sample collected. Samples may either be an
environmental sample (regular sample of type "SAMP") or a type of field quality control
sample that is collected as a part of a quality assurance program. Codes are listed in the
metadata/reference tables listings pages.
COLLECTION METHOD
The method by which the sample was collected. For example, ‘G’ means grab sample.
Codes are listed in the metadata/reference tables listings pages.
DEPTH
The depth below the water surface at which the sample was taken.
DEPTH_UNITS
The units of measure of the depth value. Depth units depends on the matrix (e.g., meters
for SW and feet for GW are defaults) and applies to both the sampling depth and the
Total Depth (Total Depth as a test is reported as SDU, See Depth Units).
MATRIX
A code that represents the type of material being sampled. Codes are listed in the
metadata/reference tables listings pages.

DBHYDRO Browser User’s Guide South Florida Water Management District
Page 93
September 2020
TEST_NUMBER
Numeric code used to identify individual tests within the laboratory. e.g. 25 = TPO4
"Total Phosphorus".
TEST NAME
A description of the test performed.
STORET CODE
The Environment Protection Agency (EPA) legacy 5-character string that uniquely
identifies a water quality test.
METHOD
The field or laboratory method by which the sample was analyzed.
MEASURE DATE
The date and time the laboratory analysis was conducted.
VALUE
Numeric field which contains the analysis result for a specific test.
SIGFIG VALUE
The test result shown to no more significant figures than instrumentation actually
provides.
UNCERTAINTY
The reporting of estimated analytical measurement uncertainty values for all analytes was
implemented at the SFWMD Chemistry Laboratory in July 2012. The values entered into
DBHYDRO for the District’s laboratory reflect only analytical uncertainty (i.e., without
the contributions from field activities). The uncertainty has a probabilistic basis and
reflects incomplete knowledge of the quantity. All measurements are subject to
uncertainty and a measured value is only complete if it is accompanied by a statement of
the associated uncertainty.
The uncertainty value in DBHYDRO has been estimated using the nested hierarchical
methodology by Ingersoll (2001) in combination with a mathematical model found in the
Eurachem/CITAC (2000) guide on uncertainty. This QC-based nested approach uses the
statistical QC data attributed to laboratory measurement activities and does not include
uncertainty attributed to field sampling activities. The estimated uncertainty is calculated
using the following equation:
u(x) = √𝑠2𝑜
+ ( 𝑠21
𝑥2 )
in which:
u(x) is the combined standard uncertainty in the result x.
s0 is a constant contribution to the overall uncertainty derived from the
procedure to determine the MDL.

DBHYDRO Browser User’s Guide South Florida Water Management District
Page 94
September 2020
s1 is a proportionality constant derived from nested hierarchical methodology
by Ingersoll.
Many factors contribute towards deviation from the true value of the measurement
including:
• Imperfections in the measuring instrument
• Imperfections in the measurement method
• Operator effects
MDL
Method Detection Limit. Is particular to each laboratory and is calculated based on
statistical analysis of the results of repeated analyses of the same standard. "The method
detection limit (MDL) is defined as the minimum concentration of a substance that can be
measured and reported with 99% confidence that the analyte concentration is greater than
zero and is determined from analysis of a sample in a given matrix containing the
analyte....The MDL for an analytical procedure may vary as function of sample type.
The procedure requires a complete, specific, and well-defined analytical method. It is
essential that all sample processing steps of the analytical method be included in the
determination of the method detection limit."--- CFR Part 136 Appendix B (revised July
1998)
PQL
The smallest concentration of an analyte of interest that can be quantitatively reported
with a specific degree of confidence. The practical quantitation limit IS verified for each
matrix, technology and analyte. The validity OF the practical quantitation limit is
verified by analysis of a quality control sample containing the analytes of concern. For
any component for which spiking solutions or quality control samples are not available,
the practical quantitation limit is 12 times the standard deviation that is derived from the
procedure used to determine the method detection limit, or can be assumed TO be four
times the method detection limit.
RDL
This value is the Reportable Detection Limit and is the lowest value the analyst has
confidence reporting.
UNITS
Contains the units in which a test value is reported by the laboratory (SFWMD or
contractor) e.g. micro g/L. Ideally, all units for a given test should be reported the same.
When a lab gives us different units for a test it should trigger a review of the value so we
make sure the data set is consistent with respect to units.

DBHYDRO Browser User’s Guide South Florida Water Management District
Page 95
September 2020
REMARK_CODE
Comprised of zero, one, or more data qualifiers as applied by the lab or project manager.
The list of data qualifiers and their meaning, except for PMR and PMF, are approved by
Florida DEP. Qualifiers are important factors that any data user should be aware of, and
neglecting them is perilous and fails to recognize that they are the single most important
tool for data validation. No one should ever use data without reviewing all of the
qualifiers (and associated sample qualifier comments) very closely. Qualifier codes are
listed in the metadata/reference tables listings pages.
FLAG
Indicates questionable data. eg. "EOV" Extreme Outlier Value based on historical
statistics. Flag is <null> unless there is a "fatal" qualifier in the remark code. In such a
case the flag is equal to the remark code or contains the value "yes".
RECEIVE DATE
The date the sample was received at the SFWMD laboratory from the field.
LIMS_NUMBER
Unique string generated by the laboratory at sample log in. Used to identify a discrete
sample and all results for a sample. e.g. "L345-670"
SOURCE
Identifies the source laboratory of the sample data. e.g. "USGS" indicates data came from
the United States Geological Survey.'
OWNER
Typically the organization which paid for the analysis.
VALIDATION LEVEL
The degree to which post laboratory data validation occurred. Codes are listed in the
metadata/reference tables listings pages.
VALIDATOR
The organization responsible for the post-laboratory validation of the data.
SAMPLING PURPOSE
Code that describes the reason the sample was collected. The purpose of the sample
provides context for potential re-use of the data for other purposes.
DATA INVESTIGATION
Indicates whether the data have been subject to additional investigation subsequent to
validation. Presence of the indicator helps prevent unnecessary re-investigations of data.
Results of investigations are kept on file for future inquiries. Codes are listed in the
metadata/reference tables listings pages.

DBHYDRO Browser User’s Guide South Florida Water Management District
Page 96
September 2020
TDEPTH
The total depth of the water column at the location of the sample. This column is a legacy
of an older process. Currently total depth is recorded in the table as test (test_number =
99)
DCS
DCS is depth to consolidated substrate. Values are in meters.
FILTRATION DATE
The date the sample was filtered, if applicable, and known.
SAMPLE TYPE
Two-digit number for legacy applications. Information embedded here is contained
explicitly in other columns. Indicates sample type e.g. 01=RAIN, 02=WELL. Rendered
obsolete by sample_type_new column.
QCTYPE
A legacy code indicating sample is a QC sample otherwise null. e.g. EB = Equipment
Blank. Rendered obsolete by sample_type_new column.
DISCHARGE
A code representing a visual observation of flow at the time of sample collection
(required only when grab samples are collected). The observation is made from where the
sampling personnel stand to collect the sample. There is no requirement to use any
procedure to help in the determination of flow such as using sand or a dye to determine
flow.
Valid codes are:
0 Undefined, no observation, no sample is collected or EB, FCEB and FB
sample types (The code for discharge is recorded as a “0” for coastal
sample collection, autosampler collection, rain sample collection, or if no
observation is made).
1 Flow
2 No Flow
3 Reverse Flow
UP DWN STREAM
Indicates where a sample was collected with respect to a control structure. If downstream
and flowing then higher turbidity may be expected. Codes are 0 = Undefined, 1 =
Upstream, 2 = Downstream.
WEATHER CODE
The code for weather is recorded for grab sample collections only and must represent a
visual observation of the ambient weather at the time of sample collection. Valid codes
are:
0 Autosampler collection, rain sample collection, QC samples (EB, FCEB, and FB)
or no observation is made

DBHYDRO Browser User’s Guide South Florida Water Management District
Page 97
September 2020
1 Clear Skies
2 Slight Overcast
3 Medium Overcast
4 Very Overcast
5 Drizzle (Note: measures must be taken to protect sample from contamination and
must be documented)
6 Rain (Note: measures must be taken to protect sample from contamination and
must be documented)
PROGRAM TYPE
Distinguishes routine monitoring data from experimental data.
NDEC
The number of digits to the right of the decimal place to be displayed in reports. NDEC
is used by sigfig_value.

DBHYDRO Browser User’s Guide South Florida Water Management District
Page 98
September 2020
Appendix B - Unit Conversions
Length
1 meter = 3.281 feet
Area
1 acre = 43,560 square feet
Volume
1 cfs-day = 86,400 cubic feet
1 cubic foot = 7.481 gallons
1 acre-foot = 43,560 cubic feet
1 acre-foot = 325,900 gallons
Temperature [°Fahrenheit] =( [°Celsius] × 9⁄5) + 32
[°Celsius] = ([°Fahrenheit] − 32) × 5⁄9

DBHYDRO Browser User’s Guide South Florida Water Management District
Page 99
September 2020
Appendix C - Unit Abbreviations/Symbols
Symbol Unit of Measurement
mg/L milligrams per liter
ug/L micrograms per liter
ng/L nanograms per liter
g/cc grams per cubic centimeter
uS/cm microsiemens per centimeter
ug/kg micrograms per kilogram
mm millimeters
ft feet
ft NAVD88 feet North American Vertical Datum 1988
ft NGVD29 feet National Geodetic Vertical Datum 1929
cfs cubic feet per second

DBHYDRO Browser User’s Guide South Florida Water Management District
Page 100
September 2020
Appendix D - Acronyms Used in Metadata
The acronyms, or abbreviations, below may appear in database text fields including, but
not limited to, station descriptions, project descriptions, sample comments, and result
comments.
Acronym Description
A/S or AS Autosampler
ACF Autosampler Composite Flow
ACODES Analysis Code
ACS American Chemical Society
ACT Autosampler Composite Time
ADT Autosampler Discrete Time
ASEB Autosampler Equipment Blank
ATF Autosampler Composite Time Flow
AFW Analyte Free Water
BWF/M Bi-Weekly Flow or at Least Monthly Collection
BWRF Bi-Weekly Recorded Flow
CCV Continuing Calibration Verification
CH/DH Clean Hands / Dirty Hands
COC Chain of Custody
COND Specific Conductance
CR10 Campbell Remote Scientific Data Logger
DBHYDRO SFWMD's Water Quality and Hydrological Database
DCS Depth to Consolidated Substrate
DEP Department of Environmental Protection
DI De-Ionized
DO Dissolved Oxygen
DQOs Data Quality Objectives
DS Discharge or flow code
DVS Data Validation Section
EB Equipment Blank
EFA Everglades Forever Act
EMRP Environmental Monitoring Review Process
EMRT Environmental Monitoring Review Team
EVPA Everglades Protection Area
F Filter (preservation code)
FAC Florida Administrative Code
FAV Floating Aquatic Vegetation
FB Field Blank
FCEB Field Cleaned Equipment Blank
FD Field Duplicate
FDEP Florida Department of Environmental Protection
FOC Field Operations Center
FPM Field Project Manager
FSQM Field Sampling Quality Manual
FST First Sample Trigger

DBHYDRO Browser User’s Guide South Florida Water Management District
Page 101
September 2020
Acronym Description
ft feet (measurement)
FTR Field Test Report
GPS Global Positioning System
H2SO4 Sulfuric Acid
HCL Hydrochloric Acid
HFDM Horizon Field Data Manager
HNO3 Nitric Acid
HW Headwater (water level or stage upstream of a structure)
IC Initial Calibration
ICV Initial Calibration Verification
ID Identification
KCl Potassium Chloride
LDO Luminescent Dissolved Oxygen
LIMS Laboratory Information Management System
LST Last Sample Trigger
m meter (measurement)
Maint Maintenance (abbreviation)
MOSCAD RTU Motorola SCADA Remote Terminal Unit
MDL Method Detection Limit
NA Nitric Acid (preservation code)
NIST National Institute of Standards and Technology
NOB No Sample Bottle
PAR Photosynthetically Active Radiation
PSR Pre-login Summary Report
PVC Polyvinyl Chloride
QA Quality Assurance
QC Quality Control
QAO Quality Assurance Officer
RPD Relative Percent Difference
RS Replicate Sample
RSD Relative Standard Deviation
RTU Remote Terminal Unit
SA Sulfuric Acid (preservation code)
SAV Submerged Aquatic Vegetation
SCADA Supervisory Control and Data Acquisition
SDD Secchi Disk Depth
SFWMD South Florida Water Management District
SSID Standard Set Identification Number
SOB Secchi On Bottom
SOP Standard Operating Procedure
SPR Sample Problem Report
SS Split Sample
STA Stormwater Treatment Area
STS Science Technician Supervisor
TD Total Depth

DBHYDRO Browser User’s Guide South Florida Water Management District
Page 102
September 2020
Acronym Description
TOC Technical Oversight Committee
TW Tailwater (water level or stage downstream of a structure)
UD Reference-to-structure designation code
(Upstream/Downstream/Undefined)
USB Universal Serial Bus
USEPA United States Environmental Protection Agency
VOC Volatile Organic Compound
WQB Water Quality Bureau
WCA Water Conservation Area
WQM Water Quality Monitoring