Embed Size (px)
Citation preview
DCM demo
André Bastos and Martin Dietz
Wellcome Trust Centre for Neuroimaging
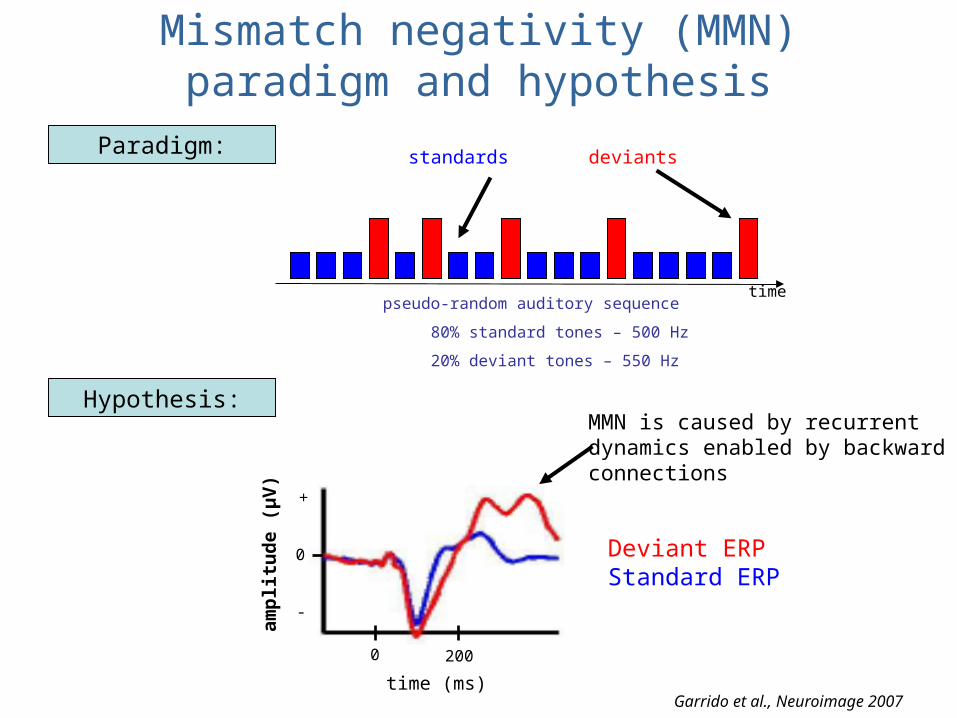
pseudo-random auditory sequence
80% standard tones – 500 Hz
20% deviant tones – 550 Hz
time
standards deviants
Mismatch negativity (MMN) paradigm and hypothesis
time (ms)
Paradigm:
amp
litu
de
(μV
)
0
200
-
+
0
Deviant ERPStandard ERP
Hypothesis:MMN is caused by recurrent dynamics enabled by backward connections
Garrido et al., Neuroimage 2007
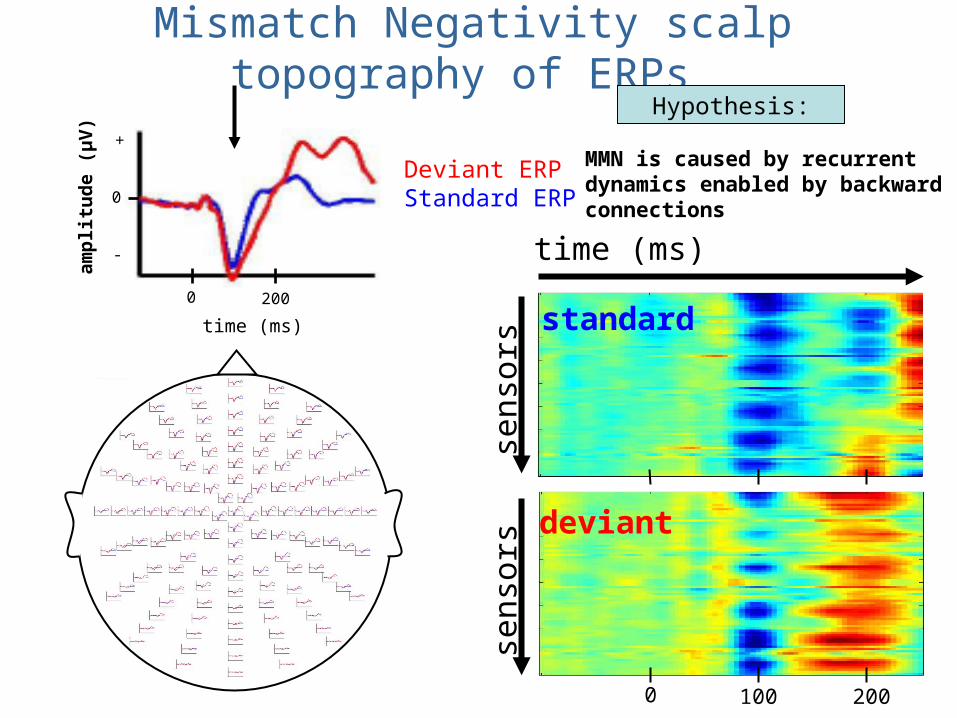
Mismatch Negativity scalp topography of ERPs
time (ms)
sens
ors
sens
ors
standard
deviant
Deviant ERPStandard ERP
time (ms)
amp
litu
de
(μV
)
0
200
-
+
0
Hypothesis:
MMN is caused by recurrent dynamics enabled by backward connections
100 2000
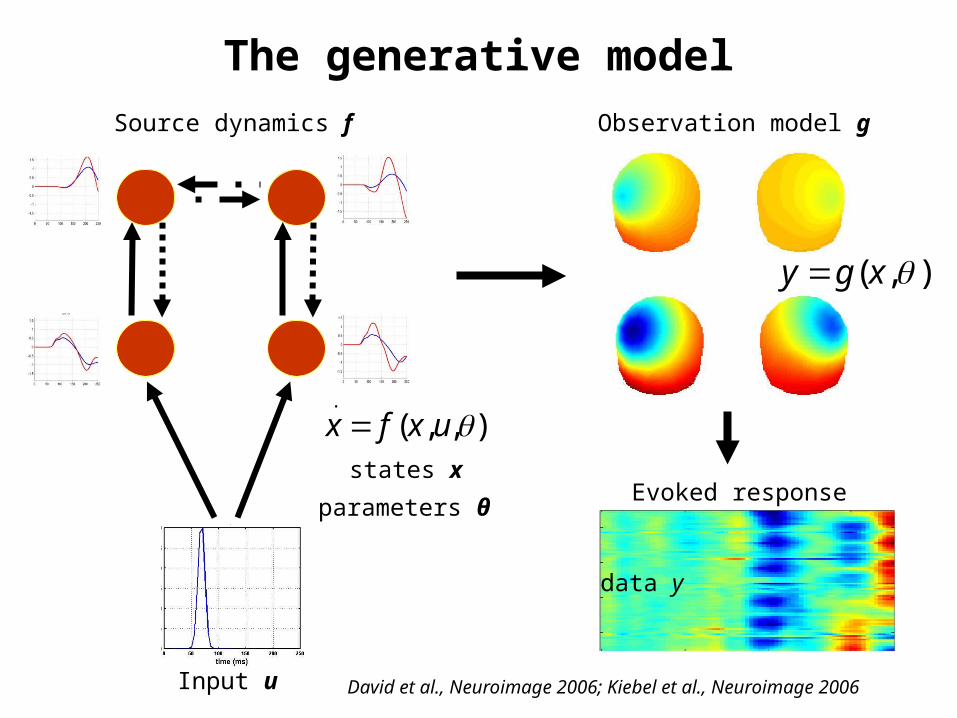
The generative model
Source dynamics f
states x
parameters θ
Input u
Evoked response
data y
),( xgy
Observation model g
x.
f (x,u,)
David et al., Neuroimage 2006; Kiebel et al., Neuroimage 2006
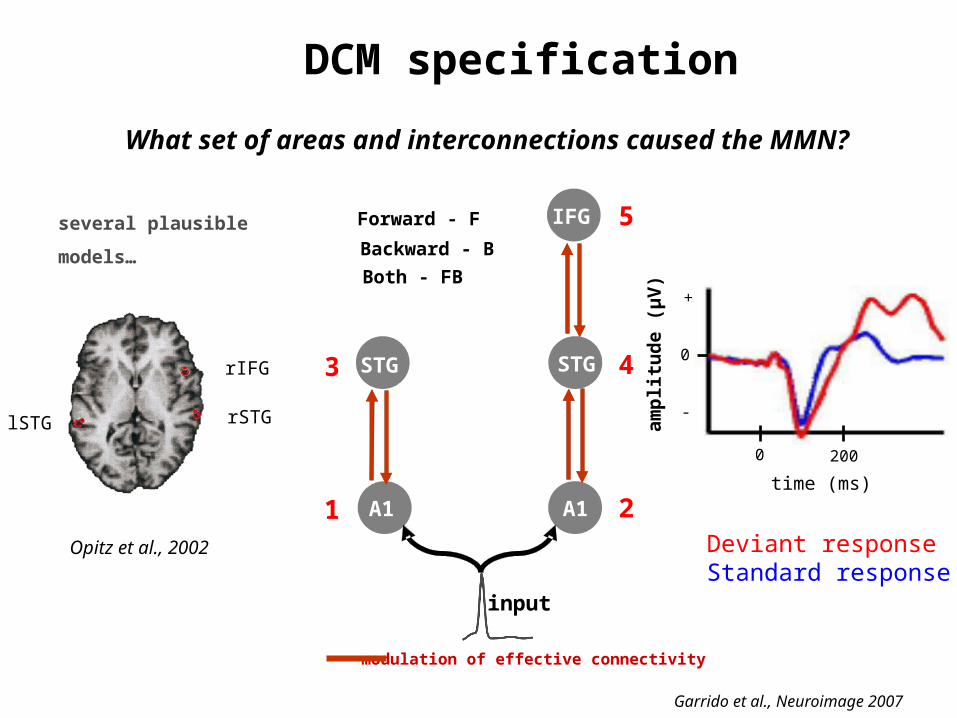
DCM specification
A1 A1
STG
input
STG
IFGseveral plausible models…
modulation of effective connectivity
Forward - F
Backward - B
Both - FB
1 2
3 4
5
Garrido et al., Neuroimage 2007
Opitz et al., 2002
lSTG rSTG
rIFG
Deviant responseStandard response
time (ms)
amp
litu
de
(μV
)
0
200
-
+
0
What set of areas and interconnections caused the MMN?
A1 A1
STG STG
ForwardBackward
Lateral
STG
input
A1 A1
STG STG
ForwardBackward
Lateral
input
A1 A1
STG
ForwardBackward
Lateral
input
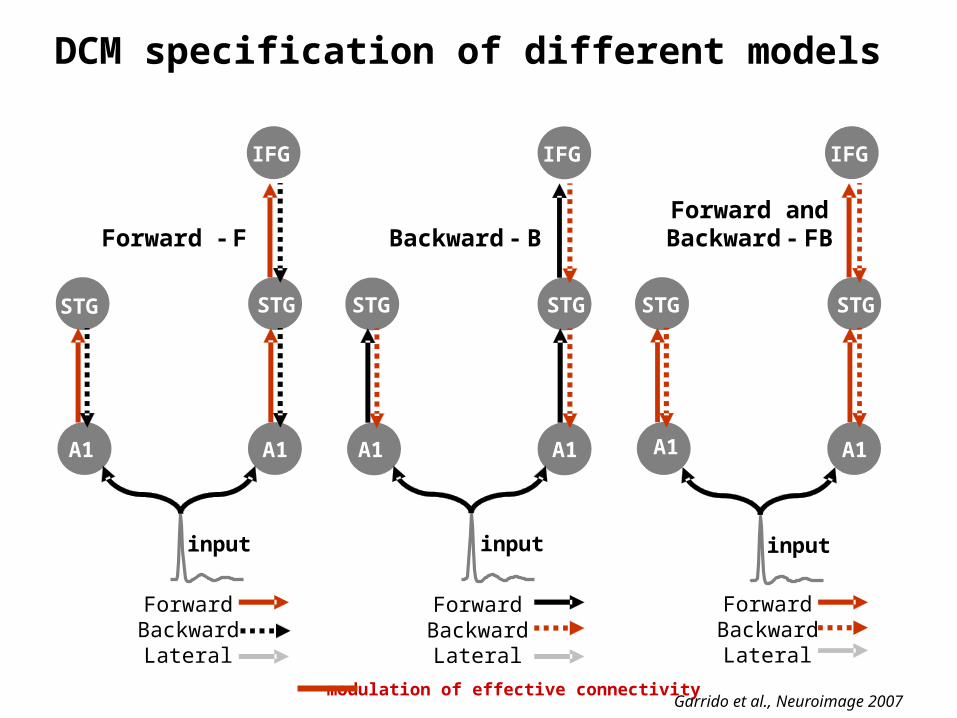
Forward - F Backward - BForward and
Backward - FB
STG
IFGIFGIFG
DCM specification of different models
modulation of effective connectivityGarrido et al., Neuroimage 2007
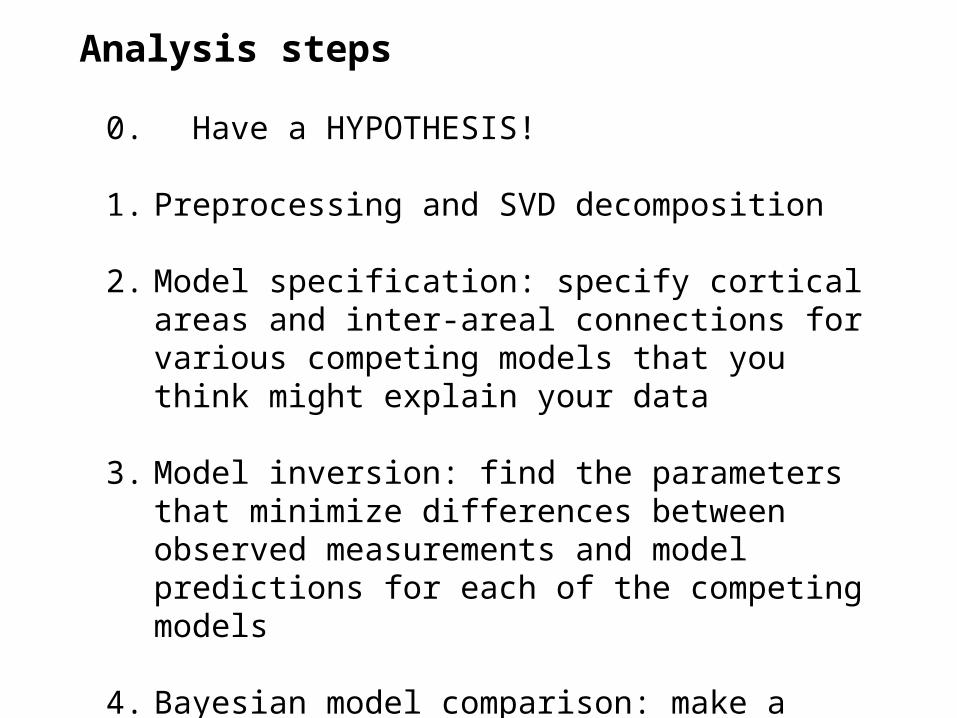
Analysis steps
0. Have a HYPOTHESIS!
1. Preprocessing and SVD decomposition
2. Model specification: specify cortical areas and inter-areal connections for various competing models that you think might explain your data
3. Model inversion: find the parameters that minimize differences between observed measurements and model predictions for each of the competing models
4. Bayesian model comparison: make a statistical inferences about which model best describes the data