Embed Size (px)
Citation preview

DDS VENDOR RATE STUDY
AND RATE MODELS
– submitted to –
California Department of Developmental Services
– prepared by –
BURNS & ASSOCIATES, INC. 3030 North Third Street, Suite 200
Phoenix, AZ 85012
(602) 241-8520
www.burnshealthpolicy.com
March 15, 2019

DDS Vendor Rate Study
Page i
BURNS & ASSOCIATES, INC.
Health Policy Consultants March 15, 2019
EXECUTIVE SUMMARY
The Department of Developmental Services is submitting the rate study completed by Burns &
Associates, Inc. in accordance with the requirements of ABX2-1 (Chapter 3, Statutes of 2016,
Second Extraordinary Session). The rate study reflects nearly two years of work and information
and input from thousands of service providers, consumers and families, and stakeholders across
the State.
ABX2-1 requires DDS to submit a rate study to the appropriate fiscal and policy committees of
the Legislature by March 1, 2019, addressing the sustainability, quality, and transparency of
community-based services for individuals with developmental disabilities. Additionally, it
requires DDS to consult with stakeholders through the Developmental Services Task Force in
developing the study, and requires the study include:
1. An assessment of the effectiveness of the methods used to pay each category of
community service provider,
2. Whether the current rate methods provide an adequate supply of providers to allow
consumer choice,
3. Comparisons of the estimated fiscal effects of alternative rate methodologies,
4. How different rate methodologies incentivize outcomes for consumers, and
5. An evaluation of the number and type of service codes for regional center services.
This report is accompanied by rate models and payment methodologies for home and
community-based services that account for more than 90 percent of total spending on services
delivered through the State’s 21 nonprofit Regional Centers. The models aim to standardize rate
methodologies, account for the costs of providing services consistent with State and federal
requirements, improve insight into service utilization, and promote a stable and high-quality
supply of providers.
The rate study report is divided into four parts:
Part 1 outlines the various methodologies for establishing rates for home and community-
based services and summarizes current rates and methodologies in California.
Part 2 provides an overview of the rate study, including the multiple strategies employed
to involve stakeholders, principles adopted to guide the study, and data sources used to
inform the rate models.
Part 3 covers the major components of the rate models, including direct care worker
wages, benefits and productivity, indirect costs such as program operations and provider
administrative costs, and adjustments to account for regional cost differences.
Part 4 summarizes the rate study results and the rate models.

DDS Vendor Rate Study
Page ii
BURNS & ASSOCIATES, INC.
Health Policy Consultants March 15, 2019
More than 330,000 children and adults with developmental disabilities, developmental delays, or
established risk conditions receive services funded by DDS through the Regional Centers and
delivered by a network of thousands of nonprofit and for-profit service providers. The methods
for establishing payment rates for these providers vary by service, including rates established in
statute or regulation, set by DDS, tied to Medi-Cal or Department of Social Services rates,
negotiated with providers, or billed based on the usual and customary rates the provider charges
to the general public. In response to statewide funding limitations between 2003 and 2015,
payment rates were subject to various reductions, freezes, and other constraints.
In 2016, ABX2-1 was passed during the Second Extraordinary Session of the Legislature and
provided immediate rate increases to service providers. Specifically, the legislation appropriated
$244.9 million in General Fund for rate increases; including federal funds, rates were increased
by more than $400 million in total. To further examine the long-term sustainability, quality, and
transparency of services, ABX2-1 required DDS to conduct a rate study that considered the
sustainability, quality, and transparency of services and the effectiveness of payment
methodologies in supporting an adequate supply of providers and incentivizing outcomes for
consumers.
DDS released a request for proposals to obtain assistance in the facilitation of the rate study and
the development of rate models. Through a competitive procurement process, DDS awarded a
contract to B&A in June 2017. B&A is a national health policy consulting firm that has
conducted similar rate studies in ten other states.
Drawing on this experience, B&A employs an ‘independent rate model’ approach to develop
HCBS rates. In this approach, rate models are constructed to reflect the reasonable costs
providers incur in the delivery of services. These rate models have been constructed in
accordance with DDS’ policies and requirements.
The development of the rate models therefore began with a detailed review of service
requirements. With B&A’s assistance, DDS undertook a comprehensive review of service
definitions. This process also included a review of California-specific laws – such as labor-
related requirements – that impact providers’ costs. From this review, DDS is compiling a list of
potential statutory and regulatory changes that would be needed should the rate models be
implemented.
The rate models are built on detailed assumptions regarding a number of factors, including the
wages, benefits, and productivity of the direct care worker; the agency’s program operation and
administrative costs; staffing ratios and staffing levels, attendance/absence factors, travel-related
expenses, facility costs, and program supplies.
The rate models are labeled independent because cost assumptions are not dependent on any
single source of information. In particular, providers’ current cost data is an important

DDS Vendor Rate Study
Page iii
BURNS & ASSOCIATES, INC.
Health Policy Consultants March 15, 2019
consideration in the development of rate model assumptions, but it is not the only consideration.
This is because provider costs are related to the rates they are paid, particularly in HCBS systems
wherein there are few, if any, other payers. Thus, independent data sources are used to determine
reasonable costs. Examples include wage data from the Bureau of Labor Statistics and wage
growth data from the Bureau of Economic Analysis, the Internal Revenue Service’s mileage rate,
real estate cost data published by commercial real estate brokers, and the Workers’
Compensation Insurance Rating Bureau’s (WCIRB) workers’ compensation rates.
Additionally, the rate study was informed by significant input from stakeholders, including:
A series of six meetings with the Developmental Services Task Force’s Rates Workgroup
Meetings with the Association of Regional Center Agencies, the California Person-
Centered Advocacy Partnership, the California Disability Services Association, the
Service Employees International Union, and other groups
A provider cost survey completed by more than 1,100 organizations, accounting for 52
percent of total spending on in-scope services
Approximately ten provider site visits during which B&A observed service delivery
firsthand and had in-depth discussions regarding program operations and costs
An individual and family survey completed by more than 1,700 respondents to gather
information regarding what is important to service users as well as their current
satisfaction with services
A public comment process that is currently underway to collect feedback on the models
Key features of the rate models resulting from the rate study include:
A standardized approach to rate-setting such that providers delivering the same service in
the same area receive the same payment
Simplification of service codes by consolidating a number of existing codes based on the
assumption that a support should be associated with the same service code regardless of
where that support is provided
Further alignment of payment rates with Medi-Cal rates for certain medical and clinical
practitioners
The use of market-based cost data to reflect providers’ costs to promote a stable and
high-quality supply of providers
A detailed and transparent accounting of these costs should changes be considered over
time
Recognition of differences in wage, travel, and real estate costs across the State by
developing separate rate models for each Regional Center

DDS Vendor Rate Study
Page iv
BURNS & ASSOCIATES, INC.
Health Policy Consultants March 15, 2019
Supporting high-quality services through investments in direct care workers by building
into the rate models market-based wages that consider the State’s increasing minimum
wage, a comprehensive benefits package, enhanced training, supervision, and other
program operations.
The development of enhanced rates for services delivered to individuals who do not
speak English when delivered by staff who speak their language, including American
Sign Language
The rate study estimates the cost of fully implementing the rate models would be
approximately $1.8 billion total funds on an annualized basis. An estimated 60 percent, or
$1.1 billion, of these costs would be General Fund. Although rates would increase overall,
the rate models for some services and for some providers are less than current rates.
In addition to the cost of implementing the rates, a substantial effort would be required
amongst DDS, Regional Centers, and providers to create and amend statutes, regulations, and
policies; develop reporting requirements to track the impact of any increases in payment
rates; change billing systems; and establish new authorizations and vendorizations.
To support the deliberative process, this report, which summarizes the rate study process
conducted in accordance with the requirements of ABX2-1 as well as the underlying rate and
policy change assumptions, is accompanied by supporting documentation including the rate
models, a supplemental report on regional cost variation, provider survey materials, and
individual and family survey materials.

DDS Vendor Rate Study
Page v
BURNS & ASSOCIATES, INC.
Health Policy Consultants March 15, 2019
TABLE OF CONTENTS
EXECUTIVE SUMMARY .................................................................................................................... i
REPORT ATTACHMENTS.............................................................................................................. viii
LIST OF FIGURES ........................................................................................................................... ix
LIST OF ACRONYMS AND ABBREVIATIONS .................................................................................... x
INTRODUCTION ............................................................................................................................... 1
PART 1: BACKGROUND ON DDS VENDOR RATE STUDY AND HCBS RATE-SETTING ................. 3
Section 1.1: Current DDS Payment Rates Environment ...................................................... 3
Section 1.2: Requirement for Vendor Rate Study ................................................................. 6
Section 1.3: Overview of HCBS Rate-Setting Methodologies ............................................... 9
PART 2: OVERVIEW OF THE RATE STUDY AND DATA COLLECTION .......................................... 16
Section 2.1: Rate Study Principles and Goals ...................................................................... 16
Stakeholder Involvement ....................................................................................................... 16
Furthering Programmatic Goals .......................................................................................... 17
Standardizing Operations ..................................................................................................... 18
Section 2.2: ‘Independent’ Rate Models ............................................................................... 19
Section 2.3: Sources of Data ................................................................................................... 21
Review of Service Requirements ........................................................................................... 21
Service Utilization Analysis .................................................................................................. 22
Provider Surveys ................................................................................................................... 25
Individual and Family Survey ............................................................................................... 26
Independent Data Sources .................................................................................................... 27
PART 3: RATE MODEL DEVELOPMENT ....................................................................................... 28
Section 3.1: Key Cost Factors in Base Rate Models ............................................................ 28
Direct Care Worker Wages ................................................................................................... 29
Direct Care Worker Benefits ................................................................................................ 35
Direct Care Worker Productivity .......................................................................................... 39
Program Operations Expenses ............................................................................................. 41
Administrative Expenses ....................................................................................................... 43
Section 3.2: Accounting for Regional Differences ................................................................ 44
Direct Care Worker Wages ................................................................................................... 45
Travel Distance and Time ..................................................................................................... 49
Real Estate ............................................................................................................................ 52

DDS Vendor Rate Study
Page vi
BURNS & ASSOCIATES, INC.
Health Policy Consultants March 15, 2019
PART 4: RATE MODELS AND RELATED POLICY ASSUMPTIONS ................................................. 54
Section 4.1: System-Wide Elements of the Rate Models ..................................................... 54
Supply of Providers ............................................................................................................... 54
Standardization and Simplification....................................................................................... 55
Quality and Outcomes........................................................................................................... 58
Section 4.2: Rate Models and Associated Policy Changes .................................................. 59
Personal Assistance .............................................................................................................. 60
Parent-Coordinated Personal Assistance ............................................................................. 60
Independent Living Services ................................................................................................. 61
Independent Living Specialist ............................................................................................... 61
Supported Living Services..................................................................................................... 62
Parent-Coordinated Supported Living ................................................................................. 63
Parenting Support Services................................................................................................... 63
Tutor Services ....................................................................................................................... 64
Respite, Agency ..................................................................................................................... 64
Participant-Directed Respite ................................................................................................ 65
Housekeeping ........................................................................................................................ 66
Program Support Group-Other Services .............................................................................. 66
Community Care Facility-Staff Operated ............................................................................. 67
Adult Residential Facility, Persons with Special Health Care Needs (ARFPSHN) ............. 69
Community Care Facility-Owner Operated ......................................................................... 70
Supported Living-Community ............................................................................................... 72
Family Home Agency ............................................................................................................ 73
Enhanced Behavioral Supports Homes (EBSH) ................................................................... 74
Community Crisis Homes (CCH).......................................................................................... 75
Supplemental Program Support-Residential Services .......................................................... 76
Community-Based Day Program .......................................................................................... 77
Participant-Directed Day Program ...................................................................................... 78
In-Home Day Program ......................................................................................................... 78
Supported Employment-Individual ....................................................................................... 79
Supported Employment-Group ............................................................................................. 80
Work Activity Program ......................................................................................................... 80
Transportation ...................................................................................................................... 81
Transportation Coordination ................................................................................................ 81

DDS Vendor Rate Study
Page vii
BURNS & ASSOCIATES, INC.
Health Policy Consultants March 15, 2019
Transportation Assistant ....................................................................................................... 82
Supplemental Program Support-Day Services ..................................................................... 82
Behavior Analyst ................................................................................................................... 83
Associate Behavior Analyst................................................................................................... 83
Behavior Management Assistant........................................................................................... 84
Behavior Technician-Paraprofessional ................................................................................ 84
Behavior Management Consultant ....................................................................................... 85
Infant Development Program ............................................................................................... 85
Crisis Evaluation and Behavior Intervention ....................................................................... 86
Section 4.3: Fiscal Impact Analysis ....................................................................................... 86
CONCLUSION ................................................................................................................................ 89

DDS Vendor Rate Study
Page viii
BURNS & ASSOCIATES, INC.
Health Policy Consultants March 15, 2019
REPORT ATTACHMENTS
Attachment 1 – Rate Model Packet
Attachment 2 – Regional Adjustment Factor Methodology
Attachment 3 – Provider Survey:
3.1: Provider Survey Instrument
3.2: Provider Survey Instructions
3.3: Provider Survey (Specialized Therapeutic Services)
3.4: Provider Survey Instructions (Specialized Therapeutic Services)
3.5: Survey Analysis Presentation to Rates Workgroup
3.6: Survey Analysis Packet
Attachment 4 – Individual and Family Survey:
4.1: Individual and Family Survey Instrument
4.2: HSRI Presentation of Results to the Individual and Family Advisory Group
Attachment 5 – Fiscal Impact Analysis
Attachment 6 – Presentation of the Results and Draft Rate Models to DS Rates Workgroup

DDS Vendor Rate Study
Page ix
BURNS & ASSOCIATES, INC.
Health Policy Consultants March 15, 2019
LIST OF FIGURES
Part 1
Figure 1-1: Changes to DDS Service Rates, Fiscal Years 2003-04 Through 2014-15
Figure 1-2: List of Service Codes Included in Vendor Rate Study
Figure 1-3: Potential Risks Associated with HCBS Rate-Setting Methodologies (from CMS)
Figure 1-4: Potential Advantages of HCBS Rate-Setting Methodologies (from CMS)
Figure 1-5: Potential Disadvantages of HCBS Rate-Setting Methodologies (from CMS)
Figure 1-6: Comparison of Select HCBS Payment Rates in California and Four Other
Western States
Part 2
Figure 2-1 Rate Model Example (Independent Living)
Figure 2-2: Summary of Spending Levels, Consumer Counts and Regional Center Counts for
Services Included in the Rate Study, Fiscal Year 2016-17
Figure 2-3: Summary of Unit Types, Payments, and Range of Rates by Unit Type for Service
Code 091 – In Home/ Mobile Day Program, Fiscal Year 2016-17
Part 3
Figure 3-1: Assumptions to Account for Minimum Wage Rising from $10.00 per Hour to
$13.00
Figure 3-2: Impact of Inflationary and Minimum Wage Adjustments, by Wage
Figure 3-3: Base Rate Model Wage Assumption for DSPs
Figure 3-4: Rate Model Assumptions for Health Insurance for Direct Care Workers
Compared to Other Data Sources
Figure 3-5: Rate Model Assumptions for Paid Time Off Compared to Data from the Bureau
of Labor Statistics and the DDS Provider Survey
Figure 3-6: Benefit Rate Assumed in Rate Models, by Wage Level (excludes workers'
compensation and paid time off)
Figure 3-7: Composition of Expenses, Current Rates and Recommended Rates
Figure 3-8: Example of Combining Two Areas into a Single Regional Center
Figure 3-9: Illustration of Impact of Job Mix on Average Wage
Figure 3-10: Assignment of Wage Adjustment Factors by Regional Center
Figure 3-11: Assignment of Travel Adjustment Factors by Regional Center
Figure 3-12: Assignment of Real Estate Adjustment Factors by Regional Center

DDS Vendor Rate Study
Page x
BURNS & ASSOCIATES, INC.
Health Policy Consultants March 15, 2019
LIST OF ACRONYMS AND ABBREVIATIONS
ABX2-1 Legislation authorizing the DDS Vendor Rate Study
ARM Alternative residential model
B&A Burns & Associates, Inc.
BEA United States Bureau of Economic Analysis
BLS United Stated Bureau of Labor Statistics
CMS Centers for Medicare and Medicaid Services
DDS Department of Developmental Services
DHCS Department of Health Care Services
DS Task Force Developmental Services Task Force
DSP Direct service professional
DSS Department of Social Services
HCBS Home and community-based services
HSRI Human Services Research Institute
I/DD Intellectual and developmental disabilities
IPP Individualized program plan
MSA Metropolitan statistical area
RFP Request for proposals
WCIRB Workers' Compensation Insurance Rating Bureau
WIC Welfare and Institutions Code

DDS Vendor Rate Study
Page 1
BURNS & ASSOCIATES, INC.
Health Policy Consultants March 15, 2019
INTRODUCTION
Pursuant to Section 4519.8 of the Welfare and Institutions Code as added by ABX2-1 during the
Second Extraordinary Session of the 2015-16 Legislature, Burns & Associates, Inc. has prepared
this report to summarize the results of the Department of Developmental Services vendor rate
study and the resultant rate models.
This report is the culmination of nearly two years of work that has included the review of
applicable statutes and regulations, analysis of current payment rates and service use patterns,
and identification of benchmark data sources to inform the development of the rate models. B&A
would like to acknowledge and express its appreciation for the thousands of service providers,
individuals and families, and stakeholders across the State who provide information and input,
including:
The members of the Developmental Services Task Force’s Rates Workgroup who offered
counsel at key points during the project,
The more than 1,100 agencies that completed and submitted the provider survey,
The more than 1,700 consumers and families that participated in the individual and
family survey,
The providers that hosted B&A staff and allowed them to observe their operations,
The organizations that provided B&A a forum to explain the rate study to their members,
and
The DDS staff who contributed thousands of hours to guide the project.
The rate study report is divided into four parts:
Part 1 outlines the various methodologies for establishing rates for home and community-
based services and summarizes current rates and methodologies in California.
Part 2 provides an overview of the rate study, including the multiple strategies employed
to involve stakeholders, principles adopted to guide the study, and data sources used to
inform the rate models.
Part 3 covers the major components of the rate models, including direct care worker
wages, benefits and productivity, indirect costs such as program operations and provider
administrative costs, and adjustments to account for regional cost differences.
Part 4 summarizes the rate study results and the rate models.
The rate study was conducted in accordance with the requirements included in ABX2-1 as
summarized below.

DDS Vendor Rate Study
Page 2
BURNS & ASSOCIATES, INC.
Health Policy Consultants March 15, 2019
Both the rate study and the rate models address the transparency of services and rates. The rate
study began with an in-depth review of service requirements as described in Section 2.3. When
service requirements are overly broad or ambiguous, the rate study assumes that detailed
guidance will be developed so that there is a shared and clear understanding of ‘what’ each
service is. Further, the rates themselves were developed in a transparent fashion, based on
models that detail the factors, values, and data sources included in each rate. Key rate model
assumptions and data sources are summarized in Part 3.
Relatedly, the rate study also evaluated the number and type of service codes, noting instances of
potential duplication and inconsistent usage across Regional Centers. Assumptions regarding the
consolidation of a number of service codes are described in Section 4.1.
The development of independent rate models that rely on data both from provider agencies and
from other market sources is intended to produce rates that are aligned with providers’ costs,
thereby supporting a sufficient supply of providers and the sustainability of community-based
services. In order to enhance the supply of providers across the State and across demographic
groups, the rate models also include ‘regional adjustment factors’ to account for cost differences
in various parts of the State and ‘non-English stipends’ to serve non-English speakers in their
language. Section 1.3 discusses the supply of providers generally while Section 4.1 includes
discussion of the specific elements of the rate models related to the supply of providers.
The rate study includes consideration of the quality of services and consumer outcomes. As
discussed in Section 1.3, linking rates to quality and outcomes is a challenge in the HCBS
environment because of substantial differences in the needs of individuals as well as difficulties
in defining and measuring quality and outcomes. The rate study and rate models therefore take
an indirect approach to quality and outcomes as described in Section 4.1. Recognizing the pivotal
role played by direct care workers in quality services and achieving outcomes, the rate models
include market-based wages, a comprehensive benefits package, and more training for these
staff. Additionally, the rate models assume increased funding amounts for program operations
expenses such as supervision, quality assurance, training, and curriculum development.
B&A and DDS consulted with stakeholders through the Developmental Services Task Force
several times during the rate study. Additionally and as described above, DDS and B&A sought
to involve stakeholders in a far broader manner than required by the legislation, including
surveys of providers as well as consumers and families, provider site visits, and a public
comment process. Stakeholder involvement is described in detail in Section 2.1.
The estimated cost of implementing the rate models is described in Section 4.3.

DDS Vendor Rate Study
Page 3
BURNS & ASSOCIATES, INC.
Health Policy Consultants March 15, 2019
PART 1: BACKGROUND ON DDS VENDOR RATE STUDY AND
HCBS RATE-SETTING
The California Department of Developmental Services provides a variety of services to more
than 330,000 children and adults with developmental disabilities, developmental delays, or
established risk conditions.1 Home and community-based services are primarily delivered
through 21 nonprofit Regional Centers that, in turn, contract with several thousand nonprofit and
for-profit service providers.
The State’s system for establishing payment rates for the services delivered by these providers is
complex, encompassing several different methodologies depending on the service provided.
Rates are often inconsistent, with providers delivering the same service in the same area being
paid different rates. Further, between 2003 and 2015, these payment rates were subject to various
reductions, freezes, and other constraints, particularly during economic downturns.
In response to concerns
regarding rates raised by
Regional Centers, providers,
and other stakeholders, the
Legislature mandated that
DDS conduct a study of
payment rates. The rate
study began with an
inventory of the various
approaches to rate-setting
for HCBS as well as the
methodologies currently employed in California.
Section 1.1: Current DDS Payment Rates Environment
A primer prepared by DDS for the Developmental Services Task Force as part of its study of
payment rates offers an overview of current rates for Regional Center services.3 The primer
1 California Department of Developmental Services. (February 11, 2019). Monthly Consumer Caseload Report
(through January 2019). Retrieved from https://www.dds.ca.gov/FactsStats/docs/January2019Caseload.pdf.
2 Centers for Medicare & Medicaid Services. (February 2016). Rate Methodology in a FFS HCBS Structure.
Retrieved from https://www.medicaid.gov/medicaid/hcbs/downloads/rate-setting-methodology.pdf.
3 California Department of Developmental Services – Developmental Services Task Force. (n.d.). Regional Center
Services Rates Overview. Retrieved from https://www.dds.ca.gov/DSTaskForce/docs/DSTF-
R_2_RevisedRateProcessOverview.pdf. The DS Task Force was originally established in 2013 to address the
service needs developmental residents. Its charge was later expanded to include a review of rate methodologies and
other issues related to the developmental services system.
“Ensuring accurate and adequate reimbursement
to providers of waiver services facilitates the right
services being available to individuals receiving
community-based long-term services and
supports.”
- U.S. Centers for Medicare and Medicaid Services2

DDS Vendor Rate Study
Page 4
BURNS & ASSOCIATES, INC.
Health Policy Consultants March 15, 2019
summarizes the variety of rate-setting methodologies employed by DDS and the Regional
Centers, including rates that are:
Set by DDS based on provider cost statements, fee schedules, regulation, or statute.
Service rates covered by this methodology include community-based day programs,
community care facilities (set by the Alternative Residential Model, ARM), in-home
respite, supported employment, work activity programs, and infant development
programs.
Based on a schedule of maximum allowances through which the rate paid by a Regional
Center is equivalent to the rate established by the Department of Health Care Services for
the same service. This methodology primarily applies to medical service providers, such
as nurses, home health aides, and therapists.
Established as usual and customary rates that allow providers to charge the same rate that
they charge to the general public if at least 30 percent of the provider’s customers are not
Regional Center consumers. Examples of services with usual and customary rates include
day care, diaper services, and public transportation providers.
Set by the Department of Social Services. This methodology applies to out-of-home
respite services in facilities with rates established by DSS.
Negotiated between the Regional Center and the provider. For new providers, the upper
limit of negotiated rates for each service is the lesser of the Regional Center’s current
median rate or the current statewide median rate. Examples of services subject to
negotiated rates include supported living, specialized residential facilities, and behavior
analysts.
Fixed at the Regional Center’s mileage rate for its employees. This methodology applies
to transportation provided by a family member.
For some services, multiple methodologies may be applicable. In these instances, the rate is
based on the provider’s already established rate (that is, based on the schedule of maximum
allowance or a usual and customary rate) or the rate established by DDS. Otherwise, the rate is
negotiated between the provider and the Regional Center up to the applicable median.
A companion document to the rates overview primer prepared for the DS Task Force notes that
rate adjustments were infrequent and modest between July 2003 and June 2015, as illustrated in
Figure 1-1.4
4 California Department of Developmental Services – Developmental Services Task Force. (n.d.). Rate Actions
History July 2003 through June 2015. Retrieved from https://www.dds.ca.gov/DSTaskForce/docs/DSTF-
R_3_RateActionsHistory2003to2015.pdf.

DDS Vendor Rate Study
Page 5
BURNS & ASSOCIATES, INC.
Health Policy Consultants March 15, 2019
Figure 1-1: Changes to DDS Service Rates, Fiscal Years 2003-04 Through 2014-15
Fiscal Year Adjustment
FY2003-04 Rate freezes for a number of services, including community-based day
programs, in-home respite agencies, supported living, and transportation
FY2004-05 Rates for work activity programs were frozen
FY2006-07
Rate increases to account for rising statewide minimum wage
3 percent increase for a number of services with rates set by DDS or through
negotiation with the Regional Centers
Targeted 3.86 percent wage enhancement for certain services provided in
integrated settings
24 percent increase for supported employment
FY2007-08 Rate increases to account for rising statewide minimum wage
FY2008-09
Rate freeze for all services with negotiated rates
Implementation of statewide median rates that set a limit on negotiated rates
for new providers
10 percent reduction for supported employment
FY2009-10 3 percent reduction for all services except for supported employment and
usual and customary rates
FY2010-11 1.25 percent reduction for all services except for supported employment and
usual and customary rates
FY2011-12 Institution of updated statewide median rates
FY2012-13 Restoration of 3 percent reduction
FY2013-14 Restoration of 1.25 percent reduction
FY2014-15
Rate increases to account for rising statewide minimum wage
5.82 percent increase for in-home respite, supported living, and personal
assistance due to change in federal overtime rules
In the midst of the rate reductions that occurred during and immediately after the Great
Recession that began in late 2007 and ended in mid-2009, the University of California, Los
Angeles’ Center for Health Policy Research issued a policy note5 that identified a number of
resultant challenges, including:
5 University of California, Los Angeles Center for Policy Research. (March 2011). Policy Note: Challenges to
Sustaining California’s Developmental Disability Services System. Retrieved from

DDS Vendor Rate Study
Page 6
BURNS & ASSOCIATES, INC.
Health Policy Consultants March 15, 2019
A number of providers reporting an operating deficit, threatening their financial viability
Providers forced to offer lower pay to staff than paid by comparable employers, resulting
in a struggle to recruit and retain direct care workers
A potential inability for the system to meet the needs of service recipients
In the years after that report, rates were increased several times, first to restore a portion of the
previous reductions and then to fund changes to the State’s minimum wage and federal overtime
requirements. Despite these increases, a number of stakeholders continued to express concerns
regarding both rate methodologies and the actual rates.
Section 1.2: Requirement for Vendor Rate Study
In June 2015, Governor Edmund G. Brown, Jr. issued a proclamation calling for, amongst other
provisions, “Sufficient funding to provide additional rates increases for providers of Medi-Cal
and developmental disability services.”6 Ultimately, the California Legislature passed ABX2-1
during the Second Extraordinary Session of the 2015-16 legislature.7 This legislation
appropriated $244.9 million in General Fund for DDS vendor rate increases. Including federal
funds, rates were increased by more than $400 million in total. The legislation targeted these
increases to a number of areas, including direct care workers, agency administrative expenses,
and targeted increases for supportive and independent living services, respite, supported
employment, and transportation.
In addition to the rate increases, the legislation required that DDS undertake a rate study8:
On or before March 1, 2019, the department shall submit a rate study to the
appropriate fiscal and policy committees of the Legislature addressing the
sustainability, quality, and transparency of community-based services for individuals
with developmental disabilities. The department shall consult with stakeholders,
through the developmental services task force process, in developing the study. The
study shall include, but not be limited to, all of the following:
http://healthpolicy.ucla.edu/publications/Documents/PDF/Challenges%20to%20Sustaining%20California%E2%80
%99s%20Developmental%20Disability%20Services%20System.pdf.
6 State of California Executive Department. (June 16, 2015). A Proclamation by the Governor of the State of
California. Retrieved from https://www.ca.gov/archive/gov39/wp-
content/uploads/2017/09/6.16.15_Health_Care_Special_Session.pdf.
7 2015-2016 2nd Ex. Sess., Ch. 3, Cal. Stat. 2016.
8 Codified at WIC § 4519.8.

DDS Vendor Rate Study
Page 7
BURNS & ASSOCIATES, INC.
Health Policy Consultants March 15, 2019
(a) An assessment of the effectiveness of the methods used to pay each category
of community service provider. This assessment shall include consideration of
the following factors for each category of service provider:
(1) Whether the current method of ratesetting for a service category provides
an adequate supply of providers in that category, including, but not limited
to, whether there is a sufficient supply of providers to enable consumers
throughout the state to have a choice of providers, depending upon the
nature of the service.
(2) A comparison of the estimated fiscal effects of alternative rate
methodologies for each service provider category.
(3) How different rate methodologies can incentivize outcomes for consumers.
(b) An evaluation of the number and type of service codes for regional center
services, including, but not limited to, recommendations for simplifying and
making service codes more reflective of the level and types of services
provided.
DDS released a request for proposals in February 2017 for a contractor to assist in the facilitation
of the rate study.9 Through this competitive procurement process, DDS awarded a contract to
Burns & Associates, Inc. in June 2017.
B&A is a national health policy consulting firm that consults primarily to State Medicaid and
related public health agencies. One of the firm’s primary focuses is the intellectual and
developmental disabilities field, with particular emphases in the areas of rate-setting, the use of
assessments to inform individualized budgets, and program operations, including policy
development, fiscal analysis, and billing rules. Over the past ten years, B&A has conducted or is
in the process of conducting similar comprehensive rate studies for HCBS for individuals with
I/DD in ten other states: Arizona, Georgia, Hawaii, Maine, Mississippi, New Mexico, Oregon,
Rhode Island, Vermont, and Virginia.
B&A’s project team included two subcontractors:
The Human Services Research Institute is a nonprofit organization working in the I/DD
field since 1976, with areas of emphases including quality improvement, systems design
promoting person-centered thinking, self-direction, and community integration.
Additionally, HSRI, in partnership with the National Association of State Directors of
Developmental Disabilities Services, developed the National Core Indicators to measure
quality across 100 consumer, family, systems, cost, and health and safety outcomes.
9 RFP# HD 169057, entitled DDS Vendor Rate Study.

DDS Vendor Rate Study
Page 8
BURNS & ASSOCIATES, INC.
Health Policy Consultants March 15, 2019
Mission Analytics Group is a San Francisco-based firm with focuses on long-term
services and supports; developmental disabilities; children, youth, and families; and
healthcare delivery. Mission has been DDS’ risk management contractor since 2005.
The scope of work outlined in the DDS Vendor Rate Study RFP called for the contractor to
conduct a rate study consistent with the requirements of ABX2-1 and specifically mandated the
development of rate models that:
Detail specific assumptions related to direct care worker wages, benefits, and billable
hours; staffing ratios; member attendance; transportation; agency overhead; and any other
relevant factors,
Rely on data collected through a provider survey and other independent sources, and
Include supporting documentation.
In terms of the services to be considered, DDS generally excluded service codes with rates that
are set by external parties or forces. Services reimbursed according to a schedule of maximum
allowances (that is, set by DHCS), rates set by DSS, or usual and customary rates (that is, set by
the larger marketplace) were not part of the rate study. Thus, of the more than 150 service codes,
only 62 were included in the rate study. However, these 62 service codes, which are listed in
Figure 1-2, accounted for more than 90 percent of HCBS spending in fiscal year 2016-17.
Figure 1-2 (part 1): List of Service Codes Included in Vendor Rate Study
017- Crisis Team-Eval./ Behavior Modification 025- Tutor Services-Group
028- Socialization Training Program 048- Client/Parent Supp. Behavior Intervention
055- Community Integration Training Prog. 062- Personal Assistance
063- Community Activities Support Services 073- Parent Coordinator Supported Living
091- In-Home/Mobile Day Program 093- Parent-Coordinated Personal Assistance
094- Creative Arts Program 103- Specialized Health, Treatment, Training
106- Specialized Recreational Therapy 108- Parenting Support Services
109- Program Support Group-Residential 110- Program Support Group-Day Service
111- Program Support Group-Other Services 113- DSS Licensed-Spec Residential Facility
115- Specialized Therapeutic Services (3-20) 116- Early Start Specialized Therapeutic Svcs.
117- Specialized Therapeutic Services (21+) 420- Voucher Respite
465- Participant-Directed Respite Services 475- Participant-Directed Comm. Training
505- Activity Center 510- Adult Development Center
515- Behavior Management Program 520- Independent Living Program
525- Social Recreation Program 605- Adaptive Skills Trainer
612- Behavior Analyst 613- Associate Behavior Analyst
615- Behavior Management Assistant 616- Behavior Technician-Paraprofessional
620- Behavior Management Consultant 635- Independent Living Specialist
645- Mobility Training Services Agency 650- Mobility Training Services Specialist
680- Tutor 805- Infant Development Program

DDS Vendor Rate Study
Page 9
BURNS & ASSOCIATES, INC.
Health Policy Consultants March 15, 2019
Figure 1-2 (part 2): List of Service Codes Included in Vendor Rate Study
860- Homemaker Services 862- In-Home Respite Services
864- In-Home Respite Worker 875- Transportation Company
880- Transportation-Additional Component 882- Transportation-Assistant
883- Transportation Broker 894- Supported Living Administration
896- Supported Living Services 899- Comm. Crisis Home Transitional Costs
900- Enhanced Behav. Supp. Home Facility 901- Enhanced Behav. Supp. Home Individual
902- Comm. Crisis Home Facility Component 903- Community Crisis Home Individual
904- Family Home Agency 905- Residential Facility Adults, Owner Oper.
910- Residential Facility Child, Owner Oper. 915- Residential Facility Adult, Staff Operated
920- Residential Facility Child, Staff Operated 950- Supported Employment-Group
952- Supported Employment-Individual 954- Rehab Work Activity Program
Section 1.3: Overview of HCBS Rate-Setting Methodologies
The federal Centers for Medicare and Medicaid Services conducted a series of presentations in
2016 and 2017 on setting rates for home- and community-based services that comply with
federal Medicaid requirements.10 In these presentations, CMS identifies and defines five
common rate-setting methods11:
1. Fee schedule. The provider receives a fixed, pre-determined rate for a single service for a
designated unit of time. Rates do not vary by client, acuity, or provider.
2. Negotiated market rate. The provider is paid a rate based upon a negotiation to reach an
agreed-upon market price for a service. This approach typically involves a range of
permissible rates determined by reviewing prices for other providers of similar services.
3. Cost reconciliation. The provider files cost reports created by the state, ultimately to be
reimbursed at the true cost of service. Since these payments are retrospective (that is,
based on costs that are actually incurred), providers are initially paid an interim rate.
Final rates based on the cost reports are ‘reconciled’ against the interim rate with
providers being paid or paying back the difference.
4. Tiered rate. The provider receives payment based on a rate that varies by identified
characteristics of the individual (often based on an assessment), the provider, or some
combination of both.
5. Bundled rate. The provider is paid a rate that encompasses two or more discrete services
with distinct purposes that are not closely related.
10 Centers for Medicare & Medicaid Services. Home & Community Based Services Training Series. Accessed at
https://www.medicaid.gov/medicaid/hcbs/training/index.html.
11 Centers for Medicare & Medicaid Services.(n.d.). Documentation of Rate Setting Methodology. Retrieved from
https://www.medicaid.gov/medicaid/hcbs/downloads/hcbs-1b-transparent-documentation.pdf.

DDS Vendor Rate Study
Page 10
BURNS & ASSOCIATES, INC.
Health Policy Consultants March 15, 2019
In practice, these methodologies may overlap. This is particularly true for tiered rates and
bundled rates. In B&A’s experience, these rates are typically paid according to a fee schedule,
making them a subset of this methodology rather than separate, discrete methods.
CMS also presents a number of risks, advantages, and disadvantages associated with each of
these methodologies, which are reported in Figures 1-3, 1-4, and 1-5.12
Figure 1-3: Potential Risks Associated with HCBS Rate-Setting Methodologies (from
CMS)
Fee Schedule
Undocumented services (e.g., fraud)
Rates are typically based on averages, but actual costs of individual providers can vary
widely depending on size, competitive wage rate, transportation costs, etc.
Perceived low rates might lead to access issues and shallow provider networks
Negotiated Market Rate
Improper training of negotiators (both providers and State officials) can lead to improper
rate agreements
Product/ services purchased through negotiated prices could greatly exceed average prices
of such goods
Lack of accountability in oversight, rate determinations, and billing processes
Cost Reconciliation
Lengthy and cumbersome process of creating cost reports for providers
Incorrect or inaccurate cost reports used
Lag in reimbursement due to drawn out reconciliation process
Higher or lower-than-expected outlays realized during reconciliation
Tiered Rate
Unreliability of assessment tools can undermine credibility of assessment results
o Selecting a tool that does not align with state needs can lead to this problem
o Results can also be skewed by not sufficiently addressing the needs of outliers
Bundled Rate
Low levels of provider participation due to complex and lengthy applications and/or low
rates
State needs to be able to document that services were actually provided
12 Centers for Medicare & Medicaid Services. (February 2016). Rate Methodology in a FFS HCBS Structure.
Retrieved from https://www.medicaid.gov/medicaid/hcbs/downloads/rate-setting-methodology.pdf.

DDS Vendor Rate Study
Page 11
BURNS & ASSOCIATES, INC.
Health Policy Consultants March 15, 2019
Figure 1-4: Potential Advantages of HCBS Rate-Setting Methodologies (from CMS)
Fee Schedule
Easy to calculate estimated spending
Simple to explain and understandable to the provider community
Simple to administer
Negotiated Market Rate
Flexibility
Each subcategory has its own resources and labor costs
Cost Reconciliation
Rates will reflect the actual administrative, staff, and care costs of operating the facility
Tiered Rate
Creates incentives to serve beneficiaries with higher service needs
Bundled Rate
Useful in setting rates for services that are difficult to separate by components
Figure 1-5: Potential Disadvantages of HCBS Rate-Setting Methodologies (from CMS)
Fee Schedule
Could lead to over-utilization
Incentivizes services to individuals at lower levels of acuity
Negotiated Market Rate
Difficult for State to establish guidance for negotiations
Parameters for spending tend to localize spending at the upper limit
Cost Reconciliation
Developing cost reports will take time and there is no one set way to do this
Educating the provider on completing the cost report and cost settlement process will add
burden to the state and the provider in the first few years
Tiered Rate
Tier descriptions must be specific and precise
Tiers applied statewide may need to consider regional rates to reflect differences in direct
care costs
Greatly increases the number of rates to monitor in your payment system
Bundled Rate
Incentivizes providers to serve individuals with lower care needs and avoid individuals
when their needs push against the payment amount
Incentivizes providers to set their internal admission and retention policy to balance acuity
so that the rate meets the needs of an average individual

DDS Vendor Rate Study
Page 12
BURNS & ASSOCIATES, INC.
Health Policy Consultants March 15, 2019
More labor intensive to develop a bundled rate particularly if it is directly tied to the
person’s individualized service plan
Each of these methodologies are employed in states across the country to produce rates that
comply with Medicaid requirements. In fact, DDS uses elements of each of these methodologies
in its current rate-setting practices for various services.
For the purposes of this rate study, ABX2-1 directed DDS to evaluate rate-setting methodologies
based on whether they would support a sufficient supply of providers to allow consumer choice,
the fiscal impact, and the extent to which they incentivize outcomes. Ultimately, achieving the
goal of a community-based services system that is sustainable, of high quality, and transparent is
less a function of the specific rate-setting methodology than it is of the rates themselves.
This is particularly true in regards to the supply of providers. If payment rates are insufficient, it
is unlikely that a robust provider network will be sustained, regardless of the rate-setting
methodology. A cursory comparison of California’s rates for three primary service groups to
those paid by several other western states provides some evidence that existing rates may not be
sufficient.13
Figure 1-6 shows that California’s rates for these core services are generally lower than those
paid in other states, except for independent living program rates that are in the range paid by
other states. The findings from the rate comparison suggest that the existing rates may affect the
stability and quality of providers.14 However, the inconsistent use of service codes across
Regional Centers makes it difficult to compare service usage across the State.
13 Comparisons of HCBS payment rates across states are often imprecise because of differences in service
requirements (for example, staffing levels or definitions of billable activities) as well as cost of living. For this
reason, the rate study did not include more extensive rate benchmarking. While a comparison between any two rates
would require adjustments to account for these differences, comparisons across multiple states are useful in
determining whether a given state is outside of the typical range of rates.
14 The rate study does not attempt to offer a quantifiable standard for “an adequate supply of providers”. There is no
national standard and the federal requirement that rates be “sufficient to enlist enough providers so that care and
services are available under the plan at least to the extent that such care and services are available to the general
population in the geographic area” is difficult to apply to HCBS for persons with I/DD as there is no substantial
private market for comparative purposes.

DDS Vendor Rate Study
Page 13
BURNS & ASSOCIATES, INC.
Health Policy Consultants March 15, 2019
Figure 1-6: Comparison of Select HCBS Payment Rates in California and
Four Other Western States
State Residential
(per month)a
Day Habilitation
(per day)b
In-Home Supports
(per hour)
Californiac
Comm. Care Facility,
4 or Fewer Beds
Adult Develop. Center/
Adult Activity Center
Independent Living
Program
$3,674 – $8,170 $28.74 – $74.15 $25.41 – $48.74
Arizonad
Habilitation, Group
Home, 4 Residents
Day Treatment and
Training, Adult
Habilitation, Support
$1,328 – $9,999 $39.90 – $68.16 $21.81 – $22.43
Hawaiie
Adult Day Health/
Community Learning
Personal Asst./
Habilitation
$64.80 – $175.44 $29.84 – $34.56
New Mexicof
Supported Living Custom. Comm. Supp. Custom. In-Home
Supp.
$5,947 – $11,931 $64.32 - $96.48 $27.48
Oregong
Adult 24-Hr.
Residential, 4-5
Residents
Day Support Activity Attendant Care
$5,455 – $12,008 $53.40 – $156.06 $27.28
a Most states pay for residential supports using daily rates. These have been converted to a monthly amount by
multiplying by 365 and the dividing by 12. b Most states pay for day habilitation services using hourly rates. These have been converted to a daily amount
assuming six hours of service per day. c https://www.dds.ca.gov/Rates/ReimbRates.cfm. d https://des.az.gov/sites/default/files/media/DDD_Ratebook_January_1_2019_Updated_2.pdf. Reported rates are
‘adopted’ rates in effect rather than ‘benchmark’ rates that have not been implemented due to a lack of funding.
Group home rates exclude nutritional and incontinence modifiers. Day Treatment and Training excludes
behaviorally or medically intense programs. e https://health.hawaii.gov/ddd/files/2018/10/IDD-Waiver-Rate-Sheet-Effective-07-01-18.pdf. There are few staff-
operated group homes in the State and there are not separate rates for these homes.
f
http://www.hsd.state.nm.us/uploads/FileLinks/e7cfb008157f422597cccdc11d2034f0/1_1_19_Finalversion_DDS
D _DEVELOPMENTAL_DISABILITIES_WAIVER_FEE_SCHEDULE_1_7_18__002_.pdf. g https://www.oregon.gov/DHS/SENIORS-DISABILITIES/DD/PROVIDERS-
PARTNERS/EngagementInnovation/expend-guidelines-v8-tracked-changes-accepted.pdf. The State recently
completed a rate study and is seeking to increase all of the listed rates.

DDS Vendor Rate Study
Page 14
BURNS & ASSOCIATES, INC.
Health Policy Consultants March 15, 2019
The use of payment methodologies to incentivize outcomes remains limited in HCBS programs.
Various studies on this topic have provided a number of explanations, including:
The National Quality Forum identified barriers including a lack of standardized
measures, a lack of access to timely data, varied reporting requirements, and the
administrative burden placed on a state.15
According to the Center for Evidence Based Policy’s Medicaid Evidence-Based
Decisions project, challenges include the diversity of HCBS programs, beneficiary and
provider heterogeneity, provider and system capacity, and varied stakeholder
viewpoints.16
The Kaiser Family Foundation noted a lack of specific guidance in terms of
comprehensive quality metrics.17
The National Association on States United for Aging and Disability listed challenges that
include the unique needs of the I/DD population that make it difficult to adopt quality
measures used with other Medicaid populations, existing measures that do not emphasize
individual outcomes and experiences, the difficult in quantifying quality-of-life measures,
and a lack of agreement on how to define quality.18
The American Network of Community Options and Resources (ANCOR), a national
nonprofit trade association of HCBS providers, found quality and outcome measures are
not widely agreed upon and that the field is still evolving to measure and incentivize
aspects of community services that go beyond medical care to measure goals like
independence and individual choice, but that these measures are not easily defined.19
Thus, while the rate study reflects increased provider rates that aim to improve the quality of
services through the enhancement of the direct care workforce, DDS should continue to look for
15 The National Quality Forum (2016). Quality in Home and Community-Based Services to Support Community
Living: Addressing Gaps in Performance Measurement (Final Report). Retrieved May 11, 2018 from
https://www.qualityforum.org/WorkArea/linkit.aspx?LinkIdentifier=id&ItemID=83433.
16 Bennett, A., Curtis, P., and Harrod, S. The Milbank Memorial Fund. (July 2018). Bundling, Benchmarking, and
Beyond: Paying for Value in Home-and Community-Based Services. Retrieved from https://www.milbank.org/wp-
content/uploads/2018/07/MMF-HCBS-Report-FINAL.pdf.
17 Reaves, E., Musumeci, M. Medicaid and Long-Term Services and Supports: A Primer. Kaiser Family Foundation;
2015. Retrieved from https://www.kff.org/medicaid/report/medicaid-and-long-term-services-and-supports-a-primer/
18 UnitedHealth Care, Community & State. (May 2016). Quality Improvement for Individuals with Intellectual &
Developmental Disabilities: A Proposed Framework. Retrieved from
http://www.nasuad.org/sites/nasuad/files/CST11139_IP16_Whitepaper_NAB_ID_DD_050916.pdf.
19 American Network of Community Options and Resources. (January 2019). Advancing Value & Quality in
Medicaid Service Delivery for Individuals with Intellectual & Developmental Disabilities. Retrieved from
http://ancor.org/sites/default/files/advancing_value_quality_in_medicaid_service_delivery_for_individuals_with_id
d.pdf.

DDS Vendor Rate Study
Page 15
BURNS & ASSOCIATES, INC.
Health Policy Consultants March 15, 2019
opportunities to incentivize outcomes, such as its recent adoption of incentive payments
associated with placing and maintaining consumers in competitive integrated employment.
Based on the forgoing considerations, the rate study concludes that, if changes are made to DDS’
payment structures, a rate-setting methodology based on a fee schedule would be the best option.
In particular, this approach would have the benefits of providing transparency, supporting equity
across consumers and providers, and simplifying rate-setting. That said, the rate study does not
envision a one-size-fits-all approach. For example, the rate models take into consideration
differences in staffing levels driven by the needs of consumers and account for regional variation
in the cost of service delivery. Some services – such as Enhanced Behavioral Support Homes and
Community Crisis Homes – are so variable that a fixed rate is not practicable. However, even in
these instances, the rate models recognize opportunities to standardize certain elements of the
rates.

DDS Vendor Rate Study
Page 16
BURNS & ASSOCIATES, INC.
Health Policy Consultants March 15, 2019
PART 2: OVERVIEW OF THE RATE STUDY AND DATA COLLECTION
As the rate study commenced, B&A worked with DDS and the DS Task Force’s Rates
Workgroup to develop a shared understanding of how it would be conducted and how rate
models would be constructed. B&A also began developing an understanding of California’s
system of supports for individuals with intellectual and developmental disabilities and began
collecting information from a variety of sources.
Section 2.1: Rate Study Principles and Goals
In order to guide the rate study, several project principles and goals were established.
Stakeholder Involvement
A key principle of the rate study was ensuring that there were meaningful opportunities for
involvement by stakeholders, including consumers and their families, providers, Regional
Centers, and system advocates. ABX2-1 required that the rate study include “consult[ation] with
stakeholders, through the developmental services task force process.” Recognizing that broad
stakeholder participation would benefit the rate study by providing an ‘on the ground’
perspective, the procurement that DDS developed for the rate study extended beyond the
legislated requirements and, once the project’s scope of work was finalized, both the Department
and B&A sought further opportunities for stakeholder involvement.
The DS Task Force’s Rates Workgroup was a primary source of stakeholder engagement,
consistent with ABX2-1 requirements. A total of six in-person meetings, including multi-day
sessions, were held with the Task Force or its Rates Workgroup. In the initial stage of the
project, the group was convened to present the approach to the rate study and to garner members’
feedback on that presentation as well as their perspective on current systems issues. A series of
three onsite meetings were conducted in order to walk-through a draft of the provider survey and
then to discuss revisions in response to their feedback. After the survey was completed, the
results were presented to the Rates Workgroup. Leading up to the submittal of this report, a
meeting was convened in Northern California and another in Southern California to present the
study’s findings and conclusions and to provide them the information they need to offer
comments on the rates models.
Over the course of the rate study, B&A received a number of requests for presentations regarding
the scope, timing, and progress of the project. B&A endeavored to fulfill all of these requests,
traveling across the State to meet with groups including:
The Association of Regional Center Agencies, including separate presentations for
executive directors, program directors, and finance staff

DDS Vendor Rate Study
Page 17
BURNS & ASSOCIATES, INC.
Health Policy Consultants March 15, 2019
The California Person-Centered Advocacy Partnership
The California Disability Services Association
The Service Employees International Union
The Los Angeles Coalition of Service Providers
A key informant for the development of the rate models was information gathered through a
provider survey designed to collect information regarding service delivery and costs. Although
the scope of work for the project called for designing a sample of providers to be invited to
participate in the survey, B&A was able to automate some of its processes, allowing the survey
to be opened to all agency providers. Additional information regarding the survey, including its
contents and the provider participation rate, is included in Section 2.3.
As the provider survey was being discussed with the Rates Workgroup, several members of the
group requested that a formal effort also be made to gather input from consumers and their
families. In response, DDS expanded the scope of work to include a consumer and family
survey. The Human Services Research Institute led this effort, working in consultation with a
consumer and family advisory group established for this purpose. Additional information
regarding the survey, including its contents and the provider participation rate is included in
Section 2.3.
To better understand service delivery in California, B&A arranged a number of meetings with
individual service providers. This included approximately ten site visits wherein B&A observed
programs firsthand and was able to facilitate in-depth discussions regarding program operations
and costs. Additionally, B&A had a number of conference calls with various providers to discuss
specific services.
This report is being issued while the next opportunity for stakeholder engagement, the public
comment process, is underway. With the publication of the rate models and supplemental
materials on February 25, 2019, members of the Rates Workgroup, the Regional Centers, and the
Regional Center vendor advisory committees are invited to offer feedback through April 5, 2019.
Commenters are specifically encouraged to consider the factors and cost assumptions in the rate
models, the changes to service requirements assumed in the rate study, and whether the rate
models accommodate the various manners in which services are currently being delivered.
Furthering Programmatic Goals
Recognizing that rates are only one element of California’s systems of supports for persons with
I/DD, the rate study sought to further certain programmatic goals to the extent practicable.
Identified goals included:
DDS Vendor Rate Study
Page 18
BURNS & ASSOCIATES, INC.
Health Policy Consultants March 15, 2019
Supporting compliance with applicable regulations such as state and federal labor laws
and the HCBS final rule.
Recognizing the importance of the direct care workforce by providing market-based
wages, a comprehensive benefits package, and more training, regardless of whether they
are employed by an agency or through a participant-directed model.
Improving services for all consumers regardless of where they live or the language they
speak.
Accounting for the often-higher costs associated with community-based services in
relation to center-based services.
Encouraging the use of competitive integrated employment services rather than work
activity programs.
Supporting an array of community living options for individuals at all levels of need.
Standardizing Operations
In addition to the programmatic goals discussed above, consideration was given to a number of
operational issues, including:
Simplifying the service system, including the consolidation of overlapping service codes.
For example, there are currently two service codes (025 and 680) for tutoring services
that could be combined.
Improving insights into service utilization by narrowing service definitions and/or
establishing standardized subcodes. For example, DDS cannot comprehensively report
the number of individuals receiving supported employment because, in addition to the
‘actual’ service code for individual supported employment (952), the service may be
billed under service codes 055 and 063, both of which are used for a variety of different
types of support.
Increasing consistency in the use of service codes by establishing and updating
regulations, including for miscellaneous service codes.
Standardizing billing units for each service code; for example, the fiscal year 2016-17
claims data reveal that at least five unique unit types were claimed for service code 612
for behavior analysts, including hourly units, monthly units, visits/ sessions, and mileage.
Aligning payments with Medi-Cal for certain medical and clinical practitioners, including
a process for authorizing an enhanced rate for these practitioners when warranted by
unusual circumstances to meet an individual’s needs, consistent with state regulations to
be developed by DDS.

DDS Vendor Rate Study
Page 19
BURNS & ASSOCIATES, INC.
Health Policy Consultants March 15, 2019
Section 2.2: ‘Independent’ Rate Models
As noted in Part 1 of this report, the request for proposals for a consultant to conduct the rate
study sought the establishment of rate models for each service included in the rate study. B&A
employs its independent rate model approach to develop HCBS fee schedules.
In this approach, rate models are constructed in accordance with state and federal requirements
to reflect the reasonable costs that providers incur in the delivery of services. In constructing the
models, there are five primary cost areas that are included for each service:
1. Direct service staff wages
2. Direct service staff benefits
3. The productivity of direct service staff; that is, the proportion of time that they are
providing billable services
4. The provider’s program operation costs
5. The provider’s administrative expenses
Additional cost factors are incorporated in rate models depending on the unique nature of each
individual service. Other factors can include staffing ratios and staffing levels, attendance/
absence factors, travel-related expenses, facility costs, and program supplies.
Once the relevant cost factors for a given service are determined, assumptions are made
regarding the values associated with those factors. For example, for a service that requires a
direct care worker to travel to an individual’s home, the rate model for that service needs to
include assumptions regarding the number of miles that a direct care worker drives each week to
reach and/or transport consumers and the appropriate cost per mile.
B&A refers to its rate-setting approach as independent because cost assumptions are not
dependent on any single source of information. In particular, providers’ current cost data is an
important consideration in the development of rate model assumptions, but it is not the only
consideration. This is because provider costs are largely a function of the rates that they are paid,
particularly in HCBS systems wherein there are few, if any, other payers. Thus, if payment rates
are too low, costs will be artificially depressed. Conversely, if rates are too high, services may
not be delivered in an efficient manner.
Figure 2-1 presents an example of an HCBS rate model.

DDS Vendor Rate Study
Page 20
BURNS & ASSOCIATES, INC.
Health Policy Consultants March 15, 2019
Figure 2-1 Rate Model Example (Independent Living)
Unit of Service Hour
Dir
ect
Support
Sta
ff W
ages
and B
enef
its
- Direct Staff Hourly Wage $14.89
- Employee Benefit Rate (as a percent of wages) 30.60%
Hourly Staff Cost Before Productivity Adj. (wages + benefits) $19.45
Productivity Assumptions
Total Hours 40.00
- Travel Time Between Individuals 1.33
- Recordkeeping and Reporting 0.89
- Supervision and Other Time 0.89
- Training 0.67
- Paid Time Off 3.85
"Billable" Hours 32.37
Productivity Adjustment 1.24
Staff Cost After Productivity Adj. per Billable Hour $24.12
Mil
eage
- Number of Miles Traveled per Week 100
- Amount per Mile $0.580
Weekly Mileage Cost $58.00
Mileage Cost per Billable Hour $1.79
Super
vis
ion
- Supervisor Hourly Wage $21.04
- Supervisor Benefit Rate 25.12%
Weekly Cost of Equipment and Supplies $1,053.01
- Number of Direct Staff Supervised 10
Supervision Cost per Billable Hour $3.25
Adm
in. an
d
Pro
g. O
ps.
- Program Operations Funding per Day $10.00
Program Operations Cost per Billable Hour $1.54
- Administration Percent 12.0%
Administrative Cost per Billable Hour $4.19
Rate per Hour $34.89
As the example shows, the total rate is comprised of a number of cost factors. As noted above,
the rate model assumptions are intended to represent reasonable or typical costs. It is expected
that, for any given provider, their actual costs will be lower for some factors and higher for
others. Further, the individual assumptions in the rate models are not prescriptive on providers;
for example, providers are not obligated to pay their staff the exact wage assumed in the rate
model.

DDS Vendor Rate Study
Page 21
BURNS & ASSOCIATES, INC.
Health Policy Consultants March 15, 2019
There are several advantages to this approach to rate-setting:
Equity. Providers would receive the same rate for delivering the same service in the same
area, rather than rates that vary based on providers’ historical costs, negotiating prowess,
or date when they began delivering services.
Transparency. As shown in the example, the rate models specify the factors, values, and
calculations that produce the overall rate. Stakeholders may not agree with all of the
assumptions, but they should understand them.
Ability to advance policy goals/ objectives. Targeted adjustments to individual rate model
assumptions can be made. For example, policymakers could change direct care staff
salaries or benefits, change staff training, change staff-to-consumer ratios, incentivize
services delivered in the natural environment, etc.
Efficiency in adjusting rates. Subject to available funding, the rate models can be
adjusted to update specific cost factors based on newer data.
These advantages are particularly apparent when compared to the existing system of rates in the
State, which can be inequitable, opaque, and inefficient.
Section 2.3: Sources of Data
The rate study included substantial research and analysis to identify data that would support the
development of the rate models.
Review of Service Requirements
Home and community- based services differ from most medical programs in that there is
generally a lack of national standards. For most medical procedures, there is a consistent
standard from state-to-state. That is, a given procedure ‘looks’ the same regardless of where it is
performed. This is not true of HCBS, however.
Using community-based day programs – which every state in the country covers in their HCBS
programs – as an example, there are significant differences across the states. For example, some
states allow staffing ratios of ten or more consumers for every direct care worker whereas other
states limit the ratio to no more than three consumers per worker. Some states allow consumers
to attend up to 40 hours per week; others have limits of fewer than 25 hours per week. Some
states require day programs to provider transportation; others do not. Some states require day
programs to provide a meal to consumer; others do not. All of these policies have an impact on
providers’ costs.
Thus, a first step in the rate study was researching and documenting service requirements in
California. B&A reviewed statutes and regulations governing DDS services, Regional Center

DDS Vendor Rate Study
Page 22
BURNS & ASSOCIATES, INC.
Health Policy Consultants March 15, 2019
policy manuals, and previous studies and reports related to payment rates.20 As part of its
research, B&A noted that many service codes lack well-defined parameters and have only broad
definitions. Based on this review, B&A facilitated a multi-day meeting with DDS staff to clarify
any ambiguities and to discuss DDS’ policy intentions for all services, but particularly those
lacking well-defined requirements.
This step also included a detailed review of federal and state laws affecting service delivery,
including the federal Fair Labor Standards Act, the federal HCBS final rule, California wage
orders, and scheduled changes to State minimum wage levels.
Service Utilization Analysis
To further contextualize services and to begin to understand the cost of service delivery and
utilization, B&A evaluated fiscal year 2016-17 claims data for services included in the rate study
both statewide and at the Regional Center level. Figure 2-2 reports fiscal year 2016-17 spending
levels and client and Regional Center utilization for these in-scope services.
20 These reports included: Controlling Regional Center Costs published December 2007 by DDS, and three reports
published by ARCA: Funding the Work of California’s Regional Centers published September 2013, Inadequate
Rates for Service Provision in California published January 2014, and On the Brink of Collapse published February
2015.

DDS Vendor Rate Study
Page 23
BURNS & ASSOCIATES, INC.
Health Policy Consultants March 15, 2019
Figure 2-2: Summary of Spending Levels, Consumer Countsa and Regional Center Counts for
Services Included in the Rate Study, Fiscal Year 2016-17
Service
Code
POS Claims Unique
Consumers
RCs
Utilizing
Service
Code
POS Claims Unique
Consumers
RCs
Utilizing
17 $22,554,871 868 20 605 $58,618,837 10,871 19
25 $576,929 163 10 612 $45,268,410 8,685 21
28 $31,717,594 5,049 18 613 $5,473 1 1
48 $44,263,045 4,706 18 615 $20,677,468 2,620 14
55 $266,897,628 15,683 21 616 $393,035 44 3
62 $145,724,312 7,388 21 620 $26,194,593 5,391 20
63 $49,067,077 3,699 21 635 $2,134,301 401 10
73 $418,163 9 3 645 $305,215 153 9
91 $8,064,294 577 15 650 $59,925 84 5
93 $6,206,000 388 11 680 $584,009 49 8
94 $9,245,202 841 16 805 $187,859,948 45,147 21
103 $9,350,137 5,507 17 860 $14,858,643 1,717 16
106 $2,372,606 615 5 862 $292,399,198 61,841 21
108 $11,312,135 1,147 18 864 $5,483 1 1
109 $57,708,801 2,215 21 875 $156,917,683 13,839 21
110 $36,427,303 3,568 21 880 $105,183,017 29,820 21
111 $10,721,299 1,504 20 882 $13,889,461 1,288 17
113 $368,406,082 2,860 21 883 $3,876,837 293 14
115 $6,162,019 1,583 17 894 $11,584,144 1,560 11
116 $80,401,384 31,991 19 896 $601,673,593 12,419 21
117 $9,982,318 1,843 17 900 $49,382 4 1
420 $787,906 171 6 904 $66,747,273 1,873 21
465 $15,868,751 4,208 14 905 $45,278,002 1,817 21
475 $51,888 12 4 910 $7,389,549 170 16
505 $57,261,002 6,749 20 915 $749,067,928 19,635 21
510 $400,362,499 32,540 21 920 $36,736,374 670 20
515 $247,121,261 15,218 21 950 $92,883,053 341 21
520 $112,892,421 16,538 21 952 $24,479,908 5,001 21
525 $8,611,397 1,347 12 954 $48,816,190 7,816 20 a Counts of unique consumers are based on clients’ unique identification numbers. For many services, this includes group
billings where it is not always possible to determine how many consumers are included in the group.
In order to develop an understanding of current payment policies, B&A also analyzed billing
units and average rates. That analysis demonstrated significant differences for many services in
the basis of payment (such as an hour or a month) and in the rates paid. There were differences
both across Regional Centers and even within Regional Centers, as illustrated in Figure 2-3.

DDS Vendor Rate Study
Page 24
BURNS & ASSOCIATES, INC.
Health Policy Consultants March 15, 2019
Figure 2-3: Summary of Unit Types, Payments, and Range of Rates by Unit Type for
Service Code 091 – In Home/ Mobile Day Program, Fiscal Year 2016-17
Regional
Center
Day Units Hourly Units Mile Units
Payments Range of
Rates
Payments Range of
Rates
Payments Range of
Rates
CVRC $662,118 $24.64 -
$71.82 $26,762
$11.90 -
$25.21
ELARC $1,266,081 $18.11 -
$42.57
FDLRC $62,319 $18.62 -
$27.36
FNRC $469,329 $46.78 -
$133.91 $685,787
$14.46 -
$20.11 $608
$0.26 -
$0.26
GGRC $238,224 $17.40 -
$24.41
KRC $354,082 $54.20 -
$82.75
NBRC $78,143 $61.43 -
$61.43
NLACRC $638,883 $20.55 -
$27.36
RCEB $2,142,406 $21.64 -
$48.20
RCRC $69,815 $23.73 -
$25.13
SARC $380,230 $10.84 -
$27.05
SCLARC $287,542 $27.05 -
$29.12
SGPRC $234,401 $24.09 -
$29.37
VMRC
$288,749 $25.21-
$25.97
WRC
$178,814 $13.53-
$27.05
This degree of variability illustrated the importance of carefully defining the requirements for the
use of each service code. For example, a wide range of rates within a service code suggests that it

DDS Vendor Rate Study
Page 25
BURNS & ASSOCIATES, INC.
Health Policy Consultants March 15, 2019
is likely that very different services are being delivered under that service code. Thus, the rate
study sought to accommodate the different delivery modalities (and produce different rate
models for these modalities) or define what is assumed to be permitted (and not permitted) under
the rate model.
Provider Surveys
In order to understand providers’ current cost structures, B&A developed and administered a
Microsoft Excel-based survey to gather data such as:
Wage and benefit costs for direct care, program operations, and administrative staff
‘Productivity’ (i.e., amount of time direct care workers spend providing direct care vs.
other activities, such as non-billable recordkeeping)
Cost of facilities, including rents, maintenance, utilities, etc.
Staffing ratios
Miles driven transporting recipients or traveling between encounters
An initial draft of the survey was shared with the Rates Workgroup in February 2018. The
workgroup suggested a number of changes, largely asking that the survey capture a finer level of
detail. B&A worked with the workgroup to finalize the instrument over the course of two
additional meetings and a series of webinars.
Ultimately, the survey was deployed in May 2018 with a six-week turnaround time. In response
to requests from providers, DDS agreed to extend the due date by four weeks, giving providers a
total of ten weeks to complete the survey. Additionally, B&A granted a further extension to any
agency that requested one and continued to accept surveys beyond the announced deadline.
A second, similar survey targeted at specialized therapeutic services that were not covered by the
first survey was administered from September to October 2018.
For both surveys, technical assistance was offered in a number of ways. The survey itself was
accompanied by written instructions. B&A recorded a series of webinars in which it walked
through the survey page-by-page. A dedicated phone line and email account were established to
accept and respond to questions.
The project work plan called for inviting a sampling of providers to complete the survey, but in
the interests of being as inclusive as possible, DDS and B&A agreed to invite all agency

DDS Vendor Rate Study
Page 26
BURNS & ASSOCIATES, INC.
Health Policy Consultants March 15, 2019
providers to participate. Of the 5,745 providers21 that provided a service covered by the two
surveys, responses were received from 1,138, a 20 percent response rate. These respondents
accounted for 52 percent of total spending on in-scope services, meaning that the survey
captured a majority of total service costs.
The survey instrument, instructions, detailed analysis, and summary presentation are included as
Attachment 3 of this report.
Individual and Family Survey
In response to requests from the Rates Workgroup and other community members, DDS
expanded the scope of work for the rate study to include an individual and family survey. HSRI
led this effort for the consulting team. An individual and family survey advisory group was
established to provide input on the development of the survey instrument.
Understanding service recipients and their families do not have information regarding the cost of
providing services, the survey was designed to offer an opportunity for persons with disabilities
and their families to share their perspectives about issues related to their services. The survey
included questions about themselves/ family members (e.g., level of support need, what is
important to them). Then, respondents were asked to rate their experiences accessing and
receiving services and their opinions regarding supports provided by staff as ‘good’, ‘fair’, or
‘poor’. The instrument was translated into 16 languages and was available for most of the month
of October 2018.
In total, 1,732 responses were received from individuals, family members, and other
respondents. While the survey used a convenience sample that makes it impossible to draw
statistical conclusions, it provided an opportunity for DDS consumers and their families to share
their perspectives related to their services. Although the survey was intended to capture
information related to services provided through the Regional Centers, it is possible that some
respondents may have reported information related to services outside of the scope of the rate
study. The survey found that, for the most part, respondents are pleased with the support they
receive (about 75 percent of respondents rated their staff as good). The survey also found that
there is room for system improvement, particularly where areas with “good” ratings lower than
50 percent were identified. These included knowing about the system, finding services, quality
staff, or getting specialized services, and choosing or changing staff. The results of the individual
and family survey, along with the survey instrument, can be found in Attachment 4.
21 Since a separate vendorization is required for each program or site, a single legal entity (a ‘provider’ for the
purposes of this report) may be counted as multiple vendors. The 5,745 providers accounted for 12,866
vendorizations.
DDS Vendor Rate Study
Page 27
BURNS & ASSOCIATES, INC.
Health Policy Consultants March 15, 2019
Independent Data Sources
In addition to the information gathered from providers, individuals, and other stakeholders, other
data sources used to inform the development of the rate models were identified, collected, and
analyzed. For these independent sources, B&A endeavored to gather information that was
current, credible, and directly applicable to the rate study.
These data sources include:
Wage data from the Bureau of Labor Statistics and wage growth data from the Bureau of
Economic Analysis.
Data regarding the cost of health insurance from the BLS, the federal Department of
Health and Human Services’ Medical Expenditure Panel Survey, and Kaiser Family
Foundation’s analysis of exchange health care rates.
The Internal Revenue Service’s mileage rate, which is used to estimate the non-staff cost
of travel.
Commercial real estate costs from LoopNet, a subsidiary of the CoStar Group, and
Colliers International.
Bing’s API Mapping Service for geo-spatial analysis.
U.S. Census Bureau data related to population and population density.
The Workers’ Compensation Insurance Rating Bureau’s advisory pure premium rates for
workers’ compensation rates.
Part 3 of this report details the methodologies employed to translate the information from these
sources as well as the provider and individual and family surveys into rate model assumptions.

DDS Vendor Rate Study
Page 28
BURNS & ASSOCIATES, INC.
Health Policy Consultants March 15, 2019
PART 3: RATE MODEL DEVELOPMENT
Drawing upon data collected through the provider survey and published data sources, and
informed by input from DDS as well as consumers, families, and providers, B&A developed rate
models for the services within the scope of the rate study.
The rate models encompass the factors that drive the costs of service delivery, the values
associated with these factors, and the calculations employed to combine these factors into an
overall rate for a prescribed time-based billing unit.22
B&A began by constructing a ‘base’ rate model or models for each service code.23 Then, to
account for differences in costs associated with wages, travel, and real estate across the State,
adjustment factors were applied to the base rate models for each service code, as relevant, to
establish a rate model for each Regional Center.
Further adjustments to many of the rate models are made to support specific goals. For example,
in order to most effectively support individuals who do not speak English – including those who
are deaf or hard of hearing and communicate through American Sign Language – many services
include a ‘non-English’ rate for staff providing services in the consumer’s language.
Section 3.1: Key Cost Factors in Base Rate Models
As discussed in Part 2, there are five common factors in B&A’s rate models for home and
community-based services:
1. Wage paid to the direct care worker
2. Benefits package for the direct care worker
3. Productivity of the direct care worker
4. Provider-level program operations expenses
5. Provider-level administrative expenses
Other key cost factors – such as staffing levels and ratios, vehicle and facility expenses, and
occupancy and attendance levels – apply to certain services and are discussed as warranted in the
service code specific assumptions detailed in Part 4.
22 With the exception of monthly billing units for most residential services and trip rates for transportation services,
the rate study generally assumes hourly billing units.
23 Many services require multiple models to account for different permissible staffing levels or ratios, service
settings, the length of the encounter, and other factors. The specific ‘variants’ for each service code are discussed in
Part 4.
DDS Vendor Rate Study
Page 29
BURNS & ASSOCIATES, INC.
Health Policy Consultants March 15, 2019
Direct Care Worker Wages
Payroll and benefits costs for direct care workers is the single largest category of expenses for
HCBS providers; in B&A’s experience, these costs often account for between 65 and 80 percent
of total expenses. As a result, spending in these areas is most affected when payment rates do not
reflect market costs. Thus, although current wage and benefit levels are informative, B&A
primarily relied on independent, published sources of market wage data for comparable
positions.
The Bureau of Labor Statistics within the United States Department of Labor produces
employment and wage estimates for more than 800 standard occupational classifications. As the
BLS states, it is the “only comprehensive source of regularly produced occupational employment
and wage rate information for the U.S. economy, as well as States, the District of Columbia,
Guam, Puerto Rico, the U.S. Virgin Island, and all metropolitan and nonmetropolitan areas in
each State.”24 This statement highlights several of the features of the BLS data that makes it
particularly useful for setting wage levels, including:
It is comprehensive. BLS wage data is representative of 1.2 million establishments and
about 57 percent of the employment in the United States.
It is regularly produced. BLS wage data is published on an annual basis, allowing rate
model assumptions to be regularly reviewed and updated.
It is cross-industry. BLS wage data is not limited to a single industry so estimates for a
given occupation are representative of the overall labor market for that occupation; this is
particularly important when considering wage levels for traditionally underfunded
programs such as Medicaid.
It is state- (and local-) specific. BLS wage data is reported for individual states and sub-
state areas, permitting the evaluation of wage variance across states and within a given
state.
In order to utilize BLS data in the rate models, two adjustments were needed. First, the data had
to be updated to make it current and, second, assumptions had to be developed when there was
not a one-to-one relationship between the BLS occupations and the job functions of direct care
workers providing a given service.
BLS wage data is typically published in late March of each year, with the data representing May
of the previous year. Thus, the rate models use the May 2017 dataset, which was published in
March 2018. In addition to typical wage inflation, the State’s minimum wage in 2017 was $10.50
per hour whereas the minimum wage is next scheduled to increase to $13.00 per hour on January
24 Bureau of Labor Statistics. (n.d.). Frequently Asked Questions. Retrieved from
https://www.bls.gov/oes/oes_ques.htm.

DDS Vendor Rate Study
Page 30
BURNS & ASSOCIATES, INC.
Health Policy Consultants March 15, 2019
1, 2020.25 The rate models take steps to account for both wage inflation and the rising minimum
wage.
Data from the federal Bureau of Economic Analysis was used to estimate wage inflation.
According to the BEA, the compound annual growth rate for net earnings in California between
2007 and 2017 was 3.6 percent.26 Applying this growth rate to the 32 months between May 2017
and January 2020, the date of the next minimum wage increase, yields a total inflationary
adjustment of 9.89 percent.
In order to adjust the BLS wage data to reflect the rising minimum wage, the rate models account
for two widely accepted features of an increasing minimum wage.
First, an increasing minimum wage will have ‘spillover’ effects, meaning that some individuals
who already earn above the minimum wage will receive a pay raise when the minimum wage
increases.27 Two examples illustrate this phenomenon:
Assuming a $10.00 per hour minimum wage that will increase to $13.00, consider a
supervisor earning $13.25 to supervise staff earning $10.00. The subordinate staff must
receive a pay raise of $3.00 per hour in order for their wage to comply with the new
minimum wage. There is no requirement for the supervisor to receive a pay raise as their
current wage remains legal, but if they receive nothing while their subordinates receive a
substantial raise, there would be nearly no financial benefit associated with the additional
responsibility of supervision.
Again assuming a $10.00 per hour minimum wage that will increase to $13.00, consider
two direct care workers. The first has been with their shared employer for three years and
is earning $12.50 per hour while the second is new to the job and is earning $10.00. In
order to comply with the higher minimum wage, the employer only needs to move both
workers to $13.00. This would result in both employees receiving a raise, but the tenured
25 California Department of Industrial Relations. Official Notice – California Minimum Wage (MW-2019).
Retrieved from https://www.dir.ca.gov/Iwc/MW-2019.pdf. The minimum wages cited apply to employers with at
least 26 employees; during these time periods, there are lower minimum wages for smaller employers.
26 Bureau of Economic Analysis. (2018). Bearfacts – Personal Income for California. Retrieved from
https://apps.bea.gov/regional/bearfacts/action.cfm.
27 See, for example:
Phelan, Brian J. December 19, 2013. Labor Supply Substitution and the Ripple Effect of Minimum Wages.
Retrieved from https://www.aeaweb.org/conference/2014/retrieve.php?pdfid=306.
Rinz, K., and Voorheis, J. (March 2018). The Distributional Effects of Minimum Wages: Evidence from Linked
Survey and Administrative Data. Published by the U.S. Census Bureau Center for Administrative Records Research
and Applications. Retrieved from https://www.census.gov/content/dam/Census/library/working-
papers/2018/adrm/carra-wp-2018-02.pdf.
DDS Vendor Rate Study
Page 31
BURNS & ASSOCIATES, INC.
Health Policy Consultants March 15, 2019
employee would receive a much smaller raise and would no longer be receiving any wage
differential for their experience.
The second feature of a minimum wage increase is ‘compression’, meaning that there will be
some narrowing of the difference in pay between employees as the minimum wage rises.28 That
is, pay raises associated with a rising minimum wage will decrease as an employee’s current
wage increases. To assume otherwise would require that everyone in a state, regardless of how
much they currently earn, would receive a pay raise every time the minimum wage increases.
Using the same examples as above:
The supervisor currently earning $13.25 per hour is expected to receive a pay raise even
though they already earn more than the new minimum wage, but they are not expected to
receive the full $3.00 value of the increase in the minimum wage from $10.00 per hour to
$13.00.
Similarly, the experienced worker is expected to receive a pay raise so that they still earn
more than a new employee. Again, however, their raise is not expected to be $3.00 so
they will still be earning more than their less-tenured coworker, but it will no longer be
the existing $2.50 gap.
Figure 3-1 summarizes the assumptions employed in the rate models in order to adjust BLS wage
data to recognize the rising minimum wage while accounting for both spillover and compression
effects.
28 See, for example:
Phelan, Brian J. December 19, 2013. Labor Supply Substitution and the Ripple Effect of Minimum Wages.
Retrieved from https://www.aeaweb.org/conference/2014/retrieve.php?pdfid=306.
Miller, Stephen. (June 1, 2018). Address Pay Compression or Risk Employee Flight. Published by the Society for
Human Resource Management. Retrieved from https://www.shrm.org/resourcesandtools/hr-
topics/compensation/pages/address-pay-compression-or-risk-employee-flight.aspx.

DDS Vendor Rate Study
Page 32
BURNS & ASSOCIATES, INC.
Health Policy Consultants March 15, 2019
Figure 3-1: Assumptions to Account for Minimum Wage Rising
from $10.00 per Hour to $13.00
Current Wage
in $1.00
Increments
% of Marginal
Dollar
'Captured' as
Part of Wage
Increase
Marginal Dollar
Amount
'Captured' as
Part of Wage
Increase
Cumulative
Wage Increase
(in Relation to
$13.00)
Revised Wage
$10.00 100% $13.00
$10.01 - $10.99 90% $0.89 $0.89 $13.01 - $13.89
$11.00 - $11.99 80% $0.80 $1.69 $13.89 - $14.68
$12.00 - $12.99 70% $0.70 $2.39 $14.69 - $15.38
$13.00 - $13.99 60% $0.60 $2.99 $15.39 - $15.98
$14.00 - $14.99 50% $0.50 $3.49 $15.99 - $16.49
$15.00 - $15.99 40% $0.40 $3.89 $16.49 - $16.89
$16.00 - $16.99 30% $0.30 $4.19 $16.89 - $17.19
$17.00 - $17.23 20% $0.20 $4.39 $17.19 - $17.24
In the first column, the table lists wage ranges in $1.00 increments. The next two columns
provide an assumption of the amount of that $1.00 increment that will be ‘captured’ and added to
the $13.00 minimum wage. For example, for a worker earning $11.00, there is a single $1.00
increment above the current $10.00 minimum (technically, the bottom of the first wage range for
those earning more than the minimum wage is $10.01 so this first ‘dollar’ is actually $0.99).
According to the table, 90 percent of this first $0.99 is captured, translating to $0.89 ($0.99
multiplied by 90 percent). This total is added to the new $13.00 minimum wage such that this
worker will be assumed to be earning $13.89 per hour after the minimum wage increase. The fact
that this worker will receive a raise beyond the $13.00 minimum wage illustrates the spillover
effect, while the fact that they will now be earning $0.89 more than the new minimum compared
to the $1.00 more than the existing minimum that they are currently earning illustrates the impact
of compression.
The fourth column is a running total of the aggregate captured dollar amounts in relation to the
$13.00 per hour minimum wage. So, for a worker currently earning $12.00 per hour, they will
capture 90 percent of the first $0.99 above the minimum wage (as discussed in the previous
example) and 80 percent of the second $1.00 above the minimum, for a total of $1.69 ($0.89 plus
$0.80). Thus, their new wage will be $14.69 per hour. The final column lists the new wage
ranges after the application of the values in the preceding columns.

DDS Vendor Rate Study
Page 33
BURNS & ASSOCIATES, INC.
Health Policy Consultants March 15, 2019
Based on these assumptions, every worker currently earning up to $17.23 per hour would receive
a pay raise when the minimum wage increases from $10.00 to $13.00 per hour although the raise
for someone at $17.23 would be $0.01.
The adjustments described above for wage inflation and the rising minimum wage were
calculated independently for every BLS wage value and the larger of the two was applied to
update the given value. Figure 3-2 illustrates the values associated with each of these
adjustments.
As demonstrated in the chart, the adjustments intersect at exactly $15.00 per hour. Thus, BLS
wage values of $15.00 per hour or less were updated based on the minimum wage adjustment
while those greater than $15.00 were revised using the inflationary adjustment.
After adjusting the BLS wage data to account for inflation and a rising minimum wage, the most
appropriate BLS occupation had to be selected for each service code. At times, there is a precise
match. For example, when setting rates for nursing (which was not part of the scope of this
project), there are specific occupational classifications for registered nurses and for licensed
vocational nurses.
For other services, however, there may not be an exact match. An example is direct care workers
providing habilitative services, often referred to as direct support professionals. DSPs are
certainly covered by the BLS survey and a review of the national industry-level estimates makes
clear that they are classified as personal care aides (SOC 39-9021), as this occupation accounts
$0.00
$0.50
$1.00
$1.50
$2.00
$2.50
$3.00
$3.50
$10 $11 $12 $13 $14 $15 $16 $17 $18
Pay R
ais
e
Current Wage
Figure 3-2: Impact of Inflationary and Minimum Wage Adjustments,
by Wage
Min. Wage Adjustment Inflationary Adjustment

DDS Vendor Rate Study
Page 34
BURNS & ASSOCIATES, INC.
Health Policy Consultants March 15, 2019
for more than 62 percent of all direct care, administrative, and support positions in this
industry.29 The BLS provides the following description for this occupation:
Assist the elderly, convalescents, or persons with disabilities with daily living activities at
the person's home or in a care facility. Duties performed at a place of residence may
include keeping house (making beds, doing laundry, washing dishes) and preparing
meals. May provide assistance at non-residential care facilities. May advise families, the
elderly, convalescents, and persons with disabilities regarding such things as nutrition,
cleanliness, and household activities.30
This description describes a portion of the work that DSPs perform, but it arguably does not fully
represent the responsibilities of DSPs who work with individuals with intellectual and
developmental disabilities and who are expected to provide training and support to increase
individuals’ independence, to manage behaviors, and to assist with medical care.
Thus, the rate models
draw from multiple BLS
occupations in order to
construct the rate model
wage assumption, as
shown in Figure 3-3. As
the table shows, the rate
models use four different
BLS occupations to
represent a DSP providing
services in an individual’s
home, in a residential
setting, or in a day program. The largest weighting – 55 percent – is applied to the personal care
aide classification, which is the occupation to which DSPs are currently assigned. The remaining
45 percent is evenly allocated to three other occupations that are representative of the work
performed by DSPs based on a review of BLS occupational descriptions and service
requirements.
The same approach was employed to establish a base rate model wage assumption for each
service code.
29 Personal care aides represent 1,106,430 positions out of 1,689,870 in the industry of services for the elderly and
persons with disabilities (North American Industry Classification System 624120,
https://www.bls.gov/oes/current/naics5_624120.htm) and 194,620 positions out of 400,290 in residential intellectual
and developmental disability facilities (NAICS 623210, https://www.bls.gov/oes/current/naics5_623210.htm).
30 Bureau of Labor Statistics. Occupational Employment and Wages – 39-9021 Personal Care Aides. Retrieved from
https://www.bls.gov/oes/current/oes399021.htm.
Figure 3-3: Base Rate Model Wage Assumption for DSPs
BLS Standard
Occupational Classification Weighting Median Wage
(Adjusted)
39-9021 Personal Care Aide 55% $14.22
31-1011 Home Health Aide 15% $15.43
31-1013 Psychiatric Aide 15% $16.23
39-9032 Recreation Worker 15% $15.46
Weighted Avg. (Base Rate
Model Wage Assumption) $14.89

DDS Vendor Rate Study
Page 35
BURNS & ASSOCIATES, INC.
Health Policy Consultants March 15, 2019
The BLS wage data before and after the adjustments as well as the job mix assumptions are
included in Appendix B of the rate model packet.
Direct Care Worker Benefits
In addition to market-based wages, the rate models include a comprehensive benefits package
intended to support providers in the attraction and retention of a qualified and stable workforce.
The rate models assume that all employees providing direct care receive the same benefits.
The rate models include the following standard employer-paid payroll taxes31:
Social Security – 6.20 percent of total wages32
Medicare – 1.45 percent of total wages33
Federal unemployment insurance – 0.60 percent on the first $7,000 in wages paid34
State unemployment insurance – 3.40 percent on the first $7,000 in wages paid35
State Employer Training Tax – 0.10 percent on first $7,000 in wages paid36
For workers’ compensation rates, the rate models rely on the approved 2019 advisory pure
premium rates issued by the Workers’ Compensation Insurance Rating Bureau of California
(WCIRB).37 B&A selected the WCIRB classification code that appeared most applicable to each
individual service code.38 Then, based on the four-year trend between January 1, 2015 and
31 The rate models do not include funding for employee-paid taxes including the employee share of Social Security
and Medicare payroll taxes, the State Disability Insurance (SDI) tax, or personal income taxes.
32 U.S. Department of the Treasury. Internal Revenue Service. (2018). Publication 15 (Cat. No. 10000W). Retrieved
from https://www.irs.gov/pub/irs-pdf/p15.pdf. In 2019, this tax is limited to the first $132,900 in wages. None of the
rate model wage assumptions exceed this amount, however.
33 Ibid. There is an ‘additional’ Medicare tax of 0.90 percent on wages above $200,000. None of the rate model
wage assumptions exceed this amount, however, so this tax does not apply.
34 Ibid.
35 California Employee Development Department. (December 2018). 2019 Federal and State Payroll Taxes.
Retrieved from https://www.edd.ca.gov/pdf_pub_ctr/de202.pdf. This is the rate assigned to new employers. In
comparison, the average state unemployment insurance tax rate reported by provider survey respondents was 3.00
percent.
36 Ibid.
37 Workers’ Compensation Insurance Rating Bureau. Approved 2019 Advisory Pure Premium Rates. Retrieved from
https://www.wcirb.com/content/wcirb-january-1-2019-regulatory-pure-premium-rate-filing on February 10, 2019.
38 The crosswalk of the WCIRB classification code used for each service code is included in Appendix C of the rate
model packet.

DDS Vendor Rate Study
Page 36
BURNS & ASSOCIATES, INC.
Health Policy Consultants March 15, 2019
January 1, 2019, the rates were reduced by 11.5 percent.39 Finally, a 12 percent administrative
factor was added to account for insurers’ costs.
The resulting average workers’ compensation rate – weighted by service code expenditures –
assumed in the rate models is $4.35 per $100 in wage paid, lower than the average rate of $5.53
reported by provider survey respondents.
In a 2018 survey conducted by the Society for Human Resource Management, 92 percent of
employees indicated that benefits are important to their overall job satisfaction.40 Recognizing
the importance of benefits, both in terms of attracting and retaining staff and in employee health
and wellbeing, the rate models incorporate funding for benefits that extend beyond mandatory
payroll taxes, including paid time off, health insurance, and other benefits. When developing the
values attached to these benefits, B&A primarily considered published data sources that reflect
benefits available to employees throughout the private sector rather than the benefits currently
offered by vendors, which are generally less generous.
Health insurance is the most costly benefit. The rate models aim to fund the employer share of
the cost of an employee-only health insurance plan. Figure 3-4 on the following page compares
the amount assumed in the rate model to costs reported by various published estimates.
The table demonstrates that the $450 per month employer cost for an employee-only health plan
assumed in the rate models is on the high end of the range of rates identified in the published
sources.
This figure is then adjusted to account for the reality that not all employees will participate in
employer-sponsored health insurance. Many employees work for organizations that do not offer
health insurance. Even among those employees with access to health insurance, some will
decline to participate for a number of reasons: they may receive coverage from a spouse, they
may be enrolled in a public plan such as the Veteran’s Administration or Medicare, or they may
simply choose to go without coverage. The rate models are designed to allow all providers to
offer health insurance, but recognize that some employees will opt not to participate. As shown
in the table, the rate model assumes that 80 percent of direct care workers will receive employer-
sponsored health insurance, a rate that is about 25 percentage points higher than is typical in the
39 State of California Department of Insurance. (November 7, 2018). Decision and Order: January 1, 2019 Workers’
Compensation Claims Cost Benchmark and Advisory Pure Premium Rates (file number reg-2018-00018). Retrieved
from https://www.wcirb.com/sites/default/files/documents/20190101_ppr_filing_decision_and_order.pdf. The rate
is based on the overall change in filed rates from $2.77 to $1.70. A review of classification codes related to HCBS
found a similar trend.
40 Society for Human Resource Management. 2018 Employee Benefits: The Evolution of Benefits. Retrieved from
https://www.shrm.org/hr-today/trends-and-forecasting/research-and-
surveys/Documents/2018%20Employee%20Benefits%20Report.pdf.

DDS Vendor Rate Study
Page 37
BURNS & ASSOCIATES, INC.
Health Policy Consultants March 15, 2019
private sector when accounting for both employer offer rates and employee take-up rates and 35
percentage points higher than the rate reported by provider survey respondents.
After taking the participation rate into account, the rate models include $360.00 per direct care
worker per month, an amount that is double the cost reported through the provider survey and
substantially higher than the figures reported by the published sources.
Figure 3-4: Rate Model Assumptions for Health Insurance for Direct Care Workers
Compared to Other Data Sources
Monthly Employer
Cost for Participating
Employees
Coverage Ratea Monthly Employer
Cost for All
Employees
Rate Model $450.00 80.0% $360.00
Provider Surveyb $433.95 44.0% $190.94
BLS (2018)c $453.69 54.0% $244.99
MEPS (2017)d $405.16 56.8% $230.13
Exchange (2019) e $376.00 - -
a The participation rate incorporates both staff working for employees who do not have access to health insurance
(for example, they work for a company that does not offer health insurance or do not meet eligibility
requirements) and those who choose not to sign-up for insurance.
b The provider survey reflects the reported weighted average without outliers across all full-time and part-time
staff.
c Bureau of Labor Statistics’ 2018 Employee Benefits Survey results for the Pacific region
(https://www.bls.gov/ncs/ebs/benefits/2018/ownership_private.htm, see Table 11).
d U.S. Department of Health and Human Services' 2017 Medical Expenditure Panel Survey
(https://meps.ahrq.gov/mepsweb/data_stats/quick_tables.jsp, see Tables II.B.2.b, II.C.1, and II. C.2) results for
California, reflects an average total premium of $524.58 with an employee share of $119.42.
e Based on the Kaiser Family Foundation’s analysis of the second-lowest cost silver plan before tax credits (the
'benchmark' plan) for a 40 year-old non-smoker in Los Angeles (https://www.kff.org/private-insurance/issue-
brief/tracking-2019-premium-changes-on-aca-exchanges/).
In addition to health insurance, the rate models assume that direct care workers receive 25 days
of paid time off, inclusive of paid holidays, vacation, and sick leave41 as detailed in Figure 3-5.
41 The rate study assumes that employees receive 10 paid holidays and 15 other days of paid leave. Sick leave is
incorporated in these 15 days, which is sufficient to comply with the requirements of LAB § 246.

DDS Vendor Rate Study
Page 38
BURNS & ASSOCIATES, INC.
Health Policy Consultants March 15, 2019
Figure 3-5: Rate Model Assumptions for Paid Time Off Compared to Data from the
Bureau of Labor Statistics and the DDS Provider Survey
Number of Days for
Eligible Employees
% of Employees Who
Are Eligible
Number of Days for All
Employees (including
those without access)
Rate
Model
BLSa Prov.
Surveyb
Rate
Model
BLSa Prov.
Surveyb
Rate
Model
BLSa Prov.
Surveyb
Holidays 15.0 8.0 9.0 100% 78% 96% 15.0 6.2 8.6
Vacation 10.0
10.0 12.8 100%
76% 97% 10.0
7.6 12.5
Sick 7.0 86% 6.0
Total 25.0 25.0 21.8 25.0 19.8 21.1
a Bureau of Labor Statistics’ 2018 Employee Benefits Survey
(https://www.bls.gov/ncs/ebs/benefits/2018/ownership_private.htm). Participation rate reflects private industry in
the Pacific region. The number of holidays reflects the average for all private industry employees in the Pacific
Region. The number of vacation and sick days reflect the average for all private industry employees with between
one and five years of job tenure nationwide.
b The provider survey reflects the reported weighted average without outliers across all full-time and part-time
staff.
As with health insurance, not all staff are eligible for a given benefit so the table differentiates
between the average number of days provided to employees who receive the benefit (that is,
eligible employees) and the average number of days received by all employees (that is, taking
into account those who do not have access to the benefit). Although the data from the Bureau of
Labor Statistics found that between 76 percent and 86 percent of private sector employees are
offered paid time off, the provider survey found that nearly all full-time employees are offered
paid time off. Accordingly, the rate models assume that all direct care workers will receive paid
time off. The 25 paid days off included in the rate models align with the average across the
private sector before adjusting for those without access to the benefit and is somewhat greater
than the 21-to-22-day average reported by participants in the provider survey.
Lastly, the rate models include $100 per direct care workers per month for all other benefits such
as dental or life insurance, a contribution to a retirement plan, tuition reimbursement, etc. In
comparison, the provider survey found an average cost of about $86 per employee per month.
The benefits package for direct care workers is detailed in Appendix C of the rate model packet.
In the rate models themselves, the benefits package is translated to a benefits rate expressed as a
percentage of the direct care worker’s wage. Since certain benefit costs are assumed to be fixed
(for example, the rate models provide the same $360.00 per month for health insurance for all
direct care workers), there is an inverse relationship between the wage of the direct care worker

DDS Vendor Rate Study
Page 39
BURNS & ASSOCIATES, INC.
Health Policy Consultants March 15, 2019
and the benefit rate. That is, as the direct care wage increases, the benefit rate declines as
illustrated in Figure 3-6.
For a direct care worker earning $13 per hour, the benefits package translates to a 29.1 percent
benefit rate; for a worker earning $60 per hour, that same benefits package yields a 12.3 percent
rate. For the $14.89 per hour wage assumption for DSPs described above, the benefit rate is 26.4
percent. These rates exclude workers’ compensation, which varies by service, and paid time off,
which is recognized in the rate models as an adjustment to worker productivity as discussed in
the next section.
Direct Care Worker Productivity
In general, direct care workers are not providing direct care all of the time due to other
responsibilities that relate to service delivery. Employees are still working, however, and must be
paid for this time. The costs associated with these activities must be distributed across workers’
billable hours.
For example, if an employee earns $13 per hour with a benefit rate of 30 percent, the cost of that
employee to their employer is $16.90 per work hour or $676.00 per 40-hour workweek.
However, if the employer is only able to bill for 32 hours of direct service per week because the
other 8 hours are devoted to non-billable activities, the billable rate must be inflated to cover the
cost of those non-billable activities. The rate models achieve this by applying a ‘productivity
factor’ that is calculated as the ratio of total work hours to billable hours. In this example, that
would be 40 work hours divided by 32 billable hours, or a productivity factor of 1.25. Applying
the productivity factor to the $16.90 cost per work hour produces $21.13, which is the cost per
0%
5%
10%
15%
20%
25%
30%
35%
$13 $16 $19 $22 $25 $28 $31 $34 $37 $40 $43 $46 $49 $52 $55 $58
Ben
efit
Rate
Hourly Wage
Figure 3-6: Benefit Rate Assumed in Rate Models, by Wage Level
(excludes workers' compensation and paid time off)

DDS Vendor Rate Study
Page 40
BURNS & ASSOCIATES, INC.
Health Policy Consultants March 15, 2019
billable hour that would be included in the rate model to fully compensate the employer for the
$676.00 weekly cost of the employee.
To account for non-billable activities, the rate model for each service first establishes a typical
40-hour workweek for a direct care worker. These workweeks incorporate activities that are
likely to occur during any given week. These activities – and the time spent on each – vary from
service to service and include:
Travel time between individuals applies to services typically delivered in individuals’
homes and the community to account for the time when staff travel from one encounter to
the next.
Program set-up and clean-up applies to day programs and work activity programs to
reflect staff time before and after program hours to prepare for and clean-up after service
time. The models include 1.25 hours per week (15 minutes per day) for all direct care
workers in these programs.
Networking and general developmental activities is included only in the job development
rate model to account for time that job developers spend developing their general
network of providers rather than working on behalf of a specific individual. The model
assumes 5.00 hours per week for this purpose.
Recordkeeping and reporting is included for most services to accommodate
documentation requirements. The time assumptions vary across services, but are
generally higher for ‘professional’ services that usually have more extensive reporting
requirements and for group services since a worker will have to complete documentation
for each service recipient.
Supervision and other employer time reflects workers’ employment-related activities
such as attending staffing meetings or periodic meetings with their supervisors.
Missed appointments are included to reflect the time lost when a recipient has an
unscheduled absence. This adjustment is intended only to accommodate the time that is
not redirected to some other activity. For example, if a two-hour encounter is scheduled
in someone’s home and the worker drives to that home to find that individual is not there,
it is assumed that the staff person will move onto another task. This may not be a billable
activity, but could be catching up on training or recordkeeping. In other words, some
portion of that two-hour appointment would be allocated to the missed appointment
adjustment, but another portion would be associated with the activity to which their time
was redirected.
Collateral contacts are non-billable activities that a worker performs on behalf of an
individual such as coordinating with the individual’s case manager or other service
providers. This factor is applied to job coaching and infant development services. For
certain professional services – such as behavioral supports – the rate study assumes that
the service provider would be able to bill directly for this time.

DDS Vendor Rate Study
Page 41
BURNS & ASSOCIATES, INC.
Health Policy Consultants March 15, 2019
The typical workweeks are then adjusted for training and paid time off, activities that are likely
to be concentrated during specific weeks rather than occurring during a typical week.
As described above, the benefits package for direct care workers assumes that they receive 25
days of paid time off, which translates to 3.85 hours per week (25 days multiplied by 8 hours,
divided by 52 weeks). Paid time off is included in all rate models.
For most paraprofessional services, the rate models assume that staff receive 35 hours of training
annually. For other services, more or less training is included.
Productivity assumptions were informed by data collected through the provider survey and
discussion with DDS’ program staff regarding the amount of time that would be needed to
perform the non-billable activities associated with various services. Productivity assumptions are
detailed in each individual rate model and in Appendix D of the rate model packet.
Program Operations Expenses
Program operations include supervision, quality oversight, training, curriculum development,
and other program-specific activities – functions that are crucial to the delivery of quality
services.
First-line supervision is the single
largest component of program
operations from a cost perspective
and is similarly important in
terms of service oversight. For
these reasons, supervision is
identified as a standalone factor
in the rate models for services
provided by direct support professionals and other paraprofessionals. Rate models for services
provided by staff who are not assumed to require significant supervision, such as board certified
behavior analysts, do not include this factor.
For the applicable services, the rate models provide one supervisor for every ten direct care
workers. This supervisory span of control is slightly less than suggested by provider survey
42 U.S. Department of Health and Human Services. (January 2006). The Supply of Direct Support Professionals
Serving Individuals with Intellectual Disabilities and Other Developmental Disabilities. Retrieved from
https://aspe.hhs.gov/system/files/pdf/74651/DSPsupply.pdf.
“Frontline supervisors have a tremendous
impact on the work environment and on
recruitment and retention success for DSPs.”
- U.S. Dept. of Health and Human Services42

DDS Vendor Rate Study
Page 42
BURNS & ASSOCIATES, INC.
Health Policy Consultants March 15, 2019
respondents that reported an average of 10.3 workers per supervisor for these services.43 The
assumption is also in-line with results reported by researchers44 and included in HCBS rate
models in other jurisdictions45.
For program operations expenses other than supervision, B&A considered using service-specific
program operations amounts in the rate models and the provider survey was designed to collect
cost data by service code. However, it was ultimately concluded that the survey would not
support this level of specificity, for a number of reasons.
Of the more than 1,100 surveys that were submitted, only 416 were incorporated in the analysis
of program operations costs. The balance of surveys was omitted because they did not provide
either revenue or cost data, reported program operations expenses for a service code that
exceeded 50 percent of the revenue they reported for that service code, or did not fully allocate
the expenses that were reported. Although it is possible that there were instances in which a
provider did not incur such costs, there was concern that the inclusion of these surveys would
have understated the cost of program operations. Due to the excluded surveys, there were five or
fewer providers reporting data for 29 of the 69 service codes or service code variations. Another
15 service codes or service code variations had data from between only six and ten providers.
For the remaining service codes, there is significant variability in the program operations rates.
The average gap between the highest and lowest rates is more than 300 percent. This is due to a
number of providers reporting program operations expenses for a service code that exceed the
revenue they reported for that same code. However, even if the analysis is limited to those
providers who reported a program operations rate of 50 percent or less, the gap is 41.3 percent
and the standard deviation in responses is 10.7 percent.
43 This calculation excludes any reported ratio that exceeded 20 workers per supervisor (if all responses were
included, the ratio would be almost 45 workers per supervisor). Very low ratios (for example, one supervisor per
worker) were not excluded from the calculation.
44 A 2007 study conducted by the University of Minnesota found that supervisors oversaw an average of 11.7 DSPs.
Larson, S.A., Doljanac, R., Nord, D. K., Salmi, P., Hewitt, A.S. & O’Nell, S. (2007). National Validation Study of
Competencies For Frontline Supervisors and Direct Support Professionals: Final Report. Minneapolis, MN:
University of Minnesota, Research and Training Center on Community Integration.
45 For example:
Minnesota’s Disability Waiver Rate System provides an 11 percent ‘supervision percent’ that translates to a 1:9 ratio
(https://mn.gov/dhs/partners-and-providers/news-initiatives-reports-workgroups/long-term-services-and-
supports/disability-waiver-rates-system/rate-setting-frameworks/).
Nebraska’s Comprehensive Developmental Disabilities Services waiver reports a 1:9 supervisor span of control
(http://dhhs.ne.gov/developmental_disabilities/Documents/CompleteApplication4154Renewal06012017.pdf).
Australia’s National Disability Insurance Scheme is based on a 1:15 supervision ratio (Cortis, Natasha &
Macdonald, Fiona & Davidson, Bob & Bentham, Eleanor. (2017). Reasonable, necessary and valued: Pricing
disability services for quality support and decent jobs. 10.4225/53/59681e589e44b).

DDS Vendor Rate Study
Page 43
BURNS & ASSOCIATES, INC.
Health Policy Consultants March 15, 2019
As a result, the rate models were grouped together and program operations funding levels were
established for these grouping as follows:
Services generally provided on a one-to-one basis with a rate model that includes a
supervision factor are funded at $10 per day per direct care worker
Services generally provided on a one-to-one basis with a rate model that does not include
a supervision factor are funded at $20 per day per direct care worker
Services generally provided to groups are funded at $20 per day per direct care worker
Residential services are funded at $10 per day per participant
When considering both supervision and other program operations expenses, the rate models
represent an estimated funding increase of 58 percent across all service codes compared to the
costs reported by provider survey respondents with program operations rates of less than 50
percent.
Administrative Expenses
Providers require administrative infrastructure – general management, finance and accounting,
information technology, human resources, etc. – in order to effectively deliver services. The rate
models include funding to support the costs associated with these functions, such as
administrative staff salaries and benefits, facility-related expenses, equipment and supplies,
insurance, professional services (for example, lawyers and accountants), and licensing and
accreditation fees.
Specifically, the rate models
generally include 12 percent of the
total overall rate for administrative
expenses. This is less than the
average administrative rate of 16.9
Current Rates
(w/ 16.9% Admin.)
Recommended Rates
(w/ 12.0% Admin.)
Exp
ense
s
Figure 3-7: Composition of Expenses,
Current Rates and Recommended Rates
Admin. All Other

DDS Vendor Rate Study
Page 44
BURNS & ASSOCIATES, INC.
Health Policy Consultants March 15, 2019
percent reported by participants in the provider survey.46
However, although the administrative rate in the rate models is lower than currently reported, the
administrative funding amount is comparable because the rate is being applied to a higher cost
base, as shown in Figure 3-7. In brief, the rate models seek to maintain existing administrative
funding levels.
Section 3.2: Accounting for Regional Differences
In order to account for differences in costs
across different parts of California, the rate
study includes a separate rate model for each
service for each Regional Center. The rate
study seeks to recognize cost differences in
three areas:
1. Direct care worker wages
2. Travel distances and time
3. Real estate
For each of these items, a baseline figure is established. Then, three cost adjustment factors –
Categories A, B, and C – are constructed to account for regional cost differences. For example,
the adjustment factor for Category A may be 95 percent, Category B may be 100 percent, and
Category C may be 115 percent. Regional Centers are assigned to one of these three categories
for each of the three cost areas. The categorizations may differ for each of the cost areas; for
example, a Regional Center may be assigned to Category A for direct care worker wages and
Category C for travel distance and time. Although it is recognized that costs may vary within a
Regional Center, in the interests of administrative simplicity, the rate study includes a single
categorization for each Regional Center rather than the establishment of county-specific or
locality-specific rate models.
The adjustment factors are then applied to the base rate model to establish the rate model for
each Regional Center. Using the example above, if the base rate model assumes an hourly wage
of $14.00, the rate model for a Regional Center assigned to Category A would include a wage
assumption of $13.30 ($14.00 multiplied by 95 percent), rate models for Category B would
include a $14.00 wage, and models for Category C would include $16.10.
46 This rate was calculated by comparing reported revenues from all sources for developmental disabilities services
to reported expenses for these services. Because this calculation is not limited to funds derived from the Regional
Centers and is a comparison to revenues rather than expenses, this rate cannot be directly compared to the 15 percent
administrative cap established in WIC § 4629.7 and this report expresses no opinion on compliance with the cap.
“The idea that there is a single
business climate in the state that is
applicable for all businesses and
regions is too simplistic.”
- Public Policy Institute of California

DDS Vendor Rate Study
Page 45
BURNS & ASSOCIATES, INC.
Health Policy Consultants March 15, 2019
The remainder of this section provides a brief summary of each of three cost areas, the
adjustment factors, and the assignments for each Regional Center. A more detailed overview of
the methodology can be found in the report, Accounting for Regional Cost Differences Related to
Wages, Travel and Real Estate, which has been included as Attachment 2.
Direct Care Worker Wages
There is substantial variability in wages across the State. As discussed earlier, the rate models
rely on data from the Bureau of Labor Statistics to establish the wage assumption in the base rate
models. The BLS’ regional data was used to establish the wage adjustment factors that account
for regional variability.
In addition to statewide wage statistics, the BLS publishes data for metropolitan statistical areas
and nonmetropolitan statistical areas. MSA and nonmetropolitan statistical areas are comprised
of one or more counties. All counties are assigned to a single area. In California, there are 26
MSAs and 5 nonmetropolitan statistical areas.
The methodology is discussed in greater detail in the companion report noted above, but in brief,
the rate models compare the average wage within a given Regional Center to the statewide
average wage. The methodology included four key elements.
First, since there generally is often not a one-to-one relationship between the BLS’ statistical
areas and Regional Center catchment areas, BLS statistical areas were combined into or
distributed between Regional Centers based on total population.
Figure 3-8 illustrates an example in which a
Regional Center is comprised of two statistical
areas, one with 600,000 residents and the other
with 400,000 residents. In order to calculate an
average wage for the Regional Center overall,
the BLS wage data is weighted between the two
areas using the 60-40 ratio of their respective
populations. Similarly, if a statistical area is
comprised of two counties that are assigned to different Regional Centers, that statistical area is
attributed to both Regional Centers with the weighting within each Regional Center reflecting
the applicable county-level population.
Second, as discussed earlier, BLS wage data is based on a survey of a sample of employers. By
definition, the data for the statistical areas will be based on fewer surveys than the statewide data.
Further, when there are too few surveys covering a given occupation, the BLS does not publish
the wage values. To address this ‘missing’ data and potential survey error, the rate study uses the
average wage across all occupations in an area rather than using data for individual occupations.
Figure 3-8: Example of Combining Two
Areas into a Single Regional Center
Population Avg. Wage
Area 1 600,000 $16.00
Area 2 400,000 $15.00
Total 1,000,000 $15.60

DDS Vendor Rate Study
Page 46
BURNS & ASSOCIATES, INC.
Health Policy Consultants March 15, 2019
However, the average wage in an area is a function of two issues: the mix of occupations and
market-based wage differences. For example, if an area has a large concentration of high-paying
occupations, the average wage across all occupations in that area will be high even if the wage
for each individual occupation is not high. Figure 3-9 illustrates this phenomenon.
Figure 3-9: Illustration of Impact of Job Mix on Average Wage
Occupation Statewide Region 1 Region 2
Employees Wage Employees Wage Employees Wage
Calculation of Average Wage Without Adjusting for Job Mix
Engineer 100 $82.00 80 $80.00 20 $90.00
Housekeeper 100 $24.00 20 $20.00 80 $25.00
Average 200 $53.00 100 $68.00 100 $38.00
Calculation of Average Wage After Adjusting for Job Mix
Engineer 100 (50%) $82.00 80 50% $80.00 20 50% $90.00
Housekeeper 100 (50%) $24.00 20 50% $20.00 80 50% $25.00
Adjusted Avg. $53.00 $50.00 $57.50
% of Statewide 94.3% 108.5%
In this simple example, there are only two regions in the state and everyone works in one of two
occupations, engineering or housekeeping. The top portion of the table shows the ‘actual’
employment and wage data. In Region 1, most workers are engineers; in Region 2, most are
housekeepers. The average hourly wage across the 100 workers in Region 1 is $68.00, which is
markedly higher than the $38.00 average in Region 2. Closer inspection, however, reveals that
Region 1 is not truly a higher wage area. Both engineers and housekeepers working in Region 1
earn less than those in the same occupations in Region 2. It is only because of the job mix – the
relative number of workers in the two jobs – that Region 1 appears to have higher wages.
This is mathematically demonstrated in the bottom portion of the table. These figures calculate
the average wage in each of the regions as if the mix of jobs in those regions were the same as
the statewide job mix, which in this example is 50 percent engineers and 50 percent
housekeepers. This permits a comparison of average wages that is not influenced by the
distribution of jobs. The adjusted figures show that Region 2 is actually the higher wage area.

DDS Vendor Rate Study
Page 47
BURNS & ASSOCIATES, INC.
Health Policy Consultants March 15, 2019
The third key element of the analysis of regional variation in wages is a similar calculation of an
average adjusted wage in each Regional Center based on the statewide mix of occupations and
the region-specific wage data. The adjusted regional wages were then compared to the statewide
average.
Fourth, the adjusted average regional wages – expressed as a percentage of the statewide average
wage – were used to assign each Regional Center to one of three categories with an associated
base wage adjustment factor. Category A includes Regional Centers in which the average wage
is between 83 and 94 percent of the statewide average, and has a 95 percent adjustment factor.
Category B, with a 100 percent adjustment factor, includes Regional Centers in which the
average wage is 95 and 98 percent of the statewide average. Regional Centers with average
wages between 106 and 115 percent of the statewide average were assigned to Category C,

DDS Vendor Rate Study
Page 48
BURNS & ASSOCIATES, INC.
Health Policy Consultants March 15, 2019
which has a 115 percent adjustment factor. The geographic distribution of these category
assignments are depicted in Figure 3-10.
As shown on the map, Category C includes three Regional Centers in the San Francisco Bay
Area: East Bay, Golden Gate, and San Andreas. Category B includes North Bay Regional Center
Figure 3-10: Assignment of Wage Adjustment Factors by Regional Center

DDS Vendor Rate Study
Page 49
BURNS & ASSOCIATES, INC.
Health Policy Consultants March 15, 2019
as well as the southern coastal Regional Centers, including the Los Angeles and San Diego
metropolitan areas. The remainder of the Regional Centers are assigned to Category A.
As described in the previous section, the BLS wage data was adjusted to account for changes in
the statewide minimum wage through 2020, when it will be $13.00 per hour. The rate models do
not specifically consider local minimum wage ordinances, but the wage adjustment factors result
in wage assumptions that exceed applicable local minimum wages, with one significant
exception. The City of Los Angeles, unincorporated areas of Los Angeles County, and other
jurisdictions within the county are scheduled to institute a $15.00 minimum wage in 2020. As
noted on the map, the Los Angeles-area Regional Centers are assigned to Category B and several
of the rate models for this category include a wage assumption that is less than $15.00. As
emphasized in the Part 2 of this report, however, the rate model assumptions are not prescriptive
and it is expected that, for any given provider, some costs will be less than assumed and other
costs will be greater. In these instances, taken together the total direct care worker compensation
built into the rate models still exceeds all applicable state and federal requirements related to
wages, paid leave, and payroll taxes.
Travel Distance and Time
Home and community-based service providers incur costs when traveling to individuals’ homes
and transporting them in the community, both in terms of staff time and vehicle-associated
expenses. These costs, of course, increase in relation to the length of a trip and the time to
complete the trip. Given the substantial differences across California in terms of geography and
population density, the rate models include an adjustment factor for travel.
The primary method for comparing Regional Centers and developing the travel adjustment
factors involved measuring the travel time and distance between providers and the individuals to
whom they provide services. The claims-based analysis employed the following steps:
1. Geocoding the address (that is, identifying latitude and longitude) of every individual in
the Client Master File and of every vendor in DDS’ vendor file.
2. Identifying every individual-vendor pairing with a paid claim in fiscal year 2017 for in-
scope services.
3. Using Bing Maps to measure the driving distance and time between each of the pairings,
assuming that the travel occurred on a Tuesday at 10:00 AM.
4. The distances and times for trips deemed valid47 were aggregated and averaged across all
services.
47 The analysis excluded trips when the individual and the vendor had the same address, when either the individual
or the vendor had an address outside of California, when the length of the trip exceeded 100 miles, or when Bing
Maps could not identify the address (a likely indication that the address was incorrect).

DDS Vendor Rate Study
Page 50
BURNS & ASSOCIATES, INC.
Health Policy Consultants March 15, 2019
5. Average distances and times were computed for both the State as a whole and for each
Regional Center, with the Regional Center figures presented as a percentage in relation to
the statewide figure.
The travel distance and travel time percentages in relation to the statewide figures were averaged
for each Regional Center in order to establish a single composite value. Based on these values,
each Regional Center was assigned to one of three travel categories with a corresponding
adjustment factor. Category A has a 90 percent adjustment factor and includes Regional Centers
with composite values between 75 and 92 percent of the statewide figure. Regional Centers with
a composite value between 97 and 109 percent were assigned to Category B with an adjustment
factor of 105 percent. Category C includes Regional Centers with a composite value between
119 and 133 percent and has a 125 percent adjustment factor.
There are a couple of acknowledged limitations to the travel time and distance analysis. First, the
vendor addresses on file may not represent the location from which the worker was dispatched
because, for example, it is the address for an administrative location. Second, the analysis cannot
account for scheduling efficiencies. For example, if a vendor delivers services to two individuals
who are neighbors, they may send a worker who provides a service to the first individual and
then walks next door to provide services to the second. The analysis, however, assumes that the
worker travels from the office for each encounter.
For these reasons, the analysis was not used to estimate the travel distance and time included in
the base rate models; instead the assumptions in the base rate models were informed primarily by
data from the provider survey. Rather, the time and distance analysis was utilized to estimate
relative differences, which were then translated to the adjustment factors.
Additionally, a secondary analysis was performed to confirm the findings of the claims-based
analysis. Using data from the 2010 decennial census48, the population density – measured as the
number of residents per square mile of land area – was calculated for each Regional Center. The
Regional Centers were then categorized based on this data, with those with fewer than 300
people per square mile assigned to Category C, those with between 300 and 800 people per
square assigned to Category B, and those with more than 800 people per square mile assigned to
Category A.
The results largely affirmed the claims-based analysis, but the population density-based analysis
yielded a different categorization for seven Regional Centers. When the results differed for a
Regional Center, the rate study assigns the higher of the categorizations (that is, in the four
instances in which the population density analysis produced a lower category, the original
claims-based category is retained). This resulted in three Regional Centers – Central Valley,
48 United States Census Bureau. Table GCT-PH1: Population, Housing Units, Area, and Density: 2010 – United
States – County by State and for Puerto Rico (2010 Census Summary File 1). Retrieved from
https://factfinder.census.gov/faces/tableservices/jsf/pages/productview.xhtml?src=bkmk.

DDS Vendor Rate Study
Page 51
BURNS & ASSOCIATES, INC.
Health Policy Consultants March 15, 2019
Kern, and Redwood – being moved to Category C. Figure 3-11 illustrates the assumed travel
time and distance categorizations.
As depicted in the map, only Golden Gate Regional Center and four of the Los Angeles County
Regional Centers are assigned to Category A. The rest of the Los Angeles County and coastal
area Regional Centers are assigned to Category B, with the exception of Redwood Coast and Tri-
Counties Regional Centers, which are assigned to Category C along with the interior Regional
Centers.
Figure 3-11: Assignment of Travel Adjustment Factors by Regional Center

DDS Vendor Rate Study
Page 52
BURNS & ASSOCIATES, INC.
Health Policy Consultants March 15, 2019
Real Estate
The final adjustment factor relates to real estate costs. This factor only applies to services with
space in which direct care is delivered, primarily center-based day programs.
The rate study relied on published reports on real estate costs for industrial, retail, and office
space from LoopNet49 (a subsidiary of CoStar Group) and Colliers International50. The data from
LoopNet was more complete in terms of offering data for more counties of the State so it was the
primary source for the analysis. The Colliers data, however, is more current, reflecting the
second quarter of 2018 compared to June 2016 for the LoopNet data and was reviewed for
comparative purposes.
Due to the age of the data and the fact that it covers a variety of types of commercial space, the
analysis was not used to set the real estate cost assumption in the base rate model. Rather, the
analysis was used to identify the relative differences in real estate expenses across the State.
The county-level information reported by LoopNet was combined for each Regional Center and
weighted based on the county’s population to determine an average cost per square foot for that
Regional Center. For each type of real estate, the Regional Center average was compared to the
statewide average. The average of these ratios was used to assign each Regional Center to a
category with a corresponding adjustment factor.
Category A has an adjustment factor of 80 percent and includes Regional Centers with an
average cost that is between 51 and 86 percent of the statewide average. Regional Centers with
costs that range from 97 percent to 116 percent of the statewide average were assigned to
Category B and an adjustment factor of 115 percent. The remaining Regional Centers had costs
that were 131 to 136 percent of the statewide average and were assigned to Category C with a
130 percent adjustment factor. Figure 3-12 illustrates the distribution of the categories.
49 LoopNet. Market Trends data. (June 2016). Retrieved from https://www.loopnet.com/Los-
Angeles_California_Market-Trends/. 50 Colliers International. A Snapshot of Greater Los Angeles as of Quarter 2. Retrieved September from
https://www2.colliers.com/en/United-States/Cities/Los-Angeles.

DDS Vendor Rate Study
Page 53
BURNS & ASSOCIATES, INC.
Health Policy Consultants March 15, 2019
The map shows that three Regional Centers – East Bay, Golden Gate, and San Andreas – are
assigned to Category C. The Regional Centers on the southern coast and those in the Los
Angeles area are included in Category B while the remainder of the State is in Category A.
Figure 3-12: Assignment of Real Estate Adjustment Factors by Regional Center

DDS Vendor Rate Study
Page 54
BURNS & ASSOCIATES, INC.
Health Policy Consultants March 15, 2019
PART 4: RATE MODELS AND RELATED POLICY ASSUMPTIONS
Following the process described in Part 3 of this report, rate models have been constructed for
each of the services within the scope of the vendor rate study. These rate models have been
developed in accordance with State and federal requirements.
Section 4.1: System-Wide Elements of the Rate Models
Consistent with the requirements of ABX2-1, the rate study includes a number of assumptions
that have system-wide implications.
Supply of Providers
As noted in Part 1 of this report, ABX2-1 states that the rate study should consider the supply of
providers when evaluating the effectiveness of rate-setting methodologies.
The supply of providers is influenced by a number of factors that include, but are not limited to,
payment rates. For example, there is a national shortage of staff in a variety of professions (board
certified behavior analysts, for instance) resulting in a demand for their services that exceeds the
supply irrespective of payment rates;51 historically low unemployment rates have made it
difficult for employers across industries to fill positions; and a community’s amenities influence
decisions regarding where to provide services.52
Although payment rates cannot address all of these factors, the rate models produced as part of
the rate study are designed to support services across the State and across demographic groups.
Fundamentally, the rate models are built upon market data that is intended to compensate
providers for the estimated cost of delivering services. The rate study recognizes that costs can
differ dramatically across California. Statewide rates, therefore, can result in rates that are too
high in lower cost areas, but too low in higher cost areas, which may constrain that area’s supply
of providers. To account for differences in costs associated with wages, travel, and real estate,
for every service in the rate study, a separate rate model has been constructed for each of the 21
Regional Centers. The development of these regional rate models is intended to help to support
the supply of providers across the State, recognizing that barriers unrelated to rates may remain.
51 See, for example: President’s Committee for People with Intellectual Disabilities. (2017). Report to the President
2017: America’s Direct Support Workforce Crisis: Effects on People with Intellectual Disabilities, Families,
Communities and the U.S. Economy. Retrieved from https://www.nadsp.org/wp-content/uploads/2018/02/PCPID-
2017_-Americas-Direct-Support-Workforce-Crisis-low-res.pdf.
52 Knowledge@Wharton, University of Pennsylvania. (October 24, 2017). The Headquarters Checklist: How Do
Companies Pick a Location? Retrieved from http://knowledge.wharton.upenn.edu/article/headquarters-checklist-
companies-pick-location/.

DDS Vendor Rate Study
Page 55
BURNS & ASSOCIATES, INC.
Health Policy Consultants March 15, 2019
In addition to geographically-driven differences in service levels and usage, a series of reports
has identified disparities in service utilization based on race/ ethnicity and language. For
example, an analysis presented by DDS in May 2017 found that both authorization and
expenditures are highest for White consumers.53 Similarly, results from the individual and family
survey found generally lower satisfaction regarding services and access to supports among
people of color. Although the source of these disparities is likely far more complicated than
payment rates alone, the rate models include elements intended to positively impact the issue.
First, the rate study assumes that direct care workers would be required to receive cultural
competency training as part of the 35 hours of annual training built into most rate models.
Second, the rate models for most paraprofessional services include a higher ‘non-English’ rate
for providers serving individuals who speak a language other than English, including American
Sign Language, when services are provided by a direct care worker who speaks the consumer’s
language. The rates are based on an assumed stipend of $100 per month. This stipend amount
($0.58 per hour plus the cost of additional payroll taxes) is added to the underlying rate model.
Policies would need to be developed in order to confirm the language needs of individuals served
and to define how workers would demonstrate competency in the non-English language.
Although the rate study does not offer a specific quantifiable standard for the ‘right’ number and
mix of providers and it must be acknowledged that rates are not the only factor that influence the
supply of providers, the rate study seeks to establish rates that positively impact the supply and
quality of services throughout the State and for all groups.
Standardization and Simplification
ABX2-1 required that the rate study include an evaluation of the number and type of service
codes. Consistent with that mandate, one of the underlying premises of the rate study is that, to
the greatest extent practicable, a given support should fit into only one service code and that
service code should be the same regardless of the Regional Center in which the support is being
provided.
A necessary precursor to the evaluation of the use of service codes is an understanding of the
requirements associated with each service code. However, for many service codes, particularly
‘miscellaneous’ service codes, there is limited guidance and structure. For example, the only
definition identified for service code 063 for community activities support services – for which
nearly $50 million was spent in fiscal year 2016-17 – is “support on a time-limited basis to
53 Department of Developmental Services. May 2017. Efforts to Address Disparities: Submitted in Response to
March 14, 2017 Senate Human Services Committee Request.

DDS Vendor Rate Study
Page 56
BURNS & ASSOCIATES, INC.
Health Policy Consultants March 15, 2019
accomplish various activities for consumers.”54 Based on the definition alone, any service could
be provided under this service code.
This is not to suggest that Regional Centers are not managing the use of this service code
according to their own policies. Additionally, the role that the miscellaneous codes have played
in providing supports to individuals, particularly given rate caps and freezes, is recognized.
However, in order to develop rate models, there needs to be a shared understanding of what
services are being provided, the activities that are and are not allowable, the qualifications of the
staff delivering the service, and billing rules. Consequently, the rate study assumes that
requirements would need to be established, enhanced, or otherwise updated to ensure
standardized statewide service definitions. This effort will entail significant workload given the
number of service codes and the need to change statute and regulations, as well as State
guidelines. Relevant assumptions that were made in regards to policy changes when developing
the rate models are noted in the service-specific discussion in the next section of this report.
Even for those services already defined in regulation, a review of current utilization data
demonstrates that there are significant differences in how service codes are used across the
Regional Centers. For example, service code 645 covers mobility training services, which are
defined as services that “teach individuals how to use public transportation or other modes of
transportation which will enable them to move about the community independently.”55 Given the
importance of transportation in terms of accessing the community, it is a near-certainty that these
supports are delivered in every Regional Center. However, service code 645 was billed in only 9
of the 21 Regional Centers in fiscal year 2016-17. Further, statewide billings totaled only
$300,000. It is likely that supports that meet the regulatory definition – even in those Regional
Centers in which this service code was used – are being billed under other service codes, such as
those that cover independent living and supported living services. The rate study therefore
assumes that service code 645 would be eliminated. To be clear, the supports would continue to
be offered, but they would be subsumed by another service, primarily independent living.
The rate study assumes that several other service code consolidations would occur. Significantly,
the rate study assumes that most medical and clinical services would be billed under the service
code that corresponds to the professional delivering the service. For example, service code 772 is
established for physical therapists. However, physical therapists are currently billing under a
variety of service codes in addition to 772, including 103 for specialized health, treatment, and
training services; 115, 116, and 117 for specialized therapeutic services; and 805 for infant
development programs. The rate study assumes that physical therapists would be limited to
billing under service code 772 and that other clinicians would similarly bill under the applicable
54 Valley Mountain Regional Center. June 16, 2009. Service Code Listing-Numeric. Retrieved from
https://www.vmrc.net/wp-content/uploads/2013/10/Service-Code-Listing-Numeric-wT17Req.pdf.
55 17 CCR § 54342(a)(47).

DDS Vendor Rate Study
Page 57
BURNS & ASSOCIATES, INC.
Health Policy Consultants March 15, 2019
service code. Consequently, several service codes – but not the services themselves – would be
eliminated:
048 for client/ parent support behavior intervention training
605 for adaptive skills training
103 for specialized, health, treatment, and training
115 for specialized therapeutic services for individuals between three and 20 years old
116 for specialized therapeutic services for individuals under three years of age
117 for specialized therapeutic services for individuals 21 years and older
The supports currently being delivered under these codes would transition to the service code
that corresponds to the staff providing the service as described in the physical therapy example
above. The service codes to which the supports would transition are typically subject to the
schedule of maximum allowances; that is, rates set by the Department of Health Care Services.
Additionally, it is recognized that there would be limited circumstances in which a higher rate
may be needed to support some individuals. In this case, Regional Centers would be able to
authorize an enhanced rate – a 39.7 percent increase above the standard rate as employed in the
California Children’s Services program for physician services – pursuant to guidelines that
would be established by DDS.
In some instances, the rate study assumes that a service code would be divided into
subcomponents. For example, it is assumed that service code 952 for individual supported
employment would be broken into job development and job coaching functions. This would be
accomplished through the development of a new service code or the establishment of subcodes.
The assumptions related to both consolidations and disaggregations are noted in the service-
specific discussion that follows in the next section.
The rate study assumes that services delivered under service code 106 for specialized
recreational therapy would be billed based on usual and customary rates in order to align
payment for these services with the rates paid by individuals outside of the DDS system.
By standardizing service definitions, service code and subcode usage, and billing rules,
standardized rate models can be developed. As described in Part 3 of this report, the rates would
vary across the State to account for regional differences, but the rate model structures and factors
would be consistent. A description of the rate models for each service included in the vendor rate
study is included in Section 4.2.

DDS Vendor Rate Study
Page 58
BURNS & ASSOCIATES, INC.
Health Policy Consultants March 15, 2019
Quality and Outcomes
There is a shared desire amongst payers, providers, and consumers to align payments with the
quality of services and outcomes for individuals. Both issues are elements of the rate study
required by ABX2-1.
As discussed in Part 1 of this report, there has been relatively little progress in tying HCBS
payments to quality and outcomes. This is due, in part, to a lack of agreement on what should be
measured and how to conduct the measurement. Whereas quality outcomes are both identifiable
and measurable in the medical care field (for example, there are well-defined standards related to
preventative care, disease management, preventing errors such as hospital-acquired infections
and readmissions, etc.), the goals of HCBS are less clear or, at least, less measurable. For
example, most I/DD systems have a goal that is akin to ‘helping individuals to achieve the
maximum level of independence’. Measures of independence can be constructed: where do
individuals live, how much time do individuals spend with community supports rather than paid
staff, where do individuals spend their day, etc. However, the ‘maximum level of independence’
is going to vary from one person to the next based on their level of disability, their access to
natural supports, and their preferences.
Thus, rather than seeking to define specific outcomes and a framework for measuring these
outcomes, the rate models include elements that are indirect determinants of the quality of
services and positive outcomes for individuals.
The direct care worker is the ‘face’ of the I/DD system, working with consumers on a daily
basis. As such, these workers are perhaps the primary determinant of the quality of services as
well as individuals’ satisfaction.
For this reason, the rate models
include a number of assumptions
intended to support a quality
workforce. These assumptions,
which are detailed in Part 3 of this
report, include:
Market-based wages and a comprehensive benefits package
A requirement that most staff receive 70 hours of training over their first two years of
employment
Funding for productivity assumptions that reflect non-billable responsibilities that are
necessary to be effective in the job, such as receiving feedback from their supervisor
56 The Council on Quality and Leadership. September 25, 2018. Empowering the Direct Support Professional
Workforce. Retrieved from https://c-q-l.org/resource-library/resource-library/all-resources/empowering-the-direct-
support-professional-workforce.
“DSPs are central to the quality of life of
people with IDD, including human security,
community, relationships, choice, and goals.”
- The Council on Quality and Leadership56

DDS Vendor Rate Study
Page 59
BURNS & ASSOCIATES, INC.
Health Policy Consultants March 15, 2019
These assumptions are intended to support a quality workforce. Although not included in the
fiscal impact associated with this report, the rate models include the option for DSP ‘levels’
whereby staff who receive more training and demonstrate greater competency are assigned to a
level that is attached to higher payment rates, to reflect higher wages.
The development of the credentialing system needed to support DSP levels would require the
establishment of infrastructure both within DDS and within the provider community to adopt or
create the criteria for the levels, to track who achieves each credential, and to develop of billing
guidelines. This would be a significant and important undertaking that should include
participation by providers, DSPs, and consumers.
In addition to effective direct care workers, quality services require internal supervisory and
support capacity. As noted in Part 3 of the report, the rate models recognize the importance of
these functions by increasing funding for them by an estimated 58 percent.
Section 4.2: Rate Models and Associated Policy Changes
This section provides the following information for each service for which a rate model has been
developed:
The existing service code or codes that correspond to the title used in the rate model, as
applicable
A high-level description of the service and any changes to existing requirements
The time-based billing unit (for example, an hour or month of service)
The rate variants that apply (for example, rates that vary based on staffing ratio)
This section is organized based on groupings of related services:
Personal supports and training services. The first grouping includes services that are
generally provided in the community on an individualized basis by paraprofessionals,
such as personal assistance, independent living, most supported living, and respite.
Residential services. The next grouping includes full-time residential care, including
community care facilities, specialized residential facilities, family home agencies, and
certain shared supported living programs.
Day, employment, and transportation services. This grouping includes community-based
day programs, individual and group employment, work activity programs, and
transportation.
Professional and behavioral services. The final grouping generally includes services
provided by licensed professionals or staff working under the supervision of such
professionals.

DDS Vendor Rate Study
Page 60
BURNS & ASSOCIATES, INC.
Health Policy Consultants March 15, 2019
Personal Assistance
062-Personal Assistance
The service assists individuals with personal care and activities of daily living.
Overview of Rate Models
Billing Unit Hour
Rate Models Geography-based rates
Non-English stipend
Group services (allowable ratios of 1:2 and 1:3)
Service duration (encounters of more or less than six hours)
Parent-Coordinated Personal Assistance
093-Parent-Coordinated Personal Assistance
The service assists individuals with personal care and activities of daily living through a self-
directed model. The service requires the use of a Financial Management Service.
Since there is no agency infrastructure associated with this service, the rate model for this service
does not include funding for program operations or administrative expenses.
Overview of Rate Models
Billing Unit Hour
Rate Models Geography-based rates
Non-English stipend
Group services (allowable ratios of 1:2 and 1:3)

DDS Vendor Rate Study
Page 61
BURNS & ASSOCIATES, INC.
Health Policy Consultants March 15, 2019
Independent Living Services
520-Independent Living Program
645-Mobility Training Services Agency
055-Community Integration Training Program (equivalent home- and
community-based supports)
063-Community Activities Support Services (equivalent home- and
community-based supports)
The service teaches consumers to live independently and/or provide the supports necessary for
the consumer to maintain a self-sustaining, independent-living situation in the community.
The rate study assumes that service codes 520 and 645 as well as equivalent services delivered
through service codes 055 and 063 would be combined into a single code.
Overview of Rate Models
Billing Unit Hour
Rate Models Geography-based rates
Non-English stipend
Group services (allowable ratios of 1:2 and 1:3)
Service duration (encounters of more or less than six hours)
Independent Living Specialist
635-Independent Living Specialist
650-Mobility Training Services Specialist
The service teach consumers to live independently and/or provide the supports necessary for the
consumer to maintain a self-sustaining, independent-living situation in the community.
Since there is no agency infrastructure associated with this service, the rate model does not
include program operations and administrative expenses are funded at one-half of the standard
rate.
Overview of Rate Models
Billing Unit Hour
Rate Models Geography-based rates
Non-English stipend
Group services (allowable ratios of 1:2 and 1:3)
Service duration (encounters of more or less than six hours)

DDS Vendor Rate Study
Page 62
BURNS & ASSOCIATES, INC.
Health Policy Consultants March 15, 2019
Supported Living Services
894-SLS Vendor Administration
896-Supported Living Service (Individual)
The service covers a number of supports for individuals living in their own home, including
assisting with common daily living activities, performing routine household activities, locating
and scheduling appropriate medical services; selecting and moving into a home; locating and
choosing suitable house mates; becoming aware of and effectively using the transportation,
police, fire, and emergency help available in the community; managing personal financial affairs;
building and maintaining interpersonal relationships; and participating in community life.
Supported Living Services would be divided into two separate service modalities. The separation
is based on whether staffing is provided on a 24-hour basis (excepting time when the individual
may be participating in other paid supports such as an employment or day program) and on
whether staff are dedicated to a single housing unit or support multiple units.
Programs in which staff supports multiple housing units (for example, in an apartment complex
in which staff ‘float’ between units) on a 24-hour basis would be referred to as Shared Living-
Community and are grouped into the residential services section. Programs in which a worker is
only responsible for an individual or individuals behind a single ‘front door’ are summarized
here.
The rate models include administrative costs so service code 894 would be eliminated.
Overview of Rate Models
Billing Unit Hour
Rate Models Geography-based rates
Non-English stipend
Group services (allowable ratios of 1:2 and 1:3)
Service duration (encounters of more or less than six hours)

DDS Vendor Rate Study
Page 63
BURNS & ASSOCIATES, INC.
Health Policy Consultants March 15, 2019
Parent-Coordinated Supported Living
073-Parent Coordinated Supported Living
The service covers a number of supports for individuals living in their own home, including
assisting with common daily living activities, performing routine household activities, locating
and scheduling appropriate medical services; selecting and moving into a home; locating and
choosing suitable house mates; becoming aware of and effectively using the transportation,
police, fire, and emergency help available in the community; managing personal financial affairs;
building and maintaining interpersonal relationships; and participating in community life. The
service requires the use of a Financial Management Service.
Since there is no agency infrastructure associated with this service, the rate model for this service
does not include funding for program operations or administrative expenses.
Overview of Rate Models
Billing Unit Hour
Rate Models Geography-based rates
Non-English stipend
Group services (allowable ratios of 1:2 and 1:3)
Parenting Support Services
108-Parenting Support Services
The service provides training to individuals who are parents or anticipate becoming parents.
The rate models assume that direct care workers must have a bachelor’s degree in a public health
or education field. As a result, it is expected that some services currently being delivered through
this service code would not meet these requirements and would need to transition to some other
service such as Independent Living or Supported Living.
Overview of Rate Models
Billing Unit Hour
Rate Models Geography-based rates
Non-English stipend
Group services (allowable ratios of 1:2 and 1:3)
DDS Vendor Rate Study
Page 64
BURNS & ASSOCIATES, INC.
Health Policy Consultants March 15, 2019
Tutor Services
025-Tutor Services
680-Tutor
The service provides instruction to individuals that is supplementary to, or independent of,
instruction provided by the classroom teacher. The rate study assumes the two service codes
would be consolidated and limited to adults receiving post-high school instruction.
The rate models assume that tutors must have a bachelor’s degree in a relevant field. As a result,
it is expected that some services currently being delivered through these service codes would not
meet these requirements and would need to transition to some other service such as Personal
Assistance or Independent Living.
Overview of Rate Models
Billing Unit Hour
Rate Models Geography-based rates
Non-English stipend
Group services (allowable ratios of 1:2 and 1:3)
Respite, Agency
862-In-Home Respite Services Agency (excluding employer of record)
The service provides intermittent support to individuals to support or relieve primary caregivers
for the benefit of the individual. Services delivered through an employer of record model would
be transitioned to participant-directed respite.
Overview of Rate Models
Billing Unit Hour
Rate Models Geography-based rates
Non-English stipend
Group services (allowable ratios of 1:2 and 1:3)
Service duration (encounters of more or less than six hours)

DDS Vendor Rate Study
Page 65
BURNS & ASSOCIATES, INC.
Health Policy Consultants March 15, 2019
Participant-Directed Respite
420-Voucher Respite
465-Participant-Directed Respite Services
862-In-Home Respite Services (employer of record)
864-In-Home Respite Worker
The service provides intermittent support to individuals to support or relieve primary caregivers
for the benefit of the individual. The rate study assumes that service codes 420, 465, and 864 as
well as services delivered through an employer of record model through service code 862 would
be combined into a single service code. The service requires the use of a Financial Management
Service.
Since there is no agency infrastructure associated with this service outside of the FMS, the rate
model for this service does not include funding for program operations or administrative
expenses.
Overview of Rate Models
Billing Unit Hour
Rate Models Geography-based rates
Non-English stipend
Group services (allowable ratios of 1:2 and 1:3)

DDS Vendor Rate Study
Page 66
BURNS & ASSOCIATES, INC.
Health Policy Consultants March 15, 2019
Housekeeping
858-Homemaker
860-Homemaker Services
The service would provide assistance with routine household activities at an individual’s home.
An individual would be limited to three hours of service per week.
Existing supports billed under service codes 858 and 860 that are used to provide personal
assistance or companion services would need to transition to some other service such as Personal
Assistance or Independent Living.
The rate model for this service does not including program operations funding and administrative
expenses are funded at one-half of the standard rate.
Overview of Rate Models
Billing Unit Hour
Rate Models Geography-based rates
Group services (allowable ratios of 1:2 and 1:3)
Program Support Group-Other Services
111-Program Support Group-Other Services
The service provides time-limited supplemental staffing for programs other than day or
residential programs for individuals that require additional staffing within their programming.
Since this service only provides additional staffing for existing programs, the rate model does not
include program operations funding and administrative expenses are funded at one-half of the
standard rate.
Overview of Rate Models
Billing Unit Hour
Rate Models Geography-based rates

DDS Vendor Rate Study
Page 67
BURNS & ASSOCIATES, INC.
Health Policy Consultants March 15, 2019
Community Care Facility-Staff Operated
915-Residential Facility Serving Adults-Staff Operated
920-Residential Facility Serving Children-Staff Operated
The services provide care to adults and children in licensed facilities with ‘shift’ (rather than
live-in) staff.
The rate models assume that the current distinction between homes with four or fewer
individuals and those with five or more individual would be maintained except that there would
be a new distinction between homes with five or six residents and those with seven or more
residents. Rate models have not been developed for homes with seven or more residents (that is,
it is assumed that these rates would not change).
The rate models assume that the existing 11 support levels (which excludes level 1, which is a
room and board only payment) would be collapsed into five levels with the following staff hour
assumptions:
Current
Level(s)
New
Level
Staff Hours – Homes w/ Fewer
Than 4 Beds
Staff Hours – Homes w/ 5 or 6
Beds
Total Net of
Administrator
Total Net of
Administrator
2 2 168 128 168 128
3/ 4A/ 4B 3 180 140 220 180
4C/ 4D/ 4E 4 220 180 280 240
4F/ 4G/ 4H 5 260 240 340 320
4I 6 300 280 400 380
In terms of these staffing assumptions:
The first 168 staff hours in the table reflect coverage (i.e., vendor must have staff
available, but staff do not need to be onsite if no consumers are present) so the rate
models count home administrator hours to meet a portion of the requirement (i.e., they
can provide on-call coverage)
The rate models assume 8 hours per day at a higher ‘lead DSP’ wage
It is assumed that overnight staff are permitted to sleep in Level 2 and 3 homes only if all
consumers’ IPPs state that they do not require awake staff
The rate models fund overnight hours in Level 2, 3, and 4 homes at minimum wage

DDS Vendor Rate Study
Page 68
BURNS & ASSOCIATES, INC.
Health Policy Consultants March 15, 2019
Five percent of work hours for line staff and lead staff are assumed to be paid at an
overtime wage (time-and-a-half)
The rate models do not assume any changes to the room and board component of the payment
for this service, which is tied to Supplemental Security Income/ and State Supplementary
Payment (SSI/SSP) amounts.
Due to the variability in the staffing requirements for homes that serve individuals with
extraordinary needs, there is a customizable rate model that would be used to determine the rate.
These values are ‘priced’ according to standardized cost assumptions in order to produce the rate
for a given residence. For example, the cost per staff hour is fixed in the rate model, but the
number of staff hours for a residence is customized to a specific location. Costs would be
calculated for the home overall and equally spread across the individuals in the home (that is, all
consumers in a given home would have the same rate).
Overview of Rate Models
Billing Unit Month
Rate Models Geography-based rates
Non-English stipend
Level of need
Home size/number of placements

DDS Vendor Rate Study
Page 69
BURNS & ASSOCIATES, INC.
Health Policy Consultants March 15, 2019
Adult Residential Facility, Persons with Special Health Care Needs
(ARFPSHN)
113-Specialized Residential Facility
Service code 113 currently includes ARFPSHNs and other specialized residential facilities
(SRF). The rate study assumes that SRFs would be transitioned to the community care facility
service codes and that service code 113 would be limited to ARFPSHNs.
ARFPSHNs are adult residential facilities that provide 24-hour health care and intensive support
services in a homelike setting that is licensed to serve up to five adults with developmental
disabilities in accordance with the requirements of WIC § 4684.50 et seq.
Due to the variability in the staffing requirements across AFRPSHNs, the rate study does not
include fixed rates for these residences. Rather, there is a customizable rate model in which
approved home size, staff hours, and consultant hours are input. These values are ‘priced’
according to standardized cost assumptions in order to produce the rate for a given residence. For
example, the cost per staff hour is fixed in the rate model, but the number of staff hours for a
residence is customized to a specific location. Costs would be calculated for the home overall
and equally spread across the individuals in the home (that is, all consumers in a given home
would have the same rate).
The rate model assumes that all direct care workers in the home are certified nursing assistants.
Overview of Rate Models
Billing Unit Month
Rate Models Geography-based rates
Non-English stipend (requires that the individual have onsite access to a
staff person that speaks their language at all times)
Facility size/number of placements
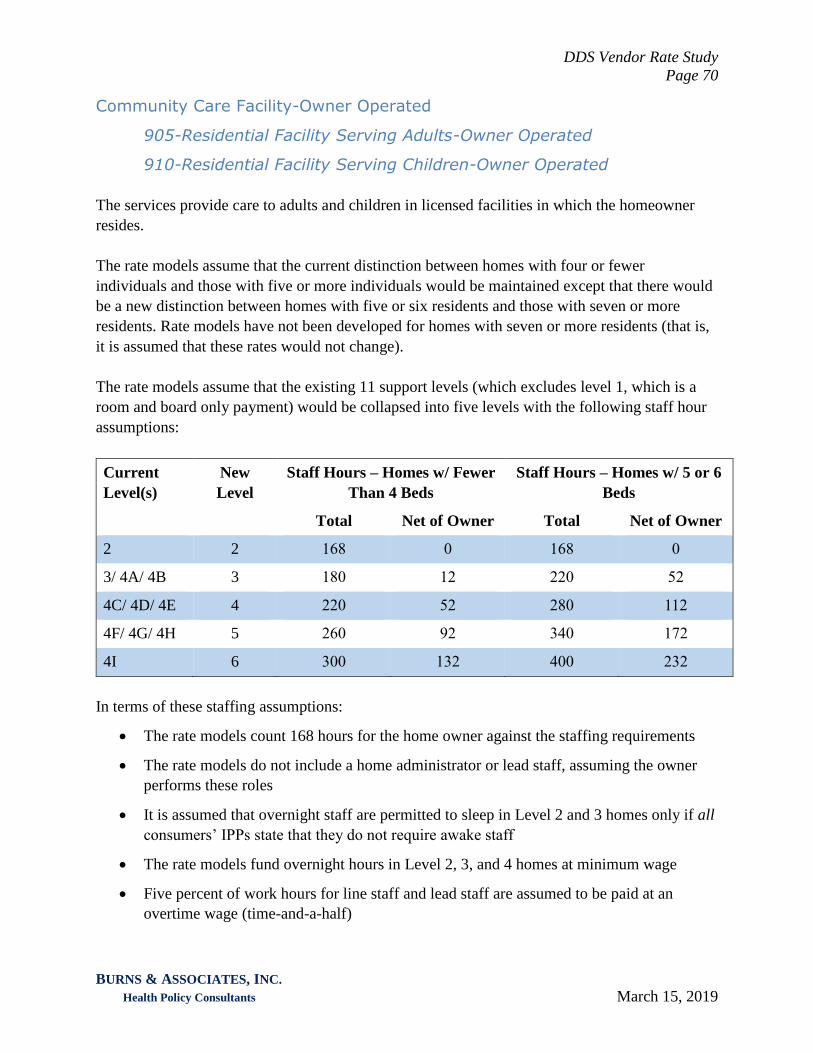
DDS Vendor Rate Study
Page 70
BURNS & ASSOCIATES, INC.
Health Policy Consultants March 15, 2019
Community Care Facility-Owner Operated
905-Residential Facility Serving Adults-Owner Operated
910-Residential Facility Serving Children-Owner Operated
The services provide care to adults and children in licensed facilities in which the homeowner
resides.
The rate models assume that the current distinction between homes with four or fewer
individuals and those with five or more individuals would be maintained except that there would
be a new distinction between homes with five or six residents and those with seven or more
residents. Rate models have not been developed for homes with seven or more residents (that is,
it is assumed that these rates would not change).
The rate models assume that the existing 11 support levels (which excludes level 1, which is a
room and board only payment) would be collapsed into five levels with the following staff hour
assumptions:
Current
Level(s)
New
Level
Staff Hours – Homes w/ Fewer
Than 4 Beds
Staff Hours – Homes w/ 5 or 6
Beds
Total Net of Owner Total Net of Owner
2 2 168 0 168 0
3/ 4A/ 4B 3 180 12 220 52
4C/ 4D/ 4E 4 220 52 280 112
4F/ 4G/ 4H 5 260 92 340 172
4I 6 300 132 400 232
In terms of these staffing assumptions:
The rate models count 168 hours for the home owner against the staffing requirements
The rate models do not include a home administrator or lead staff, assuming the owner
performs these roles
It is assumed that overnight staff are permitted to sleep in Level 2 and 3 homes only if all
consumers’ IPPs state that they do not require awake staff
The rate models fund overnight hours in Level 2, 3, and 4 homes at minimum wage
Five percent of work hours for line staff and lead staff are assumed to be paid at an
overtime wage (time-and-a-half)

DDS Vendor Rate Study
Page 71
BURNS & ASSOCIATES, INC.
Health Policy Consultants March 15, 2019
The rate models do not assume any changes to the room and board component of the payment
for this service, which is tied to Supplemental Security Income/ and State Supplementary
Payment (SSI/SSP) amounts.
Due to the variability in the staffing requirements for homes that serve individuals with
extraordinary needs, there is a customizable rate model that would be used to determine the rate.
These values are ‘priced’ according to standardized cost assumptions in order to produce the rate
for a given residence. For example, the cost per staff hour is fixed in the rate model, but the
number of staff hours for a residence is customized to a specific location. Costs would be
calculated for the home overall and equally spread across the individuals in the home (that is, all
consumers in a given home would have the same rate).
Overview of Rate Models
Billing Unit Month
Rate Models Geography-based rates
Non-English stipend
Level of need
Home size/number of placements

DDS Vendor Rate Study
Page 72
BURNS & ASSOCIATES, INC.
Health Policy Consultants March 15, 2019
Supported Living-Community
894-SLS Vendor Administration
896-Supported Living Service (shared supports provided on a 24-hour
basis)
The service covers a number of supports for individuals living in their own home, including
assisting with common daily living activities, performing routine household activities, locating
and scheduling appropriate medical services; selecting and moving into a home; locating and
choosing suitable house mates; becoming aware of and effectively using the transportation,
police, fire, and emergency help available in the community; managing personal financial affairs;
building and maintaining interpersonal relationships; and participating in community life.
Supported Living Services would be divided into two separate service modalities. The separation
is based on whether staffing is provided on a 24-hour basis and on whether staff are dedicated to
a single housing unit or support multiple units.
Programs in which staff support multiple housing units (for example, in an apartment complex in
which staff ‘float’ between units) on a 24-hour basis (excepting time when the individual may be
participating in other paid supports such as an employment or day program) would be referred to
as Shared Living-Community and are summarized here. Supported Living programs in which a
worker is only responsible for an individual or individuals behind a single ‘front door’ are in the
personal supports section.
Due to the variability in the staffing requirements across Supported Living-Community sites, the
rate study does not include fixed rates for these programs. Rather, there is a customizable rate
model in which the approved number of consumers, staff hours, and consultant hours are input.
These values are ‘priced’ according to standardized cost assumptions in order to produce the rate
for a given residence. For example, the cost per staff hour is fixed in the rate model, but the
number of staff hours for a residence is customized to a specific location. Costs would be
calculated for the location overall and equally spread across the individuals at the site (that is, all
consumers at a given location would have the same rate).
The rate models include administrative costs so service code 894 would be eliminated.
Overview of Rate Models
Billing Unit Month
Rate Models Geography-based rates
Non-English stipend (requires that the individual have onsite access to a
staff person that speaks their language at all times)

DDS Vendor Rate Study
Page 73
BURNS & ASSOCIATES, INC.
Health Policy Consultants March 15, 2019
Family Home Agency
904-Family Home Agency
The service provides for the recruitment, training, and monitoring of family homes providers.
The rate study assumes that family home agencies would be required to pay at least 45 percent of
the total rate to the home provider.
Overview of Rate Models
Billing Unit Month
Rate Models Geography-based rates
Non-English stipend (applies to the home provider)
Level of need (there are six levels based on an individual’s level of need as
approved by the Regional Center)

DDS Vendor Rate Study
Page 74
BURNS & ASSOCIATES, INC.
Health Policy Consultants March 15, 2019
Enhanced Behavioral Supports Homes (EBSH)
900-Enhanced Behavioral Supports Home-Facility Component
901-Enhanced Behavioral Supports Home-Individualized Component
EBSHs are adult residential facilities and group homes with up to four consumers that provide
24-hour nonmedical care to individuals who require enhanced behavioral supports, staffing, and
supervision in a homelike setting. These programs were designed for consumers who require
intensive services and supports due to challenging behaviors that cannot be managed in a
community setting without the availability of enhanced behavioral services and supports, and
who are now in more restrictive placements, including developmental centers, locked mental
health facilities, and out-of-state placements, or who are at risk of institutionalization.
Due to the variability in the staffing requirements across EBSHs, the rate study does not include
fixed rates for these residences. Rather, there is a customizable rate model in which approved
home size, staff hours, and consultant hours are input. These values are ‘priced’ according to
standardized cost assumptions in order to produce the rate for a given residence. For example,
the cost per staff hour is fixed in the rate model, but the number of staff hours for a residence is
customized to a specific location. Costs would be calculated for the home overall and equally
spread across the individuals in the home (that is, all consumers in a given home would have the
same rate).
The rate study assumes that there would continue to be two rates. The Facility Component covers
facility, mileage, home administrator, program operations, and administrative costs. The
Individualized Component includes the cost of the direct care, board certified behavior analyst,
and consultant hours approved for each individual. The cost of the lead staff would be moved
from the Facility Component to the Individualized Component for the first resident in the home.
The rate model funds program operations expenses at 200 percent of the cost built in the
alternative residential model rates (for a total of $20 per day per consumer). Administrative costs
are fixed at the amount included in the four-bed level 6 ARM rate. The rate model assumes that
all direct care workers in the home are registered behavior technicians.
Overview of Rate Models
Billing Unit Month
Rate Models Geography-based rates
Non-English stipend (requires that the individual have onsite access to a
staff person that speaks their language at all times)

DDS Vendor Rate Study
Page 75
BURNS & ASSOCIATES, INC.
Health Policy Consultants March 15, 2019
Community Crisis Homes (CCH)
902-Community Crisis Home-Facility Component
903-Community Crisis Home-Individualized Component
CCHs are adult residential facilities and group homes with up to eight consumers that provide
24-hour nonmedical care to individuals who require crisis intervention services. These programs
were designed for consumers who require intensive services and supports due to challenging
behaviors that cannot be managed in a community setting without the availability of crisis
intervention services and supports, and who would otherwise be at risk of admission to an acute
crisis location, such as an out-of-state placement, a general acute hospital, an acute psychiatric
hospital, an institution for mental disease, or a more restrictive setting.
Due to the variability in the staffing requirements across CCHs, the rate study does not include
fixed rates for these residences. Rather, there is a customizable rate model in which approved
home size, staff hours, and consultant hours are input. These values are ‘priced’ according to
standardized cost assumptions in order to produce the rate for a given residence. For example,
the cost per staff hour is fixed in the rate model, but the number of staff hours for a residence is
customized to a specific location. Costs would be calculated for the home overall and equally
spread across the individuals in the home (that is, all consumers in a given home would have the
same rate).
The rate study assumes that there would continue to be two rates. The Facility Component covers
facility, mileage, home administrator, program operations, and administrative costs. The
Individualized Component includes the cost of the direct care and consultant hours approved for
each individual. The cost of the lead staff would be moved out of the Facility Component to the
Individualized Component for the first resident in the home.
The rate model funds program operations expenses at 200 percent of the cost built in the
alternative residential model rates (for a total of $20 per day per consumer). Administrative costs
are fixed at the amount included in the four-bed level 6 ARM rate. The rate model assumes that
all direct care workers in the home are registered behavior technicians.
Overview of Rate Models
Billing Unit Month
Rate Models Geography-based rates
Non-English stipend (requires that the individual have onsite access to a
staff person that speaks their language at all times)

DDS Vendor Rate Study
Page 76
BURNS & ASSOCIATES, INC.
Health Policy Consultants March 15, 2019
Supplemental Program Support-Residential Services
109-Program Support Group-Residential
The service provides time-limited supplemental staffing in residential programs for individuals
that require that require additional staffing within their programming.
Since this service only provides additional staffing for existing programs, the rate model does not
include program operations funding and administrative expenses are funded at one-half of the
standard rate.
Overview of Rate Models
Billing Unit Hour
Rate Models Geography-based rates

DDS Vendor Rate Study
Page 77
BURNS & ASSOCIATES, INC.
Health Policy Consultants March 15, 2019
Community-Based Day Program
028-Socialization Training Program
055-Community Integration Training Program (as applicable)
063-Community Activities Support Services (as applicable)
094-Creative Arts Program
505-Activity Center
510-Adult Development Center
515-Behavior Management Program
525-Social Recreation Program
The service provides a variety of supports, typically in a group setting, including assistance with
developing and maintaining self-help and self-care skills; developing the ability to interact with
others, making one's needs known, and responding to instructions; developing self-advocacy and
employment skills; developing community integration skills such as accessing community
services; behavior management; and developing social and recreational skills.
The rate study assumes the listed service codes would be consolidated into a single, overarching
framework. Within this framework, providers would be vendorized for a specific program type
and specified staffing ratios for center-based and community-based services. Billing would
reflect where services are delivered; that is, if an individual receives both center- and
community-based services in a day, the vendor would bill for the applicable number of hours of
each.
Overview of Rate Models
Billing Unit Hour
Rate Models Program focus
o Medical programs assumed to be staffed by certified nursing assistants
o Behavior programs assumed to be staffed by registered behavior
technicians
o Non-medical, non-behavioral programs
Service location (center/ facility and community)
Staffing ratio (1:2 to 1:10 for center/ facility and 1:2 or 1:3 for community)
Geography-based rates
Non-English stipend

DDS Vendor Rate Study
Page 78
BURNS & ASSOCIATES, INC.
Health Policy Consultants March 15, 2019
Participant-Directed Day Program
475-Participant-Directed Community-Based Training Services
The service assists individuals in the development of skills required for community integrated
employment and/or participation in volunteer activities and to secure employment and/or
volunteer positions or pursue secondary education. The service requires the use of a Financial
Management Service.
Since there is no agency infrastructure associated with this service, the rate model for this service
does not include funding for program operations or administrative expenses.
Overview of Rate Models
Billing Unit Hour
Rate Models Geography-based rates
Staffing ratio (allowable ratios from 1:1 to 1:3)
In-Home Day Program
091-In-Home/Mobile Day Program
The service supports consumers who are unable to attend day programs outside their homes,
because of medical conditions that prevent travel to outside programs. In-Home Day Program
services include a variety of activities designed to meet consumer needs from activity center
programs to vocational activities.
Overview of Rate Models
Billing Unit Hour
Rate Models Geography-based rates
Non-English stipend
Staffing ratio (allowable ratios from 1:1 to 1:3)

DDS Vendor Rate Study
Page 79
BURNS & ASSOCIATES, INC.
Health Policy Consultants March 15, 2019
Supported Employment-Individual
952-Supported Employment-Individual
055-Community Integration Training Program (as applicable)
063-Community Activities Support Services (as applicable)
The service provides supports to assist individuals on a one-to-one basis to obtain and maintain
paid work in a community setting.
The rate study assumes that individual employment supports currently delivered through service
codes 055 and 063 would be transitioned to service code 952. To accommodate this transition
and to expand the potential pool of providers, the rate model assumes that the service definition
would be amended to permit for-profit entities to provide the service.
There are separate rate models for job development and for job coaching to recognize differences
in the staff performing these functions and their typical productivity. The rate study assumes that
job development would be limited to 40 hours per year for a participant.
The rate study assumes that billing for travel time would no longer be permitted as these costs
are built into the rate model as a productivity adjustment. The rate models do not assume any
changes to the existing competitive integrated employment incentive payments.
Overview of Rate Models
Billing Unit Hour
Rate Models Geography-based rates
Non-English stipend
Service type (job development and job coaching)

DDS Vendor Rate Study
Page 80
BURNS & ASSOCIATES, INC.
Health Policy Consultants March 15, 2019
Supported Employment-Group
950-Supported Employment-Group
055-Community Integration Training Program (as applicable)
063-Community Activities Support Services (as applicable)
The service supports a group of individuals engaged in paid work in a community setting.
The rate study assumes that group employment supports currently delivered through service
codes 055 and 063 would be transitioned to service code 950. To accommodate this transition
and to expand the potential pool of providers, the rate model assumes that the service definition
would be amended to permit for-profit entities to provide the service.
The rate study assumes that billing for travel time would no longer be permitted as these costs
are built into the rate model as a productivity adjustment. Additionally, it is assumed that
services would be separately billed for each consumer rather than billed based on the job coach’s
hours.
Overview of Rate Models
Billing Unit Hour
Rate Models Geography-based rates
Non-English stipend
Staffing ratio (allowable ratios of 1:2 to 1:8)
Work Activity Program
954-Rehab Work Activity Program
The service includes paid work, work adjustment (for example, developing good work safety
practices, money management skills, and appropriate work habits) and supportive habilitation
services (for example, social skill and community resource training necessary to achieve
vocational objectives). Services are typically delivered in a sheltered work shop setting.
Overview of Rate Models
Billing Unit Hour
Rate Models Geography-based rates
Non-English stipend
Staffing ratio (allowable ratios of 1:4 to 1:35)

DDS Vendor Rate Study
Page 81
BURNS & ASSOCIATES, INC.
Health Policy Consultants March 15, 2019
Transportation
875-Transportation Company
880-Transportation-Additional Component
The service provides regularly scheduled transportation for individuals to and from their day
activity. The rate study assumes that service codes 875 and 880 would be consolidated.
The rate model for this service does not fund program operations or administrative expenses
because this service is intended to be provided in conjunction with Transportation Coordination,
which provides for the costs associated with these functions. Thus, every trip would involve two
billings: one for the actual delivery of transportation and one for transportation coordination.
These billings may be made by the same provider or by different providers.
Overview of Rate Models
Billing Unit One-way trip
Rate Models Geography-based rates
Ambulation (enhanced rate for individuals with wheelchairs)
Transportation Coordination
883-Transportation Broker
The service provides for the coordination, logistics, and oversight functions associated with
regularly scheduled transportation for individuals to and from their day activity.
The rate model includes funding for the program operations and administrative expenses
associated with transportation delivery. This service is intended to be provided in conjunction
with Transportation, which provides for the costs associated with the actual transportation. Thus,
every trip would involve two billings: one for the actual delivery of transportation and one for
transportation coordination. These billings may be made by the same provider or by different
providers.
Overview of Rate Models
Billing Unit One-way trip
Rate Models Geography-based rates

DDS Vendor Rate Study
Page 82
BURNS & ASSOCIATES, INC.
Health Policy Consultants March 15, 2019
Transportation Assistant
882-Transportation-Assistant
The service provides time-limited supplemental staffing to accompany an individual during their
regularly scheduled transportation.
Since this service only provides additional staffing for existing programs, the rate model does not
include program operations funding and administrative expenses are funded at one-half of the
standard rate.
Overview of Rate Models
Billing Unit Hour
Rate Models Geography-based rates
Supplemental Program Support-Day Services
110-Program Support Group-Day Services
The service provides time-limited supplemental staffing in day programs for individuals that
require additional staffing within their programming.
Since this service only provides additional staffing for existing programs, the rate model does not
include program operations funding and administrative expenses are funded at one-half of the
standard rate.
Overview of Rate Models
Billing Unit Hour
Rate Models Geography-based rates

DDS Vendor Rate Study
Page 83
BURNS & ASSOCIATES, INC.
Health Policy Consultants March 15, 2019
Behavior Analyst
612-Behavior Analyst
Behavior analysts assess the function of a behavior of a consumer and design, implement, and
evaluate instructional and environmental modifications to produce socially significant
improvements in the consumer's behavior through skill acquisition and the reduction of the
behavior.
Overview of Rate Models
Billing Unit Hour
Rate Models Geography-based rates
Group services (allowable ratios of 1:2 and 1:3)
Associate Behavior Analyst
613-Associate Behavior Analyst
Associate behavior analysts assess the function of a behavior of a consumer and design,
implement, and evaluate instructional and environmental modifications to produce socially
significant improvements in the consumer's behavior through skill acquisition and the reduction
of the behavior, under direct supervision of a Behavior Analyst or Behavior Management
Consultant.
Overview of Rate Models
Billing Unit Hour
Rate Models Geography-based rates
Group services (allowable ratios of 1:2 and 1:3)

DDS Vendor Rate Study
Page 84
BURNS & ASSOCIATES, INC.
Health Policy Consultants March 15, 2019
Behavior Management Assistant
615-Behavior Management Assistant
Behavior management assistants assess the function of a behavior of a consumer and design,
implement, and evaluate instructional and environmental modifications to produce socially
significant improvements in the consumer's behavior through skill acquisition and the reduction
of the behavior, under direct supervision of a Behavior Analyst or Behavior Management
Consultant.
Overview of Rate Models
Billing Unit Hour
Rate Models Geography-based rates
Group services (allowable ratios of 1:2 and 1:3)
Behavior Technician-Paraprofessional
616-Behavior Technician-Paraprofessional
Under the direct supervision of a certified Behavior Analyst or a Behavior Management
Consultant, behavior management technicians (paraprofessionals) implement instructional and
environmental modifications to produce socially significant improvements in the consumer's
behavior through skill acquisition and the reduction of the behavior.
Overview of Rate Models
Billing Unit Hour
Rate Models Geography-based rates
Non-English stipend
Group services (allowable ratios of 1:2 and 1:3)

DDS Vendor Rate Study
Page 85
BURNS & ASSOCIATES, INC.
Health Policy Consultants March 15, 2019
Behavior Management Consultant
620-Behavior Management Consultant
Behavior management consultants design and/or implement behavior modification intervention
services.
Overview of Rate Models
Billing Unit Hour
Rate Models Geography-based rates
Group services (allowable ratios of 1:2 and 1:3)
Infant Development Program
805-Infant Development Program
Infant development programs promote physical, cognitive, language and speech, and,
psychosocial development; promote self-help and feeding; increase parent and child interaction
by training parents to recognize and respond to the child's unique characteristics, temperament,
and non-verbal communication signaling distress or the need for interaction; increase and
develop parent/ child interpersonal relationships through the day-to-day activities, such as
bathing, dressing, feeding and comforting; and build parenting skills relating to the parents'
ability to care for the special needs of the child.
The rate study assumes that the service would be limited to ‘special instruction’ services (that is,
services provided by early childhood teachers/ specialists) and that services provided by other
professionals (therapists, for example) would be transitioned to the service code that corresponds
to their professional qualifications (for example, a physical therapist would bill under service
code 772).
Overview of Rate Models
Billing Unit Hour
Rate Models Geography-based rates
Staff qualifications (licensed professionals, specialists with a bachelor’s
degree, paraprofessional)
Service setting (center-based or community-based)
Group services (allowable ratios of 1:1 through 1:3)

DDS Vendor Rate Study
Page 86
BURNS & ASSOCIATES, INC.
Health Policy Consultants March 15, 2019
Crisis Evaluation and Behavior Intervention
017-Crisis Team-Evaluation & Behavior Modification
The service provides crisis intervention services designed to support and stabilize the consumer
in their current living arrangement or other appropriate setting (e.g., day program, school,
community respite). Services include consultation with parents, individuals, or providers of
services to develop and implement individualized crisis treatment, as well as supplemental crisis
intervention.
Overview of Rate Models
Billing Unit Hour
Rate Models Geography-based rates
Staff qualifications (licensed professionals, specialists with a bachelor’s
degree, paraprofessional)
Section 4.3: Fiscal Impact Analysis
As described in Part 1 of this report, outside of increases for statewide minimum wage and
overtime, rates were relatively unchanged between 2003 and 2015 until more than $400 million
in total funds was provided by ABX2-1 for rate increases. Even with the ABX2-1 rate increases,
the rate models represent a substantial increase over existing rates for most services. Although
the rate study does not offer recommendations regarding the potential timing and strategy of
implementation of the rate models, ABX2-1 requires that it include an analysis of the potential
fiscal impact.
The annualized impact of implementing many of this study’s rate models is an estimated $1.8
billion in total funds.57 An estimated 60 percent, or $1.1 billion, of these costs would be General
Fund. A brief summary of the assumptions and methodology used to develop this estimate
follows:
Fiscal year 2016-17 claims were ‘repriced’ as if the rate models had been in effect; the
difference between the actual and repriced totals represents the baseline impact.
Since most service codes are not limited to a single billing unit (for example, an hour or
a month), the repricing first required a unit type had to be attached to each claim in order
to avoid pricing, for instance, a monthly unit according to an hourly rate. Claims do not
include a field for the unit type so this process required linking claims to an approved
57 The $1.8 billion cost estimate does not include the implementation of the rate models for DSP levels as described
in Section 4.1.

DDS Vendor Rate Study
Page 87
BURNS & ASSOCIATES, INC.
Health Policy Consultants March 15, 2019
rates file and matching the two based on five points: vendor ID, consumer, service code,
service subcode, and billed rate58. Additional manual steps were undertaken to attempt to
assign billing units to claims when there was not a five-point match between the claims
data and rates file.
Billing units were standardized when feasible. For example, a rate based on a 15-minute
unit could easily be converted to an hourly rate by multiplying by four. Other
conversions were not possible; for example, a monthly billing unit could not be
converted to an hourly equivalent because there is no way to determine the number of
hours of service that were actually provided during the month.
Claims with billing units that could be translated to the unit assumed in the rate model
were repriced. For example, for a service code with a rate model based on an hourly
billing unit, all 15-minute, 30-minute, and 60-minute units were repriced.
To control for the possibility of erroneous billing unit assignments for claims that could
be compared to the rate models (that is, the claim had the same billing unit as the rate
model), a range of feasible billed rates were established for service codes. For example,
it was assumed that claimed hourly rates between $11.00 and $55.00 were possible for
service code 062 (Personal Assistance) to account for legal minimum wage at the low
end of the threshold and specialized rates at the high end. Rates falling outside of the
established range were excluded from the direct repricing, and instead were assumed to
change in the same proportion as the change for the directly repriced units. For example,
if the claims with an hourly rate of between $11.00 and $55.00 were increasing by 22
percent, it was assumed that the claims outside of the threshold changed would also
increase by 22 percent.59
For billing units that could not be translated to the unit type in the rate model, it was
assumed that they would also change in the same proportion as the change for the
convertible units. To continue the example above, if the repricing of the 15-minute, 30-
minute, and 60-minute units resulted in an aggregate estimated increase of 22 percent, it
was assumed that the total spending associated with the monthly units would also
increase 22 percent.
The estimated fiscal impacts for service codes that are not limited to a single ‘service’
and that would, therefore, be associated with different rates were not based on a
repricing of units. Instead, the proportion of total spending associated with the various
services was allocated based on provider survey results and the corresponding rate of
58 DDS provided fiscal year 2016-17 claims data as a monthly roll-up of claims for each client, differentiated by
service code, sub-code, month of claim, and Regional Center. The billed rate is calculated as the total monthly
payment for each claim divided by total billed units.
59 The rates of change were applied at the Regional Center level when possible for both these estimates as well as
those discussed in the next bullet. If a particular Regional Center had no claims that could be repriced directly (e.g.,
only monthly units when the rate model is built on an hourly unit), the statewide rate of change was applied.

DDS Vendor Rate Study
Page 88
BURNS & ASSOCIATES, INC.
Health Policy Consultants March 15, 2019
change for the comparable service was applied. For example, service code 055 may be
used for in-home services, for look-alike day programs, or for supported employment.
All of these services have different rates, but there is no way to determine which service
was provided based on the claims. The provider survey asked for providers to report
revenue based on these activities and the reported proportions were applied to the claims
totals in order to allow for the repricing.
A similar process was employed for service codes that cover different activities. For
example, the rate models assumed that individual supported employment will be divided
into job development and job coaching rates. The claims data do not currently
distinguish between these activities so the provider survey was used to estimate the
amount of total current spending associated with each activity.
Two adjustments were made to update the assumption to reflect fiscal year 2019-20
rather than 2016-17. First, the estimated fiscal impact was reduced to account for the
rising statewide minimum wage through 2019-20. Second, the estimate was increased to
account for system growth that has occurred in recent years (since the rate models would
apply to a larger base of services than in fiscal year 2016-17).
The estimated impact, detailed by service code, is included as Attachment 5.

DDS Vendor Rate Study
Page 89
BURNS & ASSOCIATES, INC.
Health Policy Consultants March 15, 2019
CONCLUSION
Consistent with the requirements and intent of ABX2-1, the rate study and the rate models
reflect:
A standardized approach to rate-setting such that providers delivering the same service in
the same area receive the same payment
Simplification of service codes by consolidating a number of existing codes based on the
assumption that a support should be associated with the same service code regardless of
where that support is provided
The use of market-based cost data to reflect providers’ costs in order to support a stable
and high-quality supply of providers
A detailed and transparent accounting of these costs so changes could be considered over
time
Recognition of differences in wage, travel, and real estate costs across the State by
developing separate rate models for each Regional Center
The development of enhanced rates for services delivered to individuals who do not
speak English when delivered by staff who speak their language, including American
Sign Language
The rate study and resultant rate models would represent a shift not only in payment rates, but
also billing policies and service requirements. As such, there are numerous operational and other
issues that would need to be considered, including:
Creating and amending statutes, regulations, and policies
Development of reporting requirements related to elements such as consumer outcomes
and staff compensation so that the State is able to measure the result of any increases in
payment rates
Changes to billing systems and related infrastructure across DDS, Regional Centers, and
providers
New authorizations and vendorizations to accommodate changes to service codes
This rate study is intended to inform the Administration, and the Legislature, on the delivery of
community-based services for individuals with developmental disabilities. The process has
provided more insights, and greater specificity, into its current rate structure. The report is a
framework and the Department plans to continue discussions with the Legislature and
community stakeholders on the rate study.

Selected Attachment to
DDS Vendor Rate Study
Note: Only Attachment 5 is included after this page for the reader’s
convenience. The remaining attachments can be found on the USB flash
drives distributed with the printed reports.