Embed Size (px)
Citation preview
DE MONTFORT
MID YEAR 2016 Commercial Property Lending Report Summary

2
2
Contact:
Nicole Lux (Dr) Senior Research Fellow
DE MONTFORT UNIVERSITY Leicester, LE1 9BH
T: +44 (0)116 250 6438 E: [email protected]
Executive summary
Responses to Research
At mid-year 2016, data was received from a total of 78 lending organisations. The lending organisations comprised 46
Banks & Building Societies, 12 Insurance Companies and 20 Other Non-bank Lenders. Whilest the number of Insurance
Companies and Other Non-bank lenders has remained stable, 49 Banks & Building Societies reported to the survey at
year end 2015.
One lending organisation could no longer supply data, while one new organisation was added to the survey. In addition
three organisations have been deleveraging their portfolio and have now exited the market having reported zero exposure.
Out of 78 organisations 9 lenders are not active in the market, and are deleveraging their portfolio, but still have significant
amounts of loans under management.
69 of these organisations indicated that they were active in the market during H1 2016 which is 88% of the total sample.
Other Non-bank Lenders are identified as a category of lender in this research since their recent entry into the market
during 2012. Data trends prior to year-end 2012 will, therefore, not include this new category. This category includes debt
funds, asset managers and other organisations that are prepared to provide junior debt, mezzanine finance and more
recently senior debt.
Due to the increasing number of Insurance Companies that entered the market during 2011 and 2012, in this report,
Insurance Companies will be identified as a separate category of lender. Their inclusion as a separate category is
restricted to guard against identification of individual companies within the aggregated data.
Loan Book and Market Size
A total value of £191bn of committed debt (includes drawn and undrawn amounts) was recorded by the survey as at 30th
June 2016, compared to £190bn at year-end 2015, representing a 0.3% increase of loan books. This increase is despite
the overall abundance of equity and the market volatility leading up to the UK Brexit referendum in June 2016. This
increase also includes undrawn amounts of £17.7bn.
The aggregated value of outstanding drawn debt recorded in loan books and secured only by UK commercial property,
increased from £168.4bn at year-end 2015 to £173.4bn at mid-year 2016. This represents an increase of 3%. One factor
to take into consideration is that at the end of 2015 £22bn of loans were reported committed but not yet drawn, which may
have contributed to the increase.

3
3
Contact:
Nicole Lux (Dr) Senior Research Fellow
DE MONTFORT UNIVERSITY Leicester, LE1 9BH
T: +44 (0)116 250 6438 E: [email protected]
Figure 1: Total outstanding loan books over time reported to this research
Source: DMU 2016
The outstanding loan book value of £173.4bn at mid-year 2016 was allocated as follows; £136.3bn held by Banks, Building
Societies (79%), £23.1bn (13%) Insurance Companies and £13.9bn (8%) held by Other Non-bank Lenders.
It is extremely difficult to ascertain the total size of the commercial property lending market in the UK. As part of the
process of widening the scope of this research to make it as comprehensive as possible, in addition to £173.4bn collected
by the research the following amounts of outstanding debt have been identified:
o Approximately £22.6bn of debt has been identified from the published financial statements of non-contributing
organisations. This includes approximately £1bn (at par value) of loans secured by property located in the UK
held by NAMA. NAMA has constantly been reducing its legacy portfolio of UK assets and at year end 2015 the
amount accounted for was £1.7bn.
o At mid-year 2016 Trepp provided data on the total outstanding balance of UK CMBS at mid-year 2016 which was
approximately £19.7bn. The amount of outstanding CMBS has been constantly reducing since the Global
Financial Crisis (GFC) 2008/09.
Thus, at mid-year 2016, an estimated approximate total value of 215.7bn of outstanding debt secured by commercial
property has been identified by this research. This compares with £211.6bn recorded at year-end 2015 representing an
increase in six months of 1.9% and y-o-y change of 2.4%.
In addition, a further £17.7bn of loans were committed but not drawn at mid-year 2016.
UK Banks & Building Societies held 46.4% of outstanding debt retained on balance sheet and secured by commercial
31.2% 33.7%
16.6%
27.6%
13.9% 16.2%
13.2%
18.5%
10.5%
-0.7%
-9.9% -6.0%
-7.7%
-8.8%
-8.5%
1.9% 3.0%
0
50
100
150
200
250
300
-15% -10%
-5% 0% 5%
10% 15% 20% 25% 30% 35% 40%
Aggregated loan book size £bn (RHS) % change in book sizes (LHS)
4
4
Contact:
Nicole Lux (Dr) Senior Research Fellow
DE MONTFORT UNIVERSITY Leicester, LE1 9BH
T: +44 (0)116 250 6438 E: [email protected]
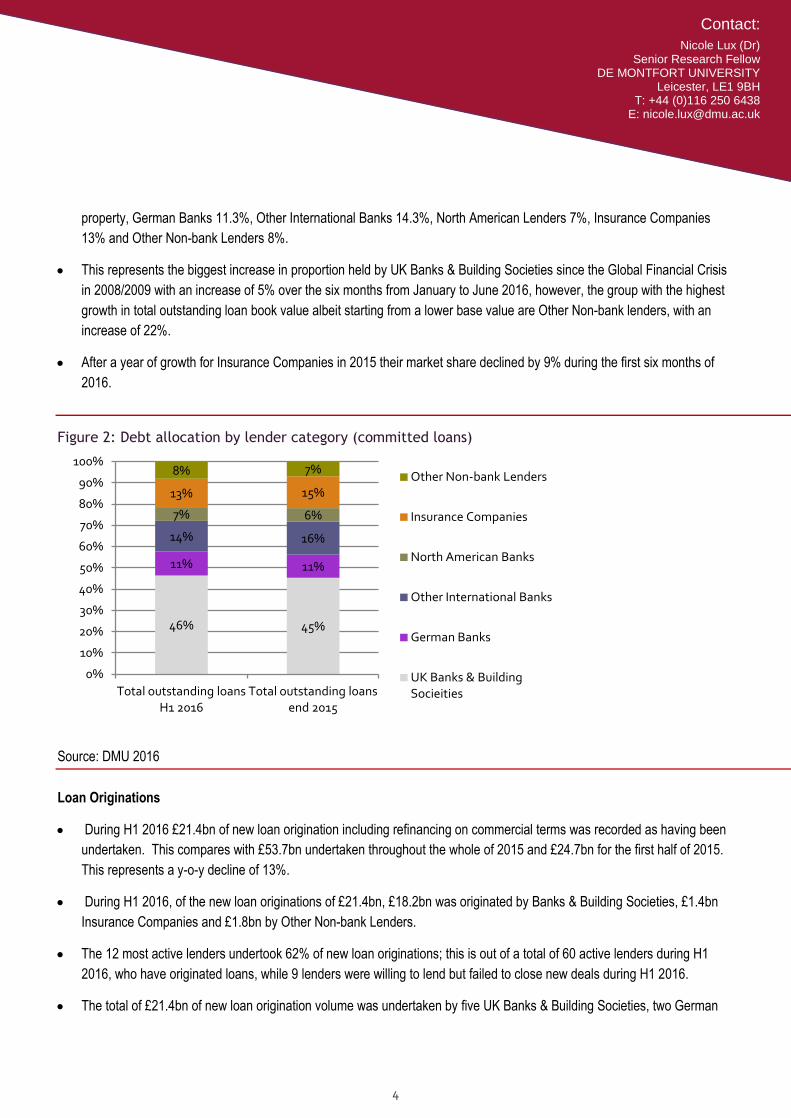
property, German Banks 11.3%, Other International Banks 14.3%, North American Lenders 7%, Insurance Companies
13% and Other Non-bank Lenders 8%.
This represents the biggest increase in proportion held by UK Banks & Building Societies since the Global Financial Crisis
in 2008/2009 with an increase of 5% over the six months from January to June 2016, however, the group with the highest
growth in total outstanding loan book value albeit starting from a lower base value are Other Non-bank lenders, with an
increase of 22%.
After a year of growth for Insurance Companies in 2015 their market share declined by 9% during the first six months of
2016.
Figure 2: Debt allocation by lender category (committed loans)
Source: DMU 2016
Loan Originations
During H1 2016 £21.4bn of new loan origination including refinancing on commercial terms was recorded as having been
undertaken. This compares with £53.7bn undertaken throughout the whole of 2015 and £24.7bn for the first half of 2015.
This represents a y-o-y decline of 13%.
During H1 2016, of the new loan originations of £21.4bn, £18.2bn was originated by Banks & Building Societies, £1.4bn
Insurance Companies and £1.8bn by Other Non-bank Lenders.
The 12 most active lenders undertook 62% of new loan originations; this is out of a total of 60 active lenders during H1
2016, who have originated loans, while 9 lenders were willing to lend but failed to close new deals during H1 2016.
The total of £21.4bn of new loan origination volume was undertaken by five UK Banks & Building Societies, two German
46% 45%
11% 11%
14% 16%
7% 6%
13% 15%
8% 7%
0%
10%
20%
30%
40%
50%
60%
70%
80%
90%
100%
Total outstanding loans H1 2016
Total outstanding loans end 2015
Other Non-bank Lenders
Insurance Companies
North American Banks
Other International Banks
German Banks
UK Banks & Building Socieities

5
5
Contact:
Nicole Lux (Dr) Senior Research Fellow
DE MONTFORT UNIVERSITY Leicester, LE1 9BH
T: +44 (0)116 250 6438 E: [email protected]
Banks, two North American Banks, two Other International Banks , one Insurance Company. However, no Other Non-bank
Lender is represented in the ‘top twelve’ most active loan originators at mid-year 2016, indicating the dominance of UK
Banks & Building Societies in their home market.
Table 1: Origination volume (£m)
Origination 2015 (£m)
H1 2015 (£m)
Total Origination H1 2016 (£m)
% y-o-y change
UK Banks & Building Societies 18,258
9,646 9,452 -2%
German Banks 6,981
3,163 3,580 13%
Other International Banks 7,518
3,636 3,651 0%
North American Banks 7,518
2,381 1,536 -35%
Insurance Companies 8,592
3,520 1,452 -59%
Other Non-bank Lenders 4,833
2,473 1,805 -27%
All Lenders 53,700
24,819 21,476 -13%
Overall it is worth noting that 51% of the total origination volume was refinancing of loans and 49% was for new
acquisitions, which is a shift from year-end 2015 when the majority of 55.6% of new financing was provided for
acquisitions. In 2014 this was 51.7% and in 2013, 61%. Especially Banks & Building Societies (64%) and Insurance
Companies (73%) derived a large amount of their H1 2016 activity through refinancing of their own loans or loans from
other lenders. In contrast Other Non-bank Lenders sourced 54% of their new origination volume from new acquisitions.
The market share of new loan originations shows a sharp increase in the market share of UK Banks & Building Societies
(44% at mid-year 2016 compared with 34% at year-end 2015); this is at the expense of North American Banks and
Insurance Companies. Their share declined from14% to 7% and 16% to 7% respectively for the first six months in 2016.
Of the £18.2bn of loan originations undertaken by Banks & Building Societies, 83% was allocated to investment projects,
4% to commercial development, and 11% to residential development and 2% to other projects and investments. This is a
slightly higher amount compared to year-end 2015, when only 80% was allocated to investment funding.
Of the £1.4bn of loan originations undertaken by Insurance Companies, 100% was allocated to investment projects.
Of the £1.8bn of loan originations undertaken by Other Non-bank Lenders, 70% was allocated to investment projects,
12.7% to commercial development and 17.3% to residential development. This shows the further specialisation of market
participants. However, given their overall share of 8% of total origination volume, this still shows that relatively little debt is
available for development funding.

6
6
Contact:
Nicole Lux (Dr) Senior Research Fellow
DE MONTFORT UNIVERSITY Leicester, LE1 9BH
T: +44 (0)116 250 6438 E: [email protected]
Figure 3: Allocation of new origination by type of lender
Source: DMU 2016
Securitisations, Syndications and Club Deals
No new CMBS issuance was reported to the research during H1 2016, however there has been some private CMBS
placements, which have been mentioned by market participants.
During H1 2016, approximately £1.3bn of debt was reported as being syndicated by 11 organisations. In addition during
H1 2016, approximately £4.8bn was reported as the value of participations in club deals by 18 organisations that contribute
to this research. This compares to the total of £9.2bn for syndicated debt at the end of 2015 and £8.8bn in club deals.
While the amount of club deal activity appears to be healthy for the first six month of 2016, syndication volumes are lagging
behind, reaching only 14% of the total volume of 2015 at mid-year 2016. Given the amount of active organisations the
average deal size syndicated only amounts to £118m per organisation, while the average size of club deal is far higher
with £340m.
44% 34%
17%
13%
17%
14%
7%
14%
7% 16%
8% 9%
0%
10%
20%
30%
40%
50%
60%
70%
80%
90%
100%
Total Origination H1 2016 Origination 2015
Other Non-bank Lenders
Insurance Companies
North American Banks
Other International Banks
German Banks
UK Banks & Building Socieities

7
7
Contact:
Nicole Lux (Dr) Senior Research Fellow
DE MONTFORT UNIVERSITY Leicester, LE1 9BH
T: +44 (0)116 250 6438 E: [email protected]
Figure 4: Source of loan origination
Source: DMU 2016
Future Lending Intentions
By mid-year 2016, 75% of lenders still intended to increase their total loan book size and 69% intend to increase loan
originations. 62.5% of the 30 active Banks & Building Societies, which responded to the question, declared to intend to
increase their loan book as well as 8 out of 11 Insurance Companies and 17 out of 17 Other Non-bank-Lenders. In
comparison at the end of 2015, 83% of all lenders intended to increase their total book size.
Equally 6 Insurance Companies and 15 Other Non-bank Lenders intend to increase origination volumes over the next six
months.
Structure of Loan Books and Legacy Debt
During H1 2016, the large majority (89%) of loan exposure was held in loans up to 70% LTV. The proportion at year-end
2015 was 87.5% and has steadily increased since 2012. At the same time, 67% of the loan exposure held on balance
sheets achieves an inerest cover ratio (ICR) of above 2.00x and 87% of loan exposure achieves an ICR of 1.8x and above.
83% of the exposure of total loan books was secured by investment property at 30th June 2016. At year-end 2015 this was
80%.
The value of loans in breach of financial covenants and those in default at mid-year 2016 reported to the research was
approximately £4.5bn and represented 2.6% of the total aggregated loan book. This compares with £10.4bn and 7%
reported to the research at year-end 2015.
20.4 21.3 21.5 30%
18.5 27.0 22.9
21%
61.1 51.7 55.6
49%
0%
10%
20%
30%
40%
50%
60%
70%
80%
90%
100%
2013 2014 2015 H 1 2016
Acquisition
Refinancing of other Lenders
Refinancing (own loans)

8
8
Contact:
Nicole Lux (Dr) Senior Research Fellow
DE MONTFORT UNIVERSITY Leicester, LE1 9BH
T: +44 (0)116 250 6438 E: [email protected]
Lending organisations commented that virtually all their problems related to loans written before 2009 with no significant
breaches and defaults being recorded on new loans.
Figure 5: LTV structure of loan books (All Lenders)
Source: DMU 2016
Senior Debt: Loan terms for Investment Property offered by All Lenders
From 2012 the observed decline in interest rate margins continued during H1 2016. At mid-year 2016, the average senior
margin for loans secured by a prime office was recorded at 191bps for All Lenders. This is a decline of 31bps from 222bps
recorded at year-end 2015. For senior loans secured by secondary offices, average interest rate margins increased
slightly by 18bps from 261bps recorded at year-end 2015 to 279bps at mid-year 2016.
Loans secured by a prime office property have experienced the lowest margins achieved since 2007. However, a bigger
distinction was made between prime and secondary property loans, with fewer lenders willing to quote margins for
secondary property. The average senior margin ranged from 279 – 305bps for loans secured by secondary office, retail
and industrial. This is a premium of 88bps for secondary office vs prime.
The most competitive pricing was offered on senior loans secured by prime office property by German Bank Banks with
162bps, which is an increase of 23bps compared to year-end 2015. This was followed by Other International Banks with an
average margin of 188bps and North American Banks with 225bps. In contrast to German Banks, Other International
Banks have decreased their senior margins significantly from 245bps recorded at year- end 2015.
UK Banks & Building Societies also improved their pricing from a borrower perspective from 217bps at year end 2015 to
195bps for senior loans. This represents pricing terms quoted by Banks active in lending on prime office loans.
42% 31% 33% 29% 36% 36%
49% 65% 47% 62% 55%
46%
3% 3%
9% 9% 4% 17%
0% 10% 20% 30% 40% 50% 60% 70% 80% 90%
100%
>120%
100% - <120%
85% - <100%
70% - < 85%
50% - <70%
<50%
9
9
Contact:
Nicole Lux (Dr) Senior Research Fellow
DE MONTFORT UNIVERSITY Leicester, LE1 9BH
T: +44 (0)116 250 6438 E: [email protected]
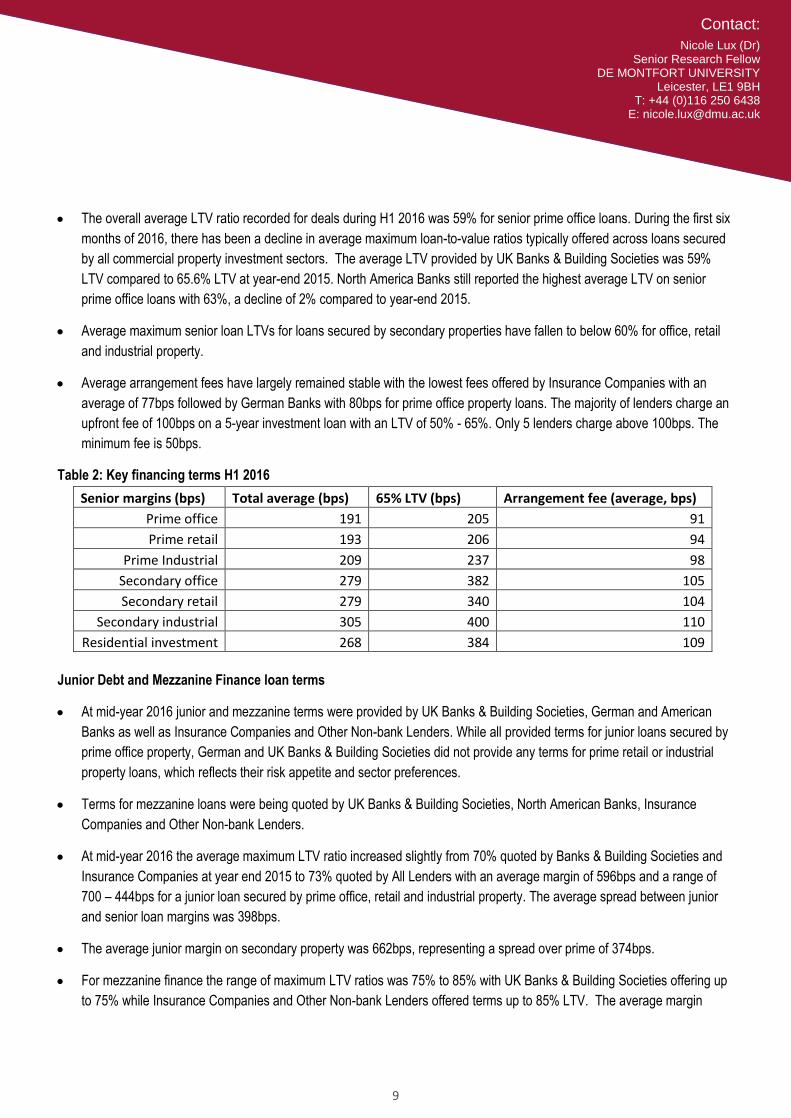
The overall average LTV ratio recorded for deals during H1 2016 was 59% for senior prime office loans. During the first six
months of 2016, there has been a decline in average maximum loan-to-value ratios typically offered across loans secured
by all commercial property investment sectors. The average LTV provided by UK Banks & Building Societies was 59%
LTV compared to 65.6% LTV at year-end 2015. North America Banks still reported the highest average LTV on senior
prime office loans with 63%, a decline of 2% compared to year-end 2015.
Average maximum senior loan LTVs for loans secured by secondary properties have fallen to below 60% for office, retail
and industrial property.
Average arrangement fees have largely remained stable with the lowest fees offered by Insurance Companies with an
average of 77bps followed by German Banks with 80bps for prime office property loans. The majority of lenders charge an
upfront fee of 100bps on a 5-year investment loan with an LTV of 50% - 65%. Only 5 lenders charge above 100bps. The
minimum fee is 50bps.
Table 2: Key financing terms H1 2016
Senior margins (bps) Total average (bps) 65% LTV (bps) Arrangement fee (average, bps)
Prime office 191 205 91
Prime retail 193 206 94
Prime Industrial 209 237 98
Secondary office 279 382 105
Secondary retail 279 340 104
Secondary industrial 305 400 110
Residential investment 268 384 109
Junior Debt and Mezzanine Finance loan terms
At mid-year 2016 junior and mezzanine terms were provided by UK Banks & Building Societies, German and American
Banks as well as Insurance Companies and Other Non-bank Lenders. While all provided terms for junior loans secured by
prime office property, German and UK Banks & Building Societies did not provide any terms for prime retail or industrial
property loans, which reflects their risk appetite and sector preferences.
Terms for mezzanine loans were being quoted by UK Banks & Building Societies, North American Banks, Insurance
Companies and Other Non-bank Lenders.
At mid-year 2016 the average maximum LTV ratio increased slightly from 70% quoted by Banks & Building Societies and
Insurance Companies at year end 2015 to 73% quoted by All Lenders with an average margin of 596bps and a range of
700 – 444bps for a junior loan secured by prime office, retail and industrial property. The average spread between junior
and senior loan margins was 398bps.
The average junior margin on secondary property was 662bps, representing a spread over prime of 374bps.
For mezzanine finance the range of maximum LTV ratios was 75% to 85% with UK Banks & Building Societies offering up
to 75% while Insurance Companies and Other Non-bank Lenders offered terms up to 85% LTV. The average margin
10
10
Contact:
Nicole Lux (Dr) Senior Research Fellow
DE MONTFORT UNIVERSITY Leicester, LE1 9BH
T: +44 (0)116 250 6438 E: [email protected]
decreased from 956bps to 871bps for loans on prime property. The average spread between junior and mezzanine loan
margins was 275bps.
Mezzanine financing for secondary properties was available at an average margin of 10% or IRR of 12% - 16%. The
average LTV obtainable was 80%.
Other Investment Finance terms by All Lenders
Finance terms for residential investment were offered by 25 lenders. The average loan margin for a senior loan was
267bps with an arrangement fee of 108bps at an average LTV of 58%. For this category UK Banks & Building Societies
offered the highest margins of 353bps, compared to 160bps offered by German Banks, 200bps by Insurance Companies,
242bps by Other International Banks and 252bps by Other Non-bank Lenders.
Junior terms were offered at an average of 650bps margin and mezzanine financing was available for a margin of 10% for
residential investment with an average LTV of 75%.
27 lenders also provided terms for hotel investment loans. For senior loans the average margin was 279bps at an average
LTV of 58%. Margins ranged from the lowest offered by Insurance Companies of 223bps to UK Banks & Building Societies
with 382bps. Other Non-bank Lenders priced these loans at 300bps.
Another 26 lenders also provided terms for student housing. The average margin was 258bps with an average LTV of
55%. The lowest margins were quoted by North American Banks with 210bps, followed by Insurance Companies providing
margins at 216bps for 53% LTV loans. UK Banks & Building Societies priced these loans at 328bps with an average LTV
of up to 63%. Other Non-bank Lenders priced student housing at 238bps.
Commercial Development Finance: Loan terms offered by All Lenders
At mid-year 2016, 11 organisations provided data for finance of fully pre-let development. This compares with 21
organisations recorded at year-end 2015. The average interest rate margin was 348bps, which was an increase from
339bps reported at year-end 2015. The average LTC (loan-to-cost based on GDV) ratio was 66% and the average
arrangement fee 108bps.
Seven organisations provided data for loans for 50% pre-let: 50% speculative development schemes at mid-year 2016.
The average interest rate margin was 332bps with an LTC ratio of only up to 58% and an average arrangement fee of
121bps. In comparison the average margin year-end 2015 was 351bps.
Only 5 organisations provided terms for speculative developments with an average margin of 513bps, 140bps arrangement
fee and an average LTC ratio of 56%. In comparison the average margin year-end 2015 was 384bps.
Those organisations prepared to offer junior debt for a fully pre-let commercial development were offering a range of 60%
to 80% LTC ratio at an interest rate margin of 925bps and an arrangement fee of 150bps.
Generally an exit fee of 200bps was applied.
11
11
Contact:
Nicole Lux (Dr) Senior Research Fellow
DE MONTFORT UNIVERSITY Leicester, LE1 9BH
T: +44 (0)116 250 6438 E: [email protected]
Loan Terms for Residential Development offered by All Lenders
At mid-year 2016 a total of 11 lenders provided terms for residential development. For senior loans the average LTV ratio
for All Lenders was 56% LTV and 66% LTC ratio. Average interest rate margins declined from 434bps recorded at year-
end 2015 to 400bps at mid-year 2016 together with an exit fee of 115pbs and an arrangement fee of 135bps.
Margins from Insurance Companies were lowest at 350bps, Banks & Building Societies offered 391bps and Other Non-
bank Lenders were offering the highest margins with 700bps, however at an increased LTC of 70% for a senior facility.
Mezzanine finance for residential developments was offered by 6 lenders with a LTC ratio up to 90% at an average margin
of 11%.
Important Issues and Conclusion
Despite lending activity during the first half of 2016 being dominated by the uncertainty of the upcoming UK referendum
vote, the size of the overall aggregated UK commercial property loan book identified by this research has been growing by
another 3% during the first six month in 2016.
The loans books of Other Non-bank Lenders grew by 22% while the property loan exposure of UK Banks & Building
Societies grew by 5%.
The proportion of legacy debt originated before the financial crisis that is contained within the aggregated value is reducing
sharply to an insignificant proportion.
During the first half of 2016, £21.4bn of new loan originations were completed. This compares with £24.8bn in H1 2015
representing a 13% decline for the same period a year ago. This indicates a general slowdown in purchasing activity of
new properties requiring debt during 2016.
Despite a slowdown in new origination volume, market liquidity has not suffered in terms of competitive pricing and lending
terms that continue to improve from the borrowers’ perspective. This is especially the case in the core and prime markets
particularly for London and the South East.
It was frequently commented by respondents to this research that the commercial property market is cyclical in nature.
However any uncertainty introduced by the referendum vote was only viewed as a temporary effect mainly connected to
pricing and value uncertainty. Six weeks after the referendum some lenders appear to be more confident and continue
their lending activities.
New loan LTV ratios have noticeably been adjusted downwards and many commented that this was expected and
necessary and unrelated to the referendum. There is general uncertainty and caution of property values especially for
prime property in London, and most lenders feel that lending at a maximum LTV of 60-65% is prudent lending and should
minimise potential future losses
UK Banks & Building Societies have been the most active lender group with the largest increase in share of origination
volume. Despite their Basel capital requirements being higher under slotting compared to their peer group, capital charges
appear to be less of an issue considering the continuous downwards movement of LTV ratios on their overall outstanding

12
12
Contact:
Nicole Lux (Dr) Senior Research Fellow
DE MONTFORT UNIVERSITY Leicester, LE1 9BH
T: +44 (0)116 250 6438 E: [email protected]
loan book. In addition banks have been taking advantage of the BoE asset purchase programmes, which drives their asset
selection.
Overall UK Banks & Building Societies are the key suppliers of development funding and completed £2bn of development
lending transactions during H1 2016. The total development funding during H1 2016 was £3.3bn.
One side effect of the Basel capital requirements and overall conservative lending practices amongst banks has been that
lenders give preference to funding of certain assets, which means there is pricing pressure of margins for similar, mostly
core assets. Thus, lender portfolios becoming less diversified and more homogenous.
Copyright © De Montfort University 2016. All rights reserved. No part of this report (including associated graphs, data,
appendices or attachments) may be reproduced in any material form, distributed or communicated to any third party,
without the express written permission of the copyright owner.
Permission requests to use content, quotations or extracts from the report, should be addressed to [email protected]
The opinions and commentary in the report are those of the author(s) and not necessarily those of DMU; the
opinions expressed in this report should not be attributed in any way to the 3rd parties whom contribute data to
the report or whom financial supporter or sponsor the reports publication.
Commentary in the report is based on likely industry developments at the time, future trends or events based on
information known to the authors at the date of publication, and such commentary should not be relied upon as a
basis of financial investment. The report’s authors and publisher accept no responsibility, whatsoever, on decisions
based on the report which should not be relied upon as a basis for entering into transactions without seeking
specific, qualified, professional advice.
We exercise professional skill and care, using reasonable effort, to ensure that the De Montfort® Research reports
are free from error or omissions. Whilst facts have been rigorously checked, De Montfort University can take no
responsibility for any damage or loss suffered as a result of any inadvertent inaccuracy within this report. In the
event of any errors or omissions we may correct the report without any obligation or liability to you, and we do not
accept any liability if this report is used for an alternative purpose for which it is not intended.
This report is made available to you subject to our Terms and Conditions of Sale and Purchase to which your
attention is hereby drawn.