Embed Size (px)
DESCRIPTION
dsdad
Citation preview

7/18/2019 Dealing With Concept Drifts in Process Mining
http://slidepdf.com/reader/full/dealing-with-concept-drifts-in-process-mining-569633a3a36cd 1/18
154 IEEE TRANSACTIONS ON NEURAL NETWORKS AND LEARNING SYSTEMS, VOL. 25, NO. 1, JANUARY 2014
Dealing With Concept Drifts in Process MiningR. P. Jagadeesh Chandra Bose, Wil M. P. van der Aalst, Indre Žliobaite, and Mykola Pechenizkiy
Abstract—Although most business processes change over time,contemporary process mining techniques tend to analyze these
processes as if they are in a steady state. Processes may changesuddenly or gradually. The drift may be periodic (e.g., becauseof seasonal influences) or one-of-a-kind (e.g., the effects of new legislation). For the process management, it is crucial todiscover and understand such concept drifts in processes. Thispaper presents a generic framework and specific techniques todetect when a process changes and to localize the parts of theprocess that have changed. Different features are proposed tocharacterize relationships among activities. These features areused to discover differences between successive populations. Theapproach has been implemented as a plug-in of the ProM processmining framework and has been evaluated using both simulatedevent data exhibiting controlled concept drifts and real-life eventdata from a Dutch municipality.
Index Terms— Concept drift, flexibility, hypothesis tests,process changes, process mining.
I. INTRODUCTION
BUSINESS processes are nothing more than logicallyrelated tasks that use the resources of an organization to
achieve a defined business outcome. Business processes can beviewed from a number of perspectives, including the controlflow, data, and the resource perspectives. In today’s dynamicmarketplace, it is increasingly necessary for enterprises tostreamline their processes so as to reduce cost and to improveperformance. In addition, today’s customers expect organiza-tions to be flexible and adapt to changing circumstances. New
legislations such as the WABO act [1] and the Sarbanes–OxleyAct [2], extreme variations in supply and demand, seasonaleffects, natural calamities and disasters, deadline escalations[3], and so on, are also forcing organizations to changetheir processes. For example, governmental and insuranceorganizations reduce the fraction of cases being checked whenthere is too much of work in the pipeline. As another example,in a disaster, hospitals, and banks change their operatingprocedures. It is evident that the economic success of anorganization is more and more dependent on its ability toreact and adapt to changes in its operating environment.Therefore, flexibility and change have been studied in-depthin the context of business process management (BPM). For
Manuscript received May 15, 2012; revised June 24, 2013; acceptedAugust 2, 2013. Date of publication October 16, 2013; date of current versionDecember 13, 2013.
R. P. J. C. Bose, W. M. P. van der Aalst, and M. Pechenizkiyare with the Department of Mathematics and Computer Science,Eindhoven University of Technology, Eindhoven 5600 MB, The Nether-lands (e-mail: [email protected]; [email protected];[email protected]).
I. Žliobaite is with the Department of Information and Computer Science,Aalto University, Aalto FI-00076, Finland (e-mail: [email protected]).
Color versions of one or more of the figures in this paper are availableonline at http://ieeexplore.ieee.org.
Digital Object Identifier 10.1109/TNNLS.2013.2278313
example, process-aware information systems (PAISs) [4] havebeen extended to be able to flexibly adapt to changes in theprocess. State-of-the-art workflow management (WFM) andBPM systems [5] provide such flexibility, e.g., we can easilyrelease a new version of a process. In addition, in processesnot driven by WFM/BPM systems (such as the usage of medical systems) there is even more flexibility as processesare controlled by people rather than information systems.
Many of today’s information systems are recording anabundance of event logs. Process mining is a relatively youngresearch discipline aimed at discovering, monitoring, andimproving real processes by extracting knowledge from eventlogs [6] (Section II-A for a brief introduction). Althoughflexibility and change have been studied in-depth in the context
of WFM and BPM systems, contemporary process miningtechniques assume the processes to be in a steady state. Forexample, when discovering a process model from event logs,it is assumed that the process at the beginning of the recordedperiod is the same as the process at the end of the recordedperiod. Using ProM,1 we have analyzed processes in morethan 100 organizations. These practical experiences show thatit is very unrealistic to assume that the process being studiedis in a steady state. As mentioned earlier, processes maychange to adapt to changing circumstances. Concept driftrefers to the situation in which the process is changing whilebeing analyzed. There is a need for techniques that deal withsuch second-order dynamics. Analyzing such changes is of
utmost importance when supporting or improving operationalprocesses and to obtain an accurate insight on process exe-cutions at any instant of time. When dealing with conceptdrifts in process mining, the following three main challengesemerge.
1) Change point detection: The first and most fundamentalproblem is to detect concept drift in processes, i.e., todetect that a process change has taken place. If so, thenext step is to identify the time periods at which changeshave taken place. For example, by analyzing an event logfrom an organization (deploying seasonal processes), weshould be able to detect that process changes happen andthat the changes happen at the onset of a season.
2) Change localization and characterization: Once a pointof change has been identified, the next step is to charac-terize the nature of change, and identify the region(s) of change (localization) in a process. Uncovering the natureof change is a challenging problem that involves boththe identification of change perspective (e.g., controlflow, data, resource, sudden, gradual, and so on) and theidentification of the exact change itself. For instance, inthe example of a seasonal process, the change could be
1See www.processmining.org for more information.
2162-237X © 2013 IEEE

7/18/2019 Dealing With Concept Drifts in Process Mining
http://slidepdf.com/reader/full/dealing-with-concept-drifts-in-process-mining-569633a3a36cd 2/18
BOSE et al.: DEALING WITH CONCEPT DRIFTS 155
X X
Change
Point
Detection
Change
Localization and
Characterization
Change
Process
Discovery
Online
Analysis
Offline
Analysis
Control-flow
Data
Resources
Fig. 1. Different dimensions of concept drift analysis in process mining.
that more resources are deployed or that special offersare provided during holiday seasons.
3) Change process discovery: Having identified, localized,and characterized the changes, it is necessary to put all of these in perspective. There is a need for techniques/toolsthat exploit and relate these discoveries. Unraveling theevolution of a process should result in the discovery of the change process describing the second-order dynam-
ics. For instance, in the example of a seasonal process,we could identify that the process recurs every season.In addition, we can show an animation on how theprocess evolved over a period with annotations showingseveral perspectives such as the performance metrics(service levels, throughput time, and so on) of a processat different instances of time.
We can differentiate between two broad classes of dealingwith concept drifts when analyzing event logs (Fig. 1).
1) Offline analysis: This refers to the scenario where thepresence of changes or the occurrence of drifts neednot be uncovered in a real time. This is appropriate in
cases where the detection of changes is mostly usedin postmortem analysis, the results of which can beconsidered when designing/improving processes for laterdeployment. For example, offline concept drift analysiscan be used to better deal with seasonal effects (hiringless staff in summer or skipping checks in the weeksbefore Christmas).
2) Online analysis: This refers to the scenario wherechanges need to be discovered in near real time. Thisis appropriate in cases where an organization would bemore interested in knowing a change in the behavior of their customers or a change in demand as and when it ishappening. Such real-time triggers (alarms) will enable
organizations to take quick remedial actions and avoidany repercussions.
In this paper, we focus on two of the challenges: 1) change(point) detection and change localization and 2) characteriza-tion in an offline setting (Fig. 1). We define different featuresand propose a framework for dealing with these two problemsfrom a control-flow perspective. Initially, we show the promiseof the techniques proposed in this paper on a synthetic log andlater evaluate them on a real-life case study from a large Dutchmunicipality.
The rest of this paper is organized as follows. Section II pro-vides background on process mining and concept drifts in data
mining. Related work is presented in Section III. Section IVdescribes the various aspects and nature of change, whereasSection V presents the basic idea for change detection inevent logs. Section VI introduces various features that capturethe characteristics of event logs. Section VII illustrates thesignificance of statistical hypothesis tests for detecting drifts.Section VIII presents the framework for dealing with conceptdrifts in process mining, whereas Section IX presents therealization of the proposed approaches in the ProM framework.Section X describes the effectiveness of the features and thetechniques proposed in this paper on a synthetic log as well asa real-life case study. Finally, this paper is summarized witha conclusion and an outlook on some of the open researchquestions in Section XI.
II. BACKGROUND
In this section, we discuss the basic concepts in processmining and concept drifts in data mining/machine learning.
A. Process Mining
Process mining serves a bridge between data mining andbusiness process modeling [6]. Business processes leave trailsin a variety of data sources (e.g., audit trails, databases, andtransaction logs). Process mining aims at discovering, moni-toring, and improving real processes by extracting knowledgefrom event logs recorded by a variety of systems (ranging fromsensor networks to enterprise information systems). The start-ing point for process mining is an event log, which is a collec-tion of events. We assume that events can be related to processinstances (often called cases) and are described by some activ-ity name. The events within a process instance are ordered.Therefore, a process instance is often represented as a traceover a set of activities. In addition, events can have attributes
such as timestamps, associated resources (e.g., the person exe-cuting the activity), transactional information (e.g., start, com-plete, suspend, and so on), and data attributes (e.g., amount ortype of customer). For a more formal definition of event logsused in process mining, the reader is referred to [6]. Fig. 2shows a fragment of an example log. Event logs like in Fig. 2are completely standard in the process mining community andevent log formats such as MXML [7] and XES [8] are used.
The topics in process mining can be broadly classifiedinto three categories: 1) discovery; 2) conformance; and3) enhancement [6]. Process discovery deals with the discoveryof models from event logs. These models may describe controlflow, organizational aspects, time aspects, and so on. For
example, there are dozens of techniques that automaticallyconstruct process models (e.g., Petri nets or BPMN mod-els) from event logs [6]. Fig. 2 shows the basic idea of process discovery. An event log containing detailed infor-mation about events is transformed into a multiset of tracesL = [abcdjkln,aefjkmn,abgchdjkln, . . . ]. Processdiscovery techniques are able to discover process models suchas the Petri net shown in Fig. 2. Conformance deals withcomparing an a priori process model with the observed behav-ior as recorded in the log and aims at detecting inconsisten-cies/deviations between a process model and its correspondingexecution log. In other words, it checks for any violation

7/18/2019 Dealing With Concept Drifts in Process Mining
http://slidepdf.com/reader/full/dealing-with-concept-drifts-in-process-mining-569633a3a36cd 3/18
156 IEEE TRANSACTIONS ON NEURAL NETWORKS AND LEARNING SYSTEMS, VOL. 25, NO. 1, JANUARY 2014
Fig. 2. Process discovery aims to learn a process model (in this case a Petri net) from event logs. An event log consists of events related to cases andreferring to activities. To discover control flow, traces are projected onto activity names.
between what was expected to happen and what actually has
happened . Enhancement deals with extending or improvingan existing model based on information about the process
execution in an event log. For example, annotating a processmodel with performance data to show bottlenecks, throughputtimes, and so on.
Being a relatively young research discipline, several processmining challenges remain to be addressed. The process miningmanifesto [9] lists 11 challenges. The fourth challenge isdealing with concept drift and, thus far, a little work has beendone on this highly relevant topic [10], [11].
B. Concept Drift
Concept drift [12] in machine learning and data miningrefers to situations when the relation between the input data
and the target variable, which the model is trying to predict,changes over time in unforeseen ways. Therefore, the accuracyof the predictions may degrade over time. To prevent that,
predictive models need to be able to adapt online, i.e., toupdate themselves regularly with new data. The setting istypically looped over an infinite data stream as follows:1) receive new data; 2) make a prediction; 3) receive feedback(the true target value); and 4) update the predictive model.While operating under such circumstances, predictive modelsare required: 1) to react to concept drift (and adapt if needed)as soon as possible; 2) to distinguish drifts from once-off noiseand adapt to changes, but be robust to noise; and 3) to operatein less than data arrival time and use limited memory forstorage. In this setting, many adaptive algorithms have beendeveloped (e.g., overviews [13], [14]).
7/18/2019 Dealing With Concept Drifts in Process Mining
http://slidepdf.com/reader/full/dealing-with-concept-drifts-in-process-mining-569633a3a36cd 4/18
BOSE et al.: DEALING WITH CONCEPT DRIFTS 157
Concept drift is a relatively young research topic thathas gained popularity in data mining and machine learningcommunities in the last 10 years. Concept drift researchprimarily has been focusing on two directions: 1) how to detectdrifts (changes) online (e.g., [15]–[20]) and 2) how to keeppredictive models up to date (e.g., [21]–[23]). Concept drifthas been shown to be important in many applications (e.g.,[24]–[26]). The basis for drift detection could be a raw datastream, a stream of prediction errors, and, more rarely, a streamof predictions or a stream of updated model parameters. Twotypes of concept drift detection approaches have been used:monitoring evolution of a stream [15], [17] or comparing datadistributions in two time windows [16], [18]. The cumulativesum (CUSUM) approach [27] is a representative sequentialanalysis technique for change detection, different extensionsto which have been proposed. One notable example is com-putational intelligence-based CUSUM or CI-CUSUM [19]that aims to detect a nonstationarity condition by monitoringa multidimensional vector, i.e., multiple features. Adaptivewindowing [16] is a representative approach for online change
detection using an adaptive size sliding detection window.In this paper, we consider offline change detection and itslocalization and therefore focus on studying what features tomonitor and how to identify when these characteristics change.
III. RELATED WOR K
Over the last two decades many researchers have beenworking on process flexibility, e.g., making workflow systemsadaptive. In [28] and [29] collections of typical change patternsare described. In [30] and [31] extensive taxonomies of thevarious flexibility approaches and mechanisms are provided.Ploesser et al. [32] have classified business process changes
into three broad categories: 1) sudden; 2) anticipatory; and3) evolutionary. This classification is used in this paper, butnow in the context of event logs.
Despite the many publications on flexibility, most processmining techniques assume a process to be in a steady state.A notable exception is the approach in [33]. This approachuses process mining to provide an aggregated overview of allchanges that have happened so far. This approach, however,assumes that change logs are available, i.e., modifications of the workflow model are recorded. At this point of time, veryfew information systems provide such change logs. Therefore,this paper focuses on concept drift in process mining assumingonly an event log as input.
The topic of concept drift is well studied in various branchesof the data mining and machine learning community. Conceptdrift has been studied in both supervised and unsupervised set-tings and has been shown to be important in many applications[12], [14], [25], [26], [34]–[37]. The problem of concept drift,however, has not been studied in the process mining setting.Unlike in data mining and machine learning, where conceptdrift focuses on changes in simple structures such as variables,concept drift in process mining deals with changes to com-plex artifacts such as process models describing concurrency,choices, loops, and cancelation. Although experiences fromdata mining and machine learning can be used to investigate
concept drift in process mining, the complexity of processmodels and the nature of process change pose new challenges.This paper extends the work presented in [10]. In this extendedpaper, we introduce the topic of concept drift in process miningand present the basic idea and the features capturing thecharacteristics of traces in an event log in a more rigorousmanner. In addition, this extended paper provides a genericframework for handling concept drifts in process mining andpresents details on the realization of the approach in the ProMframework. Furthermore, this paper reports new experimentalresults of the proposed approach. More specifically, in thisextended paper, we study the influence of population size onchange point detection and the applicability of the approach indealing with gradual drifts. In addition, we present the resultsof applying the approach on a real-life case study from a largeDutch municipality.
Recently, Carmona and Gavaldà [11] have proposed anonline technique for detecting process changes. They firstcreated an abstract representation of the process in the formof polyhedra using the prefixes of some initial traces in the
event log. Subsequent traces are sampled and assessed whetherthey lie within the polyhedra or not. If a sample lies withinthe polyhedra, it is considered to be from the same process.If significant number of samples lies outside the polyhedra,a process change is said to be detected. This work differsfrom our approach in several ways: 1) this approach constructsan abstract representation of a process unlike ours wherewe consider features characterizing the traces and 2) thistechnique is applicable only for change detection whereas ourframework is applicable for both change (point) detection andchange localization. Furthermore, the tool support providedby the authors has some limitations in its applicability. Thetool does not detect change points and does not work on
logs with multiple process changes, i.e., it does not detectthe presence/absence of multiple changes and does not reportwhen (the trace index) process changes have happened. Thetool just reports that a change exists and terminates (if changesexist) and does not terminate if no changes exist. In contrast,our tool can handle multiple process changes and can detectboth the presence of and the points of change in addition tobeing able to assist in change localization.
IV. CHARACTERIZATION OF CHANGES
IN BUSINESS PROCESSES
In this section, we discuss the various aspects of process change. Initially, we describe change perspectives(control flow, data, and resource). Then, the different types of drift (sudden, gradual, recurring, periodic, and incremental)are discussed.
A. Perspectives of Change
There are three important perspectives in the context of business processes: 1) control flow; 2) data; and 3) resource.One or more of these perspectives may change over time.
1) Control flow/behavioral perspective: This class of changes deals with the behavioral and structural changesin a process model. Just like the design patterns in

7/18/2019 Dealing With Concept Drifts in Process Mining
http://slidepdf.com/reader/full/dealing-with-concept-drifts-in-process-mining-569633a3a36cd 5/18
158 IEEE TRANSACTIONS ON NEURAL NETWORKS AND LEARNING SYSTEMS, VOL. 25, NO. 1, JANUARY 2014
Fig. 3. Different types of drifts. x -axis: time. y -axis: process variants. Shaded rectangles: process instances. (a) Sudden drift. (b) Gradual drift. (c) Recurring
drift. (d) Incremental drift.
software engineering, there exist change patterns cap-turing the common control-flow changes [29]. Control-flow changes can be classified into operations suchas insertion, deletion, substitution, and reordering of process fragments. For example, an organization whichused to collect a fee after processing and acceptance of an application can now change their process to enforcepayment of that fee before processing an application.Here, the reordering change pattern had been appliedon the payment and the application processing process
fragments. As another example, with the addition of new product offerings, a choice construct is insertedinto the product development process of an organization.In the context of PAISs, various control-flow changepatterns have been proposed in [28], [29]. Most of thesecontrol-flow change patterns are applicable to traditionalinformation/workflow systems as well.
Sometimes, the control-flow structure of a processmodel can remain intact but the behavioral aspects of a model change. For example, consider an insuranceagency that classifies claims as high or low dependingon the amount claimed. An insurance claim of e1000which would have been classified as high last year is
categorized as a low insurance claim this year becauseof the organization’s decision to increase the claimlimit. The structure of the process remains intact butthe routing of cases changes.
2) Data perspective: This class of changes refer to thechanges in the production and consumption of data andthe effect of data on the routing of cases. For example,it may no longer be required to have a particulardocument when approving a claim.
3) Resource perspective: This class deals with the changesin resources, their roles, and organizational structure,and their influence on the execution of a process. Forexample, there could have been a change pertaining
to who executes an activity. Roles may change andpeople may change roles. As another example, certainexecution paths in a process could be enabled (disabled)upon the availability (nonavailability) of resources.Furthermore, resources tend to work in a particularmanner and such working patterns may change overtime, e.g., a resource can have a tendency of executinga set of parallel activities in a specific sequential order.Such working patterns could be more prominent whenonly few resources are available; the addition of newresources can remove this bias.
B. Nature of Drifts
With the duration for which a change is active, we canclassify changes into momentary and permanent . Momentarychanges are short lived and affect only a very few cases,whereas permanent changes are persistent and stay for awhile [31]. In this paper, we focus on permanent changesas momentary changes often cannot be discovered becauseof insufficient data.2 Momentary changes correspond to thenotion of outliers/noise in data mining. Changes are perceivedto induce a drift in the concept (process behavior). As shown
in Fig. 3, we identify four classes of drifts.1) Sudden drift: This corresponds to a substitution of an
existing process M 1 with a new process M 2, as shownin Fig. 3(a). M 1 ceases to exist from the momentof substitution. In other words, all cases (processinstances) from the instant of substitution emanate from M 2. This class of drifts is typically seen in scenariossuch as emergencies, crisis situations, and change of law. As an example, a new regulation by the financeministry of India mandates all banks to procure andreport the customer’s personal account number in theirtransactions.
2) Gradual drift: This refers to the scenario, as shown inFig. 3(b) where a current process M 1 is replaced witha new process M 2. Unlike the sudden drift, here bothprocesses coexist for some time with M 1 discontinuedgradually. For example, a supply chain organizationmight introduce a new delivery process. This process is,however, applicable only for orders taken henceforth. Allprevious orders still have to follow the former deliveryprocess.
3) Recurring drift: This corresponds to the scenario wherea set of processes reappear after some time (sub-stituted back and forth), as shown in Fig. 3(c). Itis quite natural to observe such a phenomenon with
processes having a seasonal influence. For example, atravel agency might deploy a different process to attractcustomers during Christmas period. The recurrence of processes may be periodic or nonperiodic. An exampleof a nonperiodic recurrence is the deployment of aprocess subjected to market conditions. The point of deployment and the duration of deployment are bothdependent on external factors (here, the market condi-tions). Periodic drifts may be caused by seasonal effects,
2To analyze momentary changes we can also use standard conformancechecking techniques to discover deviations from some normative model [38].

7/18/2019 Dealing With Concept Drifts in Process Mining
http://slidepdf.com/reader/full/dealing-with-concept-drifts-in-process-mining-569633a3a36cd 6/18
BOSE et al.: DEALING WITH CONCEPT DRIFTS 159
e.g., during the summer holidays there tends to beless demand and fewer resources thus influencing theprocess.
4) Incremental drift: This refers to the scenario where asubstitution of process M 1 with M N is done via smallerincremental changes, as shown in Fig. 3(d). This class of drifts is more pronounced in organizations adopting anagile BPM methodology and in processes undergoingsequences of quality improvements (most total qualitymanagement) initiatives are examples of incrementalchange [39]).
Recurring and incremental drifts in Fig. 3 are shown as discretesudden changes. These two types of concept drift, however,can also be gradual. Similar categorization of drifts havebeen proposed in [40] in the context of machine learning.Drifts in [40] are further classified based on the severityof change into severe (and intersected). The categories of severity, as defined in [40], are too coarse to be applied tobusiness process changes. Nonetheless, the degree of severityin process changes and their impact on dealing with concept
drifts is an interesting topic for further research. In the rest, wepropose approaches to detect potential control-flow changes ina process manifested as sudden/gradual drifts over a period.Detecting drifts in the other perspectives are beyond the scopeof this paper. In addition, as already shown in Fig. 1, we focuson offline concept drift analysis (although our techniques caneasily be adapted to the online setting). In practice, a mixtureof any or all of the drifts may happen.
V. BASIC I DEA OF DRIFT D ETECTION IN EVENT LOG S
In this section, we present the basic idea for the detectionof changes by analyzing event logs. Initially, we introduce thenotations used in this paper.
1) A is the set of activities. A+ is the set of all nonemptyfinite sequences of activities from A.
2) A process instance (i.e., case) is described as a traceover A, i.e., a finite sequence of activities. Examples of traces are abcd and abbbad.
3) Let t = t(1)t(2)t(3) . . . t(n) ∈ A+ be a trace over A.|t| = n is the length of the trace t. t(k ) is the k th activityin the trace and t(i, j) is the continuous subsequence of t that starts at position i and ends at position j . ti =
t(i, |t|) represents the suffix of t that begins at positioni .
4) An event log, L, corresponds to a multiset (or bag) of
traces from A+
. For example, L = [abcd, abcd, abbbad]is a log consisting of three cases. Two cases follow traceabcd and one case follows trace abbbad.
5) N,N0, and R+0 are the set of all natural numbers, the
set of all natural numbers including zero, and the set of all positive real numbers including zero, respectively.
We can consider an event log L as a time series of traces(traces ordered based on the timestamp of the first event).Fig. 4 shows such a perspective on an event log along withchange points in the sudden drift scenario. The basic premisein handling concept drifts is that the characteristics of thetraces before the change point differ from the characteristics
Fig. 4. Event log visualized as a time series of traces along with change
points. The basic premise of change (point) detection is that characteristicdifferences exist in the traces before and after the change.
of the traces after the change point. The problem of changepoint detection is then to identify the points in time where theprocess has changed, if any. Change point detection involvestwo primary steps:
1) capturing the characteristics of the traces;2) identifying when the characteristics change.
We refer to the former step as feature extraction and the latterstep as drift detection. The characteristics of the traces caneither be defined for each trace separately or can be done at a
sublog level. An event log can be split into sublogs of s traces(s ∈ N is the split size). We can consider either overlapping ornonoverlapping sliding windows when creating such sublogs.Fig. 4 shows the scenario where two subsequent sublogs donot overlap. In this case, we have k = n
s sublogs for an event
log of n traces. Thus, the logs processed to determine the char-acteristics of traces can be observed as a data stream of featurevalues where statistical tests can be used to detect changes.
As mentioned earlier, dealing with concept drifts in processmining involves two primary steps. First, we need to capturethe characteristics of traces; we propose a few feature setsthat address this in Section VI. Second, we need to identifywhen these characteristics change; we look at techniques thataddress this in Section VII.
VI. FEATURE EXTRACTION
Event logs are characterized by the relationships betweenactivities. Dependencies between activities in an event log canbe captured and expressed using the follows (or precedes)relationship, also referred to as causal footprints. For any pairof activities a, b ∈ A, and a trace t = t(1)t(2)t(3) . . . t(n) ∈
A+, we say b follows a if and only if for all 1 ≤ i ≤ n
such that t(i) = a there exists a j such that i < j ≤ n
and t( j) = b. In temporal logic notation: (a ⇒ (♦b)). Wesay a precedes b if and only if for all 1 ≤ j ≤ n such that
t( j ) = b there exists an i such that 1 ≤ i < j and t(i) = a,i.e., ¬aW b where W is the weak until in linear temporallogic notation. The follows and precedes relationships can belifted from traces to logs. If b follows a in all the tracesin an event log, then we say that b always follows a. If bfollows a only in some subset of the traces, then we say thatb sometimes follows a. If b does not follow a in all traces,then we say that b never follows a. Consider an event logL = [acaebfh, ahijebd, aeghijk] containing three traces definedover A ={a, b, c, d, e, f, g, h, i, j, k}. The following relationshold in L: e always follows a, e never follows b, and bsometimes follows a. Fig. 5(a) shows the relationship between

7/18/2019 Dealing With Concept Drifts in Process Mining
http://slidepdf.com/reader/full/dealing-with-concept-drifts-in-process-mining-569633a3a36cd 7/18
160 IEEE TRANSACTIONS ON NEURAL NETWORKS AND LEARNING SYSTEMS, VOL. 25, NO. 1, JANUARY 2014
Fig. 5. Feature extraction (a) causal footprint matrix for all activity pairs(b) relation type count (RC) and (c) relation entropy (RE) feature values. A:always follows, N : never follows, and S : sometimes follows.
every pair of activities in A. The value in a cell (i, j ) is either A, S , or N corresponding to the relation whether the activityrepresented by column j always, sometimes, or never followsthe activity represented by row i , respectively.
The variants of precedes relation can be defined along sim-ilar lines. The follows/precedes relationship is rich enough toreveal many control-flow changes in a process. We exploit thisrelationship and define various features for change detection.
We distinguish between two classes of features: 1) globaland 2) local features. Global features are defined over an eventlog, whereas local features can be defined at a trace level.With the follows (precedes) relation, we propose two globalfeatures: 1) relation type count (RC) and 2) relation entropy
(RE), and two local features: 1) window count (WC) and 2) J measure. These features are defined as follows.
1) RC: The RC with respect to the follows (precedes) rela-tion is a function, f LRC: A → N0 ×N0 ×N0, defined overthe set of activities A. f LRC of an activity, x ∈ A, withrespect to the follows (precedes) relation over an eventlog L is the triple c A, cS , c N where c A, cS , and c N
are the number of activities in A that always, sometimes,and never follows (precedes) x, respectively, in the eventlog L. For the event log L mentioned above, f LRC(a) =
2, 9, 0 because e and h always follows a while allother activities in A \ {e, h} sometimes follows a. f LRC(i) = 1, 4, 6 because only j always follows i; b,
d, e, and k sometimes follows i while a, c, f, g, h, andi never follows i. Fig. 5(b) shows the RCs for all theactivities in A [the value in a row corresponds to theRCs of the activity represented by that row in Fig. 5(a)].
For an event log containing |A| activities, this resultsin a feature vector of dimension 3 × |A| (if eitherthe follows or the precedes relation is considered) or2×3×|A| (if both the follows and the precedes relationsare considered).
2) RE: The RE with respect to the follows (precedes)relation is a function, f LRE: A → R
+0 , defined over the
set of activities. f LRE of an activity, x ∈ A with respect
Fig. 6. WC values for the relation b follows a for the different traces in theevent log.
to the follows (precedes) relation is the entropy of theRC metric. In other words, f LRE(x) = − p A log2( p A) −
pS log2( pS ) − p N log2( p N ) where p A = c A/|A|, pS =
cS /|A|, and p N = c N /|A| and c A, cS , c N = f LRC(x).For the above example event log L, f LRE(a) = 0.684
(corresponding to f LRC(a) = 2, 9, 0) and f LRE(i) =
1.322 (corresponding to f LRC(i) = 1, 4, 6). Fig. 5(c)shows the RE for all the activities in A [the value ina row corresponds to the RE of the activity representedby that row in Fig. 5(a)].
For an event log containing |A| activities, this resultsin a feature vector of dimension |A| or 2 × |A| depend-
ing on whether either or both of the follows/precedesrelations are considered.3) WC: Given a window of size l ∈ N, the WC with
respect to follows (precedes) relation is a function, f l,tWC:
A×A → N0, defined over the set of activity pairs. Givena trace t and a window of size l , let S l,t(a) be the bag of all subsequences t(i, i + l − 1), such that t(i) = a.3 LetF l,t(a, b) = [s ∈ S l,t(a) | ∃1<k ≤|s| s(k ) = b], i.e., thebag of subsequences in t starting with a and followed byb within a window of length l . The WC of the relationb follows a, f
l,tWC(a, b) = |F l,t(a, b)|.
Fig. 6 shows the WC values for the relation b followsa in the event log L using a window of length four.
4) J measure: Smyth and Goodman [41] have proposed ametric called J measure based on [42] to quantify theinformation content (goodness) of a rule. We adopt thismetric as a feature to characterize the significance of relationship between activities. The basis lies in the factthat we can consider the relation b follows a as a rule: if activity a occurs, then activity b will probably occur. The J measure with respect to follows (precedes) relationis a function f
l,tJ : A×A → R
+ defined over the set of activity pairs and a given window of length l ∈ N. Let pt(a) and pt(b) are the probabilities of occurrence of activities a and b, respectively, in a trace t. Let pl,t(a, b)be the probability that b follows a within a window of
length l, i.e., pl,t(a, b) = |F l,t(a, b)|/|S l,t(a)|. Then,the J measure for a window of length l is defined as f
l,tJ (a, b) = pt(a)CEl,t(a, b) where CEl,t(a, b) is the
cross entropy of a and b (b follows a within a windowof length l ) and is defined as4
CEl,t(a, b) = pl,t(a, b) log2
pl,t(a, b)
pt(b)
3If i + l − 1 > |t|, then t(i, i + l − 1) = ti , i.e., the suffix of the trace tstarting at i .
4log2(0/ x ) and log2( x /0) for any x ∈ R+0 is taken as 0.
7/18/2019 Dealing With Concept Drifts in Process Mining
http://slidepdf.com/reader/full/dealing-with-concept-drifts-in-process-mining-569633a3a36cd 8/18
BOSE et al.: DEALING WITH CONCEPT DRIFTS 161
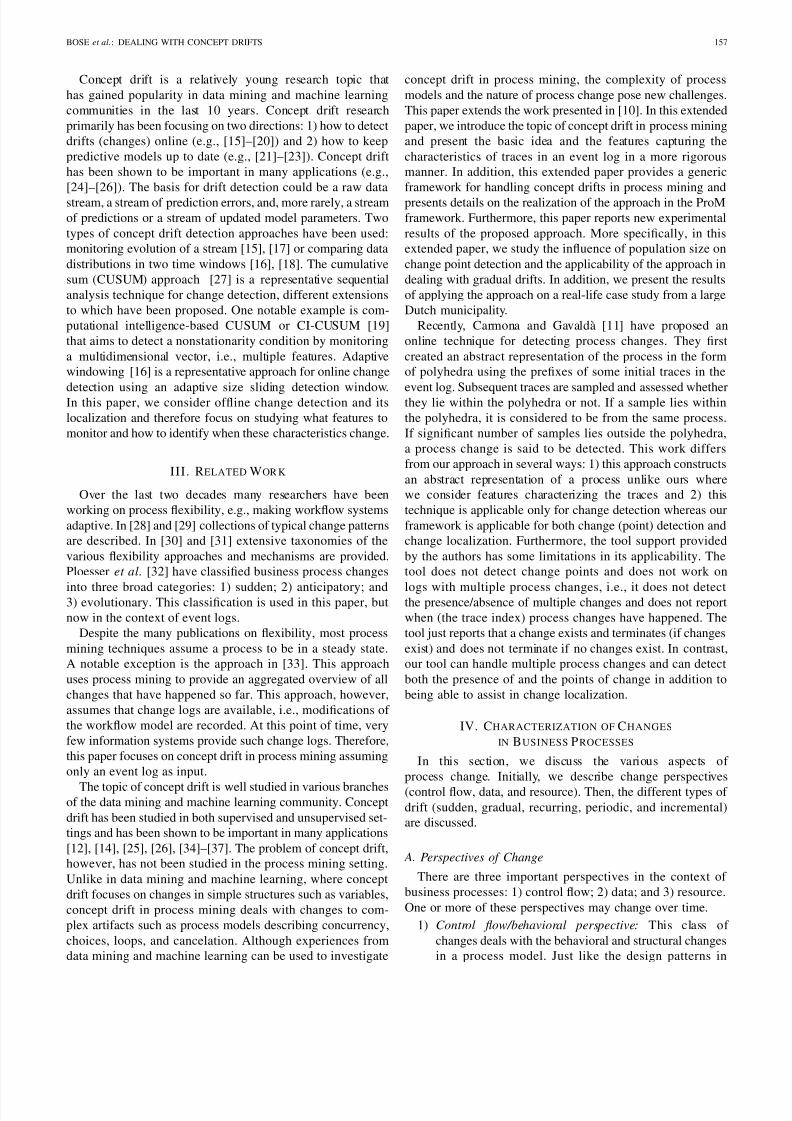
Fig. 7. Basic idea of detecting drifts using hypothesis tests. The dataset of feature values is considered as a time series for hypothesis tests. P1 and P2are two populations of size w .
+ (1 − pl,t(a, b)) log2
1 − pl,t(a, b)
1 − pt(b)
.
The J measure of a relation, b follows a, capturesthe dissimilarity between the a priori and a posteriori
beliefs about b. In other words, it measures thedifference between the a priori distribution of b (i.e.,probability that b occurs in a trace and the probabilitythat b does not occur), and the posteriori distributionof b (i.e., probability that b occurs in a trace given thata occurred and the probability that b does not occur ina trace given that a occurred).
The J measures for the relation b follows a using a
window of length four for the three traces in the eventlog L in our previous example are 0.147, 0.032, and 0,respectively.
Normally, the window size is chosen to be the average tracelength, i.e., the average number of events in a process instance,if no a priori information about the process is known. In case,we have some a priori information about the process, wecan use the process characteristics to choose an appropriatewindow size. Having defined the features, we next look at thesecond step in change point detection, i.e., drift detection.
VII. HYPOTHESIS TESTS FOR DRIFT DETECTION
An event log can be transformed into a data stream/sequenceD by choosing one of the feature sets defined in the previoussection. The dataset D of feature values can be considered asa time series of m values, as shown in Fig. 7. Each d i ∈ D
corresponds to the feature value(s) for a trace (or sublog)and can be a scalar or a vector (depending on the choiceof feature).5 Comparing with Fig. 4, m = n or m = k
depending on whether the feature values are computed for eachtrace or for each sublog, respectively. As mentioned earlier,we expect a characteristic difference in the manifestation of feature values in the traces (sublogs) before and after thechange points with the difference being more pronounced at
the boundaries. To detect this, we can consider a series of successive populations of values (of size w) and investigateif there is a significant difference between two subsequentpopulations. The premise is that differences are expected to beperceived at change points provided appropriate characteristicsof the change are captured as features. A moving windowof size w is used to generate the populations. Fig. 7 showsa scenario where two populations P1 = d1,d2, . . . , dw
5The RE, WC, and J measure feature sets proposed in Section VI generateunivariate (scalar) and multivariate (vector) data depending on whether weconsider an individual activity/activity pair or a set of activities/activity pairs,respectively. The RC feature set always generates multivariate data.
and P2 = dw+1,dw+2, . . . , d2w of size w are consid-ered. In the next iteration, the populations correspond toP1 = d2,d3, . . . , dw+1 and P2 = dw+2,dw+3, . . . , d2w+1.Given a dataset of m values, the number of population pairs(iterations) will be m − 2w + 1.
We propose the use of statistical hypothesis testingto discover these change points. Hypothesis testing is aprocedure in which a hypothesis is evaluated on a sampledata. One of the important uses of hypothesis testing is toevaluate and compare groups of data. Numerous varieties of hypothesis tests exist [43]. The choice of a particular test islargely dependent on the nature of the data and the objectivesof an experiment. For example, hypothesis tests can beclassified into parametric and nonparametric tests. Parametrictests assume that the data have a particular distribution, e.g.,normal, whereas the nonparametric tests do not make anyassumption with regards to the data distribution. Because wedo not know the a priori distribution of the feature values inan event log, we consider only nonparametric tests. Anotherperspective of classification is based on the number of
samples (populations) on which the hypothesis is defined. Wecan classify the hypothesis tests into 1) one-sample; 2) two-sample; and 3) multisample tests. Because we need to analyzetwo populations for detecting drifts, we are interested in two-sample hypothesis tests. Another classification of hypothesistests is concerned with the dimensionality of each dataelement in a sample. Tests dealing with scalar data elementsare called univariate tests while those dealing with vectordata elements are called multivariate tests. If only a particularactivity or activity pair is considered, then every data itemdi ∈ D is a scalar value corresponding to the trace/sublog i . If we, however, consider sets of activities or activity pairs, theneach data item is a vector. Therefore, we need to consider
both univariate and multivariate hypothesis tests.We will use the univariate two-sample Kolmogorov–Smirnov test (KS test) and Mann–Whitney U test (MW test)as hypothesis tests for univariate data, and the two sampleHotelling T 2 test for multivariate data. The KS test evaluatesthe hypothesis “Do the two independent samples representtwo different cumulative frequency distributions?” whereas theMW test evaluates the hypothesis “Do the two independentsamples have different distributions with respect to the rankordering of the values?”. The multivariate Hotelling T 2 test isa generalization of the t -test and evaluates the hypothesis “Dothe two samples have the same mean pattern?”. All of thesetests yield a significance probability assessing the validity of
the hypothesis on the samples. We refer [43] for a classicintroduction to various hypothesis tests.
VIII. FRAMEWORK
We propose the framework shown in Fig. 8 for analyzingconcept drifts in process mining. The framework identifies thefollowing steps:
1) Feature extraction and selection: This step pertains indefining the characteristics of the traces in an event log.In this paper, we have defined four features that charac-terize the control-flow perspective of process instances

7/18/2019 Dealing With Concept Drifts in Process Mining
http://slidepdf.com/reader/full/dealing-with-concept-drifts-in-process-mining-569633a3a36cd 9/18
162 IEEE TRANSACTIONS ON NEURAL NETWORKS AND LEARNING SYSTEMS, VOL. 25, NO. 1, JANUARY 2014
Fig. 8. Framework for handling concept drifts in process mining.
in an event log. Depending on the focus of analysis, wemay define additional features, e.g., if we are interestedin analyzing changes in organizational/resource perspec-tive, we may consider features derived from socialnetworks as a means of characterizing the event log.
In addition to feature extraction, this step also involvesfeature selection. Feature selection is important when thenumber of features extracted is large. We may considerdimensionality reduction techniques [44], [45] such asPCA [46] or random projection [47] to deal with highdimensionality.
2) Generate populations: An event log can be transformedinto a data stream based on the features selected inthe previous step. This step deals with defining thesample populations for studying the changes in thecharacteristics of traces. Different criteria/scenarios maybe considered for generating these populations fromthe data stream. In Section VII, we have considered
nonoverlapping, continuous, and fixed-size windowsfor defining the populations. We may also consider,for example, noncontinuous windows (there is a gapbetween two populations), adaptive windows (windowscan be of different lengths) [16], and so on, which aremore appropriate for dealing with gradual and recurringdrifts.
3) Compare populations: Once the sample populations aregenerated, the next step is to analyze these populationsfor any change in characteristics. In this paper, we advo-cate the use of statistical hypothesis tests for comparingpopulations. The null hypothesis in statistical tests statesthat distributions (or means, or standard deviations) of
the two sample populations are equal. Depending ondesired assumptions and the focus of analysis, differentstatistical tests can be used.
4) Interactive visualization: The results of comparativestudies on the populations of trace characteristics canbe intuitively presented to an analyst. For example, thesignificance probabilities of the hypothesis tests can bevisualized as a drift plot. Troughs in such a drift plotsignify a change in the significance probability therebyimplying a change in the characteristics of traces.
5) Analyze changes: Visualization techniques such as thedrift plot can assist in identifying the change points.
Fig. 9. Visualization of the drift plot in the concept drift plug-in in ProM.
Having identified that a change had taken place, thisstep deals with techniques that assist an analyst in char-acterizing and localizing the change and in discoveringthe change process.
The framework can be used for designing new change detec-tion approaches.
IX. IMPLEMENTATION
The concepts presented in this paper have been realizedas the concept drift plug-in in the ProM6 framework. ProMis a plug-able environment for process mining envisioned toprovide a common basis for all kinds of process mining tech-niques ranging from importing, exporting, and filtering eventlogs (process models) to analysis and visualization of results.Over years, ProM has emerged to be the de facto standard forprocess mining. The concept drift plug-in implements all of thesteps in the proposed framework and can be easily extendedwith additional elements (e.g., new features can be easilyadded). The plug-in supports visualization of the significanceprobability for the hypothesis tests as a drift plot. Fig. 9 showsa drift plot from the plug-in.
X. EXPERIMENTAL RESULTS AND D ISCUSSION
Now, we put the ideas proposed for handling conceptdrifts in practice. Initially, we illustrate the effectiveness of the proposed approaches using a synthetic example of aninsurance claim process and later discuss the results from areal-life case study in a large Dutch municipality.
A. Synthetic Log-Insurance Claim Process
This process corresponds to the handling of health insuranceclaims in a travel agency. Upon registration of a claim, ageneral questionnaire is sent to the claimant. In parallel, aregistered claim is classified as high or low. For low claims,two independent tasks: 1) check insurance and 2) checkmedical history need to be executed. For high claims, threetasks need to be executed: 1) check insurance; 2) checkmedical history; and 3) contact doctor/hospital for verification.If one of the checks shows that the claim is not valid, thenthe claim is rejected; otherwise, it is accepted. A cheque andacceptance decision letter is prepared in cases where a claim isaccepted while a rejection decision letter is created for rejectedclaims. In both cases, a notification is sent to the claimant.
6See www.processmining.org for more information and to download ProM.

7/18/2019 Dealing With Concept Drifts in Process Mining
http://slidepdf.com/reader/full/dealing-with-concept-drifts-in-process-mining-569633a3a36cd 10/18
BOSE et al.: DEALING WITH CONCEPT DRIFTS 163
Fig. 10. Variants of an insurance claim process of a travel agency representedin YAWL notation. Dashed rectangles: regions of change from its previousmodel. (a) Model 1. (b) Model 2. (c) Model 3. (d) Model 4. (e) Model 5.
Three modes of notification are supported by: 1) email;2) telephone (fax); and 3) postal mail. The case should bearchived upon notifying the claimant. This can be done with
or without the response for the questionnaire. The decision of ignoring the questionnaire, however, can only be made aftera notification is sent. The case is closed upon completion of archiving task.
Fig. 10 shows five variants of this process representedin YAWL [48] notation. Dashed rectangles: a change hasbeen done in the process model with respect to its previousvariant. The changes can have various reasons. For example,in Fig. 10(a), the different checks for high insurance claims aremodeled using a parallel (AN D) construct. A claim, however,can be rejected if any one of the checks fail. In such cases,the time and resources spent on other checks go waste.To optimize this process, the agency can decide to enforcean order on these checks and proceed on checks only if the previous check results are positive. In other words, theprocess is modified with a knockout strategy [49] adopted forthe process fragment involving the different checks for highinsurance claims, as shown in Fig. 10(b). As another example,the OR-construct pertaining to the sending of notification toclaimants in Fig. 10(c) has been modified to an exclusive-or
(XO R) construct in Fig. 10(d). The organization could havetaken a decision to reduce their workforce as a cost-cuttingmeasure. Because of the availability of limited resources,they would like to minimize the redundancy of sending thenotification through different modes of communication andrestrict it to only one of the modes. Considering an eventlog containing cases that belong to such a mix of processvariants, the objective of change point detection is to detectwhen the processes have changed. In this section, we illustratethe handling of concept drifts in the context of sudden andgradual drifts. We have modeled each of these five processvariants in CPN tools [50] and simulated 1200 traces for eachmodel.
1) Sudden Drift Change (Point) Detection: To simulate thesudden drift phenomenon, we created an event log L consistingof 6000 traces by juxtaposing each set of the 1200 traces. Theevent log contains 15 activities or event classes (i.e., |A| = 15)and 58 783 events (which is the total number of events in thelog for all the traces). Given this event logL, our first objectiveis to detect the four change points pertaining to these fiveprocess variants, as shown in Fig. 11(a). Global features canbe applied only at the log level; to facilitate this, we havesplit the log into 120 sublogs using a split size of 50 traces.In this scenario, the four change points corresponding to thefive process variants are, as shown in Fig. 11(b). We havecomputed the follows RC of all 15 activities thereby generating
a multivariate vector of 45 features for each sublog. We haveapplied the Hotelling T 2 hypothesis test on this multivariatedataset using a moving window population of size, w = 10.For this hypothesis test, we have randomly chosen 12 of the45 features with a 10-fold cross validation.7 Fig. 12(a) showsthe average significance probability of the Hotelling T 2 testfor the 10 folds on this feature set. The troughs in the plotsignify that there is a change in the distribution of the feature
7The random selection of a subset of features is primarily for two reasons:1) to deal with the curse of dimensionality and 2) the changes being centeredaround a few activities are prominently reflected only in those featurescorresponding to these activities.

7/18/2019 Dealing With Concept Drifts in Process Mining
http://slidepdf.com/reader/full/dealing-with-concept-drifts-in-process-mining-569633a3a36cd 11/18
164 IEEE TRANSACTIONS ON NEURAL NETWORKS AND LEARNING SYSTEMS, VOL. 25, NO. 1, JANUARY 2014
Fig. 11. Event log with traces from each of the five models juxtaposed. Also shown are change points between models both at the trace and sublog levels.The event log is split into 120 sublogs, each containing 50 traces. (a) Trace level. (b) Sub-log level.
Fig. 12. (a) Significance probability of Hotelling T 2 test on relation counts. Average significance probability (over all activity pairs) of (b) KS test on J measure and (c) MW test on J measure. The event log is split into sublogs of 50 traces each. x -axis: sublog index. y-axis: significance probability of thetest. Troughs: change points. Vertical grid lines: the actual (sudden) change points.
values in the log. In other words, they show that there is a drift(change) in the concept, which here corresponds to the process.It is interesting to observe that the troughs are observed aroundindexes 24, 72, and 96 which are indeed the points of change(remember that, we have split the log into 120 sublogs withthe change points at indexes 24, 48, 72, and 96). The change atindex 48 corresponding to the transition from M 2 to M 3 couldnot be uncovered using this feature set because the RCs wouldbe alike for logs generated from these two process variants.
We have considered the J measure for each sublog and forevery pair of activities, a and b in A (b follows a within a
window of length l = 10). The univariate KS and the MWtests using a population of size w = 10 are applied on the J measure of each activity pair. Fig. 12(b) shows the averagesignificance probability of the KS test on all activity pairs,whereas Fig. 12(c) shows the same for the MW test. Wecan observe that significant troughs are formed at indexes24, 48, 72, and 96 which correspond to the actual changepoints. Unlike the RC feature, the J measure feature is ableto capture all the four changes in the models. This can beattributed to the fact that the J measure uses the probability of occurrence of activities and their relations. In M 2, there couldbe cases where all the modes of notification are skipped ( XO R
construct). In M 3 at least one of the modes, however, needs
to be executed (OR construct). This results in a difference inthe distribution of activity probabilities and their relationshipprobabilities, which is elegantly captured by the J measure.Our experiences showed that KS test is more robust than theMW test. Henceforth, we report our results only using theKS test.
We have considered the J measure for each trace separatelyinstead of at the sublog level. Each activity pair generates avector of dimension 6000 corresponding to the J measureof that activity pair in each trace. The univariate KS testusing a population size of w = 400 is applied to the vector
Fig. 13. Average significance probability (over all activity pairs) of KS teston the J measure and WC feature sets estimated for each trace. x -axis: trace
index. y-axis: significance probability of the test. Troughs: change points.Vertical grid lines: actual (sudden) change points. (a) J-measure. (b) WC.
corresponding to each activity pair in A×A. Fig. 13(a) showsthe average significance probability of KS test on all activitypairs, whereas Fig. 13(b) shows the average significanceprobability of KS test on all activity pairs using the WC featureset. We can observe that significant troughs are formed atindexes 1200, 2400, 3600, and 4800. These are indeed thepoints where the models have been changed.
Influence of Population Size: It is imperative to note thatthe goodness of the results of hypothesis tests depends on
the population size. The statistical analysis assumes that eachpopulation is independent. A good population size is largelydependent on the application and the focus of analysis. Tostudy the influence of population size, we have considered the J measure for every pair of activities and the univariate KStest for change point detection. Fig. 14 shows the results forvarying sizes of the population. We observe a lot of noisefor small populations and the drift tends to be smooth as thepopulation size increases. This can be attributed to the factthat as the population size increases (i.e., as we consider morecases), the variability in the nature of cases reduces and attains

7/18/2019 Dealing With Concept Drifts in Process Mining
http://slidepdf.com/reader/full/dealing-with-concept-drifts-in-process-mining-569633a3a36cd 12/18
BOSE et al.: DEALING WITH CONCEPT DRIFTS 165
Fig. 14. Average significance probability (over all activity pairs) for different population sizes of KS test on the J measure estimated over all activity pairsin each trace. x -axis: trace index. y-axis: significance probability of the test. Troughs: change points. Vertical grid lines: actual (sudden) change points. (a) w= 150, (b) w = 300, (c) w = 450, and (d) w = 600.
a stability, e.g., there can be a flux of low-insurance claimsinitially and after a certain time the proportion stabilizes.
2) Sudden Drift Change Localization: Our second objectivein handling concept drifts is that of change localization. Tolocalize the changes (identify the regions of change), we needto consider activity pairs individually or subsets of activitypairs. For example, the change from M 1 to M 2 is localizedin the region pertaining to high insurance claim checks. We
expect characteristic changes in features pertaining to theseactivities and other activities related to these activities. Forexample, in M 1, the activities High Medical History Check andContact Hospital always follow the activity Register whenevera claim is classified as high. In contrast, in M 2, these activitiesneed not always follow Register because both these activitiesare skipped if High Insurance Check fails while ContactHospital is skipped if High Medical History Check fails.During simulation, we have set the probability of success of a check to 90%. We have considered the WC feature forthe activity relation Contact Hospital follows Register on awindow length of l = 10 in each trace separately. Fig. 15(a)shows the significance probability of the univariate KS test
using a population size of w = 400 on this feature. We canobserve that one dominant trough is formed at index 1200showing that there exists a change in the region betweenRegister and Contact Hospital. No subsequent changes withrespect to this activity pair can be noticed, which is indeedthe case in the sequence of models used.
As another example, we have considered the activityPrepare Notification along with all the three Send Notifi-cation activities. There exists a change pertaining to theseactivities between models M 2 and M 3, M 3 and M 4, and M 4 and M 5. More specifically, we have considered the WCfeature on the activity relations: Send Notification By Phonefollows Prepare Notification, Send Notification By email fol-
lows Prepare Notification, and Send Notification By Postfollows Prepare Notification. Fig. 15(b) shows the averagesignificance probability of the univariate KS tests using apopulation size of w = 400 on the WC feature for variousmodes of send notification follows prepare notification. Weobserve three dominant troughs around indexes 2400, 3600,and 4800 signifying the changes in the models. Certain falsealarms (minor troughs) can also be noticed in this plot.One means of alleviating this is to consider only those alarmswith an average significance probability less than a thresh-old, δ . Another means is to consider a larger population size.In this fashion, by considering activities (and/or activity pairs)
of interest, we can localize the regions of change. Furthermore,using this approach, we can obtain answers to diagnosticquestions such as Is there a change with respect to activity
a in the process at time period t ?The WC feature performs better in change localization
in comparison with the J measure. This is because the J
measure uses the probability of activities which can be affectedbecause of changes anywhere in the process irrespective of ourregion of focus. For example, consider the J measure for the
relation Contact Hospital follows Register. The probability of occurrence of both Register and Contact Hospital is affectedby the changes in the process model corresponding to thesending of notifications as well, e.g., in M 3 because all themodes of send notification can be executed, the probability of Contact Hospital in a trace is smaller than a correspondingtrace (Contact Hospital is executed) in M 4 where only oneof the notifications is possible. Fig. 15(c) shows the signifi-cance probability of the univariate KS test on the J measurefor the activity relation Contact Hospital follows Register,whereas Fig. 15(d) shows the average significance probabilityof the univariate KS tests on the J measure of variousSend Notification modes following Prepare Notification usinga population size of w = 400. Although the J measurecan identify changes, it has problems localizing the changeregions. Therefore, we recommend the use of WC feature forchange localization.
3) Gradual Drift Change (Point) Detection: Now, we assessthe accuracy of the proposed framework in handling gradualdrifts. Recall that in gradual drifts, one concept fades graduallywhile the other takes over. This phenomenon of gradualchange can be modeled in many ways. In this paper, weconsider the scenario where the change is linear betweentwo sources, as shown in Fig. 16(a). In this figure, weobserve the fading of one concept M 1 and the taking over
of another concept M 2 happen linearly. Within this setup,we can alter the extent to which the two concepts coexist.For the insurance claim example, we generated two eventlogs exhibiting gradual drifts by varying the duration of change. In the first case, the process variants M 1 and M 2coexist between trace indexes 1000 and 1400, the variants M 2 and M 3 coexist between indexes 2200 and 2600, thevariants M 3 and M 4 coexist between indexes 3400 and3800, and the variants M 4 and M 5 coexist between indexes4600 and 5000, as shown in Fig. 16(b). The point of crossover is still retained at indexes 1200, 2400, 3600, and4800.

7/18/2019 Dealing With Concept Drifts in Process Mining
http://slidepdf.com/reader/full/dealing-with-concept-drifts-in-process-mining-569633a3a36cd 13/18
166 IEEE TRANSACTIONS ON NEURAL NETWORKS AND LEARNING SYSTEMS, VOL. 25, NO. 1, JANUARY 2014
Fig. 15. (a) Significance probability of KS test for the relation, Contact Hospital follows Register using the WC feature. (b) Average significance probability(over activity pairs) of KS test estimated for the various modes of Send Notification follows Prepare Notification relation using the WC feature. (c) Significanceprobability of KS test for the relation, Contact Hospital follows Register using the J measure. (d) Average significance probability (over activity pairs) of KStest estimated for the various modes of Send Notification follows Prepare Notification relation using the J measure. Troughs: change point with respect tothese activities. x -axis: trace index. y-axis: significance probability of the test.
Fig. 16. Experimental setup for gradual drifts. (a) Generic scenario of linear gradual change between different process variants. (b) Linear gradualchange with an overlapping window of 400 instances between any two processvariants.
Fig. 17. Average significance probability (over all activity pairs) of KS teston the J measure for linear gradual change with an overlapping window of (a) 400 instances between any two process variants and (b) 900 instancesbetween any two process variants. Dashed vertical grid lines: actual onset of gradual change. Corresponding solid vertical grid lines: actual end points of gradual change.
Fig. 17(a) shows the average significance probability of theunivariate KS test over all activity pairs on the J measure usinga population of size 300. We can observe that the proposedapproach is able to detect the change points. It is, however,noteworthy that the width of the troughs is wider (at the top)in the gradual drift scenario when compared with the suddendrift scenario [compare Figs. 14(b) and 17(a)] signifying anearlier onset of change in the gradual drift phenomenon. Wegenerated another event log with a linear gradual drift but witha longer duration of change. In this case, the process variants
M 1 and M 2 coexist between trace indexes 750 and 1650, thevariants M 2 and M 3 coexist between indexes 1950 and 2850,the variants M 3 and M 4 coexist between indexes 3150 and4050, and the variants M 4 and M 5 coexist between indexes4350 and 5150. Fig. 17(b) shows the average significanceprobability of the univariate KS test over all activity pairs onthe J measure using a population of size 450. Even in thiscase, we can clearly identify the points and the duration of change is captured as a much wider trough when comparedwith the sudden drift scenario [compare Figs. 14(c) and 17(b)].
4) Gradual Drift Change Localization: Similar to suddendrift change localization, we have considered the WC feature
Fig. 18. (a) Significance probability of KS test for the relation, ContactHospital follows Register using the WC feature. (b) Average significanceprobability (over activity pairs) of KS test estimated for the various modes of Send Notification follows Prepare Notification relation using the WC feature.
for the activity relation Contact Hospital follows Register ona window length of l = 10 in each trace separately on thegradual drift log with a longer duration of graduality (i.e., alog with linear gradual change with an overlapping window of 900 instances between any two process variants.). Fig. 18(a)shows the significance probability of the univariate KS testusing a population size of w = 400 on this feature. We can
observe that one dominant trough is formed at index 1200showing that there exists a change in the region betweenRegister and Contact Hospital. No subsequent changes withrespect to this activity pair can be noticed, which is indeed thecase in the sequence of models used. Unlike the sudden driftscenario, the onset of change, however, happens much earlier[compare it with Fig. 15(a)]. Fig. 18(b) shows the averagesignificance probability of the univariate KS tests using apopulation size of w = 400 on the WC feature for variousmodes of send notification follows prepare notification. Evenhere, we observe three dominant troughs around indexes 2400,3600, and 4800 signifying the changes in the models withearlier onsets of change [compare it with Fig. 15(b)].
B. Real-Life Log: Advertisement Permit Process
of a Dutch Municipality
The synthetic event data created through simulation allowus to compare the controlled (ground truth) changes with thedetected changes. We, however, have also applied our conceptdrift analysis techniques to various real-life event logs. Here,we report on a case study where we analyzed concept driftsin processes within a large Dutch municipality. Municipalitiesare interested in obtaining insights into their processes, e.g.,the way they are planned to be executed vis-a-vis the way

7/18/2019 Dealing With Concept Drifts in Process Mining
http://slidepdf.com/reader/full/dealing-with-concept-drifts-in-process-mining-569633a3a36cd 14/18
BOSE et al.: DEALING WITH CONCEPT DRIFTS 167
they are actually executed. Recently, different municipalitiesin the Netherlands have evinced interest in comparing theirprocesses and learning from each other (the interested reader isreferred to the CoSeLog project [51] for further information).Their vision is to have a form of standardization througha centrally managed process management system [52]–[55].When analyzing event logs, we need to factor in the possibilityof process changes, i.e., concept drifts, that could have takenplace. In this section, we present the results of analysis of concept drifts in event logs pertaining to one of the processesrelated to permits for advertisements. If a person/organizationwants to advertise on a building in the Netherlands, for exam-ple, on a billboard or an illuminated sign, a permit is neededusually, which can be obtained from the local municipality.
We considered an event log containing 116 cases and 2335events referring to 25 activities. The cases pertain to permitrequests for placing advertisements spanning over the periodbetween July 7, 2003 and March 18, 2008. We considered the J measure feature on the follows relation for all activity pairsusing a window of size 10. This choice of window size was
made based on the characteristics of the process. The processhas four high-level subprocesses: 1) application and initialchecks; 2) regulation compliance checks; 3) decision andadministration; and 4) enforcement, with clear dependenciesbetween them. One subprocess cannot start until the previousone finished. Therefore, the dependencies between activitiesare primarily manifested between one subprocess and theinitial few activities of its immediate successor. The eventlog contains 25 event classes (distinct activities) with eachsubprocess on an average defined over six activities. Becausethe dependencies are mostly reflected in one subprocess andthe initial few activities of the next subprocess, a window sizeof 10 is deemed appropriate. In fact, we have tried using other
window sizes larger than 10 as well; however, we did notnotice any difference in performance with respect to changedetection and change localization. Because a smaller windowsize is computationally efficient, we report the results onwindow size of 10.
The J measure values of each activity pair define a vectorof size 116, corresponding to the traces in the event log.The univariate KS test is applied on each of these vectorsusing a population size of 10. Fig. 19 shows the averagesignificance probability of the KS test on all activity pairs.We observe four troughs formed at indexes 42, 74, 84, and103. These troughs signify a change in behavior in the tracespreceding and succeeding them. Among the four troughs, the
one at index 42 is particularly significant. Fig. 19 also showsthe start timestamps (October 4, 2004, October 27, 2005,February 13, 2006, and August 31, 2006, respectively) of thecases corresponding to these troughs.
With the four change points, we split the log into fivepartitions, the first, L1, containing the traces from thebeginning until the first change point (i.e., traces 1–42), thesecond, L2, containing the traces between the first and secondchange points (i.e., traces 43–74) and so on. Fig. 20 shows theprocess model discovered using the Heuristic miner [56] onthe event log L1. The process can be divided into four high-level subprocedures, as shown in the figure, and are listed as
Fig. 19. Average significance probability (over all activity pairs) of KS teston J measure. The population size for the KS test is 10. There are fourtroughs signifying a change in behavior.
follows.
1) Upon submission of an application, the municipalityacknowledges the receipt of documents and (optionally)tests for its completeness.
2) Then, the municipality proceeds with a follow-upprocedure that verifies whether the application and
submitted documents are in compliance with theregulations.3) With the investigations, then the municipality makes a
decision on the application and informs the applicantwith the decision along with a fee letter.
4) Finally, the municipality registers the advertisementsplaced and enforces them.
Fig. 20(b) shows the process model discovered using theHeuristic miner [56] on the event log L2. The figure highlightsregions that differ from the process model in Fig. 20(a). Thereare two changes in this model with respect to the previous one.The first change is related to the checking for completenessof the registered documents. In the initial process model
[Fig. 20(a)], this check was not mandatory (only two of the 43applications were checked for completeness). The municipalitychanged this process by making the checks mandatory beforeproceeding. The second change is the introduction of a newactivity ‘End procedure; enforcement is next,’ as shown inFig. 20(b). The initial process model had only the activity‘End procedure, possibly choose enforcement’ where as thenew model has both these activities. Similar changes havebeen observed in the rest of the models. We do not providethem here because of space constraints. For a more detaileddiscussion on this case study refer [57].
The experiments demonstrate that the features and theframework proposed in this paper for handling concept drifts
show significant promise in detecting behavioral changes byanalyzing event logs.
C. Time Complexity
In this section, we assess the time complexity of the pro-posed approach. The feature extraction is dependent on the sizeof the event log (i.e., the number of events). The feature valuesfor all of the features proposed in this paper can be extracted inlinear time with respect to the size of the event log. Fig. 21(a)shows the average time along with 95% confidence intervals(over five independent runs) for extracting the J measure

7/18/2019 Dealing With Concept Drifts in Process Mining
http://slidepdf.com/reader/full/dealing-with-concept-drifts-in-process-mining-569633a3a36cd 15/18
168 IEEE TRANSACTIONS ON NEURAL NETWORKS AND LEARNING SYSTEMS, VOL. 25, NO. 1, JANUARY 2014
Fig. 20. Heuristic net of the permit process for advertisements discovered using the event log L1 (a) marked regions: high-level subprocedures in this processand (b) dashed rectangles: regions of change with respect to the previous model in (a). For a more detailed discussion on this case study refer to [57].
Fig. 21. Time complexity analysis: average time along with 95% confidence intervals (over five independent runs) for feature extraction and hypothesis tests.
(a) J-measure. (b) Influence of number of traces. (c) Influence of population size.
feature for varying sizes of event log. For this experiment, weconsidered the first 1000, 2000, 3000, 4000, 5000, and 6000traces in the juxtaposed event log (of the insurance claimexample used in Section X-A). Because the average numberof events is the same in each of these logs, we depict thenumber of traces in the x -axis. We can observe that timecomplexity varies linearly with respect to the size of thelog. The hypothesis tests on the other hand depend on thepopulation size and the number of traces in the event log
(because the data stream of feature values is dependent onthe number of traces). The number of hypothesis tests to beperformed for a given data stream of n values (i.e., n traces)using a population size of p is n − 2 ∗ p + 1. The time foreach hypothesis test is dependent on the specific hypothesistest adopted and the population size. Fig. 21(b) shows theaverage time along with the 95% confidence intervals (overfive independent runs) for the KS and MW tests using apopulation size of 300 over all activity pairs on the J measure

7/18/2019 Dealing With Concept Drifts in Process Mining
http://slidepdf.com/reader/full/dealing-with-concept-drifts-in-process-mining-569633a3a36cd 16/18
BOSE et al.: DEALING WITH CONCEPT DRIFTS 169
feature for varying number of traces. Fig. 21(c) shows theaverage time along with the 95% confidence intervals (overfive independent runs) for the KS and MW tests over allactivity pairs on the J measure feature for varying populationsizes (we have used the event log with 6000 traces for thisexperiment). We can observe that the time complexity of thehypothesis tests varies linearly with respect to both the numberof traces and the population size. Because our approach isprimarily intended for offline use, the overall time for changedetection is reasonable. Furthermore, we have consideredall activity pairs as features and the average significance p-values over them for this experiment. The overall compu-tation time can be further reduced by robust feature selectiontechniques.
XI. CONCLUSION
In this paper, we have introduced the topic of conceptdrift in process mining, i.e., analyzing process changes basedon event logs. We proposed feature sets and techniques toeffectively detect the changes in event logs and identify theregions of change in a process. Our initial results show thatheterogeneity of cases arising because of process changes canbe effectively dealt with by detecting concept drifts. Oncechange points are identified, the event log can be partitionedand analyzed. This is the first step in the direction of dealingwith changes in any process monitoring and analysis efforts.We have considered changes only with respect to the control-flow perspective manifested as sudden and gradual drifts.Therefore, our analysis should only be observed as the startingpoint for a new subfield in the process mining domain andthere are lots of challenges that still need to be addressed.Some of these challenges include.
1) Change-pattern specific features: In this paper, we pre-sented very generic features (based on follows/precedesrelation). These features are neither complete nor suf-ficient to detect all classes of changes. An importantdirection of research would be to define features cateringto different classes of changes and investigate their effec-tiveness. A taxonomy/classification of change patternsand the appropriate features for detecting changes withrespect to those patterns are needed.
2) Feature selection: The feature sets presented in thispaper result in a large number of features. For example,the activity relation count feature type generates 3 × |A|
features whereas the WC and J measure generate |A|2
features (corresponding to all activity pairs). On theone hand, such high dimensionality makes analysisintractable for most real-life logs. On the other hand,changes being typically concentrated in a small regionof a process make it unnecessary to consider all features.There is a need for tailored dimensionality reductiontechniques [44], [45] that can efficiently select the mostappropriate features.
3) Holistic approaches: In this paper, we discussed ideason change detection and localization in the contextof sudden and gradual changes to the control-flowperspective of a process. As mentioned in Section IV,
the data and resource perspectives are also, however,equally important. Features and techniques thatcan enable the detection of changes in these otherperspectives need to be discovered. Furthermore, therecould be instances where more than one perspective(e.g., both control and resource) change simultaneously.Hybrid approaches considering all aspects of changeholistically need to be developed.
4) Recurring drifts: When dealing with recurring drifts,in addition to change point detection and changelocalization, it is important to identify the variant(s)that recur. This requires robust metrics to assess thesimilarity between process variants and/or event logs.
5) Change process discovery: As mentioned earlier, afterdetecting the change points and the regions of change,it is necessary to put them together in perspective.Organizations would be interested in discovering theevolution of change (e.g., as an animation depictinghow the process has changed/evolved over time). Inaddition, there are other applications such as deriving
a configurable model for the process variants. Aconfigurable process model describes a family of similar process models [58]. The process variantsdiscovered using concept drift can be merged to derivea configurable process model.
6) Sample complexity: Sample complexity refers to thenumber of traces (size of the event log) neededto detect, localize, and characterize changes withinacceptable error bounds. This should be sensitive to thevariability in processes (in the manifestation of variousprocess model constructs used), nature of changes, theirinfluence and manifestation in traces, and the featurespace and algorithms used for detecting drifts. On a
broader note, the topic of sample complexity is relevantto all facets of process mining and is hardly addressed.For example, it would be interesting to know the lowerbound on the number of traces required to discover aprocess model with a desired fitness.
7) Online (on-the-fly) drift detection: In this paper, we havelooked at detecting drifts in an offline setting, i.e., forpostmortem analysis. Although detecting concept driftsis important for offline analysis, it is more interestingand appropriate for online analysis. We believe theproposed framework to be applicable even for onlineanalysis. Few new challenges, however, emerge, e.g.,the number of samples required remains an issue. In
addition, we need additional computational power andefficient techniques to do such analysis in near real time.
REFERENCES
[1] (2010). All-in-one Permit for Physical Aspects: (Omgev-ingsvergunning) in a Nutshell [Online]. Available: http://www.answersforbusiness.nl/regulation/all-in-one-permit-physical-aspects
[2] United States Code. (2002, Jul.). Sarbanes-Oxley Act of 2002,
PL 107-204, 116 Stat 745 [Online]. Available: http://files.findlaw.com/news.findlaw.com/cnn/docs/gwbush/sarbanesoxley072302.pdf
[3] W. M. P. van der Aalst, M. Rosemann, and M. Dumas, “Deadline-basedescalation in process-aware information systems,” Decision Support Syst., vol. 43, no. 2, pp. 492–511, 2011.

7/18/2019 Dealing With Concept Drifts in Process Mining
http://slidepdf.com/reader/full/dealing-with-concept-drifts-in-process-mining-569633a3a36cd 17/18
170 IEEE TRANSACTIONS ON NEURAL NETWORKS AND LEARNING SYSTEMS, VOL. 25, NO. 1, JANUARY 2014
[4] M. Dumas, W. M. P. van der Aalst, and A. H. M. Ter Hofstede, Process- Aware Information Systems: Bridging People and Software Through
Process Technology. New York, NY, USA: Wiley, 2005.[5] W. M. P. van der Aalst and K. M. van Hee, Workflow Management:
Models, Methods, and Systems. Cambridge, MA, USA: MIT Press,2004.
[6] W. M. P. van der Aalst, Process Mining: Discovery, Conformance and Enhancement of Business Processes. New York, NY, USA: Springer-Verlag, 2011.
[7] B. F. van Dongen and W. M. P. van der Aalst, “A meta model for process
mining data,” in Proc. CAiSE Workshops (EMOI-INTEROP Workshop),vol. 2. 2005, pp. 309–320.[8] C. W. Günther, (2009). XES Standard Definition [Onlilne]. Available:
http://www.xes-standard.org[9] F. Daniel, S. Dustdar, and K. Barkaoui, “Process mining manifesto,” in
BPM 2011 Workshops, vol. 99. New York, NY, USA: Springer-Verlag,2011, pp. 169–194.
[10] R. P. J. C. Bose, W. M. P. van der Aalst, I. Žliobaite, and M. Pechenizkiy,“Handling concept drift in process mining,” in Proc. Int. CAiSE , 2011,pp. 391–405.
[11] J. Carmona and R. Gavaldà, “Online techniques for dealing with conceptdrift in process mining,” in Proc. Int. Conf. IDA, 2012, pp. 90–102.
[12] J. Schlimmer and R. Granger, “Beyond incremental processing: Trackingconcept drift,” in Proc. 15th Nat. Conf. Artif. Intell., vol. 1. 1986,pp. 502–507.
[13] A. Bifet and R. Kirkby. (2011). Data Stream Mining: A Practical Approach, University of Waikato, Waikato, New Zealand [Online].
Available: http://www.cs.waikato.ac.nz/~abifet/MOA/StreamMining.pdf [14] I. Žliobaite, “Learning under concept drift: An Overview,”CoRR, vol. abs/1010.4784, 2010 [Online]. Available:http://arxiv.org/abs/1010.4784
[15] J. Gama, P. Medas, G. Castillo, and P. Rodrigues, “Learning with driftdetection,” in Proc. SBIA, 2004, pp. 286–295.
[16] A. Bifet and R. Gavaldà, “Learning from time-changing data withadaptive windowing,” in Proc. 7th SIAM Int. Conf. Data Mining (SDM) ,2007, pp. 443–448.
[17] G. J. Ross, N. M. Adams, D. K. Tasoulis, and D. J. Hand, “Exponentiallyweighted moving average charts for detecting concept drift,” Pattern
Recognit. Lett., vol. 33, no. 2, pp. 191–198, 2012.[18] K. Nishida and K. Yamauchi, “Detecting concept drift using statistical
testing,” in Proc. 10th Int. Conf. Discovery Sci. . 2007, pp. 264–269.[19] C. Alippi and M. Roveri, “Just-in-time adaptive classifiers–Part I:
Detecting nonstationary changes,” IEEE Trans. Neural Netw., vol. 19,no. 7, pp. 1145–1153, Jul. 2008.
[20] C. Alippi, G. Boracchi, and M. Roveri, “Just-in-time classifiers forrecurrent concepts,” IEEE Trans. Neural Netw. Learn. Syst., vol. 24,no. 4, pp. 620–634, Apr. 2013.
[21] J. Z. Kolter and M. A. Maloof, “Dynamic weighted majority: Anensemble method for drifting concepts,” J. Mach. Learn. Res., vol. 8,pp. 2755–2790, Jan. 2007.
[22] R. Elwell and R. Polikar, “Incremental learning of concept drift innonstationary environments,” IEEE Trans. Neural Netw., vol. 22, no. 10,pp. 1517–1531, Oct. 2011.
[23] G. Widmer and M. Kubat, “Learning in the presence of conceptdrift and hidden contexts,” Mach. Learn., vol. 23, no. 1, pp. 69–101,Apr. 1996.
[24] S. J. Delany, P. Cunningham, A. Tsymbal, and L. Coyle, “A case-basedtechnique for tracking concept drift in spam filtering,” Knowl. Based
Syst., vol. 18, nos. 4–5, pp. 187–195, Aug. 2005.[25] A. Tsymbal, M. Pechenizkiy, P. Cunningham, and S. Puuronen, “Han-
dling local concept drift with dynamic integration of classifiers: Domain
of antibiotic resistance in nosocomial infections,” in Proc. 19th IEEE Int. Symp. CBMS , Nov. 2006, pp. 679–684.
[26] M. Pechenizkiy, J. Bakker, I. Žliobaite, A. Ivannikov, and T. Kärkkäinen,“Online mass flow prediction in CFB boilers with explicit detec-tion of sudden concept drift,” SIGKDD Explorations, vol. 11, no. 2,pp. 109–116, 2009.
[27] E. S. Page, “Continuous inspection schemes,” Biometrika, vol. 41,nos. 1–2, pp. 100–115, 1954.
[28] N. Mulyar, “Patterns for process-aware information systems: Anapproach based on colored Petri nets,” Ph.D. dissertation, Dept. Comput.Sci., Univ. Technol., Eindhoven, The Netherlands, 2009.
[29] B. Weber, S. Rinderle, and M. Reichert, “Change patterns and changesupport features in process-aware information systems,” in Proc. 19th
Int., 2007, pp. 574–588.[30] G. Regev, P. Soffer, and R. Schmidt, “Taxonomy of flexibility in business
processes,” in Proc. 7th Workshop BPMDS , 2006, pp. 1–4.
[31] H. Schonenberg, R. Mans, N. Russell, N. Mulyar, and W. M. P. van derAalst, “Process flexibility: A survey of contemporary approaches,” inProc. Adv. Enterprise Eng. I , 2008, pp. 16–30.
[32] K. Ploesser, J. C. Recker, and M. Rosemann, “Towards a classificationand lifecycle of business process change,” in Proc. BPMDS , vol. 8. 2008,pp. 1–9.
[33] C. W. Günther, S. Rinderle-Ma, M. Reichert, and W. M. P. van derAalst, “Using process mining to learn from process changes in evolu-tionary systems,” Int. J. Business Process Integr. Manag., vol. 3, no. 1,pp. 61–78, 2008.
[34] M. van Leeuwen and A. Siebes, “StreamKrimp: Detecting change indata streams,” in Proc. Mach. Learn. Knowl. Discovery Databases, 2008,pp. 672–687.
[35] I. Žliobaite and M. Pechenizkiy. (2010). Handling Con-cept Drift in I nformation S ystems [Online]. Available:http://sites.google.com/site/zliobaite/CD_applications_2010.pdf
[36] H. Wang, W. Fan, P. S. Yu, and J. Han, “Mining concept-drifting datastreams using ensemble classifiers,” in Proc. 9th ACM SIGKDD Int.Conf. Knowl. Discovery Data Mining. 2003, pp. 226–235.
[37] D. Brzezinski and J. Stefanowski, “Reacting to different types of conceptdrift: The accuracy updated ensemble algorithm,” IEEE Trans. Neural
Netw. Learn. Syst., Apr. 2013, doi: 10.1109/TNNLS.2013.2251352.[38] W. M. P. van der Aalst, A. Adriansyah, and B. Dongen, “Replay-
ing history on process models for conformance checking and perfor-mance analysis,” WIREs Data Mining Knowl. Discovery, vol. 2, no. 2,pp. 182–192, 2012.
[39] M. Hammer, Beyond Reengineering: How the Process-Centered Orga-
nization is Changing Our Work and Our Lives. New York, NY, USA:Harper business, 1996.
[40] L. L. Minku, A. P. White, and X. Yao, “The impact of diver-sity on online ensemble learning in the presence of concept drift,”
IEEE Trans. Knowl. Data Eng., vol. 22, no. 5, pp. 730–742,May 2010.
[41] P. Smyth and R. M. Goodman, Rule Induction Using Information
Theory. Washington, DC, USA: AAAS Press, 1991, pp. 159–176.[42] N. M. Blachman, “The amount of information that y gives about X ,”
IEEE Trans. Inf. Theory, vol. 14, no. 1, pp. 27–31, Jan. 1968.[43] D. Sheskin, Handbook of Parametric and Nonparametric Statistical
Procedures. London, U.K.: Chapman & Hall/CRC, 2004.[44] I. K. Fodor, “A survey of dimensionality reduction techniques,” in
Proc. Center Appl. Sci. Comput., Lawrence Livermore Nat. Lab., 2002,pp. 1–24.
[45] I. Guyon and A. Elisseeff, “An introduction to variable and featureselection,” J. Mach. Learn. Res., vol. 3, pp. 1157–1182, Mar. 2003.
[46] I. T. Jolliffe, Principal Component Analysis, 2nd ed., New York, NY,USA: Springer-Verlag, 2002.
[47] E. Bingham and H. Mannila, “Random projection in dimensionalityreduction: Applications to image and text data,” in Proc. 7th ACM SIGKDD Int. Conf. Mining, 2001, pp. 245–250.
[48] W. M. P. van der Aalst and A. H. M. ter Hofstede, “YAWL: Yet anotherworkflow language,” Inf. Syst., vol. 30, no. 4, pp. 245–275, 2005.
[49] W. M. P. van der Aalst, “Re-engineering knock-out processes,” DecisionSupport Syst., vol. 30, no. 4, pp. 451–468, 2001.
[50] K. Jensen and L. M. Kristensen, Colored Petri Nets: Modeling and
Validation of Concurrent Systems. New York, NY, USA: Springer-Verlag, 2009.
[51] CoSeLog, (2013). Configurable Services for Local Governments, Ger-many [Online]. Available: http://www.win.tue.nl/coselog
[52] W. M. P. van der Aalst, “Configurable services in the cloud: Supportingvariability while enabling cross-organizational process mining,” in On
the Move to Meaningful Internet Systems (OTM 2010), LNCS 6426.New York, NY, USA: Springer-Verlag, Jan. 2010, pp. 8–25.[53] W. M. P. van der Aalst, “Intra- and inter-organizational process mining:
Discovering processes within and between organizations,” in Proc.Pract. Enterprise Model., 2011, pp. 1–11.
[54] J. C. A. M. Buijs, B. F. van Dongen, and W. M. P. van der Aalst,“Towards cross-organizational process mining in collections of processmodels and their executions,” in Proc. Int. Workshop PMC , 2011,pp. 1–14.
[55] J. J. C. L. Vogelaar, H. M. W. Verbeek, and W. M. P. van derAalst, “Comparing business processes to determine the feasibility of configurable models: A case study,” in Proc. Int. Workshop PMC , 2011,pp. 1–12.
[56] A. J. M. M. Weijters and W. M. P. van der Aalst, “Rediscoveringworkflow models from event-based data using little thumb,” Integr.Comput. Aided Eng., vol. 10, no. 2, pp. 151–162, 2003.

7/18/2019 Dealing With Concept Drifts in Process Mining
http://slidepdf.com/reader/full/dealing-with-concept-drifts-in-process-mining-569633a3a36cd 18/18
BOSE et al.: DEALING WITH CONCEPT DRIFTS 171
[57] R. P. J. C. Bose, W. M. P. van der Aalst, I. Žliobaite, and M. Pechenizkiy,“Dealing with concept drifts in process mining: A case study in a Dutchmunicipality,” BPM Center, Univ. Technol., Singapore, Tech. Rep. BPM-13-13, 2013.
[58] W. M. P. van der Aalst, N. Lohmann, and M. L. Rosa, “Ensuringcorrectness during process configuration via partner synthesis,” Inf. Syst.,vol. 37, no. 6, pp. 574–592, 2012.
R. P. Jagadeesh Chandra Bose received the Ph.D.(cum laude) degree in process mining from Technis-che Universiteit Eindhoven, Eindhoven, The Nether-lands.
He is a Research Scientist with Xerox ResearchCenter India, Bangalore, India. He has over eightyears of research experience in the industry, andhe has executed projects in the areas of softwareengineering, health care, business analytics, andknowledge management. He has co-authored over30 publications and five patent filings. His current
research interests include process mining, business process management,business intelligence (analytics), machine learning, data mining, and bioin-formatics.
Dr. Bose has received various awards for excellence in academics.
Wil M. P. van der Aalst received the Doctor Hon-oris Causa degree from Hasselt University, Diepen-beek, Belgium, in 2012.
He is a Full Professor of information systems withthe Technische Universiteit Eindhoven (TU/e), Eind-hoven, The Netherlands. He is the Academic Super-visor of the International Laboratory of Process-Aware Information Systems, National ResearchUniversity, Higher School of Economics, Moscow,Russia. Since 2003, he has held a part-time appoint-ment with the Queensland University of Technology,
Queensland, Australia. His ideas have influenced researchers, software devel-opers, and standardization committees working on process support. In 2013, hewas a Distinguished University Professor at TU/e. His papers are highly cited
(he has an H-index of more than 103 according to Google Scholar, making himthe European computer scientist with the highest H-index). He has publishedmore than 160 journal papers, 17 books (as author or editor), 300 refereedconference/workshop publications, and 50 book chapters. His current researchinterests include workflow management, process mining, Petri nets, businessprocess management, process modeling, and process analysis.
Dr. van der Aalst is a member of the Royal Holland Society of Sciencesand Humanities (Koninklijke Hollandsche Maatschappij der Wetenschappen)and the Academy of Europe (Academia Europaea).
Indre Žliobaite is a Research Scientist with AaltoUniversity, Aalto, Finland. Her current researchinterests include predictive modeling from evolvingstreaming data, change detection, and predictiveanalytics applications. For further information seehttp://zliobaite.googlepages.com.
Mykola Pechenizkiy received the Ph.D. degreein computer science and information systems fromthe University of Jyvaskyla, Jyvaskyla, Finland, in2005.
He is an Assistant Professor with the Departmentof Computer Science, Eindhoven University of Tech-nology, Eindhoven, The Netherlands. He has co-authored over 70 peer-reviewed publications and hasbeen organizing several workshops (HaCDAIS atECML/PKDD in 2010, LEMEDS at AIME in 2011),conferences (IEEE CBMS in 2012, EDM in 2011,
IEEE CBMS in 2008, and BNAIC in 2009) and tutorials (at ECML/PKDDin 2012, PAKDD in 2011, IEEE CBMS in 2010, and ECML/PKDD in
2010). He has co-edited the Handbook of Educational Data Mining. Hiscurrent research interests include data mining and data-driven intelligence,and its application to various (adaptive) information systems serving industry,commerce, medicine, and education.
Dr. Pechenizkiy has served as a Guest Editor of the special issues inSIGKDD Explorations, Elsevier’s DKE and AIIM , and Springer’s EvolvingSystems Journals. Currently, he takes a leading role in NWO HaCDAIS, STWCAPA, EIT ICT Labs Stress at Work, and NL Agency CoDaK.


![Data Mining - Data Dealing: Sind wir schon alle gläsern? · 1 Mike Kuketz Data Mining - Data Dealing: Sind wir schon alle gläsern? Safer Internet Day [ 07.02.2017 - Stuttgart ]](https://img.pdfslide.net/doc/110x75/5e21cc014c1e2e62003b42f3/data-mining-data-dealing-sind-wir-schon-alle-glsern-1-mike-kuketz-data-mining.jpg)