Embed Size (px)
Citation preview

1
Wednesday, 14 May 2003
Dealing with spatial dimensions of inequality in Indonesia: towards a social accord1
Iyanatul IslamSchool of International Business and Asian StudiesGriffith UniversityNathanQld 4111AustraliaTel and voicemail: 61-7-3875-5154Fax: 61-7-3875-5111Email: [email protected]
Paper for the Second Inequality and Pro-poor Growth Spring Conference on the theme of ‘HowImportant is Horizontal Inequality’? ,World Bank, Washington D.C: June 9-10, 2003
1 The research for this paper was primarily undertaken when the author was attached to the UnitedNations Support Facility (UNSFIR, a policy analytical unit of UNDP), Jakarta, Indonesia as well as theJakarta office of the ILO, between 1999 and 2000. The results of this work have been partially reportedin the 2001 Indonesian National Human Development Report. Some follow-up work was done in June2002, when the author spent a part of his sabbatical leave from Griffith University with UNSFIR. Thispaper also reflects work done on behalf of the Jakarta office of the ILO in November, 2002. It wasundertaken as part of an assessment of the interim ‘Poverty Reduction Strategy Paper’ of theIndonesian government. The author owes intellectual debts to Dr Satish Mishra, Chief Economist ofUNSFIR and colleagues at the Jakarta office of the ILO. Acknowledgements for providing invaluablesupport in the form of statistical analyses are due to Zulfan Tajoeddin and Puguh Irawan, both ofwhom are at UNSFIR. Irawan is currently on leave from the Indonesian Central Bureau of Statistics orBPS (to cite the widely used acronym). Of course, the standard disclaimer applies. Any errors andomissions are the author’s sole responsibility.

2
Bhinneka tunggal ika…The Indonesian national motto of ‘unity indiversity’
1. Introduction
Spatial disparities in pre-crisis Indonesia prevailed at moderate levels despite
significant differences in the regional distribution of natural endowments and
industrial activities and despite a highly centralised and autocratic form of governance
that characterised the New Order regime under Suharto.2 Furthermore, such an
outcome occurred in a context of rapid growth and sustained reductions in income
poverty – although there was a sharp, but transient, reversal in the progress against
poverty in the aftermath of the 1997 financial crisis.3 When, after reigning for three
decades, Suharto abruptly fell from power in 1998 in the wake of the 1997 crisis,
Indonesian policy-makers understandably overlooked the notable aspects of a
discredited regime and sought a clean break from the past.4 The transitional
government of Habibie that succeeded Suharto decided in 1999 to disperse many
significant functions of government across more than 30 provinces and over 400
districts and municipalities that range across the archipelago. The newly elected
democratic governments of Wahid and Megawati that followed Habibie ensured that
the move to a decentralised Indonesia would be maintained.5 They were largely
driven by the need to maintain the cohesion of the Indonesian unitary state and
2 The evidence is briefly reviewed in section 2 of this paper.3 Booth (2000) offers a comprehensive assessment of growth, poverty and inequality in Indonesiaduring the Suharto period. The evidence on inequality for the 1970s is contentious and is re-examinedby Asra (1989). Note that most of the analyses of poverty and inequality on Indonesian use expendituredata, but there are some notable examples of studies (e.g. Asra, 2000, Cameron, 2000) that also useincome data. Extensive analysis of the impact of the 1997 financial crisis on poverty can be found inDhanani and Islam (2002). The most recent poverty estimates are available in Alatas and Pradhan(2002), while the official figures can be found in BAPPENAS (2002). The government claims thatincome poverty (as measured by the head count ratio) fell from a peak of 24.2 per cent in 1998 to 17.6per cent in 2002 (BAPPENAS, table 1.1: 6). Official statistics suggest that poverty in 2002 isapparently still significantly above the level that prevailed in 1996 (11.3 per cent). Unfortunately, BPSmade some changes to the way the poverty line is calculated between the pre- and post-crisis period.This complicates reliable comparisons.4 Baker et al (1999:1) describe the sudden political transition in Indonesia in mid-1998 as follows. ‘Theresignation of President (Suharto) in May 1998 due to a grave economic crisis and mounting politicalprotests led to a sudden transfer of leadership to Dr B.J. Habibie, (Suharto’s) Vice-President. Thisleadership change was more significant and has involved more uncertainty for Indonesia than would bethe case in most countries because it is only the second such transition in Indonesia’s fifty years oftransition’. See Elson (2001) for a fascinating biographical account of Suharto that is set in the broaderhistorical, political and social context of modern Indonesia.5 A succinct overview of the Indonesian decentralisation agenda is offered in section 3 of this paper.

3
considered decentralisation as a fundamental vehicle for dealing with emerging and
latent regional, communal and ethnic grievances.
Despite initial misgivings that the Indonesian decentralisation agenda was overly
ambitious and was being undertaken in haste, the process thus far seems to have
proceeded without too much disruption to either service delivery or macroeconomic
stability.6 Yet, some fundamental issues remain unresolved. What if a decentralised
and democratic era ends up intensifying spatial disparities as a preliminary assessment
has suggested?7 Can regional tensions really be maintained in an era of moderate
growth and austere fiscal circumstances that seem to characterise Indonesia after the
1997 financial crisis?8 Recent developments have not been particularly promising.
The peace process in Aceh, one of Indonesia’s most troubled and restive provinces
threatening to secede from the rest of the country, seems to be on the brink of
collapse. Discontent continues to simmer in other parts of the country.9 Some analysts
suggest a surge in communal and ethnic violence in post-Suharto Indonesia across a
swathe of districts and cities.10
The core question of preserving Indonesia’s unity while respecting and nourishing its
diversity and its quest for democratic consolidation still needs to be resolved. One
possibility is to craft the notion of a ‘social accord’ that is consistent with the spirit of
a diverse and democratic Indonesia. Such an accord would treat all the citizens of this
vast archipelago as having the right to nationally mandated ‘human development’
standards irrespective of their regional location. Thus, such an accord would be a
unifying force while recognising that different regions and spatial entities have
different capacities, endowments and development aspirations. The proposed accord
could become a convenient vehicle for aligning the much-noted Millennium
6 See section 3 of this paper.7 Suyarho (2002). See section 3 of this paper.8 The Central Bureau of Statistics or Badan Pusat Statistik (BPS, 2003) reports that growth in 2002 was3.7 per cent. In 2001, growth was 3.2 per cent (BPS, Press Releases, available at www.bps.go.id.) It isalso available at the website of the Asia Recovery Information Centre (www.aric.adb.org). In its draftbudget of 2003 released in mid-August, 2002, the Indonesian government signalled its intention totarget a budget deficit of 1.3 per cent of GDP for 2003, with the aim of balancing the budget by 2004.See Jakarta Post, August 19, 2002. This is a continuation of an effort by the Indonesian government toreign in the explosion in public debt induced by the 1997 financial crisis. In a report released in 2000,the World Bank urged the government to aim for primary surplus (equal to two per cent of GDP) for afew years. See World Bank (2000).9 The Weekend Australian, May10-11, 2003 (Sian Powell, ‘Bloody Paradise’).10 The evidence is discussed more fully in section 2 of this paper.

4
Development Goals (MDGs) that the international community has embraced since
2000 as part of a renewed commitment to global poverty reduction with the policy
objective of responding to spatial disparities within nation states.11 These are the
themes that are explored in this paper.
The paper is structured as follows. Section 2 briefly revisits the evidence on regional
disparities by focusing on trends in the 1990s. The assessment upholds the
conventional wisdom that spatial inequality was moderate in the Suharto era,
particularly when seen from the perspective of social indicators. It relates the
evidence to a policy regime in which a centralised authority sought to protect the
interests of the poorer regions, albeit in a paternalistic and authoritarian manner. At
the same time, the Suharto era left behind some painful legacies. A political strategy
of coercion, compulsion and co-option managed to contain regional, communal and
ethnic conflicts, but did not really resolve them. It is against such a troubling context
that section 3 offers a succinct account of recent decentralisation efforts. While the
worst fears of the critics of this transition to a new form of governance have not
materialised, the initial experience with this experiment suggests the need to enunciate
a strategic vision for Indonesia that forges closer links between poverty reduction that
has now become a core global and national agenda and the issue of spatial inequality.
This sets the context for section 4 where the notion of a social accord is expounded
and linked to the implementation of the MDGs that could deepen the sense of
nationhood in Indonesia while respecting and nourishing its diversity and nascent
democracy.
2. Spatial inequality in Indonesia: past achievements and painful legacies
Comparative evidence indicates that regional disparities in Indonesia have not become
particularly adverse over time, unlike some countries in East Asia, such as China and
Thailand.12 Econometric analyses suggest a process of ‘convergence’ at the provincial
11 The MDGs were embraced at an UN summit in September 2000 and followed up in March 2002. Forfurther discussion, see section 4 of this paper.12 See Hill (2002, 1997). There is a good deal of literature on spatial inequality in Indonesia. Apioneering example is Esmara (1975). Islam and Khan (1986) explore spatial patterns of bothinequality and poverty using unpublished data from the 1976 National Socio-Economic Survey(SUSENAS). A 1996 World Bank study offers an in-depth analysis of the regional dimensions ofIndonesian growth (World Bank, 1996). A comprehensive survey is offered in Cameron (2002) as part

5
level for the mid-1970s, 1980s and early 1990s, that is, poorer regions growing at a
faster rate than richer provinces and thus creating the prospect of a ‘catch-up’.
Admittedly, such studies have also shown that the process of convergence is relatively
sluggish and, if historical growth trends can be maintained, it would take as long as 40
years to halve income gaps between provinces.13
It appears that the degree of convergence using consumption/expenditure data is
stronger than the pattern revealed by income data. A simple regression, using
province-level data, relating growth in per capita real consumption (GPCRC) in 1990-
1996 to the initial level of per capita real consumption (PCRC90) reveals a
statistically significant degree of convergence. Thus:
GPCRC = 15.11 - .026PCR90* (* t-ratio significant at 1 per cent level; adjusted R-square is 0.96).14
The above result is corroborated by additional evidence. If one uses a well-known
measure of spatial disparities, namely, the (Williamsonian) coefficient of variation,15
and applies it to inter-provincial differences in per capita real consumption over 1990
and 1996, then it seems to decline from 0.055 to 0.019.
There has also been a good deal of analysis of trends in province-level inequality for
the 1990s. Figure 2.1 and Figure 2.2 present evidence based on the familiar technique
of inequality decomposition to distinguish ‘inter-regional’ from ‘intra-regional’
inequality by drawing on Indonesian province-level data on expenditure distribution
across households (measured on a per capita basis).16 Several features are noteworthy.
First, the proportion of total inequality that can be attributed to gaps in living
standards between provinces (as measured by average expenditure) is relatively
modest, ranging from 13.5 to 21.0 per cent. Furthermore, while inter-provincial
of an overview of the literature on income inequality and poverty in Indonesia. Balisacan et al (2002) isone of the few studies that utilises district-level data to explore the determinants of regional variationsin poverty in Indonesia.13 Garcia and Soelistianingsih (1998). See also Nazara (1999).14 I am grateful to Zulfan Tajoeddin for assisting me with this regression analysis.15 See Williamson (1965) for a discussion of this measure.16 The decomposable inequality measure that is reported here is the L-index. The measure is derived inShorrocks (1980). It has a minimum value of zero and is unbounded above. Total inequality in thismeasure can be seen as the sum of the population -weighted average of within-group and between-group inequality.

6
inequality rose between 1990 and 1996,17 this was compensated by a slight decline
between 1996 and 1999.18 Hence, there does not seem to be much evidence of a
persistent increase in inter-regional disparities. Second, even during a phase of
growing inter-provincial inequality (1990-1996), intra-provincial inequality fell,
yielding a net outcome in which total inequality was roughly stable between 1990 and
1996.19
Figure 2.1: L-index of per capita household expenditure, between and within-province, Indonesia, 1990-99
0.03 0.036 0.045 0.04
0.193 0.203
0.1710.15
0.2230.239
0.2160.19
0
0.05
0.1
0.15
0.2
0.25
0.3
1990 1993 1996 1999
Year
Val
ue
of
L-i
nd
ex
Betw een
Within
Total
Sources and notes: Derived from BPS/BAPPENAS/UNDP (2001: 37)
17 Note that this appears to contradict the previously reported pattern of convergence using per capitaconsumption expenditure. One plausible reason for this discrepancy could be the use of different datasources. The convergence estimates rely on national accounts data, while the inequality decompositionexercise relies on survey data (SUSENAS or National Socio-Economic Surveys).18 Skoufias and Suryahadi (2000) also draw attention to the decline in inter-regional inequality over thisperiod and suggest that it reflects the regionally concentrated nature of the 1997 crisis in which Java-centric urban areas were particularly badly affected.19 Akita and Lukman (1995, 1999) and Akita and Alisjahbana (2001) extensively analyse spatialdisparities in Indonesia using decomposition methodology based on province-level data primarilycovering the 1990s.

7
Figure 2.2: %contribution of between and within-group inequality to totalinequality, L-index, Indonesia, 1990-99
13.46 15.0820.89 21
86.54 84.9279.11 79
0
10
20
30
40
50
60
70
80
90
100
1990 1993 1996 1999
Year
%
Betw een
Within
Sources and notes: Derived from BPS/BAPPENAS/UNDP (2001: 37)
Some studies have claimed that much of the disparities across districts in Indonesia
can be attributed to the regionally concentrated nature of natural endowments and
industrialisation. If one adjusts for these facts by excluding oil and gas production
from estimates of per capita regional GDP, and if one discounts 13 so-called ‘enclave’
districts with the highest per capita GDP, then spatial inequality (as measured, for
example, by the Gini coefficient in 1998) declines sharply, by as much as 50 per
cent.20
Both income and non-income dimensions of spatial inequality in Indonesia are
illustrated in Figure 2.3 (derived from table A1 in appendix). The evidence uses the
(Williamsonian) coefficient variation (cv) to measure disparities in Indonesia across
its various districts in terms of a range of social/human development indicators as
well as per capita real expenditure and per capita real GDP for the 1990s (1990 and
1996).21 As can be seen, disparities in terms of a broad class of human development
indicators – as well as differences in per capita real consumption across provinces -
are significantly lower than what can be inferred from differences in per capita real
regional GDP. For example, the cv of the UNDP’s Human Poverty Index (a weighted
sum of basic social indicators pertaining to literacy, health and safe drinking water) at
the province-level is only 0.146 for 1990 vis-à-vis .649 for per capita real regional
20 Tajoeddin et al (2001).21 Williamson (1965).

8
GDP (see table A1 in appendix). Furthermore, while spatial disparities went up mildly
between 1990 and 1996 in terms of per capita GDP, they fell in the case of some
human development indicators pertaining to literacy and life expectancy, although
they rose in the case of others (such as the indicator pertaining to child
undernutrition).22 Given that literacy and life expectancy play a major role in the
construction of the UNDP’s Human Development Index (HDI), it is not surprising
that the cv with respect to the HDI at the provincial level fell discernibly between
1990 and 1996.
Fig 2.3 Income vs non-income dimensions of spatial disparities inIndonesia, an illustration
0
0.1
0.2
0.3
0.4
0.5
0.6
0.7
GRPGDPPRC
LEB
PNES40
UNU5IM
R
PWASW
PWAHS
LIT
ILLI
TM
YSHDI
HPI
Indicators
Val
ue
of
cv
Value cv 1990
Value cv 1995/1996
Sources and notes: Special tabulations, UNSFIR-UNDP database, Jakarta.
GRPGDP = gross regional per capita GDP
PRC= per capita real consumption
LEB= life expectancy at birth
PNES40= people not expected to survive to age 40
UNU5= undernourished children under 5
IMR = infant mortality rate
PWASW= people without access to safe water
PWASH=people without access to health services
Lit= literacy
ILLIT= illiteracy
22 Sadaah et al (1999) find that a number of provinces did not share in the overall progress in childhealth during the 1990s.

9
MYS= mean years of schooling
HDI= Human development index
HPI= human poverty index
------------------------------------------------------------------
In sum, the evidence on spatial disparities in Indonesia needs to take account of
several factors. First, the degree of convergence in provincial growth rates for the
1990s appears to be stronger in terms of per capita consumption than the pattern
revealed by income data. Second, inequality decomposition reveals that, in an
accounting sense, the bulk of inequality (79 per cent or more) is generated by intra-
provincial differences in income/expenditure among individuals. Furthermore, both
inter-provincial and intra-provincial disparities can move in different directions so
that the net impact on total inequality can turn out to be largely neutral. Third, the
degree of spatial inequality can be substantially overstated if one does not adjust for
the highly concentrated nature of natural resource endowments and industrial
activities in the country – the so-called ‘enclaves’. Finally, it is necessary to make a
distinction between income and non-income dimensions of spatial inequality. The
latter are significantly lower than the former and, in some cases, have declined in the
1990s even as disparities in per capita GDP across provinces rose.
There is a professional consensus in the literature that the reasonably good record on
spatial disparities in Indonesia, particularly in terms of its non-income dimensions,
should be linked to a policy regime during the long reign of President Suharto that
sought to enhance the living standards of the poorer provinces, especially those
located in the Outer Islands, through a centralised system of inter-regional income
transfers. Centre-fiscal flows were apparently mildly equalising.23 The formula used
for fiscal allocation favoured less populous provinces in Eastern Indonesia, but they
also happened to be among the poorest provinces. The central government acted as an
important vehicle for spreading the windfall gains from the oil price boom and the
inflow of foreign aid to the various regions of Indonesia. Central transfers for health,
education and infrastructure have significantly improved economic and social
indicators across the regional communities of pre-crisis Indonesia. 24
23 See, for example, Azis (1990), Ravallion (1988) and Akita and Szeto (1998).24 Duflo (2001) analyses the impact of the enormous expansion of educational opportunities inIndonesia and concludes that, for every primary school constructed per 1000 children, mean years ofeducation increased from 0.12 to 0.19 years and translated into wage increases ranging between 1.5 to2.7 per cent.

10
Such achievements of the Suharto era have, however, been tarnished by rather
troublesome legacies that democratic governments in post-crisis Indonesia have to
deal with. The centralised and authoritarian framework aimed towards ameliorating
spatial disparities failed to provide sufficient incentives for resource mobilisation at
the local level. It bred fiscal dependency among the weaker regions on the centre.
There were always risks of restraints on domestic trade as local governments sought
to implement a plethora of local levies to generate additional funding resources.
Central government programmes also failed to respond to local preferences and
conditions and have stifled local entrepreneurship and initiatives.
Perhaps the one of the most serious allegation that one can make against the Suharto
regime is that a political strategy of coercion, compulsion and co-option managed to
contain regional, communal and ethnic grievances and tensions without really
resolving them. As Suharto fell from power in 1998 rather abruptly, the rapidity of
this transformation made it difficult for subsequent governments in a much more open
and democratic era to deal effectively with the issue of regional, communal and ethnic
grievances that have always been part of the political landscape of a rather populous
and diverse archipelagic nation. Resource-rich provinces felt that they were being
prevented from enjoying the fruits of their bountiful natural resources by a remote,
authoritarian and corrupt regime.25 Accompanying this sense of grievance were
complex layers of ethnic and communal affiliations that inevitably undergirded local
and regional identities.
There appears to have been a surge in ‘social violence’ in the post-Suharto era.26
Some stylised facts are worth noting at this juncture.27 Thus, in 1997 – just prior to the
25 Seven of the so-called ‘enclave’ or conspicuously high-income districts are located in four of theresource-rich provinces of Aceh, Riau, East Kalimantan and Papua. They also happen to have ratherordinary human development indicators relative to the national norm. This is verified by Tajoeddin etal (2001) who find a weak correlation between natural resource endowments and human developmentindicators.26 Tajoeddin (2002:21) defines ‘social violence’ as ‘…acts, such as destructions, killings, lootings,burning, clashes…etc made by a group of people at a certain place and time’.27 The evidence, culled from Tajoeddin (2002: 27-32), needs to be treated with care. It relies heavily onmedia sources (most notably Antara and Kompas). There is probably an‘upward bias’ in trendsreported for the post-crisis period, given the much greater freedom of press, and much greater freedomof reporting on violent incidents entailing mass participation, vis-à-vis the Suharto era. It is ratherdifficult to estimate how significant this upward bias is. Despite these qualifications, the evidence

11
demise of the Suharto regime - there were 15 reported incidents of social violence
entailing 131 deaths. By 1999, these incidents jumped to 300 entailing 1,813 deaths.
The situation has eased to some extent by 2001 (233 reported incidents and 1065
deaths), but this is far higher than the Suharto period. When one takes account of the
total number of violent incidents entailing groups of people between 1990 and 2001,
approximately 50 per cent of such incidents can be classified as separatist violence
and about 40 per cent as communal violence. The most conflict-ridden areas happen
to be located in just three provinces – Maluku, Aceh and Central Kalimantan. In two
of these cases (Maluku, Central Kalimantan), the violence is primarily of a communal
nature, while in one of them (Aceh), it is a relatively clear-cut case of separatist
conflict. Apart from causing death and destruction, the increased incidence of social
violence in Indonesia has spawned a large number of ‘internally displaced persons’.
In 2001, for example, there were more than a million internally displaced persons
spread across 21 provinces, largely victims of highly location-specific social
violence.28
3. Decentralisation and disparities: is post-crisis Indonesia on the right
track?29
As Indonesia navigates its future in a more open and democratic era, it is assailed by
concerns about its territorial integrity and its sense of nationhood. Will it survive as a
unitary state? While the heavy hand of the central government in the past contained
spatial disparities and regional tensions in a context of rapid growth and bountiful
fiscal resources, how does one balance the interests between the regions and the
centre as well as between poor and rich regions under circumstances of a weakened
central government, moderate growth and sharply constrained fiscal capacities? The
Indonesian government in the post-crisis has attempted to deal with these issues by
proposing and implementing a radical program of decentralisation that consciously
reported here is quite innovative and not widely available elsewhere. One should also note that theliterature on social violence and its regional characteristics within nation-states has benefited from thepioneering work of Varshney (2001) on India. See also his reflections on Indonesia (Varshney, 2002).
28 These figures were kindly supplied to the author by Puguh Irawan currently on leave from BPS.29 This section draws on Stalker (2003: 8-11). There is also a rich literature on the Indonesiandecentralisation experience in the pre-crisis period. Some notable contributions are Ranis and Stewart(1994), Shah and Qureshi (1994) and Smoke and Lewis (1996).

12
sought to transfer authority and resources to the districts within provinces rather than
to provinces per se. The unwritten agenda was that the administratively much smaller
districts lacked the political clout and allegiance to regional identity that could enable
them to mutate into mini-states.
The current institutional arrangements that govern centre-region relations –
implemented since 2001 – bear the imprint of a legislative framework that was
enunciated in mid-1999 under the transitional government of Habibie formed after the
fall of Suharto. One law (no.25/1999) devolved administrative authority to the
districts and cities and provided for the country’s district chiefs and mayors to be
elected by local parliaments. This effectively ended the practice of the appointment of
political leaders at the sub-national level by the central government in Jakarta.
Complementing the devolution of administrative authority is a fiscal decentralisation
law (no. 25/1999) that determines centre-region fiscal relations under the guise of an
‘Equalisation Fund’. This, in turn, has three components: (a) revenue sharing, (b)
block grants and (c) special purpose grants. The revenue-sharing component of the
Equalisation Fund is clearly intended to act as a means of pacifying the discontents of
the resource-rich and better-endowed parts of the country, given that it is designed to
‘reimburse’ the producing regions a portion of the revenues generated from their
terrain. The block grants, which is a combination of a fixed and a variable component
(the latter reflecting such region-specific attributes as poverty rates, population, land
size etc), are designed to allocate a certain quantum (25 per cent) of domestic
revenues collected by the central government mainly to the districts in order to enable
them to provide basic services, such as health and education, that were previously the
responsibility of the centre. Finally, special grants are designed to look after the
interests of particular regions with special characteristics (such as regions with below
average fiscal capacity and regions hosting activities deemed to be of national
significance) that cannot be covered under the rubric of the block grants.
When the decentralisation agenda was first announced in mid-1999 with an
implementation target of 2001, concerns were expressed that it could be chaotic and

13
counterproductive without appropriate modifications.30 Commentators felt that by
circumventing provinces, the 1999 legislative framework would simply create a large
number of compliant districts that would create a facade of decentralisation without
genuine devolution of authority. Others argued that the rapid implementation date
would lead to major disruptions in the delivery of public services, while the scale of
fiscal flows that would be required between the centre and regions could threaten
macroeconomic stability. Yet others noted that the Equalisation Fund would
paradoxically widen spatial disparities because of their bias in favour of well-
endowed parts of the country. Fortunately, so far at least, some of the worst-case
scenarios do not seem to have materialised. There has been a steady increase in
budgetary resources devoted to regional expenditure between 2000 and 2002 without
leading to major fiscal strains. The transfer of more than a million government
employees and many thousands of public facilities from central to local levels has
occurred without significant disruption to the delivery of public services. Opinion
polls – for what they are worth – do not indicate a greater degree of dissatisfaction
with the quality of public services, while some assessments indicate a greater degree
of civic activism and public participation in local governance.
Despite a promising beginning that largely reflects pragmatic adjustments by
government to immediate problems of transition,31 the Indonesian decentralisation
agenda needs to meet a number of current and evolving challenges. The fiscal
dependency of the many of the regions on the centre will probably remain as acute as
ever. The proliferation of local levies suggests that the risk of significant restraints on
domestic trade remains unresolved.32 The threat of local governments being
‘captured’ by local elites cannot be discounted, if international experience with
30 For a critical assessment of the decentralisation framework as it was originally conceived see, forexample, Ahmed et al (1999), Bahl et al (2001) and Islam (1999a). Hill (2002: 26-27) argues that thediscontinuity in decentralisation experience between the pre- and post-Suharto era is unfortunate. Hemaintains that ‘(i)n the last decade of the (Suharto) era, there was actually more fiscal decentralisationthan is widely recognised’ and proceeds to observe that ‘(h)istorians will no doubt lament the fact thatthe quiet and gradual reforms which had got underway in the last decade of the (Suharto) era hadprogressed further…there may not have been the same pressure for sudden, radical reforms’.31 For example, the central government paid the wages of government employees for seven monthseven though they were transferred to local governments in cases where the latter were unable to meetsuch financial obligations. The central government also ensured that the fiscal position of localgovernments were protected to the point where they got as much as the pre-decentralisation budgetaryallocations.32 Restraints to domestic trade are examined in Ray and Goodpaster (2001).
14
decentralisation is any guide.33 The current government – as well as future
governments – have to resolve ideological differences among key stakeholders
pertaining to the evolution of Indonesia in the post-crisis era. Should the political and
administrative focus remain on districts – as is currently the case – or should it
eventually treat provinces as key entities in a much more federalist structure that
would in turn fundamentally mould the unitary nature of the Indonesian state?34
It is by no means clear that the core issue of spatial disparities – and associated
problems of regional, communal and ethnic tensions – have been satisfactorily tackled
under the current decentralisation framework. The latter seems to be caught in a
delicate balancing act between preserving the status quo and rewarding the better-
endowed parts of the country. Despite attempts to pacify the discontent of resource-
rich provinces through the Equalisation Fund, the experience of Aceh reveals that it
may be well be a case of ‘too little, too late’. 35 At the same time, the initial concerns
that the restructured centre-region fiscal flows may not adequately protect the
interests of the poorer parts of the country have not turned out to be a false alarm. A
preliminary assessment reveals that the Equalisation Fund as it has so far operated
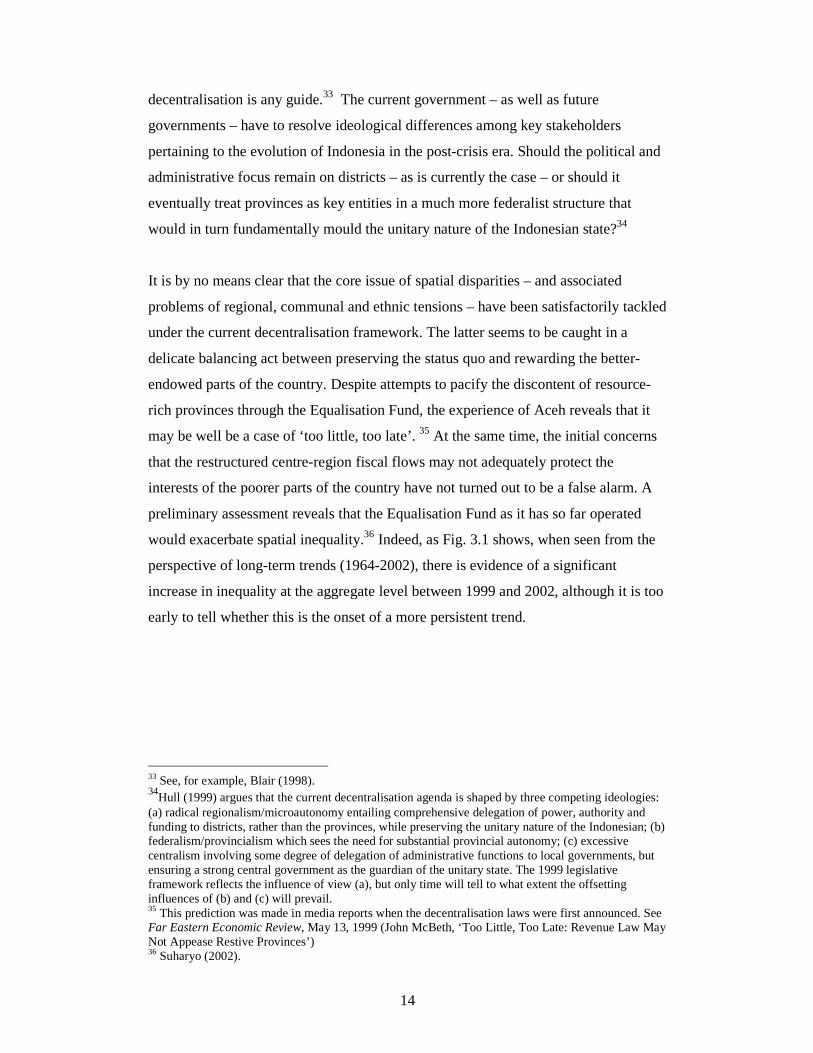
would exacerbate spatial inequality.36 Indeed, as Fig. 3.1 shows, when seen from the
perspective of long-term trends (1964-2002), there is evidence of a significant
increase in inequality at the aggregate level between 1999 and 2002, although it is too
early to tell whether this is the onset of a more persistent trend.
33 See, for example, Blair (1998).34
Hull (1999) argues that the current decentralisation agenda is shaped by three competing ideologies:(a) radical regionalism/microautonomy entailing comprehensive delegation of power, authority andfunding to districts, rather than the provinces, while preserving the unitary nature of the Indonesian; (b)federalism/provincialism which sees the need for substantial provincial autonomy; (c) excessivecentralism involving some degree of delegation of administrative functions to local governments, butensuring a strong central government as the guardian of the unitary state. The 1999 legislativeframework reflects the influence of view (a), but only time will tell to what extent the offsettinginfluences of (b) and (c) will prevail.35 This prediction was made in media reports when the decentralisation laws were first announced. SeeFar Eastern Economic Review, May 13, 1999 (John McBeth, ‘Too Little, Too Late: Revenue Law MayNot Appease Restive Provinces’)36 Suharyo (2002).

15
Figure 3.1. Inequality indices for household expenditure, 1964-2002
0.0
0.1
0.2
0.3
0.4
64-65
1976 1981 1987 1993 1998 2002
Val
ueof
Gin
ior
L-In
dex
Gini coefficient
L-index
Sources and notes: BPS, special tabulations as reported in Stalker (20034:6).
One has to recognise that decentralisation, as some observers have aptly noted, should
not be characterised as a ‘plague or a panacea’.37 This eclectic conclusion is upheld
by international evidence that shows that the impact of decentralisation on poverty
and equity is rather mixed.38 Decentralisation cannot, on its own, compensate for the
fundamental problem of slow growth that continues to characterise the post-crisis
Indonesian economy. Aggregate growth depends largely on the overall policy and
institutional environment of which decentralisation is one element and may not even
be the most important one. In recent years, growth has been below 4 per cent vis-à-vis
the 7 per cent average growth rate experienced during the Suharto era.39 While it is by
no means necessary to replicate the high growth of the past, the current sluggish
growth rate is below the threshold required to absorb new entrants to the labour force
and well below the long-run growth potential of the Indonesian economy.40 As is well
known, growth matters critically for poverty reduction. Recent estimates based on
37 Bird and Villancourt (1998:1).38 See, for example, Crooke and Sverrisson (1999) and Manor (1999). See also Azfar (1999) and thewarning by Prud’home (1995) of ‘the dangers of decentralisation’.39 Recent growth estimates up to 2002 are available at BPS (www.bps.go.id).40 An ILO study concludes that growth would need to be at least 5 per cent to maintain ‘flowequilibrium’ in the labour market (see ILO, 1999). The long-run growth potential is estimated to be 5.9per cent (UNSFIR, 2002). In a study of the Indonesian economy that was published more than twentyyears ago, Booth and McCawley (1981: 321) noted that: ‘(it) is difficult to envisage a viabledevelopment strategy for Indonesia that does not at least involve an annual per capita growth of incomeof between 4 and 6 per cent’.

16
district-level data suggest that, for a given distribution of income, every one 1 per cent
increase in growth leads to a fall in (income) poverty incidence by as much as 0.8 per
cent.41
Given these concerns, where does one proceed from here? It seems that the issue of
dealing with spatial disparities in a decentralised Indonesia has to be approached in a
much broader context. In particular, it is necessary to link the issue of decentralisation
and spatial inequality to the renewed commitment to poverty reduction that is
increasingly evident at both the global and national level. It is possible to bring about
such a linkage by enunciating a ‘social accord’ for Indonesia – as the subsequent
section of this paper argues.
4. A social accord for Indonesia: using the MDGs to align the goal of
alleviating spatial disparities with national poverty alleviation42
As is well known, the international donor community has embraced the MDGs
because it offers a unifying vision for development cooperation. The Bretton Woods
Institutions are playing a leading role in propagating ‘poverty reduction strategy
papers’ (PRSP) within which the MDGs are likely to play an important role in setting
key policy goals and targets.43 Indonesia has formally subscribed to these
developments by releasing its version of the PRSP.44
The MDGs emphasise key development goals and targets that the international
community should strive to achieve by 2015 (using 1990 as the base year).45 The key
goals that are pertinent to poverty reduction entail declarations on the eradication of
41 Balisacan et al (2002: 8). The assumption of a given distribution of income is critical in suchestimates. Rising inequality can more than offset a rising growth rate in reducing poverty.42 The basic conceptual framework is laid out in Islam (1999b). It is revisited inBPS/BAPPENAS/UNDP (2001) – or the Indonesian National Human Development Report – as well asIslam (2002) and Stalker (2003).43 The Bretton Woods institutions have aligned their lending programme with this new approach. TheIMF has launched its Poverty Reduction Growth Facility (PRGF) that supersedes the EnhancedStructural Adjustment Facility (ESF). In the case of the World Bank, all its activities in low incomecountries is expected to be based on the PRSP which in turn builds on its Comprehensive DevelopmentFramework (CDF). A critique of the PRSP-driven approach is offered in Easterly (2002). Preliminaryassessments of the ‘first generation’ PRSPs in developing countries is offered by Ames et al (2002).The evidence on their impact on country performance is quite mixed.44 See, for example, BAPPENAS (2002).45 An influential publication by the OECD (OECD, 1996) was the precursor to the MDGs.
17
extreme poverty and hunger, elimination of gender discrimination in basic education,
improvements in child and maternal health, dealing with HIVAIDS/malaria and other
infectious diseases as well as ensuring environmental sustainability. Indonesia, in
common with more than 180 countries, has endorsed these goals and targets. A more
detailed list of goals, targets and indicators are offered in an appendix to this paper
(table A2).
An encouraging fact is that, despite the setback of the 1997 financial crisis, Indonesia
appears to be on track to attain the core MDGs by 2015. This presupposes a growth
rate of around 6 per cent and the assumption that past trends in poverty reduction both
along income and non-income dimensions will be maintained.46 However, attainments
at the national level can be deceptive, particularly in such a large and diverse country
as Indonesia. An important message of the 2001 National Human Development
Report is that monitoring goals and targets with respect to poverty reduction at the
national level cannot be isolated from the issue of spatial disparities The point is that
some provinces will not be able to achieve the MDGs (or similar targets) by 2015.
Table 4.1 sets the scene for a discussion of the implications that follow from the quest
to creatively adapt the MDGs to reflect the regional diversity of Indonesia. It is clear
that, if one concentrates on the national level, it is possible to make the optimistic
inference that, with the exception of universal access to safe water and net enrolment
in primary education, Indonesia will attain the 2015 targets. Yet, a number of
provinces (ranging from 2 to 21) will not attain the targets.47 On average, about 32 per
cent of the provinces are lagging behind – sometimes by very wide margins – in terms
of at least one of the 2015 targets. To complicate matters even more, neither the
number, nor the type, of provinces are identical in terms of their failure to attain the
2015 targets, given that provinces vary in terms of their past performance with respect
46 A required growth rate of 6 per cent to reduce poverty is noted in GOB/ADB (2001).47 This example is similar in spirit to the global comparison of ‘leaders’ and ‘laggards’ in terms ofattaining the MDGs by 2015 offered in UNDP (2002: 24-25). For example, in case of halving extremepoverty and hunger, 57 developing countries representing 49 per cent of the world’s population, are ontrack in terms of reaching the goal. 24 countries representing 24 per cent of the world’s population arefar behind. Nothing can be said about 68 countries accounting for 8 per cent of the world’s populationbecause of lack of data. In the case of some of the MDGs, the scenarios are more depressing. Forexample, in the case of reducing infant mortality (by two-thirds), 66 countries amounting to 57 per centof the world’s population are lagging behind, often by wide margins.

18
to reductions in both income and non-income dimensions of poverty. This highlights
the complex and diverse nature of deprivation at the regional level in Indonesia.
Table 4.1: The regions of Indonesia and the 2015 targets (using either 1990 or 1993 as base)
50%
reduction
in income
poverty
100%
prim net
enrolment
by 2015
100%
adult
literacy
rate
No
gender
disparities
in
primary
and
secondary
edn
By 2015
2/3
reduction
in infant
mortality
by 2015
4/5
reduction
in
maternal
mortality
by 2015
Universal
access to
safe
drinking
water
By 2015
Universal
access to
shelter of
minimum
quality
(housing
without
dirt floor)
By 2015
Number
of
provinces
(out of
26) that
will fail to
attain
targets by
2015
15 15 3 4 0 6 21 2
Year by
which
Indonesia
will attain
targets
2008 2023 2006 2003 2003 2011 2030 2003
Source: Derived from National Human Development Report, BPS/BAPPENAS/UNDP (2001: 49-50)
If, as argued, national attainment of the MDGs masks significant diversity at the
province-level, it is likely that the degree of this diversity will be even greater at the
district level. This is an important point given that the districts represent the locus of
the current agenda of regional decentralisation in Indonesia.
The finding that there is significant regional diversity with respect to the attainment of
the 2015 targets should inspire policy-makers into taking appropriate action. Indeed,
an important proposal of the 2001 National Human Development Report is that the
MDGs may well serve as a platform for enunciating a compact on regional

19
decentralisation – or what is being termed as a ‘social accord’ in this paper.48 This
approach reinterprets the MDGs as a ‘right to development’ initiative that national
authorities should undertake.49 In other words, the philosophical premise of
decentralisation ought to be the notion that all Indonesians, as Indonesians, are
entitled to minimum economic and social standards that are as important as core
political rights and civil liberties. One way of prescribing the minimum economic and
social standards is to relate them to the MDGs. Thus, one could articulate a strategic
vision of poverty reduction where the central government, in partnership with its
regional counterparts, reformulates the MDGs so that the attainment of the 2015
targets and goals are set at the district-level. Such a reformulation should clarify that
the MDGs are minimum standards that the regional communities of Indonesia are
entitled to, while recognising that dynamic and more entrepreneurial regions can, and
will, move ahead and above those standards.
An advantage of the approach advocated here is that it creates the real, rather than
imaginary, prospect of the reduction of spatial disparities (within a given time-frame)
vis-à-vis a national standard derived from norms endorsed by a global consensus. This
reinforces the complementarity between the amelioration of spatial disparities and
alleviation of poverty and seems to be a more appealing, and pragmatic, policy goal
relative to vague statements about reducing income gaps between rich and poor
regions. The approach advocated here – ensuring prescribed national standards in
terms of human development indicators derived from the MDGs – steers clear of
contentious notions of pitting poor against rich communities within nation-states.
The challenge for the government is to take the necessary steps to translate the
proposed strategic vision on amelioration of spatial disparities and poverty reduction
to a politically and administratively feasible, as well as fiscally sustainable, set of
policies and programmes. In an authoritarian system of the past, a ‘command-and-
control’ approach to the implementation of the MDGs would have been the preferred
method. In a nascent democracy a more creative, and more challenging, approach is
required. This pertains to the role that the central government, in partnership with
48 The National Human Development Report did not specifically mention the MDGs as the draft of thereport was finalised prior to the promulgation of the MDGs. Nevertheless, the spirit and intent wasclosely aligned with the MDGs, given the emphasis of the report on universal access to basic services.49 Stalker and Mishra (2003) forcefully argue for the ‘right to development’ in the case of Indonesia.

20
their regional counterparts, can play in inculcating a shared vision on national poverty
reduction and mitigation of spatial inequality where the proposed accord becomes the
key driver. The articulation of the shared vision should be mediated through a series
of public deliberations and consultations that are democratic in spirit and substance
and in turn reinforce democratic norms and values.
While the process of public deliberations and consultations in a democracy are crucial
in building broad-based support, such support can easily dwindle if some pertinent
issues are not resolved. Is the accord compatible with existing and emerging
institutional arrangements, with the capacity to translate it into concrete programmes
by an agreed time-frame (such as 2015 as proposed in the MDGs)? Does a credible
poverty monitoring framework exist that can inform public debates, guide the
allocation of budgetary resources and evaluate performance with respect to goals and
targets? Are the goals and targets fiscally sustainable?
A national body – such as the recently established National Committee on Poverty
Reduction - can provide a much-needed focal point for the government in its renewed
quest to deal with the issue of both spatial inequality and poverty in post-crisis
Indonesia. The Committee could become the custodian of the proposed social accord
by coordinating the necessary analytical and technical work, building broad-based
support for a national strategy of action and by drawing on a monitoring and
evaluation framework that would inform public debates, guide the allocation of
budgetary resources and evaluate performance with respect to goals and targets.
Indeed, the Committee can take some comfort from the fact that a recent audit has
shown that it is possible to build on the existing statistical system to enable policy-
makers to monitor MDG-type goals and targets at the district level.50 Of course,
sustained investments in the national statistical system at a fairly disaggregated level
are required to ensure that a monitoring framework geared towards the MDGs remain
functional and relevant.
Whether the proposed accord is fiscally sustainable is less clear. The persistence of
sluggish growth can itself act as a brake on fiscal buoyancy because of the well-
50 Recently UNCEF, in conjunction with BPS, has undertaken a valuable data audit to assess theavailability of indicators that are aligned with the MDGs and other international development goals.

21
known evidence that budgetary revenues in developing countries are quite sensitive to
changes in the growth rate.51 Hence, the return of reasonably rapid growth in
Indonesia is important for both the fiscal health of the state and for poverty reduction.
There is also the issue of development assistance to augment domestic resources. The
global community has agreed that unless there is doubling of development assistance,
the MDGs cannot be met by 2015 for all developing countries.52 Translating this idea
to the case of Indonesia, one could ask: what additional resources – both from internal
resources and external agencies - would be required for the MDGs to be implemented
by 2015 for all the regional communities within the country, after allowing for a
reduction in the static inefficiencies that currently afflict the budgetary framework?
Are they compatible with the current task of fiscal consolidation induced by the 1997
crisis? These are key issues that would need to be resolved as part of the enunciation
and implementation of the proposed social accord for a decentralised and democratic
Indonesia.
One could argue that the proposed social accord, even if appropriately designed,
deliberated and implemented, would still be unable to respond to the separatist
tendencies that afflict contemporary Indonesia. These tendencies do not stem merely
from perceived economic discrimination by a Java-centric elite against some regions,
most notably those in the Outer Islands. The threat of separatism is rooted in complex
and historically entrenched communal and ethnic grievances.53 Despite this valid
concern, a determined effort to implement the idea that Indonesians, as Indonesians,
are entitled to uniform treatment in the form of attaining minimum human
development standards that simultaneously respect distinctive regional identities and
aspirations is worth considering. Neither the centralised approach of the past nor a
decentralisation agenda caught in a delicate balancing act between preserving the
status quo and rewarding the resource-rich regions can claim to do justice to the
Indonesian national motto of bhinneka tunggal ika or ‘unity in diversity’. The
proposed social accord could be a credible answer to the upholding of this motto.
51 Estimates based on Latin American data show that a 1 per cent decline in the growth rate can lead toa 5.8 per cent fall in fiscal revenues (Lustig, 2000).52 UNDP (2002:30). The estimates suggest that official development assistance (ODA) will have torange between US$96 billion and US$ 116 billion vis-à-vis the current total of US$ 40-56 billion.53 See, for example, Ricklefs (1981, especially chaps 18-20).

22
Appendix
Table A1 : Income vs non-income dimensions of spatial disparities
in Indonesia, an illustration (Williamsonian coefficient of variation)
Indicators 1990 1995-996
GRPGDP 0.649 0.656
PRC 0.055 0.019
LEB 0.053 0.045
PNES40 0.263 0.274
UNU5 0.122 0.139
IMR 0.251 0.266
PWASW 0.16 0.192
PWAHS 0.529 0.57
LIT 0.096 0.087
ILLIT 0.423 0.519
MYS 0.148 0.161
HDI 0.073 0.051
HPI 0.146 0.141
Sources and notes: Special tabulations, UNSFIR database, Jakarta.
PRPGDP = gross regional per capita GDP
PRC= per capita real consumption
LEB= life expectancy at birth
PNES40= people not expected to survive to age 40
UNU5= undernourished children under 5
IMR = infant mortality rate
PWASW= people without access to safe water
PWASH=people without access to health services
Lit= literacy
ILLIT= illiteracy
MYS= mean years of schooling
HDI= Human development index
HPI= human poverty index

23
Table A2 : The MDGs – goals, targets and indicators
8 Goals, 18 Targets and 48 Indicators.NB: The selection of Indicators for Goal 7 and Goal 8 is subject to further refinementSOURCE: The United Nations
Goals Targets Indicators1. Proportion of population below $1 perday
2. Poverty gap ratio (incidence x depth ofpoverty)
Target 1. Halve, between 1990 and 2015,the proportion of people whoseincome/consumption is less than onedollar a day
3. Share of poorest quintile in nationalincome
4. Prevalence of under weight children(under five years of age)
Goal 1. Eradicate extreme poverty andhunger
Target 2. Halve, between 1990 and 2015,the proportion of people who suffer fromhunger
5. Proportion of population belowminimum level of dietary energyconsumption6. Net enrolment ratio in primaryeducation
7. Proportion of pupils who enroll ingrade 5
Goal 2. Achieve universal primaryeducation
Target 3. Ensure that, by 2015, childreneverywhere , boys and girls alike, will beable to complete a full course of primaryschooling
8. Adult literacy rate (Literacy rate of 15-24 year old)
9. Ratio of girls to boys in primary,secondary and tertiary education10. Ratio of literate females to males of 15to 24 year old11. Share of women in wage employmentin the non-agricultural sector
Goal 3. Promote gender equality andempower women
Target 4. Eliminate gender disparity inprimary and secondary education,preferably by 2005, and to all levels ofeducation no later than 2015
12. Proportion of seats held by women innational parliament13. Under-five mortality rate
14. Infant mortality rate
Goal 4. Reduce child mortality Target 5. Reduce by two third, between1990 and 2015, the under-five mortalityrate
15. Proportion of 1-year-old childrenimmunized against measles16. Maternal mortality rateGoal 5. Improve maternal health Target 6. Reduce by three quarters,
between 1990 and 2015, the maternalmortality ratio
17. Proportion of births attended byskilled health personnel
18. HIV prevalence among 15 to 24 yearold pregnant women19. Contraceptive prevalence rate
Target 7. Have halted by 2015 and beginto reverse the spread of HIV/AIDS
20. Number of children orphaned byHIV/AIDS21. Prevalence and death rates associatedwith malaria22. Proportion of population in malariarisk areas using effective malariaprevention and treatment measures23. Prevalence and death rates associatedwith tuberculosis
Goal 6. Combat HIV/AIDS, malaria, andother diseases
Target 8. Have halted by 2015 and beginto reverse the incidence of malaria andother major diseases
24. Proportion of tuberculosis casesdetected and cured under directlyobserved treatment short course25. Proportion of land area covered byforest26. Land area protected to maintainbiological diversity27. GDP per unit of energy use (as proxyfor energy efficiency)
Target 9. Integrate the principles ofsustainable development into countrypolicies and programmes and reverse theloss of environmental resources
28. Carbon dioxide emissions (per capita)[Plus two figures of global atmosphericpollution: ozone depletion and theaccumulation of global warming gases]
Goal 7. Ensure environmentalsustainability
Target 10. Halve by 2015 the proportionof people without sustainable access tosafe drinking water
29. Proportion of population withsustainable access to an improved watersource

24
30.Proportion of people with access toimproved sanitation
Target 11. By 2020 to have achieved asignificant improvement in the lives of atleast 100 million slum dwellers
31. Proportion of people with access tosecure tenure [Urban/rural desegregationof several of the above indicators may berelevant for monitoring improvement inthe lives of slum dwellers]
Target 12. Develop further an open, rule-based, predictable, non-discriminatorytrading and financial system. Includes acommitment to good governance,development, and poverty reduction –both nationally and internationally
Target 13. Address the special needs ofthe least developed countries. Includes:tariff and quota free access for leastdeveloped countries’ export; enhancedprogramme of debt relief for HIPCs andcancellation of official bilateral debt; andmore generous ODA for countriescommitted to poverty reduction
Target 14. Address the special needs oflandlocked countries and small islanddeveloping States (through theProgramme of Action for the SustainableDevelopment of Small Island DevelopingStates and the outcome of the twenty-second special session of the generalAssembly)
Target 15. Deal comprehensively with thedebt problems of developing countriesthrough national and internationalmeasures in order t make debt sustainablein the long term
[Some the indicators listed below will bemonitored separately for the leastdeveloped countries (LDCs_, Africa,landlocked countries and small islanddeveloping States].Official development assistance32. Net ODA as percentage ofOECD/DAC donors’ gross nationalproduct (targets of 0.7% in total and0.15% for LDCs)33. Proportion of ODA to basic socialservices (basic education, primary healthcare, nutrition, safe water and sanitation)34. Proportion of ODA that is untied35. Proportion of ODA for environment insmall island developing States36. Proportion of ODA for transportsector in landlocked countriesMarket access37. Proportion of exports (by value andexcluding arms) admitted free of dutiesand quotas38. Average tariffs and quotas onagricultural product and textiles andclothing39. Domestic and export agriculturalsubsidies in OECD countries40. Proportion of ODA provided to helpbuild trade capacityDebt sustainability41.Proportion of official bilateral HIPCdebt cancelled42. Debt services as a percentage ofexports of goods and services43. Proportion of ODA provided as debtrelief44. Number of countries reaching HIPCdecision and completion points
Target 16. In cooperation with developingcountries, developed and implementstrategies for decent and productive workfor youth
45. Unemployment rate of 15 to 24 yearold
Target 17. In cooperation withpharmaceutical companies, provide accessto affordable essential drugs in developingcountries
46. Proportion of population with accessto affordable essential drugs on asustainable basis
Goal 8. Develop a global partnership fordevelopment
Target 18. In cooperation with the privatesector, make available the benefits of newtechnologies, especially information andcommunications
47. Telephone lines per 1000 people48. Personal computers per 1000 people[Other indicators to be decided]
Note: I am grateful to Abuzar Asra of the ADB for providing me with access to this tabulation.

25
References
Ahmad et al (1999) ‘Indonesia: decentralisation – managing the risks’, Aide Memoir for the Ministerof Finance, Government of Indonesia, Jakarta, Fiscal Affairs Department, International MonetaryFund, June
Akita, T and Alisjahbana, A.S. (2001) The economic crisis and regional inequality in Indonesia,Working Paper No.10, Graduate School of International Relations, International University of Japan
Akita, T and Lukman, R.A (1995) ‘Interregional inequality in Indonesia: a sectoral decompositionanalysis’, Bulletin of Indonesian Economic Studies, 31(2): 61-81
Akita, T and Lukman, R.A (1999) ‘Spatial patterns of expenditure inequality in Indonesia, 1987, 1990and 1993’, Bulletin of Indonesian Economic Studies, 35(2): 67-90
Akita, T and Szeto, J (1998) ‘Inpres Desa Tertinggal (IDT) program and Indonesian regionalinequality’, International Conference on Regional Development Theory and Practice’, Jakarta, October22-23
Alatas, V and Pradhan, M (2002) ‘Poverty update’, Jakarta: World Bank
Alm, J, Aten, R.H. and Bahl, R (2001) ‘Can Indonesia decentralise successfully’? Plans, problems andprospects’, Bulletin of Indonesian Economic Studies, 37(1): 83-102
Ames, B, Bhatt, G and Plant, M (2002) ‘Taking Stock of Poverty Reduction Efforts’, Finance andDevelopment, 39(2): 1-5
Asra, A (1989) ‘Inequality trends in Indonesia, 1969-1981: a re-examination, Bulletin of IndonesianEconomic Studies, 11(2): 100-9
Asra, A (2000) ‘Poverty and inequality in Indonesia: estimates, decomposition and key issues’, Journalof the Asia Pacific Economy, 5(1-2), 91-111
Azfar, O et al (1999) ‘Decentralisation, governance and public services: the impact of institutionalarrangements, a review of the literature’, September, IRIS Centre, University of Maryland
Azis, I.J (1990) ‘Inpres’ role in the reduction of interregional inequality’, Asian Economic Journal,4(2): 1-26
Baker, R.W. et al (eds) (1999) Indonesia: the challenge of change, Netherlands and Singapore: KITLVpress and Institute of Southeast Asian Studies
Balisacan, A.M, Pernia, E.M. and Asra, Abuzar (2002) ‘Revisiting growth and poverty reduction inIndonesia: what do subnational data show’? October, ERD Working Paper Series No.25, Manila:Economic and Research Department, ADB
BAPPENAS (2002) ‘Interim poverty reduction strategy’, mimeo, October, Jakarta
Bird, R.M. and Villancourt, F (eds) (1998) Fiscal decentralisation in developing countries, Cambridge:Cambridge University Press
Blair, H (1998) Spreading power to the periphery: an assessment of democratic local governance,Assessment No.21, Washington DC: USAID, Programs and Operations
Booth, A (2000) ‘Poverty and inequality in the Soeharto era: an assessment’, Bulletin of IndonesianEconomic Studies, 36(1): 73-104

26
Booth, A and McCawley, P (1981) ‘ Conclusions: looking to the future’, in Booth, A and McCawley, P(eds) The Indonesian Economy during the Soeharto era, Kuala Lumpur and Oxford: Oxford UniversityPress
BPS (2003) ‘Berita resmi statistik’, no.08/IV, February 17
BPS/BAPPENAS/UNDP (2001) Towards a new consensus: democracy and human development inIndonesia, Indonesia Human Development Report, Jakarta: BPS-Statistics Indonesia, BAPPENAS andUNDP
Cameron, L (2000) ‘Poverty and inequality in Java: examining the impact of changing age, educationaland industrial structure, Journal of Development Economics, 62(1): 149-80
Cameron, L (2002) ‘Growth with or without equity’? The distributional impact of Indonesiandevelopment’, Asian-Pacific Economic Literature, 16(2): 1-17
Crook, R.C and Sverrison, A.S (1999) ‘To what extent can decentralised forms of government enhancethe development of pro-poor policies and improve poverty alleviation outcomes’? , Background Paperfor World Bank, Sussex: Institute for Development Studies
Dhanani, S and Islam, I (2002) ‘Poverty, vulnerability and social protection in a period of crisis: thecase of Indonesia’, World Development, 30(7)
Duflo, E (2001) ‘Schooling and labour market consequences of school construction in Indonesia:evidence from an unusual policy experiment’, American Economic Review, 91:795-813
Easterly, W (2002) ‘The cartel of good intentions: bureaucracy vs markets in foreign aid’, May,mimeo, Washington DC: Centre for Global Development and Institute for International Economics
Elson, R (2001) Suharto: a political biography, Melbourne and Cambridge: Cambridge UniversityPress
Esmara, H (1975) ‘Regional income disparities’, Bulletin of Indonesian Economic Studies, 11(1): 41-57
Garcia, J and Soelistiangingsih, L (1998) ‘Why do differences in provincial incomes persist inIndonesia’, Bulletin of Indonesian Economic Studies, 34(1): 95-120
GOI/ADB (2000) ‘Poverty reduction partnership agreement (2001-2004) between the Government ofIndonesia and Asian Development Bank’, Jakarta, April
Hill, H (1997) ‘Regional development in Southeast Asia: the challenges of sub-national diversity,Journal of the Asia Pacific Economy, 2(3): 261-302
Hill, H (2002) Spatial disparities in developing East Asia: a survey, Asian Pacific Economic Literature,16(1): 10-35
Hull, T (1999) ‘Striking a most delicate balance: the implications of Otonomi Daerah for the planningand implementation of development co-operation projects’, ANU, Canberra, Final Report forAUSAID, December 3
ILO (1999) Indonesia: strategies for employment-led recovery and reconstruction, Geneva: ILO
Islam, I (1999a) ‘Regional decentralisation in Indonesia: towards a social accord’, July 30, Jakarta,UNSFIR Working Paper No.99/01
Islam, I (1999b) ‘Making decentralisation work: reaping the rewards and managing the risks’,September 3, Jakarta, UNSFIR Working Paper 99/03
Islam, I (2002) ‘Formulating a strategic approach to poverty reduction: from a global framework to anIndonesian agenda’, July, Jakarta, UNSFIR Working Paper

27
Islam, I and Khan, M.H (1986) ‘Spatial patterns of inequality and poverty in Indonesia’, Bulletin ofIndonesian Economic Studies, 17(2): 80-102
Lustig, N (2000) ‘Crises and the poor: socially responsible macroeconomics’, February, WashingtonDC: InterAmerican Development Bank
Manor, J (1999) The political economy of decentralisation, Washington DC: World Bank
Nazara, S (1999) ‘Provincial convergence in Indonesia’, paper presented at the 21st Northeast RegionalScience Conference, Ithaca, Cornell University to Honor Walter Isard’s 80th Birthday
OECD (1996) Shaping the 21st century: The contribution of development cooperation, DAC, Paris:OECD
Prud’home, R (1995) ‘The dangers of decentralisation’, World Bank Research Observer, 10(2): 201-220
Ranis, G and Stewart, F (1994) ‘Decentralisation in Indonesia’, Bulletin of Indonesian EconomicStudies, 30(3): 41-72
Ravallion, M (1998) ‘Inpres and equality: a distributional perspective on the centre’s regionaldisbursements’, Bulletin of Indonesian Economic Studies, 24(3): 53-71Ray, D and Goodpaster, G (2001) ‘Policies and institutions to ensure free internal trade underdecentralisation’, April, paper presented at a conference on Trade, Decentralisation and Globalisation,Jakarta
Ricklefs, M (1981) A history of modern Indonesia, London and Basingstoke: MacMillan
Saadah, F, Waters, H and Heywood, P (1999) ‘Indonesia: undernutrition in young children’, January,East Asia and the Pacific Region, Washington DC: World Bank
Shah, A and Qureshi, Z (1994) ‘Intergovernmental fiscal relations in Indonesia: issues and reformoptions’, Discussion Paper No.239, Washington DC: World Bank
Shorrocks, A.F (1980) ‘The class of additively decomposable inequality measures’, Econometrica,48(3): 613-625
Skoufias, E, and Suryahadi, A (2000) ‘Changes in regional inequality and social welfare in Indonesiabetween 1996 and 1999’, Working Paper, Social Monitoring and Early Response Unit ResearchInstitute (SMERU), Jakarta
Smoke, P and Lewis, B (1996) ‘Fiscal decentralisation in Indonesia: a new approach to an old idea’,World Development, 24(8): 1281-1300
Stalker, P and Mishra, S (2003) ‘The Right to Development in Indonesia’, Working Paper, Jakarta,UNSFIR Working Paper
Stalker, P (2003) ‘The case for an Indonesian social summit’, March 2, Working Paper, Jakarta,UNSFIR
Suyarho, W (2002) ‘Indonesia’s fiscal decentralisation: a preliminary assessment of the first yearexperience, Jakarta, UNSFIR Working Paper 02/07
Tajoeddin, M.Z, Suyarho, W and Mishra, S (2001) ‘Regional disparity and vertical conflict inIndonesia’, Journal of the Asia Pacific Economy, 6(3): 283-304
Tajoeddin, M.Z. (2002) ‘Anatomy of social violence in the context of transition: the case of Indonesia,1990-2001’, April, Jakarta, Working Paper 02/01-E

28
UNDP (2002) Human Development Report 2002: Deepening democracy in a fragmented world, NewYork and Oxford: Oxford University Press
UNSFIR (2002) ‘Indonesia 2020’, mimeo, Jakarta
Varshney, A (2001) Ethnic conflict and civic life: Hindus and Muslims in India, New Haven: YaleUniversity Press
Varshney, A (2002) ‘The relevance of international research on ethnic conflict for Indonesia: somereflections’, Working Paper, June, UNSFIR and CPRU/UNDP, Jakarta
Williamson, J.G. (1965) ‘Regional inequality and the process of national development: a description ofpatterns, Economic Development and Cultural Change, 13(3): 70-84
World Bank (1996) Indonesia: dimensions of growth, Report No. 15383-IND, May, Washington DC:World Bank
World Bank (2000) Indonesia: Managing government debt and its risks, Report No: 20436-IND, May,Washington DC: World Bank