Embed Size (px)
Citation preview
Deanna Tanner Okun, ChairmanJennifer A. Hillman, Vice Chairman
Marcia E. MillerStephen Koplan
Address all communications toSecretary to the Commission
United States International Trade CommissionWashington, DC 20436
COMMISSIONERS
U.S. International Trade Commission
Robert A. RogowskyDirector of Operations
Robert B. KoopmanDirector of Economics
U.S. International Trade Commission
Washington, DC 20436
August 2003
www.usitc.gov
Publication 3621
The Impact of Trade Agreements:Effect of the Tokyo Round,
U.S.-Israel FTA, U.S.-Canada FTA,NAFTA, and the Uruguay Round on
the U.S. Economy
Investigation No. TA-2111-1
This report was prepared principally by
Research DivisionHugh M. Arce, Chief
Kyle Johnson, Project LeaderRussell Hillberry, Deputy Project Leader
Primary ReviewersArona Butcher, Jan Summers
Major Contributors
Office of EconomicsLaurie-Ann Agama, Edward Balistreri, Michael Barry,
Nannette Christ, Judith Dean, Michael Ferrantino, James Fetzer,Alan Fox, Thomas Jennings, Joshua Levy, and Ted Wilson
Office of IndustriesJohn Davitt, Industries Coordinator
Gail Burns, William Chadwick, Jr., Roger Corey, Alfred Dennis,Lisa Ferens, Cynthia Foreso, Christopher Johnson, Eric Land,Deborah McNay, Michael Nunes, Laura Polly, Ryan Schroeder,
Steve Wanser, and Linda White
Supporting assistance was provided by:Cecelia Allen, Monica Reed, and Wanda Tolson
Office of PublishingJoyce Bookman, Paulette Henderson,Keven Blake, and John Robertson
i
PREFACE
This report has been prepared in response to a requirement of the TradeAct of 2002, enacted on August 6, 2002. Section 2111 of that Act requires theInternational Trade Commission (USITC, or the Commission) to report to theCommittee on Finance of the Senate and the Committee on Ways and Means ofthe House of Representatives regarding the economic impact on the UnitedStates of the following trade agreements: the Tokyo Round of MultilateralTrade Negotiations, the United States-Israel Free Trade Agreement, the UnitedStates-Canada Free Trade Agreement, North American Free Trade Agreement,and the Uruguay Round Agreements.
The Commission solicited public comment for this investigation bypublishing notices in the Federal Register of September 19, 2002 (67 F.R. 182)and March 3, 2003 (68 F.R. 41). A public hearing was held on January 14,2003. Appendix A contains a copy of section 2111 of the Trade Act of 2002,and of the Federal Register notices. Appendix F contains a list of witnesseswho appeared at the hearing and a summary of the views of these witnessesand other interested parties who submitted written statements.

iii
ABSTRACT
This report has been prepared in response to a requirement of the TradeAct of 2002 (19 U.S.C. 3811), enacted on August 6, 2002.1 Section 2111 ofthat Act requires the International Trade Commission to report to the SenateFinance Committee and the House Ways and Means Committee regarding theeconomic impact on the United States of the following trade agreements: theTokyo Round of Multilateral Trade Negotiations, the United States-Israel FreeTrade Agreement, the United States-Canada Free Trade Agreement, NorthAmerican Free Trade Agreement, and the Uruguay Round Agreements.
Assessing the economic impact of the five specified agreements on theUnited States is complicated by the difficulty in quantitatively specifying manyof the actual policies implemented by the agreements, by the difficulty indisentangling these effects from the many other changes that have taken placeover the past 25 years affecting the national economy, and by the difficulty ofisolating the effects of the agreements from each other, since theirimplementation often overlaps. Nevertheless, it is quite clear that the majormultilateral agreement (the Tokyo and Uruguay Round Agreements) have hadmore important effects on the economy than have the preferential agreements(U.S.-Israel, U.S.-Canada, and NAFTA). Further, measurable trade policychanges such as tariff reductions have had a large effect on trade growth, butthey have accounted for less than half of the overall growth in trade. Afteraccounting for the effects of trade policy, the residual growth in trade (overhalf) would be due to changes in population, productivity, technologicalprogress, or other trends.
Findings contained in the report are derived from several types of analysis.Most importantly, an extensive review of economic literature covers most ofthe direct and indirect effects of trade policy on the U.S. economy. An analysisof trends in industry trade, output, and employment examines linkagesbetween these trends and provisions of the trade agreements. Original empiricalresearch describes the growth of trade with Mexico in response to thepreferences that that country receives under NAFTA and the effects of tradepolicy in generating new trade flows. Also, an innovative simulation model anddata base, applied consistently to the five agreements, provides insight into therelative magnitudes of their effects and provides a calculation of the scale ofthese effects derived from plausible assumptions in a theory-based framework.
1 Pub. L. 107-210, 116, 2111, Stat. 933, 1021.

v
CONTENTS
PagePreface i. . . . . . . . . . . . . . . . . . . . . . . . . . . . . . . . . . . . . . . . . . . .
Abstract iii. . . . . . . . . . . . . . . . . . . . . . . . . . . . . . . . . . . . . . . . . . .
Executive Summary xxi. . . . . . . . . . . . . . . . . . . . . . . . . . . . . . . .
Chapter 1. Introduction 1. . . . . . . . . . . . . . . . . . . . . . . . . . . . .Scope of the study 1. . . . . . . . . . . . . . . . . . . . . . . . . . . . . . . . .Approach of the study 2. . . . . . . . . . . . . . . . . . . . . . . . . . . . . .Organization of the report 3. . . . . . . . . . . . . . . . . . . . . . . . . . .
Chapter 2. Negotiation of Trade Agreements under TradePromotion Authority 7. . . . . . . . . . . . . . . . . . . . . . . . . . . . . . . .
Legislation and agreements approved under tradepromotion authority 7. . . . . . . . . . . . . . . . . . . . . . . . . . . . . .Overview 7. . . . . . . . . . . . . . . . . . . . . . . . . . . . . . . . . . . . .
Tariff vs. nontariff barrier negotiating authority 14. . .Presidential authority to negotiate nontariffbarriers 14. . . . . . . . . . . . . . . . . . . . . . . . . . . . . .
Congressional fast track implementingprocedures 15. . . . . . . . . . . . . . . . . . . . . . . . . . .
Past and present trade agreement authority 15. . . .Regional and bilateral trade agreements 16. . . . . . . . .1979 Tokyo Round Agreements 18. . . . . . . . . . . . . . .
Setting 18. . . . . . . . . . . . . . . . . . . . . . . . . . . . . . . .Review of the negotiations 18. . . . . . . . . . . . . . . . .Overview of the agreement 19. . . . . . . . . . . . . . . .
Tariff barriers 19. . . . . . . . . . . . . . . . . . . . . . .Nontariff barriers 20. . . . . . . . . . . . . . . . . . . . .Tokyo round bilateral negotiations 21. . . . . . .
Impact of the agreement 22. . . . . . . . . . . . . . . . . .1985 United States-Israel Free Trade AreaAgreement 23. . . . . . . . . . . . . . . . . . . . . . . . . . . . . .
vi
CONTENTS—Continued
PageChapter 2. Negotiation of Trade Agreements under TradePromotion Authority–Continued
Setting 23. . . . . . . . . . . . . . . . . . . . . . . . . . . . . . . .Review of the negotiations 23. . . . . . . . . . . . . . . .Overview of the agreement 24. . . . . . . . . . . . . . . .
1988 United States-Canada Free TradeAgreement 24. . . . . . . . . . . . . . . . . . . . . . . . . . . . . .Setting 24. . . . . . . . . . . . . . . . . . . . . . . . . . . . . . . .Review of the negotiations 25. . . . . . . . . . . . . . . .Overview of the agreement 25. . . . . . . . . . . . . . . .Impact of the agreement 26. . . . . . . . . . . . . . . . . .
1993 North American Free Trade Agreement 26. . . . .Setting 26. . . . . . . . . . . . . . . . . . . . . . . . . . . . . . . .Review of the negotiations 27. . . . . . . . . . . . . . . .Overview of the agreement 27. . . . . . . . . . . . . . . .
Objectives 28. . . . . . . . . . . . . . . . . . . . . . . . . .Trade in goods 29. . . . . . . . . . . . . . . . . . . . . .Technical barriers to trade 30. . . . . . . . . . . . .Government procurement 30. . . . . . . . . . . . . .Investment and services 30. . . . . . . . . . . . . . .Intellectual property rights 31. . . . . . . . . . . . .Institutional provisions 31. . . . . . . . . . . . . . . .Exceptions 32. . . . . . . . . . . . . . . . . . . . . . . . .
Impact of the agreement 32. . . . . . . . . . . . . . . . . .1994 Uruguay round agreements 33. . . . . . . . . . . . . . .
Setting 33. . . . . . . . . . . . . . . . . . . . . . . . . . . . . . . .Review of the negotiations 34. . . . . . . . . . . . . . . .Overview of the agreement 34. . . . . . . . . . . . . . . .
Goods, services, and intellectual property 34.Single integrated package of agreements 35. .WTO agreement and integral annexes 35. . . .GATT 1947 vs. GATT 1994 36. . . . . . . . . . .Marrakesh protocol of national schedulesof commitments 37. . . . . . . . . . . . . . . . . . .
Impact of the agreement 37. . . . . . . . . . . . . . . . . .
vii
CONTENTS—Continued
PageChapter 3. Economic Changes in the United StatesSince the Beginning of the Tokyo Round 39. . . . . . . . . . . . .
Structure of U.S. economy 40. . . . . . . . . . . . . . . . . . . . . . . . . .Cross-industry reallocation and frictionalunemployment 47. . . . . . . . . . . . . . . . . . . . . . . . . . . . . . .Post-employment experiences of displacedworkers 49. . . . . . . . . . . . . . . . . . . . . . . . . . . . . . . . .
Economic growth and productivity 51. . . . . . . . . . . . . . . . . . . .Growth in factor inputs 52. . . . . . . . . . . . . . . . . . . . . . . . . .Productivity measures and changes in productivity 53. . . .Possible sources of output and productivity growth 55. . . .
Changes in the distribution of wages across measuresof skill 56. . . . . . . . . . . . . . . . . . . . . . . . . . . . . . . . . . . . . . . .Measuring the premium paid to skilled labor 57. . . . . . . . .Historical experience 58. . . . . . . . . . . . . . . . . . . . . . . . . . . .
Chapter 4. The Effects of Trade Liberalization onthe U.S. Economy in Historical Perspective:A Literature Review 63. . . . . . . . . . . . . . . . . . . . . . . . . . . . . . . .
Overview 63. . . . . . . . . . . . . . . . . . . . . . . . . . . . . . . . . . . . . . . .Types of literature reviewed 63. . . . . . . . . . . . . . . . . . . . . .Methodologies employed in the literature 64. . . . . . . . . . .Principal findings 66. . . . . . . . . . . . . . . . . . . . . . . . . . . . . .
Economic effects attributed to particular agreementsnegotiated under trade promotion authority 68. . . . . . . . . . .Simulation analyses of U.S. trade policy changes 68. . . . .
Overall impact on U.S. economy 70. . . . . . . . . . . . . . .Scale economies and imperfect competition 80. . . . . .Sectoral results 82. . . . . . . . . . . . . . . . . . . . . . . . . . . . .Non-tariff barriers 84. . . . . . . . . . . . . . . . . . . . . . . . . . .Investment dynamics 86. . . . . . . . . . . . . . . . . . . . . . . .Conclusion 87. . . . . . . . . . . . . . . . . . . . . . . . . . . . . . . .
General economic effects of trade liberalization in the“Fast-Track” era 88. . . . . . . . . . . . . . . . . . . . . . . . . . . . . . . .Studies evaluating sources of trade growth 88. . . . . . . . . . .
viii
CONTENTS—Continued
PageChapter 4. The Effects of Trade Liberalization onthe U.S. Economy in Historical Perspective:A Literature Review—Continued
The role of trade policy in explaining tradegrowth 89. . . . . . . . . . . . . . . . . . . . . . . . . . . . . . . . . .
Conclusion 93. . . . . . . . . . . . . . . . . . . . . . . . . . . . . . . .Estimates of the effects of the agreements on trade 93. . . .
Conclusion 100. . . . . . . . . . . . . . . . . . . . . . . . . . . . . . . .Effects on growth and productivity 100. . . . . . . . . . . . . . . . .
Trade liberalization and GDP growth 101. . . . . . . . . . . .Direct links between unilateral liberalizationand growth 102. . . . . . . . . . . . . . . . . . . . . . . . . . .
Indirect links between unilateral andmultilateral liberalization, investment,and growth 105. . . . . . . . . . . . . . . . . . . . . . . . . . .
Trade liberalization and productivity 107. . . . . . . . . . . .Global competition and the productivity ofexporting and import-competing firms 107. . . . .
Reductions in price distortions and productioncosts 111. . . . . . . . . . . . . . . . . . . . . . . . . . . . . . . .
FDI, technological spillovers, and firmproductivity 112. . . . . . . . . . . . . . . . . . . . . . . . . .
Conclusion 113. . . . . . . . . . . . . . . . . . . . . . . . . . . . . . . .Effects on labor outcomes 114. . . . . . . . . . . . . . . . . . . . . . . .
Economic theory 115. . . . . . . . . . . . . . . . . . . . . . . . . . . .Empirical studies of wage inequality 117. . . . . . . . . . . .
Outsourcing and wages 121. . . . . . . . . . . . . . . . . . .Agreement-specific analysis 122. . . . . . . . . . . . . . . . . . .Non-agreement-specific analysis 123. . . . . . . . . . . . . . .Conclusion 125. . . . . . . . . . . . . . . . . . . . . . . . . . . . . . . .
Effects on product variety 125. . . . . . . . . . . . . . . . . . . . . . . .Conclusion 128. . . . . . . . . . . . . . . . . . . . . . . . . . . . . . . .
ix
CONTENTS—Continued
PageChapter 5. Industry Sector Analysis
Introduction 129. . . . . . . . . . . . . . . . . . . . . . . . . . . . . . . . . . . . . .Views of interested parties 133. . . . . . . . . . . . . . . . . . . . . . .
AFL-CIO 133. . . . . . . . . . . . . . . . . . . . . . . . . . . . . . . . .Uruguay round 133. . . . . . . . . . . . . . . . . . . . . . . . .NAFTA 135. . . . . . . . . . . . . . . . . . . . . . . . . . . . . . .
Benjamin Goodrich 135. . . . . . . . . . . . . . . . . . . . . . . . .International intellectal property alliance 136. . . . . . . . .National association of manufacturers 136. . . . . . . . . . .
NAFTA 136. . . . . . . . . . . . . . . . . . . . . . . . . . . . . . .Uruguay round 137. . . . . . . . . . . . . . . . . . . . . . . . .
Services 137. . . . . . . . . . . . . . . . . . . . . . . . . . . . . . . . . . . . . . . . .Overview 137. . . . . . . . . . . . . . . . . . . . . . . . . . . . . . . . . . . . .
Effect of trade agreements on the sector 141. . . . . . . . .U.S.-Canada FTA 141. . . . . . . . . . . . . . . . . . . . . . . .NAFTA 144. . . . . . . . . . . . . . . . . . . . . . . . . . . . . . .Uruguay round 145. . . . . . . . . . . . . . . . . . . . . . . . .
Views of interested parties 146. . . . . . . . . . . . . . . . . . . .Air transportation association 146. . . . . . . . . . . . . .
Machinery and Electronics 147. . . . . . . . . . . . . . . . . . . . . . . . . .Overview 147. . . . . . . . . . . . . . . . . . . . . . . . . . . . . . . . . . .
Effect of trade agreements on the sector 153. . . . . . . . .Tokyo round 153. . . . . . . . . . . . . . . . . . . . . . . . . . .U.S.-Israel FTA 155. . . . . . . . . . . . . . . . . . . . . . . . .U.S.-Canada FTA 155. . . . . . . . . . . . . . . . . . . . . . . .NAFTA 158. . . . . . . . . . . . . . . . . . . . . . . . . . . . . . .Uruguay round 161. . . . . . . . . . . . . . . . . . . . . . . . .
Views of interested parties 162. . . . . . . . . . . . . . . . . . . .National electrical manufacturers association 162. .
NAFTA 162. . . . . . . . . . . . . . . . . . . . . . . . . . . .Uruguay round 162. . . . . . . . . . . . . . . . . . . . . .
x
CONTENTS—Continued
PageChapter 5. Industry Sector Analysis—Continued
Agriculture 162. . . . . . . . . . . . . . . . . . . . . . . . . . . . . . . . . . . . . . .Overview 162. . . . . . . . . . . . . . . . . . . . . . . . . . . . . . . . . . . . .
Effect of trade agreements on the sector 168. . . . . . . . .Tokyo round 170. . . . . . . . . . . . . . . . . . . . . . . . . . . .U.S.-Israel FTA 171. . . . . . . . . . . . . . . . . . . . . . . . .U.S.-Canada FTA 174. . . . . . . . . . . . . . . . . . . . . . . .NAFTA 177. . . . . . . . . . . . . . . . . . . . . . . . . . . . . . .Uruguay round 178. . . . . . . . . . . . . . . . . . . . . . . . . .
Views of interested parties 179. . . . . . . . . . . . . . . . . . . .Blue diamond growers 179. . . . . . . . . . . . . . . . . . . .
Tokyo round and Uruguay round 179. . . . . . . .U.S.-Israel free trade agreement 179. . . . . . . . .U.S.-Canada free trade agreement 179. . . . . . . .NAFTA 180. . . . . . . . . . . . . . . . . . . . . . . . . . . .
Florida citrus mutual 180. . . . . . . . . . . . . . . . . . . . .Uruguay round 180. . . . . . . . . . . . . . . . . . . . . .NAFTA 180. . . . . . . . . . . . . . . . . . . . . . . . . . . .
Florida tomato exchange 181. . . . . . . . . . . . . . . . . .NAFTA 181. . . . . . . . . . . . . . . . . . . . . . . . . . . .
National milk producers federation andU.S. dairy export council 182. . . . . . . . . . . . . . . .Tokyo round 182. . . . . . . . . . . . . . . . . . . . . . . .The U.S.-Canada free trade agreement 182. . . .NAFTA 183. . . . . . . . . . . . . . . . . . . . . . . . . . . .U.S.-Israel free trade agreement 183. . . . . . . . .Uruguay round 183. . . . . . . . . . . . . . . . . . . . . .
The ranchers-cattlemen action legal fund-unitedstockgrowers of America 184. . . . . . . . . . . . . . . .U.S.-Canada FTA and NAFTA 184. . . . . . . . . .Tokyo round 185. . . . . . . . . . . . . . . . . . . . . . . .U.S.-Israel free trade agreement 185. . . . . . . . .Uruguay round 185. . . . . . . . . . . . . . . . . . . . . .
Chemicals and allied products 186. . . . . . . . . . . . . . . . . . . . . . . .Overview 186. . . . . . . . . . . . . . . . . . . . . . . . . . . . . . . . . . . . .
xi
CONTENTS—Continued
PageChapter 5. Industry Sector Analysis—Continued
Effect of trade agreements on the sector 192. . . . . . . . .Tokyo round 192. . . . . . . . . . . . . . . . . . . . . . . . . . . .U.S.-Israel FTA 194. . . . . . . . . . . . . . . . . . . . . . . . .The U.S.-Canada FTA 194. . . . . . . . . . . . . . . . . . . .NAFTA 194. . . . . . . . . . . . . . . . . . . . . . . . . . . . . . .Uruguay round 199. . . . . . . . . . . . . . . . . . . . . . . . . .
Views of interested parties 200. . . . . . . . . . . . . . . . . . . .Generic pharmaceutical association 200. . . . . . . . . .Pharmaceutical research and manufacturers ofAmerica 201. . . . . . . . . . . . . . . . . . . . . . . . . . . . .
Mineral and metal products 202. . . . . . . . . . . . . . . . . . . . . . . . . .Overview 202. . . . . . . . . . . . . . . . . . . . . . . . . . . . . . . . . . . . .
Effect of trade agreements on the sector 210. . . . . . . . .Tokyo round 211. . . . . . . . . . . . . . . . . . . . . . . . . . . .U.S.-Israel FTA 211. . . . . . . . . . . . . . . . . . . . . . . . .The U.S.-Canada FTA 213. . . . . . . . . . . . . . . . . . . .NAFTA 219. . . . . . . . . . . . . . . . . . . . . . . . . . . . . . .Uruguay round 220. . . . . . . . . . . . . . . . . . . . . . . . .
Views of interested parties 221. . . . . . . . . . . . . . . . . . . .American restaurant china council 221. . . . . . . . . . .
Tokyo and Uruguay rounds 221. . . . . . . . . . . .Nucor corporation and TXI chaparral steel 222. . . .Specialty steel industry of North America 223. . . . .
Tokyo round 223. . . . . . . . . . . . . . . . . . . . . . . .Uruguay round 223. . . . . . . . . . . . . . . . . . . . . .
Tile council of America inc. 224. . . . . . . . . . . . . . .Western economic analysis center 225. . . . . . . . . . .
Transportation equipment 225. . . . . . . . . . . . . . . . . . . . . . . . . . .Overview 225. . . . . . . . . . . . . . . . . . . . . . . . . . . . . . . . . . . . .
Effect of trade agreements on the sector 233. . . . . . . . .Tokyo round 234. . . . . . . . . . . . . . . . . . . . . . . . . . . .The U.S.-Israel FTA 237. . . . . . . . . . . . . . . . . . . . .The U.S.-Canada FTA 240. . . . . . . . . . . . . . . . . . . .
xii
CONTENTS—Continued
PageChapter 5. Industry Sector Analysis—Continued
NAFTA 240. . . . . . . . . . . . . . . . . . . . . . . . . . . . . . .Uruguay round 243. . . . . . . . . . . . . . . . . . . . . . . . .
Forest and fishery products 244. . . . . . . . . . . . . . . . . . . . . . . . . .Overview 244. . . . . . . . . . . . . . . . . . . . . . . . . . . . . . . . . . . . .
Effect of trade agreements on the sector 249. . . . . . . . .Tokyo round 251. . . . . . . . . . . . . . . . . . . . . . . . . . . .U.S.-Israel FTA 251. . . . . . . . . . . . . . . . . . . . . . . . .U.S.-Canada FTA 254. . . . . . . . . . . . . . . . . . . . . . . .NAFTA 254. . . . . . . . . . . . . . . . . . . . . . . . . . . . . . .Uruguay round 257. . . . . . . . . . . . . . . . . . . . . . . . .
Views of interested parties 257. . . . . . . . . . . . . . . . . . . .American forest and paper association 257. . . . . . .
Tokyo and Uruguay rounds 258. . . . . . . . . . . .NAFTA 258. . . . . . . . . . . . . . . . . . . . . . . . . . . .
United States tuna foundation 258. . . . . . . . . . . . . .Energy and Fuels 259. . . . . . . . . . . . . . . . . . . . . . . . . . . . . . . . . .
Effect of trade agreements on the sector 264. . . . . . . . .U.S.-Canada FTA 266. . . . . . . . . . . . . . . . . . . . . . . .NAFTA 266. . . . . . . . . . . . . . . . . . . . . . . . . . . . . . .
Miscellaneous products 271. . . . . . . . . . . . . . . . . . . . . . . . . . . . .Overview 271. . . . . . . . . . . . . . . . . . . . . . . . . . . . . . . . . . . . .
Effect of trade agreements on the sector 276. . . . . . . . .Tokyo round 277. . . . . . . . . . . . . . . . . . . . . . . . . . . .U.S.-Israel FTA 277. . . . . . . . . . . . . . . . . . . . . . . . .U.S.-Canada FTA 281. . . . . . . . . . . . . . . . . . . . . . . .NAFTA 281. . . . . . . . . . . . . . . . . . . . . . . . . . . . . . .Uruguay round 284. . . . . . . . . . . . . . . . . . . . . . . . .
Views of interested parties 285. . . . . . . . . . . . . . . . . . . .American brush manufacturers association 285. . . .
Textiles and Apparel 285. . . . . . . . . . . . . . . . . . . . . . . . . . . . . . .Overview 285. . . . . . . . . . . . . . . . . . . . . . . . . . . . . . . . . . . . .
Effect of trade agreements on the sector 290. . . . . . . . .Tokyo round 290. . . . . . . . . . . . . . . . . . . . . . . . . . . .U.S.-Israel FTA 292. . . . . . . . . . . . . . . . . . . . . . . . .
xiii
CONTENTS—Continued
PageChapter 5. Industry Sector Analysis—Continued
U.S.-Canada FTA 295. . . . . . . . . . . . . . . . . . . . . . . .NAFTA 295. . . . . . . . . . . . . . . . . . . . . . . . . . . . . . .Uruguay round 298. . . . . . . . . . . . . . . . . . . . . . . . .
Views of interested parties 299. . . . . . . . . . . . . . . . . . . .Association of the nonwoven fabrics industry 299. .
Chapter 6. The Impact of NAFTA Preferences on U.S.-Mexican Trade: A Sectoral Approach 301. . . . . . . . . . . . . . . .
Introduction 301. . . . . . . . . . . . . . . . . . . . . . . . . . . . . . . . . . . . . .Previous studies 303. . . . . . . . . . . . . . . . . . . . . . . . . . . . . . . . . . .NAFTA and North American trade 304. . . . . . . . . . . . . . . . . . . .
United States 304. . . . . . . . . . . . . . . . . . . . . . . . . . . . . . . . . .Mexico 308. . . . . . . . . . . . . . . . . . . . . . . . . . . . . . . . . . . . . .
Analytical framework 313. . . . . . . . . . . . . . . . . . . . . . . . . . . . . .Results 315. . . . . . . . . . . . . . . . . . . . . . . . . . . . . . . . . . . . . . . . . .
United States 315. . . . . . . . . . . . . . . . . . . . . . . . . . . . . . . . . .Impact of U.S. NAFTA tariff preferences onMexican import share 316. . . . . . . . . . . . . . . . . . . . . .
Importance of U.S. NAFTA tariff preferences forMexico’s import share 319. . . . . . . . . . . . . . . . . . . . .
Mexico 320. . . . . . . . . . . . . . . . . . . . . . . . . . . . . . . . . . . . . .Impact of Mexican NAFTA tariff preferences onU.S. import share 320. . . . . . . . . . . . . . . . . . . . . . . . .
Importance of Mexican NAFTA tariff preferences forU.S. import share 321. . . . . . . . . . . . . . . . . . . . . . . . .
Conclusion 323. . . . . . . . . . . . . . . . . . . . . . . . . . . . . . . . . . . . . . .
Chapter 7. Comparative Simulations of the EconomywideEffects of the Five Trade Agreements Negotiated UnderFast-Track Authority 325. . . . . . . . . . . . . . . . . . . . . . . . . . . . . . . .
Overview 325. . . . . . . . . . . . . . . . . . . . . . . . . . . . . . . . . . . . . . . .Approach 327. . . . . . . . . . . . . . . . . . . . . . . . . . . . . . . . . . . . .Principal findings 330. . . . . . . . . . . . . . . . . . . . . . . . . . . . . .
Baseline 333. . . . . . . . . . . . . . . . . . . . . . . . . . . . . . . . . . . . . . . . .Detailed results 334. . . . . . . . . . . . . . . . . . . . . . . . . . . . . . . . . . .
xiv
CONTENTS—Continued
Page
Chapter 8. Growth in Product Variety 341. . . . . . . . . . . . . . . .Theoretical discussion 342. . . . . . . . . . . . . . . . . . . . . . . . . . . . . .Data 344. . . . . . . . . . . . . . . . . . . . . . . . . . . . . . . . . . . . . . . . . . . .Historical experience 344. . . . . . . . . . . . . . . . . . . . . . . . . . . . . . .New varieties in trade growth, a decomposition 346. . . . . . . . . .
Method 346. . . . . . . . . . . . . . . . . . . . . . . . . . . . . . . . . . . . . .Results 347. . . . . . . . . . . . . . . . . . . . . . . . . . . . . . . . . . . . . . .
Econometrics 350. . . . . . . . . . . . . . . . . . . . . . . . . . . . . . . . . . . . .Measuring the economic effects of increased productvariety 351. . . . . . . . . . . . . . . . . . . . . . . . . . . . . . . . . . . . . . . .
AppendicesA. Authorizing legislation and federal register notices A-1. . . . . . .B. Chapter 6 technical annex B-1. . . . . . . . . . . . . . . . . . . . . . . . . . .C. Chapter 7 technical annex C-1. . . . . . . . . . . . . . . . . . . . . . . . . . .D. Chapter 8 technical annex D-1. . . . . . . . . . . . . . . . . . . . . . . . . . .E. Bibliography E-1. . . . . . . . . . . . . . . . . . . . . . . . . . . . . . . . . . . . .F. Witness list and views of interested parties F-1. . . . . . . . . . . . . .
Tables3-1. Gross domestic product by industry sector 41. . . . . . . . . . .3-2. Employment by industry sector 45. . . . . . . . . . . . . . . . . . .3-3. Changes in value added by manufacturing sector,
1977-2000 46. . . . . . . . . . . . . . . . . . . . . . . . . . . . . . . . . .3-4. Contributions of labor, capital, and productivity to
U.S. private non-farm business output per hour 55. . . . .4-1. Summary of selected simulation studies: Predicted
impact on U.S. welfare, imports, and exports 71. . . . . . .4-2. Summary of selected simulation studies: Predicted
impact on output, exports, and import bysector-NAFTA 75. . . . . . . . . . . . . . . . . . . . . . . . . . . . . .
5-1. Real private gross domestic product and employmentby industry sector, 1980 and 2001 132. . . . . . . . . . . . . . .
5-2. U.S. trade by sector, 1980 and 2001 134. . . . . . . . . . . . . . . .
xv
CONTENTS—Continued
PageTables--Continued5-3. Services: U.S. trade with Canada and Mexico,
1988-2001 142. . . . . . . . . . . . . . . . . . . . . . . . . . . . . . . . . .5-4. Machinery and electronics sector: U.S. shipments,
imports, exports, apparent consumption, ratios ofimports to consumption and exports to shipments,total employment, production workers, hourly wages,and productivity, 1978-2001 148. . . . . . . . . . . . . . . . . . . .
5-5. Machinery and electronics: Trade issuesaddressed in trade agreements and U.S. tariffs 154. . . . . .
5-6. Machinery and electronics: U.S. tradewith Israel, 1984-2001 156. . . . . . . . . . . . . . . . . . . . . . . .
5-7. Machinery and electronics: U.S. trade withCanada and Mexico, 1987-2001 159. . . . . . . . . . . . . . . . .
5-8. Agricultural products: U.S. shipments, imports,exports, apparent consumption, ratios of imports toconsumption and exports to shipments, totalemployment, production workers, hourly wages, andproductivity, 1978-2001 164. . . . . . . . . . . . . . . . . . . . . . .
5-9. Agricultural products: Trade issues addressed in tradeagreements and U.S. tariffs 169. . . . . . . . . . . . . . . . . . . . .
5-10. Agricultural products: U.S. trade with Israel,1984-2001 172. . . . . . . . . . . . . . . . . . . . . . . . . . . . . . . . . .
5-11. Agricultural products: U.S. trade with Canada andMexico, 1987-2001 175. . . . . . . . . . . . . . . . . . . . . . . . . .
5-12. Chemicals and allied products: U.S. shipments,imports, exports, apparent consumption, ratiosof imports to consumption and exports toshipments, total employment, productionworkers, hourly wages, and productivity,1978-2001 187. . . . . . . . . . . . . . . . . . . . . . . . . . . . . . . . . .
5-13. Chemicals and allied products: Trade issuesaddressed in trade agreements and U.S. tariffs 193. . . . . .
5-14. Chemicals and allied products: U.S. trade withIsrael, 1984-2001, 195. . . . . . . . . . . . . . . . . . . . . . . . . . .
xvi
CONTENTS—Continued
PageTables—Continued5-15. Chemicals and allied products: U.S. trade with Canada
and Mexico, 1987-2001 197. . . . . . . . . . . . . . . . . . . . . . .5-16. Minerals and metals products: U.S. shipments,
imports, exports, apparent consumption, ratios ofimports to consumption and exports to shipments,total employment, production workers, hourly wages,and productivity, 1978-2001 204. . . . . . . . . . . . . . . . . . .
5-17. Minerals and metals products: Trade issues addressedin trade agreements and U.S. tariffs 212. . . . . . . . . . . . . .
5-18. Minerals and metals products: U.S. trade with Israel,1984-2001 214. . . . . . . . . . . . . . . . . . . . . . . . . . . . . . . . . .
5-19. Minerals and metals products: U.S. trade with Canadaand Mexico, 1987-2001 217. . . . . . . . . . . . . . . . . . . . . . .
5-20. Transportation equipment: U.S. shipments, imports,exports, apparent consumption, ratios of importsto consumption and exports to shipments, totalemployment, production workers, hourly wages,and productivity, 1978-2001 227. . . . . . . . . . . . . . . . . . .
5-21. Transportation equipment: Trade issues addressedin trade agreements and U.S. tariffs 235. . . . . . . . . . . . . .
5-22. Transportation equipment: U.S. trade with Israel,1984-2001 238. . . . . . . . . . . . . . . . . . . . . . . . . . . . . . . . . .
5-23. Transportation equipment: U.S. trade with Canadaand Mexico, 1987-2001 241. . . . . . . . . . . . . . . . . . . . . . .
5-24. Forest and fishery products: U.S. shipments,imports, exports, apparent consumption, ratiosof imports to consumption and exports to shipments,total employment, production workers, hourly wages,and productivity, 1978-2001 245. . . . . . . . . . . . . . . . . . .
5-25. Forest and fishery products: Trade issues addressedin trade agreements and U.S. tariffs 250. . . . . . . . . . . . . .
5-26. Forest and fishery products: U.S. trade with Israel,1984-2001 252. . . . . . . . . . . . . . . . . . . . . . . . . . . . . . . . . .
xvii
CONTENTS—Continued
PageTables—Continued5-27. Forest and fishery products: U.S. trade with Canada and
Mexico, 1987-2001 255. . . . . . . . . . . . . . . . . . . . . . . . . .5-28. Energy and fuel products: U.S. shipments, imports,
exports, apparent consumption, ratios ofimports to consumption and exports to shipments,total employment, production workers,hourly wages, and productivity, 1978-2001 260. . . . . . . .
5-29. Energy and fuel products: Trade issues addressedin trade agreements and U.S. tariffs 265. . . . . . . . . . . . . .
5-30. Energy and fuel products: U.S. trade with Israel,1984-2001 267. . . . . . . . . . . . . . . . . . . . . . . . . . . . . . . . . .
5-31. Energy and fuel products: U.S. trade with Canadaand Mexico, 1987-2001 269. . . . . . . . . . . . . . . . . . . . . . .
5-32. Miscellaneous products: U.S. shipments, imports,exports, apparent consumption, ratios of imports toconsumption and exports to shipments, totalemployment, production workers, hourly wages,and productivity, 1978-2001 273. . . . . . . . . . . . . . . . . . .
5-33. Miscellaneous products: Trade issues addressed in tradeagreements and U.S. tariffs 278. . . . . . . . . . . . . . . . . . . . .
5-34. Miscellaneous products: U.S. trade with Israel,1984-2001 279. . . . . . . . . . . . . . . . . . . . . . . . . . . . . . . . . .
5-35. Miscellaneous products: U.S. trade with Canadaand Mexico, 1987-2001 282. . . . . . . . . . . . . . . . . . . . . . .
5-36. Textiles and apparel products: U.S. shipments,imports, exports, apparent consumption, ratios ofimports to consumption and exports to shipments,total employment, production workers, hourlywages, and productivity, 1978-2001 287. . . . . . . . . . . . .
5-37. Textiles and apparel products: Trade issues addressedin trade agreements and U.S. tariffs 291. . . . . . . . . . . . . .
5-38. Textiles and apparel products: U.S. trade with Israel,1984-2001 293. . . . . . . . . . . . . . . . . . . . . . . . . . . . . . . . . .
xviii
CONTENTS—Continued
PageTables—Continued5-39. Textiles and apparel products: U.S. trade with Canada
and Mexico, 1987-2001 296. . . . . . . . . . . . . . . . . . . . . . .6-1. The impact of U.S. NAFTA preferences:
Manufacturing sector 316. . . . . . . . . . . . . . . . . . . . . . . . .6-2. Explaining the growth of Mexico’s share of U.S.
manufactured imports, 1990-2001 317. . . . . . . . . . . . . . .6-3. The impact of Mexican NAFTA preferences:
Manufacturing sector 322. . . . . . . . . . . . . . . . . . . . . . . . .6-4. Explaining the growth of U.S. share of Mexican
manufactured imports, 1991-1999 322. . . . . . . . . . . . . . .8-1. Decomposition of trade growth 347. . . . . . . . . . . . . . . . . . . .8-2. Decomposition of import growth in continued
products 348. . . . . . . . . . . . . . . . . . . . . . . . . . . . . . . . . . . .8-3. SIC share of import growth in continued products
with new trade partners 348. . . . . . . . . . . . . . . . . . . . . . . .8-4. SIC share of import growth in continued products
with new trading partners, by new trading partner 349. . .8-5. SIC share of import growth in continued products
with new trade partners by product 350. . . . . . . . . . . . . . .B-1. Sector classifications and descriptions B-9. . . . . . . . . . . . . .B-2. Explaining Mexican shares of U.S. imports:
Manufacturing sector, 1989-2001 B-10. . . . . . . . . . . . . . .B-3. Explaining Mexican shares of U.S. imports:
Apparel and textiles sectors, 1989-2001 B-11. . . . . . . . . .B-4. Explaining U.S. shares of Mexican imports:
Manufacturing sector, 1991-1999 B-12. . . . . . . . . . . . . . .
xix
CONTENTS—Continued
PageTables—ContinuedD-1. Trade cost changes and growth in imported
SIC 4-digit product-country pairs, 1978-2001 D-5. . . . . .D-2. Explaining the growth of new product-country
pairs in U.S. imports, 1978-2001 D-6. . . . . . . . . . . . . . . .D-3. Regression of import variety changes on trade
cost changes for all sectors and for industrysubsector D-7. . . . . . . . . . . . . . . . . . . . . . . . . . . . . . . . . . .
D-4. Regression of import variety changes on tradecost changes for subsamples of regressors D-8. . . . . . . . .
D-5. Regression of import variety changes on tradecost changes for subsamples of countriesdefined by date of GATT/WTO accession D-9. . . . . . . . .
D-6. Regression of import variety changes on tradecost changes for subsamples of countriesdefined by levels of development D-10. . . . . . . . . . . . . . . .
D-7. Parameter inputs into model calibration D-14. . . . . . . . . . . . .
FiguresES-1. Simulated marginal welfare impact of removing agreements
in 2001 xxii. . . . . . . . . . . . . . . . . . . . . . . . . . . . . . . . . . . .1-1. Benchmark quantity indices for U.S. real income and
trade, 1978-2001 5. . . . . . . . . . . . . . . . . . . . . . . . . . . .2-1. Timeline of events related to fast track negotiating
authority, 1934-2002 9. . . . . . . . . . . . . . . . . . . . . . . . .3-1. Output per hour in manufacturing and business
sectors, 1974-2002 (1974=100) 45. . . . . . . . . . . . . . . . .3-2. U.S. civilian unemployment rate, changes in real
GDP and implementation dates of significantU.S. trade agreements, 1974-2001 48. . . . . . . . . . . . . . .
3-3. U.S. unemployment rate and trade deficit 50. . . . . . . . . . . .3-4. Measures of real labor compensation (1979=100) 58. . . . .3-5. Real production and non-production earnings in
manufacturing, 1977-2000 (Productionworkers, 1977=100) 60. . . . . . . . . . . . . . . . . . . . . . . . . .
xx
CONTENTS—Continued
PageFigures—Continued3-6. Real earnings by educational attainment, 1975-1999
(High School diploma, 1975=100) 61. . . . . . . . . . . . . .6-1. Simple average U.S. tariff on imports from Mexico,
1993 and 2001 305. . . . . . . . . . . . . . . . . . . . . . . . . . . . . .6-2. Simple average U.S. tariff on non-NAFTA imports,
1993 and 2001 306. . . . . . . . . . . . . . . . . . . . . . . . . . . . . .6-3. Average U.S. tariff preference toward Mexico:
Pre and post NAFTA 307. . . . . . . . . . . . . . . . . . . . . . . . . .6-4. Mexican share of U.S. imports by tariff preference:
1989, 1993, 2001 309. . . . . . . . . . . . . . . . . . . . . . . . . . .6-5. Mexico’s simple average tariff on imports from
the United States: 1991, 1999 310. . . . . . . . . . . . . . . . . .6-6. Mexico’s simple average tariff on non-NAFTA
imports: 1991, 1999 311. . . . . . . . . . . . . . . . . . . . . . . . . .6-7. Mexican tariff preference margin toward United States:
Pre and post NAFTA 312. . . . . . . . . . . . . . . . . . . . . . . . . .6-8. U.S. share of Mexico’s imports by tariff preferences:
1991, 1999 314. . . . . . . . . . . . . . . . . . . . . . . . . . . . . . . . .7-1. Change in welfare relative to baseline that includes
trade agreements 331. . . . . . . . . . . . . . . . . . . . . . . . . . . . .7-2. Marginal welfare impact of removing agreements
in 2001 333. . . . . . . . . . . . . . . . . . . . . . . . . . . . . . . . . . . .7-3. Baseline real gross domestic product 335. . . . . . . . . . . . . . .7-4. Baseline real imports and exports 336. . . . . . . . . . . . . . . . . .7-5. Benchmark quantity indices for real income and trade 337. .7-6. Change in aggregate imports relative to baseline 338. . . . . .8-1. U.S. import sources per SIC4 commodity 345. . . . . . . . . . .C-1. Production in the USITC model C-5. . . . . . . . . . . . . . . . . . .C-2. Product and commodity structure C-6. . . . . . . . . . . . . . . . . .

OMB No.: 3117--0188
08/03
ITC READER SATISFACTION SURVEYThe Impact of Trade Agreements: Effect of the Tokyo Round, U.S.-Israel FTA,
U.S.-Canada FTA, NAFTA, and the Uruguay Round on the U.S. Economy
The U.S. International Trade Commission (USITC) is interested in your voluntary com-ments (burden less than 10 minutes) to help assess the value and quality of our reports, and to assistin improving future products. Please return survey by facsimile (202-205-2340) or by mail to theUSITC, or visit the USITC Internet home page(http://reportweb.usitc.gov/reader_survey/readersurvey.html) to electronically submit a Web version ofthe survey.
(Please print; responses below not for attribution):
Your name and title:
Organization (if applicable):
Which format is most useful to you? - CD-ROM - Hardcopy - USITC Internet site
Circle your assessment of each factor below: SA = strongly agree, A = agree, N = no opinion,D = disagree, or SD = strongly disagree.
Value of this report:" Statistical data are useful SA A N D SD. . . . . . . . . . . . . . . . . . . . . . . . . . . . . ." Other non-numerical facts are useful SA A N D SD. . . . . . . . . . . . . . . . . . ." Analysis augments statistical data/other facts SA A N D SD. . . . . . . . . . . ." Relevant topic(s)/subject matter SA A N D SD. . . . . . . . . . . . . . . . . . . . . . . ." Primary or leading source of information on this subject SA A N D SD. .
Quality of this report:" Clearly written SA A N D SD. . . . . . . . . . . . . . . . . . . . . . . . . . . . . . . . . . . . . . ." Key issues are addressed SA A N D SD. . . . . . . . . . . . . . . . . . . . . . . . . . . . . . ." Charts and graphs aid understanding SA A N D SD. . . . . . . . . . . . . . . . . . ." References cite pertinent sources SA A N D SD. . . . . . . . . . . . . . . . . . . . . . .
Other preferred source of information on this subject:
Specify chapters, sections, or topics in report that are most useful:
Identify any type of additional information that should have been included in report:
Suggestions for improving report:
Please update your mailing and electronic addresses below (voluntary)-
Mailing address:
City, state, and zip code:
E-mail address:

UNITED STATESINTERNATIONAL TRADE COMMISSION
WASHINGTON, DC 20436
OFFICIAL BUSINESSPENALTY FOR PRIVATE, USE $300
FOLD
NO POSTAGENECESSARY
IF MAILEDIN THE
UNITED STATES
BUSINESS REPLY MAILFIRST CLASS PERMIT NO. 12840 WASHINGTON, DC
POSTAGE WILL BE PAID BY ADDRESSEE
U.S INTERNATIONAL TRADE COMMISSION500 E STREET, SW.WASHINGTON, DC 20277--2840
ATTN:OFFICE OF ECONOMICSThe Impact of Trade Agreements: Effect of theTokyo Round, U.S.-Israel FTA, U.S.-Canada FTA,NAFTA, and the Uruguay Round on theU.S. Economy
xxi
Executive Summary
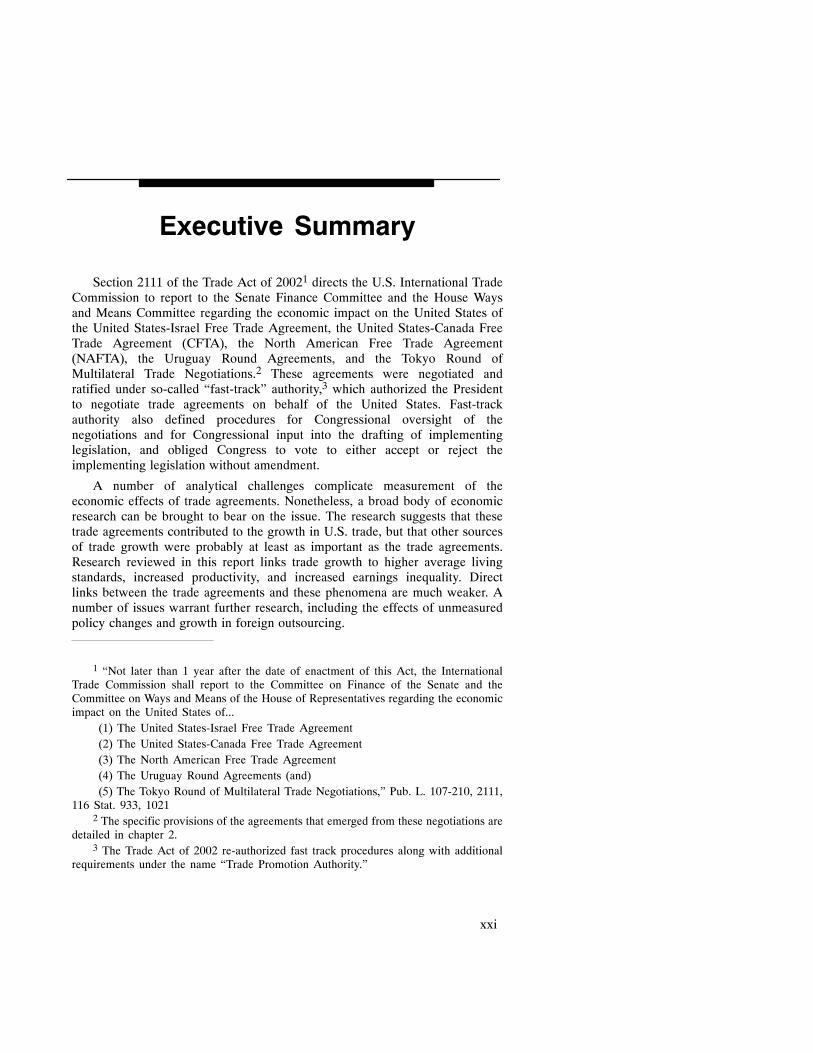
Section 2111 of the Trade Act of 20021 directs the U.S. International TradeCommission to report to the Senate Finance Committee and the House Waysand Means Committee regarding the economic impact on the United States ofthe United States-Israel Free Trade Agreement, the United States-Canada FreeTrade Agreement (CFTA), the North American Free Trade Agreement(NAFTA), the Uruguay Round Agreements, and the Tokyo Round ofMultilateral Trade Negotiations.2 These agreements were negotiated andratified under so-called “fast-track” authority,3 which authorized the Presidentto negotiate trade agreements on behalf of the United States. Fast-trackauthority also defined procedures for Congressional oversight of thenegotiations and for Congressional input into the drafting of implementinglegislation, and obliged Congress to vote to either accept or reject theimplementing legislation without amendment.
A number of analytical challenges complicate measurement of theeconomic effects of trade agreements. Nonetheless, a broad body of economicresearch can be brought to bear on the issue. The research suggests that thesetrade agreements contributed to the growth in U.S. trade, but that other sourcesof trade growth were probably at least as important as the trade agreements.Research reviewed in this report links trade growth to higher average livingstandards, increased productivity, and increased earnings inequality. Directlinks between the trade agreements and these phenomena are much weaker. Anumber of issues warrant further research, including the effects of unmeasuredpolicy changes and growth in foreign outsourcing.
1 “Not later than 1 year after the date of enactment of this Act, the InternationalTrade Commission shall report to the Committee on Finance of the Senate and theCommittee on Ways and Means of the House of Representatives regarding the economicimpact on the United States of...
(1) The United States-Israel Free Trade Agreement(2) The United States-Canada Free Trade Agreement(3) The North American Free Trade Agreement(4) The Uruguay Round Agreements (and)(5) The Tokyo Round of Multilateral Trade Negotiations,” Pub. L. 107-210, 2111,
116 Stat. 933, 10212 The specific provisions of the agreements that emerged from these negotiations are
detailed in chapter 2.3 The Trade Act of 2002 re-authorized fast track procedures along with additional
requirements under the name “Trade Promotion Authority.”
xxii
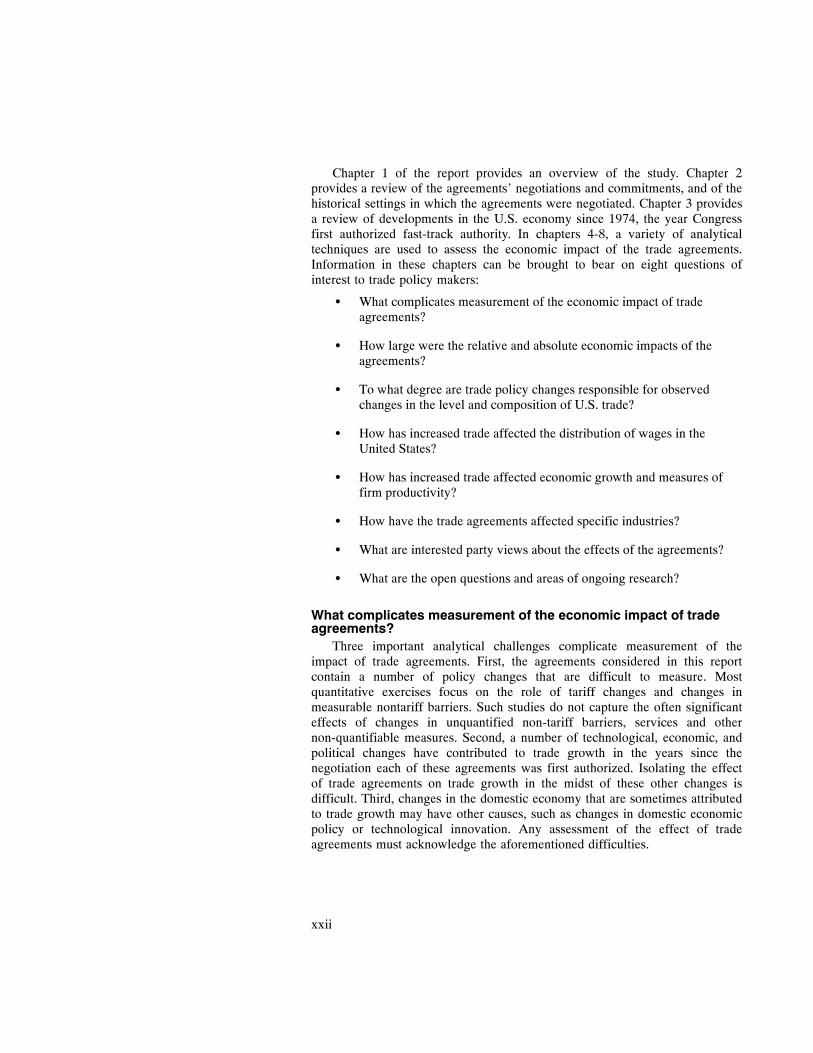
Chapter 1 of the report provides an overview of the study. Chapter 2provides a review of the agreements’ negotiations and commitments, and of thehistorical settings in which the agreements were negotiated. Chapter 3 providesa review of developments in the U.S. economy since 1974, the year Congressfirst authorized fast-track authority. In chapters 4-8, a variety of analyticaltechniques are used to assess the economic impact of the trade agreements.Information in these chapters can be brought to bear on eight questions ofinterest to trade policy makers:
S What complicates measurement of the economic impact of tradeagreements?
S How large were the relative and absolute economic impacts of theagreements?
S To what degree are trade policy changes responsible for observedchanges in the level and composition of U.S. trade?
S How has increased trade affected the distribution of wages in theUnited States?
S How has increased trade affected economic growth and measures offirm productivity?
S How have the trade agreements affected specific industries?
S What are interested party views about the effects of the agreements?
S What are the open questions and areas of ongoing research?
What complicates measurement of the economic impact of tradeagreements?
Three important analytical challenges complicate measurement of theimpact of trade agreements. First, the agreements considered in this reportcontain a number of policy changes that are difficult to measure. Mostquantitative exercises focus on the role of tariff changes and changes inmeasurable nontariff barriers. Such studies do not capture the often significanteffects of changes in unquantified non-tariff barriers, services and othernon-quantifiable measures. Second, a number of technological, economic, andpolitical changes have contributed to trade growth in the years since thenegotiation each of these agreements was first authorized. Isolating the effectof trade agreements on trade growth in the midst of these other changes isdifficult. Third, changes in the domestic economy that are sometimes attributedto trade growth may have other causes, such as changes in domestic economicpolicy or technological innovation. Any assessment of the effect of tradeagreements must acknowledge the aforementioned difficulties.
xxiii
An important feature of the trade agreements considered in this report isthat they obliged the signatories to undertake significant policy changes inaddition to tariff reduction. Nontariff policy changes included the removal ofquantitative restrictions on trade, harmonization of customs procedures,agreements on scientific standards and other technical barriers to trade,disciplines on future trade policy, agreements on domestic and trade-relatedpolicies such as subsidies and government procurement, and agreements ontrade-related investment measures and trade-related intellectual property rights.Measurement difficulties preclude quantitative assessments of theeconomywide impact of these policies. Consequently, most quantitativeexercises will likely understate the economic effects of the five agreements.Chapter 5 identifies the sectors in which unquantified policy changes wereimportant.
The agreements were not the only source of growing U.S. trade. A numberof countries, including China, India, and Mexico, undertook significantunilateral economic reforms that led to greater participation in world markets.New transportation and communication technologies also facilitated trade.Growing incomes in the United States and in the rest of the world were anothersource of trade growth.
Growing trade was not the only source of significant U.S. economicchange, and it is difficult to isolate the effects of trade growth from domesticchanges. Chapter 3 reviews other significant changes to the U.S. economy, anddiscusses their relevance for measuring the effects of trade policy changes.Technological innovation, U.S. policy changes in other arenas, anddemographic changes are among the more significant issues that masked theeffects of trade policy changes.
How large were the relative and absolute economic impacts of theagreements?
Chapter 7 reports the results of a numeric simulation that imposespre-Tokyo Round trade barriers on an economic model of the United States.The model provides a consistent framework for evaluating the economy-wideeffects of the measurable trade policy changes associated with the respectiveagreements. The primary value of the simulation is that it provides a succinctdescription of the agreements’ relative economic impact; the agreements aremeasured by their effect on economic welfare.4
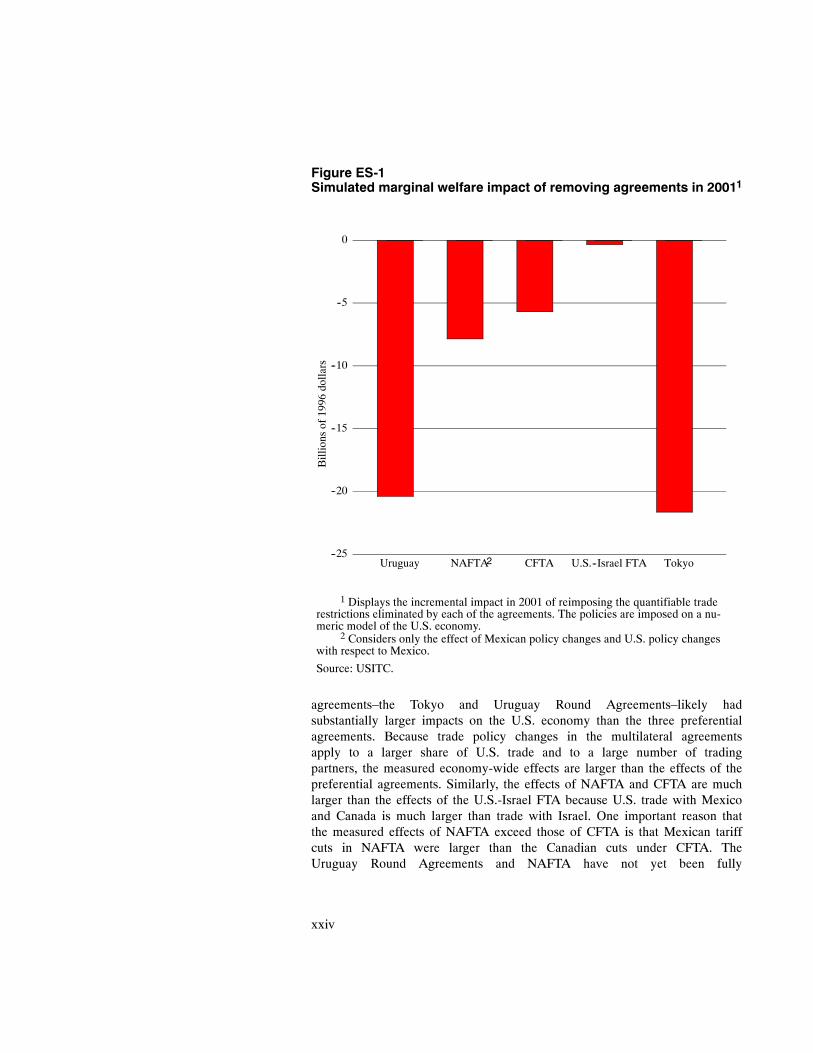
Figure ES-1 shows the incremental impact in 2001 of reimposing thequantifiable trade restrictions (tariffs and quantified non-tariff barriers only)eliminated by each of the trade agreements. The multilateral
4 Welfare is a comprehensive measure that represents the income loss to U.S.citizens that would be equivalent to the economic impact of removing the agreements.Welfare is a net measure that includes all the positive and negative impacts of tradepolicy changes. This is not to say that specific measures presented are precise.Including other features in the model, such as scale economies or adjustment frictions,would affect the estimated welfare impact of removing the agreements.
xxiv
Figure ES-1Simulated marginal welfare impact of removing agreements in 20011
--25
--20
--15
--10
--5
0
Uruguay NAFTA CFTA U.S.--Israel FTA Tokyo
Billionsof1996
dollars
1 Displays the incremental impact in 2001 of reimposing the quantifiable traderestrictions eliminated by each of the agreements. The policies are imposed on a nu-meric model of the U.S. economy.
2 Considers only the effect of Mexican policy changes and U.S. policy changeswith respect to Mexico.
Source: USITC.
2
agreements–the Tokyo and Uruguay Round Agreements–likely hadsubstantially larger impacts on the U.S. economy than the three preferentialagreements. Because trade policy changes in the multilateral agreementsapply to a larger share of U.S. trade and to a large number of tradingpartners, the measured economy-wide effects are larger than the effects of thepreferential agreements. Similarly, the effects of NAFTA and CFTA are muchlarger than the effects of the U.S.-Israel FTA because U.S. trade with Mexicoand Canada is much larger than trade with Israel. One important reason thatthe measured effects of NAFTA exceed those of CFTA is that Mexican tariffcuts in NAFTA were larger than the Canadian cuts under CFTA. TheUruguay Round Agreements and NAFTA have not yet been fully
xxv
implemented, so the economic impact of these agreements is likely to besomewhat larger in the future.
Although model results are best understood as measures of the agreements’relative impacts, they may also be used as estimates of the economic effects ofthe quantifiable policy changes in the agreements. The model relies onparticular assumptions about underlying economic behavior in the UnitedStates economy. The assumptions in the model used here are conventional, andthe results are best understood as a conservative estimate of the effects of theagreements. Under the assumptions of the model, U.S. economic welfare in2001 would have been $56 billion5 lower (approximately 0.6 percent of U.S.gross domestic product (GDP)) if the measurable trade barriers (e.g., tariffs)eliminated by the trade agreements were reimposed.
To what degree are trade policy changes responsible for observedchanges in the level and composition of U.S. trade?
Between 1974 and 2001, the value of U.S. exports and imports grew from$0.5 trillion to $2.5 trillion. Trade agreements were one of many factors thatcontributed to trade growth. Estimates of the direct effect of trade policychanges on trade growth attribute 15 to 25 percent of the historical increase inU.S. trade across all sectors to tariff reductions. These estimates encompasseconometric estimates from the literature6 and the Commission’s simulationresults in chapter 7. Chapter 8 notes that trade agreements may also increasethe variety of traded goods as well as the volume of trade.
Other methods that attempt to assess indirect channels through which tradeagreements may affect trade yield higher estimates of the share of historicaltrade growth explained directly or indirectly by liberalization. These indirectchannels include outsourcing7 and scale economies in shipping.8 As discussedin chapter 6, trade agreements may also increase trade by reducing uncertaintyabout future trade policy. Though widely recognized, the role of reduceduncertainty about future trade policy in increased trade is difficult to quantifydirectly.
Preferential trading arrangements appear to have had a significant impacton the pattern of U.S. trade. Chapter 6 finds that the tariff cuts associated with
5 All dollar figures are inflation adjusted, and reported in 1996 dollars.6 Scott L. Baier and Jeffrey H. Bergstrand, 2001, “The Growth in World Trade:
Tariffs, Transport Costs, and Income Similarity”, Journal of International Economics,vol. 53, pp 1-27.
7 Kei-Mu Yi, “Can Vertical Specialization Explain the Growth in World Trade?”forthcoming in Journal of Political Economy. Draft available athttp://www.newyorkfed.org/rmaghome/economist/yi/pubs.html, downloaded March 20,2003. Using a model that links tariff reductions and foreign outsourcing, Yi estimatesthat as much as 53 percent of historic U.S. trade growth may be due to tariff reductions.
8 David Hummels and Alexandre Skiba, “A Virtuous Circle? Regional TariffLiberalization and Scale Economies in Transport,” 2002, forthcoming in FTAA andBeyond: Prospects for Integration in the Americas, Inter-American Development Bank.
xxvi
NAFTA explained approximately 1/3 of the growth in the Mexican share ofU.S. imports from 1990-2001. Chapter 6 also finds that the average U.S.share of Mexican imports also rose as a result of NAFTA, but the effects ofNAFTA were offset by the devaluation of the peso against the dollar.
How has increased trade affected the distribution of wages in theUnited States?
A widely noted phenomenon of the last two decades has been theincreasing gap between wages paid to college-educated workers and wagespaid to workers with a high school diploma. Evidence reviewed in chapter 3indicates that workers with a college degree earned 57 percent more than highschool graduates in 1975 and 111 percent more in 1999. The wage distributionacross other measures of skill also increased over the period. In manufacturing,earnings of nonproduction workers were 53 percent higher than earnings ofproduction workers in 1977 and 78 percent higher in 2000.
A large literature based on a standard trade modeling framework indicatesthat approximately 10 to 20 percent of the growth in the skilled wage premiumover the last two decades can be attributed to international trade. These studiesusually attribute most of the growing skill premium to technological change.Other, more controversial estimates attribute a larger share of the growth in theskill premium to international trade. One innovative contribution estimates that40 percent of the growth in the wage premium may be attributable to acombination of international trade and foreign outsourcing.9
Most studies of the wage distribution evaluate the impact of increasedtrade, not the effects of trade policy changes. Other sources of trade growth,particularly developing country entry into world markets, may have been moreimportant than trade policy changes in increasing the wage gap between skilledand unskilled workers. One study reviewed in chapter 4 finds no statisticallysignificant effects of tariff reductions or falling transportation costs on wageinequality.10 In this study, falling prices of labor intensive imports appear tohave been much more important than tariff reductions.
How has increased trade affected economic growth and measuresof firm productivity?
Productivity growth is a key determinant of a country’s long-term standardof living. As chapter 3 notes, inflation-adjusted U.S. per capita GDP rose from$19,163 to $32,352 between 1974 and 2001. During that period, private sectorlabor productivity rose by 69 percent. Labor productivity in manufacturing wasup 132 percent over the same period. Chapter 3 reviews a number of
9 Robert C. Feenstra and Gordon H. Hanson, “The Impact of Outsourcing and HighTechnology Capital on Wages: Estimates for the United States, 1979-1990,” QuarterlyJournal of Economics, vol. 114, No. 3, August 1999, pp. 907-940.
10 Jonathan E. Haskel and Matthew J. Slaughter, “Have Falling Tariffs andTransportation Costs Raised U.S. Wage Inequality?” Review of International Economics,forthcoming September 2003.
xxvii
developments in the U.S. economy that might have contributed to laborproductivity growth, including technological change, an increasingly educatedwork force, and higher rates of capital investment. Chapter 4 reviewsliterature investigating the possibility that increased trade and/or reduction intrade barriers contribute to productivity growth.
Cross-country studies of trade and economic growth ask if countries withlower trade barriers or more trade experience faster economic growth thancountries with high trade barriers or less trade. In 1997, the Commissiondetermined that the cross-country evidence linking trade and economic growthwas mixed.11 Subsequent studies have found positive links between more opentrade policies and economic growth.12 Critics argue that the link between tradepolicy and economic growth is still unproven.13
A nascent body of literature uses firm level data to consider the effects oftrade and trade policy changes on firm behavior. Evidence from U.S. datasuggests that more productive firms tend to become exporters. Evidence thatbecoming an exporter causes a firm to become more productive is mixed. Theavailable evidence suggests that firms become more productive in the yearsprior to exporting, and in the initial year of exporting. There is little conclusiveevidence that becoming an exporter raises a firm’s long-term rate ofproductivity growth.14 A subsequent study of U.S. data finds that industrieswith larger reductions in trade costs (tariffs and transportation costs)experienced faster productivity growth.15 Studies using developing countrydata have found that industries competing most directly with importsexperience the largest productivity increases after liberalization,16 but there arenot yet any studies of U.S. firm level data on this topic.
11 U.S. International Trade Commission, The Dynamic Effects of TradeLiberalization: an Empirical Analysis, Publication No. 3069, 1997.
12 Richard E. Baldwin and Elena Seghezza, “Testing for Trade-InducedInvestment-Led Growth,” National Bureau of Economic Research Working Paper No.5416, 1996.
13 Francisco Rodriguez and Dani Rodrik, “Trade Policy and Economic Growth: ASkeptic’s Guide to the Cross-National Evidence,” National Bureau of EconomicResearch Working Paper No. 7081, 1999.
14 Andrew Bernard and J. Bradford Jensen, “Exceptional Exporter Performance:Cause, Effects, or Both?” Journal of International Economics, vol. 47, 1999, pp. 1-25.
15 Andrew Bernard, J. Bradford Jensen, and Peter K. Schott, “Falling Trade Costs,Heterogenous Firms and Industry Dynamics,” National Bureau of Economic ResearchWorking Paper No. 9639, April 2003.
16 See, for example, Nina Pavcnik, “Trade Liberalization, Exit and ProductivityImprovements: Evidence from Chilean Plants,” Review of Economic Studies, vol. 69,2002, pp. 245-76.
xxviii
How have the trade agreements affected specific industries?Economic theory suggests that increased trade changes the composition of
domestic output. All else equal, trade agreements should cause exportingsectors’ share of output to increase, and import-competing sectors’ share ofoutput to decrease. Changes in industry shares of domestic output also havecauses unrelated to trade agreements. The report takes two approaches toisolating the effects of trade policy on industry level output.
Chapter 5 examines the historical experiences of 10 sectors of theeconomy. Most sectors experienced considerable changes not directly related totrade policy, and the effects of the trade agreements on sectoral output weregenerally considered to be small, relative to other factors. Several sectorswitnessed substantial growth in multistage international production processes,though it is unclear how important the agreements have been in fostering thesechanges. Two sectors–textiles and apparel, and metal and metal products–weremost notably affected by increased competition from international markets,though the agreements were not the only reason for increased importcompetition.
Econometric analysis in chapter 6 identifies ex post statistical relationshipsbetween tariff changes in NAFTA and sectoral trade between the United Statesand Mexico. The study finds that the Mexican share of U.S. imports went upmost in those sectors in which the U.S. tariff preference for Mexican goodswas largest. Estimates suggest that a 1 percent change in the U.S. tariffpreference given Mexican imports under NAFTA led to a 4.5 percent increasein Mexico’s share of U.S. imports. The effect was even stronger in somesectors, such as textiles and apparel, where larger preferences were given andwhere non-tariff barriers were also removed. The econometric study also findsthat the U.S. share of Mexican imports rose most in those sectors where theMexican tariff preference toward U.S. goods was largest, specifically footwear,miscellaneous manufactures, and textiles and apparel.
What are interested party views about the effects of theagreements?
The Commission received input from 22 interested parties on the effects ofthe trade agreements in question through statements made in a public hearingand submissions of written comments.17 Interested parties included laborunions, industry associations, and an employee of a public policy researchorganization. Many offered specific views about the contents of specificagreements. Most attention was paid to the most recent agreements – theUruguay Round Agreements and NAFTA.
The interested parties that viewed the effects of the trade agreementsfavorably included associations of exporting firms, firms in industries withinternationally integrated production processes, organizations supportingstronger international protection of intellectual property rights, and the
17 The views of interested parties are summarized in appendix F.
xxix
representative of a policy research organization. Supporters of the agreementsargued that the agreements had allowed them greater access to foreignmarkets, improved U.S. competitiveness, and protected intellectual propertydeveloped in the United States. Industry associations supporting theagreements included representatives of electrical manufacturers,research-based pharmaceutical manufacturers, and almond growers, as well asa representative of manufacturers as a whole. Some groups, including dairyproducers, ranchers and cattlemen, forest and paper products, the scheduledairline industry and generic pharmaceuticals producers, expressed support forparticular agreements, and qualified support, if any, for other agreements. Insome cases, industry associations that generally supported the agreementsargued that one agreement or another had not sufficiently reduced foreigncountry trade barriers.
Those that viewed the effects of the agreements negatively included afederation of labor unions and industry associations from import-competingsectors. Industry associations associated with the citrus, tomato, tuna, steel,ceramic tile, brushmaking, restaurant china, and non-woven fabric sectorsstated that the market share of domestic producers had fallen owing tocompetition with low-priced imports. The representative of organized laborstated that the agreements had contributed to job loss, especially inmanufacturing, as well as lower wages for its workers. An association ofcopper producers noted that low-priced copper imports had been detrimental tothe domestic copper industry, but that the agreements had also lowered the costof industry inputs. Other factors, including U.S. environmental regulation andantitrust law, were considered to have had more significant effects on thecopper industry than the trade agreements.
What are the open questions and areas of ongoing research?
Difficulties in quantifying non-tariff measures complicate efforts tomeasure the impact of the agreements. Efforts to quantify non-tariff measuresshould be a priority, as more recent trade agreements have obliged the partiesto undertake significant policy changes of the kind that are difficult to quantify.Ongoing research at the Commission is attempting to quantify specificnontariff measures.
The relationship between trade agreements and the growth of foreignoutsourcing has received increasing attention in public policy discussions andin academic research. Theoretic models that allow tariff reductions to induceforeign outsourcing of low-skilled activities attribute greater increases inwelfare and productivity growth to tariff reductions than do standardinternational trade models. These models also suggest that foreign outsourcingmagnifies the effect of trade agreements on earnings inequality. The relativeimportance of trade policy and other factors in facilitating foreign outsourcingis still unclear.
Relatively little research has explored the effects on the United States ofunilateral economic reforms in developing countries. Substantial reforms in
xxx
countries that became significant U.S. trading partners are a plausiblealternative explanation for many of the trade-related phenomena observed inrecent years. A better understanding of how these reforms affected both theUnited States and these countries is needed. Recent research indicates thatindustries competing most directly with imports from poor countriesexperienced slower employment growth and higher rates of plant closure thanother industries.18
Studies of firm-level data are relatively new in the international tradeliterature. Most studies use industry-level data to investigate the effects oftrade, and overlook important differences in how firms within an industryrespond to economic change. A number of studies reviewed in chapter 4 usefirm-level data to measure the effects of trade policy changes. Many of thesestudies use firm-level data from developing countries to identify effects oftrade policy on firm behavior. While some research linking trade to U.S.firm-level data has been done, further research on U.S. firm-level responses totrade policy changes would be useful.
18 Andrew Bernard, J. Bradford Jensen, and Peter K. Schott, “Survival of the BestFit: Exposure to Low-Wage Countries and the (Uneven) Growth of U.S. ManufacturingPlants,” April 2003, manuscript. Available at internet addresshttp://www.som.yale.edu/Faculty/pks4/files/research/papers/emptvs_66.pdf.
1
CHAPTER 1:Introduction
This report has been prepared in response to a requirement of the TradeAct of 2002 (19 U.S.C. 3811), enacted on August 6, 2002.1 Section 2111 ofthat Act requires the International Trade Commission to report to the SenateFinance Committee and the House Ways and Means Committee regarding theeconomic impact on the United States of the following trade agreements: theTokyo Round of Multilateral Trade Negotiations, the United States-Israel FreeTrade Agreement, the United States-Canada Free Trade Agreement, the NorthAmerican Free Trade Agreement, and the Uruguay Round Agreements.
Scope of the StudyAs posed in the legislation, the issue to be addressed here is both simple
and broad–to describe the economic impact on the United States of five majortrade agreements implemented over the past 25 years. The five agreements,which include the last two major multilateral agreements negotiated under theGeneral Agreement on Tariffs and Trade (GATT) as well as three preferentialtrade agreements, account for much of the trade liberalization that has occurredover the past quarter century.2 An analysis of the effects of the policiesimplemented under the agreements is nearly equivalent to an analysis of theeffects of trade liberalization in general on the United States over the period. Insome cases the discussion in this report is framed in terms of the effects oftrade agreements in general rather than the effects of the five agreementsspecified in section 2111 of the Trade Act of 2002. To the extent possible,however, the analysis is restricted to the effects of the five agreements. Toassess the economic impact from the five trade agreements is a challengingtask. It requires the isolation of the impact of trade agreements from thosecaused by an array of other trade policy events, changes in exchange rates,international conflicts, and demographic and technical change. In addition,most of the five agreements themselves had long and overlappingimplementation phase-in periods (especially NAFTA and the Uruguay Round),further complicating the problem of observing their effects individually. Toprovide a reasonably complete and comprehensive description of the economicimpact of these agreements requires the use of a variety of analytical tools.
1 Pub. L. 107-210, 116 Stat. 933.2 The major trade liberalization in this period that was not directly a part of one of
the five agreements was the accession of China to the World Trade Organization (WTO),bringing that country within the scope of the world trading system.
2
The agreements implement changes in tariffs, quotas, investment policies,and other policies that have had direct effects on imports and exports, as wellas indirect effects on production and productivity, employment and earnings,and measures of general economic welfare. At some points in the currentanalysis, the Commission focuses on ways in which trade policy, as reflected inthe agreements, affects trade directly through influencing the international flowof goods and services. By changing tariffs, quotas, and other policyinstruments, the agreements generally reduce the relative prices at whichproducts are traded internationally, thereby directly increasing trade flows.These changes then influence the output of these products, the location of theirproduction and consumption, and the productivity and earnings of labor andcapital engaged in that production. Indirect effects of trade policy areanalytically much more difficult to quantify. At many points in the analysiscontained in this report, the focus shifts from an emphasis on the effects oftrade policy on trade flows to an emphasis on the effects of trade flows onthese other important variables.
Approach of the StudyThe Commission has employed multiple approaches to assess the effects on
the U.S. economy of trade policy as implemented through the five specifiedtrade agreements signed since 1979. As the primary approach, the Commissionhas relied on a review of literature to provide an assessment of the directeffects of trade agreements and trade policy on trade. An assessment throughthe economic literature is central to the analytical content of this report. For anadditional perspective, industry research provides a basis to analyze effects ontrade for specific industry sectors in the U.S. economy. The industry researchdescribes trends in trade flows, industry output and employment, andconsumption since 1978 and ties this description to an assessment of the effectsof the trade agreements on the specific industries. Following the industryanalysis, the Commission employs econometric and simulation models toexamine specific policy-trade linkages. The first econometric analysis, inchapter 6, presents evidence on how a specific policy agreement (NAFTA)affects U.S. trade with a trading partner that receives preferential treatmentunder that agreement (Mexico). The simulation model in chapter 7 provides,among other things, a model of the effects of trade liberalization agreements ontrade flows, and the indirect effects on output and the allocation of capital andlabor to production in the aggregate. The model is unique in its use of a singlemethodologically consistent framework and an original database to look at theeffects of all five agreements. Finally, the analysis in chapter 8 examines theways in which tariff reductions have induced growth in the number of U.S.import sources for each product.
A public hearing was held in connection with this investigation on January14, 2003. Interested parties presented their views on the subject tradeagreements at this hearing and in written statements submitted in response to
3
announcements that appeared in the Federal Register. A summary of theseviews is given in appendix F to this report.
Organization of the ReportChapter 2 presents historical background on the five trade agreements
themselves, with the principal issues involved in their negotiation andimplementation, which serves to define the policy instruments used to makechanges to trade flows and, ultimately, to the domestic economy. Broadlyspeaking, these policy instruments include tariff reductions and liberalization ofnontariff measures, as well as subsidiary issues such as the treatment ofcustoms procedures, phytosanitary restrictions, and intellectual propertyprotections.
The Tokyo Round was the first round of multilateral trade negotiations tomove beyond tariff reductions as a major part of the agreement.3 A majorobjective of the round was to address various nontariff measures of tradeprotection that had become relatively (and absolutely) more important barriersto trade in the wake of earlier tariff reductions. The Trade Act of 1974, whichincluded negotiating authority and fast-track procedures, was passed to addressthese concerns. Fast-track authority lasted until 1980 under this legislation andwas renewed in 1979 for a further 8 years,4 and was renewed again in theOmnibus Trade and Competitiveness Act of 1988 signed by President Reaganto permit negotiation of the Uruguay Round of GATT.5 The authority for fasttrack was set to expire in 1993, but legislation extended it through April 16,1994, to allow for negotiation not only of the Uruguay Round but also of theNorth American Free Trade Agreement. Fast-track authority expired on the setdate in April 1994 and was not reauthorized until the passage of the Trade Actof 2002, at which point it was renamed Trade Promotion Authority.
Chapter 3 provides background on the development of the U.S. economyover the past 25 years, and chapter 5 extends into an analysis of thedevelopment of industry sectors in the economy. Where chapter 2 reviews tradepolicy instruments of economic change, chapter 3 looks at some of the objectsof this change–trends in gross domestic product (GDP) growth, employment,capital growth, and productivity. The chapter also describes other phenomenathat have developed since 1979, including population growth and technologicalprogress, phenomena that account for much of the growth in trade, output, andemployment.
3 See chapter 2 of this report for a more complete discussion of the history of U.S.trade agreements.
4 Trade Agreements Act of 1979, Pub. L. No. 96-39, 93 Stat. 144.5 Pub. L. No. 100-148.
4
Trade has grown enormously over the decades since implementation of theTokyo Round. Trade in goods and services, calculated as imports plus exportsand measured in constant 1996 dollars, has grown from $0.5 trillion in 1974 to$2.5 trillion in 2001. Figure 1-1 provides an index of the relative growth oftrade and GDP since 1978, the year before the signing of the Tokyo RoundAgreements. In that time, GDP has approximately doubled, while trade hasgrown by a factor of four. The principal argument of chapter 3 is that much, ormost, of the growth of the economy is owing to factors other than trade, andfurthermore that growth in trade itself can be attributed to factors other thantrade agreements and trade policy.
Chapter 4 of this report is a survey of economic literature addressingeffects of trade and trade policy on economic outcomes. Because the types ofeffects are so varied, and the impacts of trade policy are in many cases sodifficult to identify, the survey was prepared as an attempt to ascertain thefindings of the economics profession at large and to provide these findings asthe key part of the overall answers to the questions addressed in the currentreport.
The work reported in chapter 4 follows a number of threads because tradepolicy over time has proceeded in a number of different directions, havingincluded bilateral and multilateral agreements, an increasing focus on nontariffmeasures, agricultural trade harmonization, and agreements on investmentmeasures and services trade. Trade growth also has been far from uniform.Trade with some countries (such as Mexico and China) has grown much morerapidly than with others, and under very different circumstances. In particular,the tremendous growth in trade with China has taken place outside the scope ofthe five trade agreements that are the focus of this report. Trade in differentproducts (textiles and apparel, electronics, services) has likewise grown at verydifferent rates. In combination with trends in technology, productivity, anddemography, both in the United States and the rest of the world, these tradedevelopments contribute to changes in employment and the distribution ofearnings and to industrial restructuring. All of these linkages need to beexplored to gain an understanding of the effects of trade policy on the economyof the United States. In particular, much of the story on income andemployment redistribution, industrial restructuring, and the realization andexploitation of productivity growth can be told at the level of specific industrialsectors.
Chapter 5 provides this perspective, examining factors that have affectedoutput, employment, and productivity trends in all U.S. industry sectors during1978-2001. These factors include domestic and foreign competitive conditions,macroeconomic factors, technological innovation, changes in industry structure,and government regulations. It describes the effect of the five trade agreements
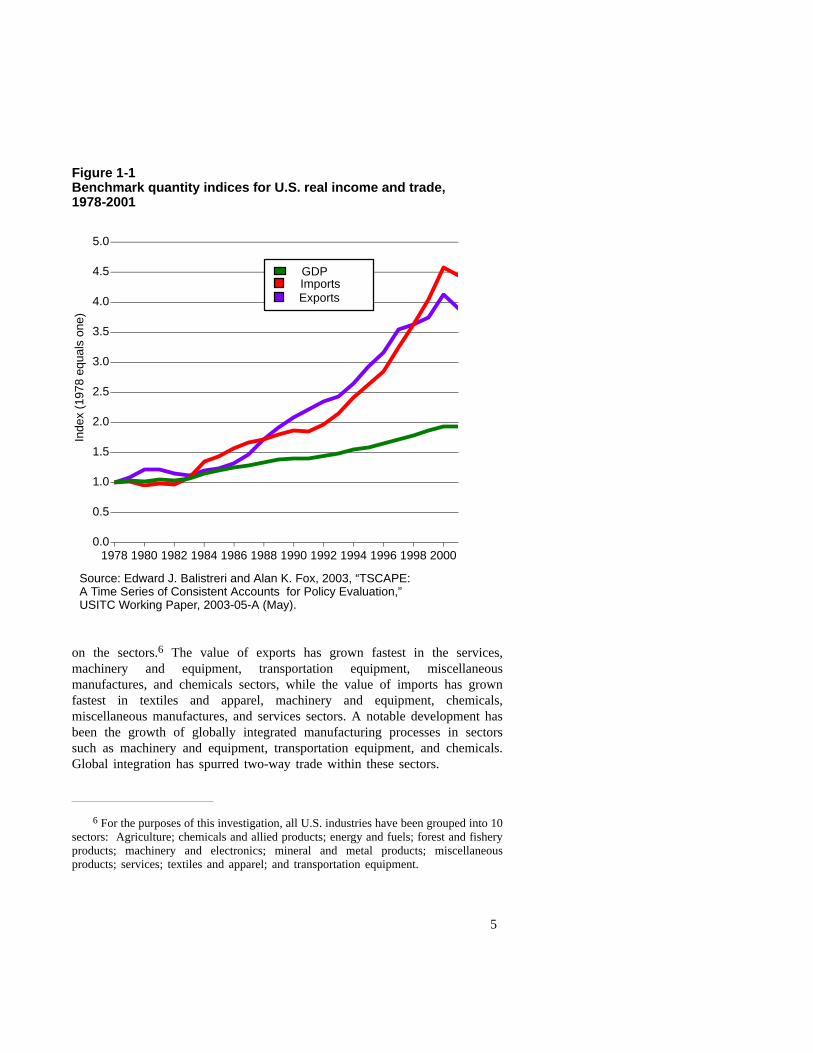
5
Figure 1-1Benchmark quantity indices for U.S. real income and trade,1978-2001
0.0
0.5
1.0
1.5
2.0
2.5
3.0
3.5
4.0
4.5
5.0
1978 1980 1982 1984 1986 1988 1990 1992 1994 1996 1998 2000
Source: Edward J. Balistreri and Alan K. Fox, 2003, “TSCAPE:A Time Series of Consistent Accounts for Policy Evaluation,”USITC Working Paper, 2003-05-A (May).
Inde
x(1
978
equa
lson
e)
GDPImportsExports
on the sectors.6 The value of exports has grown fastest in the services,machinery and equipment, transportation equipment, miscellaneousmanufactures, and chemicals sectors, while the value of imports has grownfastest in textiles and apparel, machinery and equipment, chemicals,miscellaneous manufactures, and services sectors. A notable development hasbeen the growth of globally integrated manufacturing processes in sectorssuch as machinery and equipment, transportation equipment, and chemicals.Global integration has spurred two-way trade within these sectors.
6 For the purposes of this investigation, all U.S. industries have been grouped into 10sectors: Agriculture; chemicals and allied products; energy and fuels; forest and fisheryproducts; machinery and electronics; mineral and metal products; miscellaneousproducts; services; textiles and apparel; and transportation equipment.
6
The literature review in chapter 4 reveals a number of areas in whichunderstanding of the effects of trade policy is incomplete. The remainingchapters of the report attempt to fill some of the remaining gaps in thatunderstanding. Chapter 6 contains original empirical analysis of the extent towhich preferential trade policy changes, such as those implemented in NAFTAand in the U.S.-Israel and U.S.-Canada Free Trade Agreements, actuallyincrease the import market shares of the beneficiaries to the agreement, whichis a question central to research on the responsiveness of bilateral trade flowsto trade policy changes.
Chapter 7 describes the results of using an original model and data baseconsistent with standard economic and trade theory, applied uniformly to thefive agreements, to simulate the effects of the trade agreements on the U.S.economy. The model is methodologically similar to general equilibrium modelsthat have frequently been used to simulate effects of proposed tradeagreements. In the present context the model provides analyses of theindividual and cumulative effects of the agreements.
Finally, chapter 8 considers how liberalization of trade policy increases thevariety of trade that takes place, where “variety” can mean the import of tradedproducts from new sources, or the import of new or previously untradedproducts. Much empirical trade analysis relies on an assumed ability todistinguish goods, especially goods from different trading partners, in thedepiction of trade growth and trade shifts, but most analysis is unable toaddress the question of how such goods enter the trade system. Failure toaccount for such new trade can mean that estimates of the effects of tradepolicy are otherwise understated.
7
CHAPTER 2:Negotiation of Trade Agreements
Under Trade PromotionAuthority
Legislation and Agreements ApprovedUnder Trade Promotion Authority
OverviewCongress delegates a portion of its constitutional charge to formulate and
administer trade policy to the President through trade agreement authority.1This authority permits the President to negotiate and enter into tradeagreements, whether bilateral or multilateral. Whereas the delegating authorityto negotiate tariff agreements has proved straightforward, Congress devised adifferent means to delegate authority for trade agreements involving nontariffbarriers to assure U.S. trading partners that the substantial changes to U.S. lawsand administrative practices expected from any nontariff agreement would infact come to be implemented as negotiated.
Under the Trade Act of 1974, the President was given authority for the firsttime to negotiate trade agreements involving nontariff barriers. Congressfurther agreed to expedited approval procedures to approve or disapprove–butnot to amend–bills submitted to implement the nontariff agreements negotiated.This process was known informally as “fast track authority.” Since then, thePresident has negotiated five agreements under this authority: the 1979 TokyoRound Agreements, the 1985 U.S.-Israel Free Trade Agreement, the 1988U.S.-Canada Free Trade Agreement, the 1993 North American Free TradeAgreement (NAFTA), and the 1994 Uruguay Round Agreements. Congress hassubsequently passed the implementing bills submitted to enter these nontariffagreements into U.S. law through expedited approval procedures (See figure2-1 for a timeline of events related to fast-track negotiating authority).
1 Congress also delegates some of its authority, although to a lesser extent, throughcertain statutes establishing tariff preference programs.
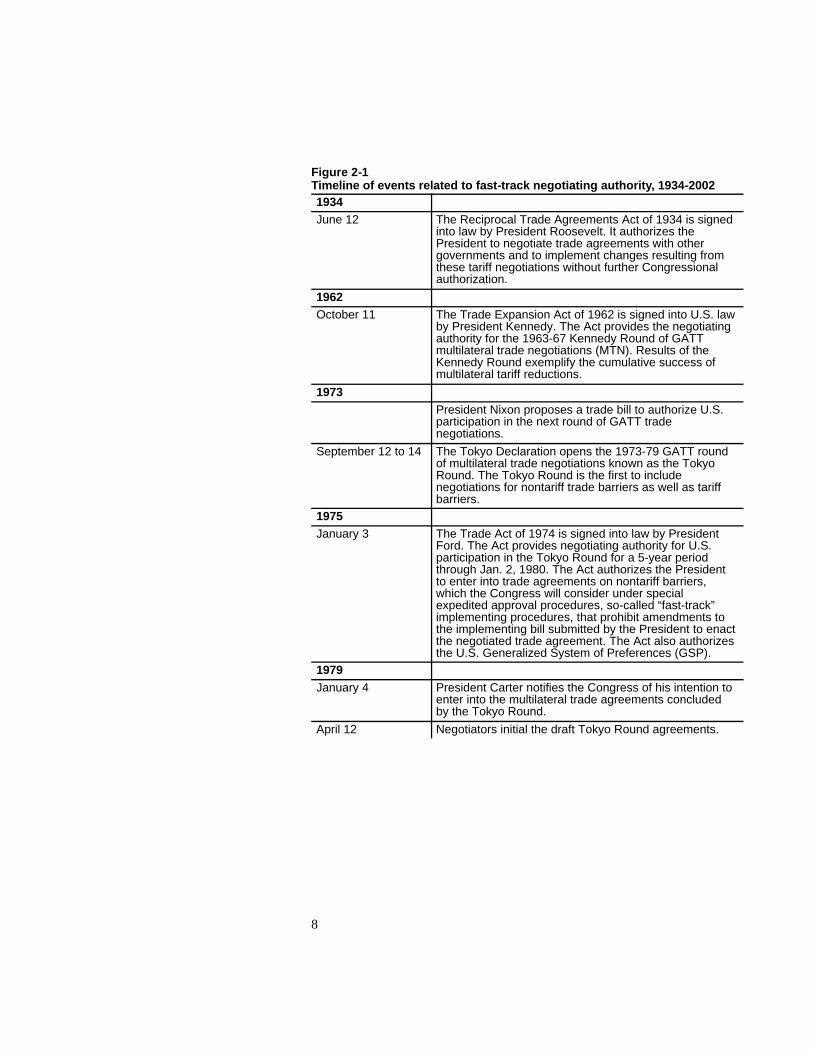
8
Figure 2-1Timeline of events related to fast-track negotiating authority, 1934-20021934June 12 The Reciprocal Trade Agreements Act of 1934 is signed
into law by President Roosevelt. It authorizes thePresident to negotiate trade agreements with othergovernments and to implement changes resulting fromthese tariff negotiations without further Congressionalauthorization.
1962October 11 The Trade Expansion Act of 1962 is signed into U.S. law
by President Kennedy. The Act provides the negotiatingauthority for the 1963-67 Kennedy Round of GATTmultilateral trade negotiations (MTN). Results of theKennedy Round exemplify the cumulative success ofmultilateral tariff reductions.
1973President Nixon proposes a trade bill to authorize U.S.participation in the next round of GATT tradenegotiations.
September 12 to 14 The Tokyo Declaration opens the 1973-79 GATT roundof multilateral trade negotiations known as the TokyoRound. The Tokyo Round is the first to includenegotiations for nontariff trade barriers as well as tariffbarriers.
1975January 3 The Trade Act of 1974 is signed into law by President
Ford. The Act provides negotiating authority for U.S.participation in the Tokyo Round for a 5-year periodthrough Jan. 2, 1980. The Act authorizes the Presidentto enter into trade agreements on nontariff barriers,which the Congress will consider under specialexpedited approval procedures, so-called “fast-track”implementing procedures, that prohibit amendments tothe implementing bill submitted by the President to enactthe negotiated trade agreement. The Act also authorizesthe U.S. Generalized System of Preferences (GSP).
1979January 4 President Carter notifies the Congress of his intention to
enter into the multilateral trade agreements concludedby the Tokyo Round.
April 12 Negotiators initial the draft Tokyo Round agreements.
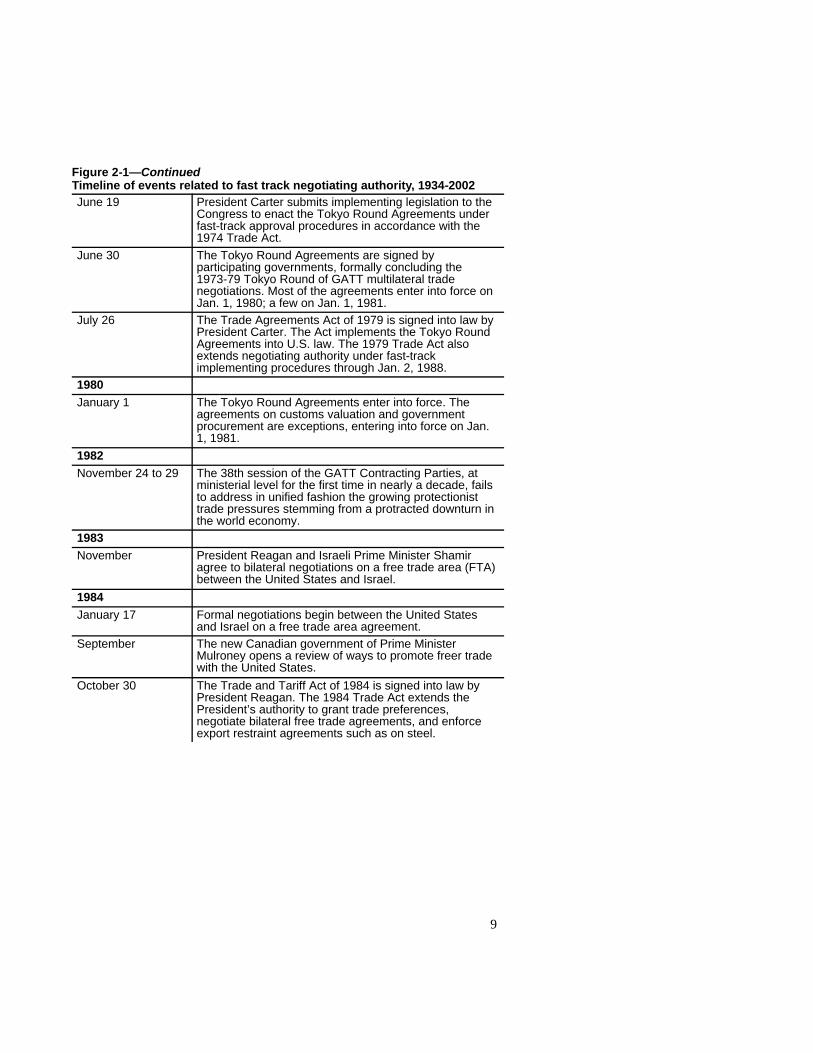
9
Figure 2-1—ContinuedTimeline of events related to fast track negotiating authority, 1934-2002June 19 President Carter submits implementing legislation to the
Congress to enact the Tokyo Round Agreements underfast-track approval procedures in accordance with the1974 Trade Act.
June 30 The Tokyo Round Agreements are signed byparticipating governments, formally concluding the1973-79 Tokyo Round of GATT multilateral tradenegotiations. Most of the agreements enter into force onJan. 1, 1980; a few on Jan. 1, 1981.
July 26 The Trade Agreements Act of 1979 is signed into law byPresident Carter. The Act implements the Tokyo RoundAgreements into U.S. law. The 1979 Trade Act alsoextends negotiating authority under fast-trackimplementing procedures through Jan. 2, 1988.
1980January 1 The Tokyo Round Agreements enter into force. The
agreements on customs valuation and governmentprocurement are exceptions, entering into force on Jan.1, 1981.
1982November 24 to 29 The 38th session of the GATT Contracting Parties, at
ministerial level for the first time in nearly a decade, failsto address in unified fashion the growing protectionisttrade pressures stemming from a protracted downturn inthe world economy.
1983November President Reagan and Israeli Prime Minister Shamir
agree to bilateral negotiations on a free trade area (FTA)between the United States and Israel.
1984January 17 Formal negotiations begin between the United States
and Israel on a free trade area agreement.September The new Canadian government of Prime Minister
Mulroney opens a review of ways to promote freer tradewith the United States.
October 30 The Trade and Tariff Act of 1984 is signed into law byPresident Reagan. The 1984 Trade Act extends thePresident’s authority to grant trade preferences,negotiate bilateral free trade agreements, and enforceexport restraint agreements such as on steel.
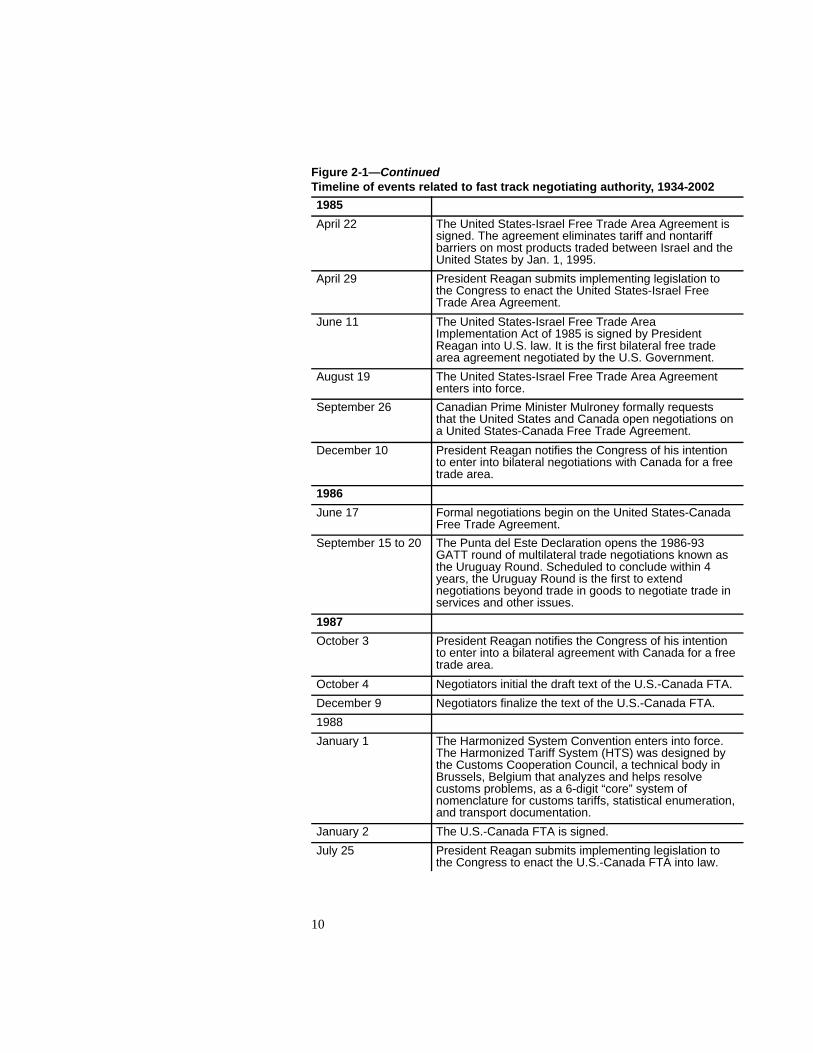
10
Figure 2-1—ContinuedTimeline of events related to fast track negotiating authority, 1934-2002
1985
April 22 The United States-Israel Free Trade Area Agreement issigned. The agreement eliminates tariff and nontariffbarriers on most products traded between Israel and theUnited States by Jan. 1, 1995.
April 29 President Reagan submits implementing legislation tothe Congress to enact the United States-Israel FreeTrade Area Agreement.
June 11 The United States-Israel Free Trade AreaImplementation Act of 1985 is signed by PresidentReagan into U.S. law. It is the first bilateral free tradearea agreement negotiated by the U.S. Government.
August 19 The United States-Israel Free Trade Area Agreemententers into force.
September 26 Canadian Prime Minister Mulroney formally requeststhat the United States and Canada open negotiations ona United States-Canada Free Trade Agreement.
December 10 President Reagan notifies the Congress of his intentionto enter into bilateral negotiations with Canada for a freetrade area.
1986
June 17 Formal negotiations begin on the United States-CanadaFree Trade Agreement.
September 15 to 20 The Punta del Este Declaration opens the 1986-93GATT round of multilateral trade negotiations known asthe Uruguay Round. Scheduled to conclude within 4years, the Uruguay Round is the first to extendnegotiations beyond trade in goods to negotiate trade inservices and other issues.
1987
October 3 President Reagan notifies the Congress of his intentionto enter into a bilateral agreement with Canada for a freetrade area.
October 4 Negotiators initial the draft text of the U.S.-Canada FTA.
December 9 Negotiators finalize the text of the U.S.-Canada FTA.
1988
January 1 The Harmonized System Convention enters into force.The Harmonized Tariff System (HTS) was designed bythe Customs Cooperation Council, a technical body inBrussels, Belgium that analyzes and helps resolvecustoms problems, as a 6-digit “core” system ofnomenclature for customs tariffs, statistical enumeration,and transport documentation.
January 2 The U.S.-Canada FTA is signed.
July 25 President Reagan submits implementing legislation tothe Congress to enact the U.S.-Canada FTA into law.
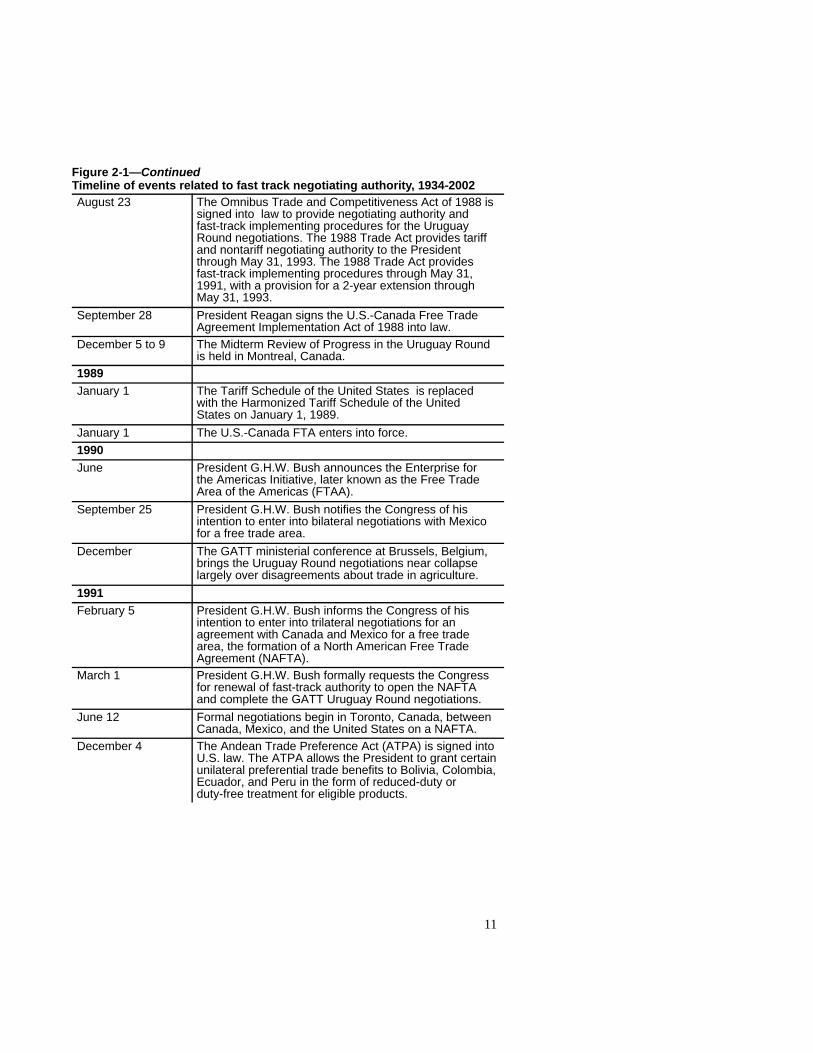
11
Figure 2-1—ContinuedTimeline of events related to fast track negotiating authority, 1934-2002August 23 The Omnibus Trade and Competitiveness Act of 1988 is
signed into law to provide negotiating authority andfast-track implementing procedures for the UruguayRound negotiations. The 1988 Trade Act provides tariffand nontariff negotiating authority to the Presidentthrough May 31, 1993. The 1988 Trade Act providesfast-track implementing procedures through May 31,1991, with a provision for a 2-year extension throughMay 31, 1993.
September 28 President Reagan signs the U.S.-Canada Free TradeAgreement Implementation Act of 1988 into law.
December 5 to 9 The Midterm Review of Progress in the Uruguay Roundis held in Montreal, Canada.
1989January 1 The Tariff Schedule of the United States is replaced
with the Harmonized Tariff Schedule of the UnitedStates on January 1, 1989.
January 1 The U.S.-Canada FTA enters into force.1990June President G.H.W. Bush announces the Enterprise for
the Americas Initiative, later known as the Free TradeArea of the Americas (FTAA).
September 25 President G.H.W. Bush notifies the Congress of hisintention to enter into bilateral negotiations with Mexicofor a free trade area.
December The GATT ministerial conference at Brussels, Belgium,brings the Uruguay Round negotiations near collapselargely over disagreements about trade in agriculture.
1991February 5 President G.H.W. Bush informs the Congress of his
intention to enter into trilateral negotiations for anagreement with Canada and Mexico for a free tradearea, the formation of a North American Free TradeAgreement (NAFTA).
March 1 President G.H.W. Bush formally requests the Congressfor renewal of fast-track authority to open the NAFTAand complete the GATT Uruguay Round negotiations.
June 12 Formal negotiations begin in Toronto, Canada, betweenCanada, Mexico, and the United States on a NAFTA.
December 4 The Andean Trade Preference Act (ATPA) is signed intoU.S. law. The ATPA allows the President to grant certainunilateral preferential trade benefits to Bolivia, Colombia,Ecuador, and Peru in the form of reduced-duty orduty-free treatment for eligible products.
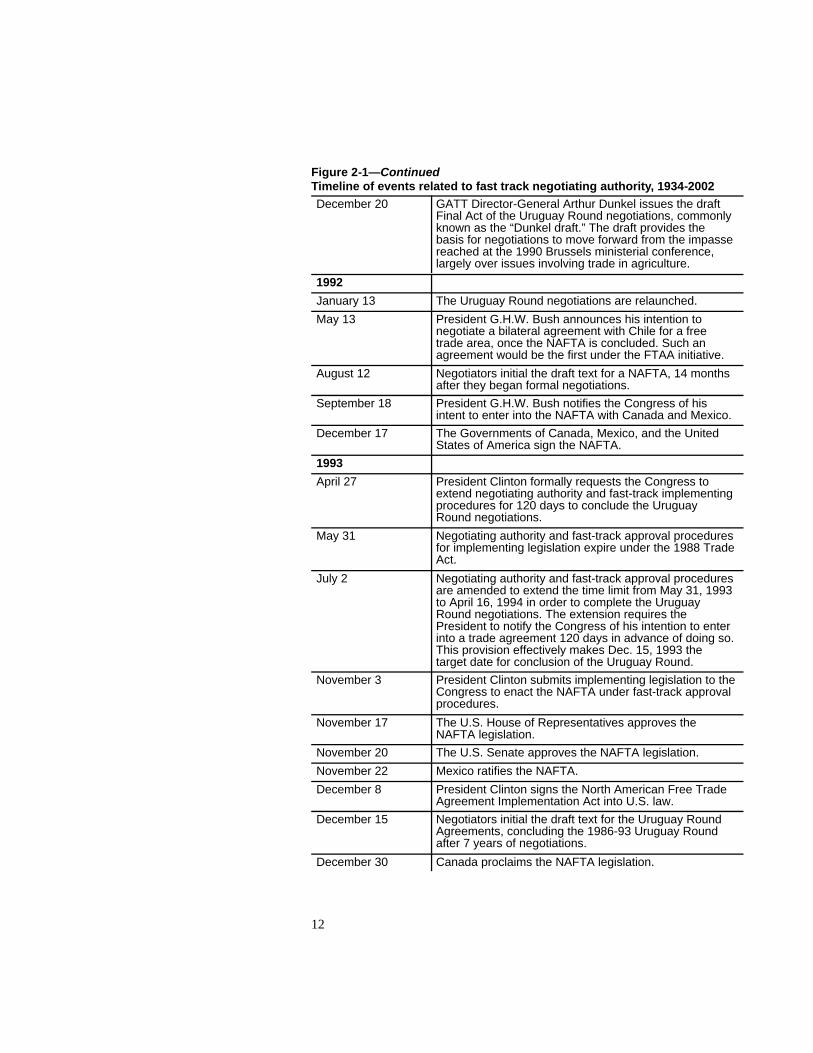
12
Figure 2-1—ContinuedTimeline of events related to fast track negotiating authority, 1934-2002December 20 GATT Director-General Arthur Dunkel issues the draft
Final Act of the Uruguay Round negotiations, commonlyknown as the “Dunkel draft.” The draft provides thebasis for negotiations to move forward from the impassereached at the 1990 Brussels ministerial conference,largely over issues involving trade in agriculture.
1992
January 13 The Uruguay Round negotiations are relaunched.
May 13 President G.H.W. Bush announces his intention tonegotiate a bilateral agreement with Chile for a freetrade area, once the NAFTA is concluded. Such anagreement would be the first under the FTAA initiative.
August 12 Negotiators initial the draft text for a NAFTA, 14 monthsafter they began formal negotiations.
September 18 President G.H.W. Bush notifies the Congress of hisintent to enter into the NAFTA with Canada and Mexico.
December 17 The Governments of Canada, Mexico, and the UnitedStates of America sign the NAFTA.
1993
April 27 President Clinton formally requests the Congress toextend negotiating authority and fast-track implementingprocedures for 120 days to conclude the UruguayRound negotiations.
May 31 Negotiating authority and fast-track approval proceduresfor implementing legislation expire under the 1988 TradeAct.
July 2 Negotiating authority and fast-track approval proceduresare amended to extend the time limit from May 31, 1993to April 16, 1994 in order to complete the UruguayRound negotiations. The extension requires thePresident to notify the Congress of his intention to enterinto a trade agreement 120 days in advance of doing so.This provision effectively makes Dec. 15, 1993 thetarget date for conclusion of the Uruguay Round.
November 3 President Clinton submits implementing legislation to theCongress to enact the NAFTA under fast-track approvalprocedures.
November 17 The U.S. House of Representatives approves theNAFTA legislation.
November 20 The U.S. Senate approves the NAFTA legislation.
November 22 Mexico ratifies the NAFTA.
December 8 President Clinton signs the North American Free TradeAgreement Implementation Act into U.S. law.
December 15 Negotiators initial the draft text for the Uruguay RoundAgreements, concluding the 1986-93 Uruguay Roundafter 7 years of negotiations.
December 30 Canada proclaims the NAFTA legislation.
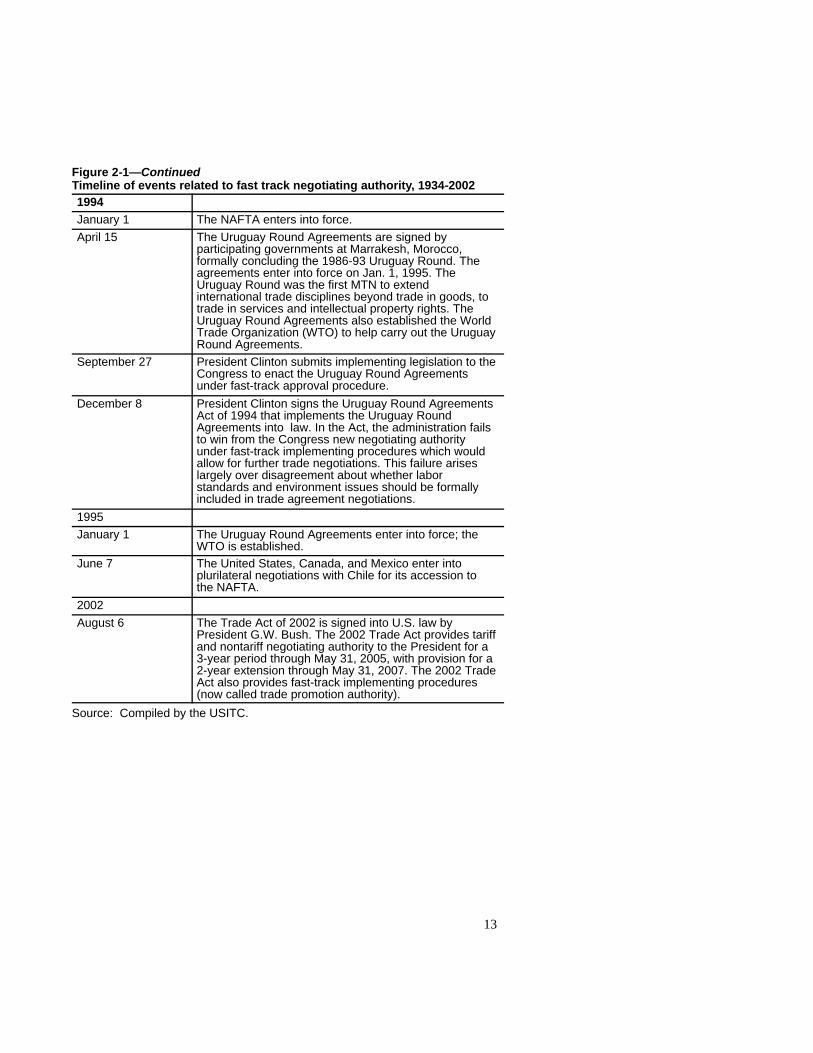
13
Figure 2-1—ContinuedTimeline of events related to fast track negotiating authority, 1934-20021994January 1 The NAFTA enters into force.April 15 The Uruguay Round Agreements are signed by
participating governments at Marrakesh, Morocco,formally concluding the 1986-93 Uruguay Round. Theagreements enter into force on Jan. 1, 1995. TheUruguay Round was the first MTN to extendinternational trade disciplines beyond trade in goods, totrade in services and intellectual property rights. TheUruguay Round Agreements also established the WorldTrade Organization (WTO) to help carry out the UruguayRound Agreements.
September 27 President Clinton submits implementing legislation to theCongress to enact the Uruguay Round Agreementsunder fast-track approval procedure.
December 8 President Clinton signs the Uruguay Round AgreementsAct of 1994 that implements the Uruguay RoundAgreements into law. In the Act, the administration failsto win from the Congress new negotiating authorityunder fast-track implementing procedures which wouldallow for further trade negotiations. This failure ariseslargely over disagreement about whether laborstandards and environment issues should be formallyincluded in trade agreement negotiations.
1995January 1 The Uruguay Round Agreements enter into force; the
WTO is established.June 7 The United States, Canada, and Mexico enter into
plurilateral negotiations with Chile for its accession tothe NAFTA.
2002August 6 The Trade Act of 2002 is signed into U.S. law by
President G.W. Bush. The 2002 Trade Act provides tariffand nontariff negotiating authority to the President for a3-year period through May 31, 2005, with provision for a2-year extension through May 31, 2007. The 2002 TradeAct also provides fast-track implementing procedures(now called trade promotion authority).
Source: Compiled by the USITC.
14
Tariff vs. Nontariff Barrier Negotiating AuthorityCongress has delegated a part of its authority over international trade to the
President since implementation of the Reciprocal Trade Agreements Act of1934.2 With this authority, the President can negotiate with foreigngovernments to enter into multilateral tariff agreements and–without furthercongressional approval–proclaim reductions in U.S. tariff rates, subject tocertain limits.3 This general tariff authority has been a key feature of the firstsix rounds of multilateral trade negotiations held since 1947 under the auspicesof the GATT.4
Trade negotiations prior to the Tokyo Round concentrated primarily onreducing or eliminating tariffs, with relatively little effort or progress made inreducing nontariff barriers or other trade-distorting measures such assubsidies.5 To address both tariff and nontariff barriers in the Tokyo Round,Congress needed to grant additional negotiating authority to the President.
As before, Congress could delegate traditional tariff proclamation authorityat a level sufficient to engage foreign governments in multilateral tariffnegotiations but still retain its constitutional mandate to regulate internationaltrade matters through limits it placed on tariff reductions, de minimis tariffelimination, tariff staging, etc. Preparing for the Tokyo Round negotiations,however, Congress found it problematic to devise a way to delegate authorityto the President to negotiate on nontariff barriers that was sufficiently broad butwhich did not abrogate Congress’s constitutional powers over internationaltrade or ignore these barriers’ impact on the people of the United States.6
Presidential authority to negotiate nontariff barriersAs a solution to granting the President sufficient authority to negotiate
nontariff barriers while still retaining its constitutional role to oversee mattersrelated to trade, Congress fashioned the trade agreement authority and approvalprocess found in section 102 of the Trade Act of 19747 to encourage countries
2 Pt. III, Pub. L. 316, 48 Stat. 943. Committee on Ways and Means, U.S. House ofRepresentatives, Overview and Compilation of U.S. Trade Statutes – 2001 Edition, June2001, pp. 227-229.
3 Tariff reductions are limited to no more than half of current rates of duty. Tariffelimination is limited to current rates of duty that are 5 percent ad valorem or less, andcertain staging conditions apply, such as limiting tariff reductions, to no more than 3percent ad valorem in any one year, among other conditions. Committee on Ways andMeans, Overview, p. 227. Reductions or eliminations beyond these limits requiresCongressional approval.
4 General tariff authority has also been called “tariff proclamation” authority.5 Committee on Ways and Means, Overview, pp. 228-229.6 Committee on Finance, U.S. Senate, Trade Reform Act of 1974 -- Report of the
Committee on Finance -- United States Senate—Together with Additional Views on H.R.10710, Rep. No. 93-1298, 93d Cong., 2d Sess., Nov. 26, 1974, pp. 75-76.
7 Pub. L. 93-618, 88 Stat. 1978.
15
to participate in negotiations, anticipating that trade agreements emergingfrom nontariff barrier negotiations were likely to involve substantial changesto U.S. domestic laws.8 Section 102 authority thus delegated power to thePresident to negotiate and enter into trade agreements on nontariff barriersprovided that Congress retained the final authority to approve theimplementing legislation for these trade agreements.
Although reserving final approval appeared to fulfill Congress’constitutional responsibility for overseeing the legislative process for tradeagreements, it did nothing to alleviate foreign governments’ concerns about theuncertainty of the legislative process for approving such agreements. Theuncertainty of whether Congress would approve an implementing bill for anontariff trade agreement without reopening negotiations to amend provisionsthat it disliked was seen as a major obstacle to engaging the active participationof potential trading partners in negotiations.
Congressional fast track implementing proceduresTo encourage vigorous negotiations and commitments by foreign
governments, Congress devised a special expedited approval process forimplementing legislation. These fast-track implementing procedures were firstset down in section 151 of the 1974 Trade Act. The key feature of thefast-track approval process was that amendments were prohibited to theimplementing bill that the President submitted to incorporate the proposednontariff trade agreement into U.S. domestic law. As such, the Congress couldonly vote to approve or disapprove the legislation–a strict up or down vote. Toensure that congressional views about the proposed trade agreement andrecommendations about changes to U.S. law or administrative practice wereconsidered during the negotiations, section 102 included a number ofconsultation and notification requirements. These consultations were intendedto resolve problems in advance of formal submission and consideration ofimplementing legislation by Congress when the special fast-track implementingprocedures were invoked.9
Past and present trade agreement authoritySection 102 authority under the 1974 Trade Act was granted for a 5-year
period from the date of enactment, that is, from January 3, 1975 throughJanuary 2, 1980. The Trade Agreements Act of 1979 extended section 102authority for an additional 8-year period, through January 2, 1988. Section 102authority subsequently was replaced by similar authority under section 1102(b)
8 Committee on Finance, Trade Reform Act of 1974 – Report of the Committee onFinance, Rep. No. 93-1298, p. 75.
9 Committee on Ways and Means, Overview, pp. 234-235.
16
of the Omnibus Trade and Competitiveness Act of 1988.10 Under thisauthority, a trade agreement could be entered into only if it made progress inmeeting the applicable objectives set forth in section 1101 of the 1988 TradeAct.11
The 1988 Trade Act granted section 1102 authority from the date of itsenactment on August 23, 1988 through May 31, 1991. Section 1102 authoritywas extended upon request of the President for 2 years, through May 31, 1993.The Congress amended section 1102 on July 2, 1993 to extend the negotiatingauthority and fast track approval procedures to April 16, 1994, in order tocomplete the Uruguay Round of GATT multilateral trade negotiations.12
The authority that lapsed in 1993 remained so until section 2103 of theTrade Act of 200213 granted authority to the President to negotiate tradeagreements from the date of its enactment on August 6, 2002 through May 31,2005.14 Provisions in the 2002 Trade Act allow for a 2-year extension ofsection 2103 authority, through May 31, 2007.
Regional and Bilateral Trade AgreementsCongress delegated to the President the necessary authority to negotiate
agreements on nontariff barriers in the Tokyo Round through section 101 of the1974 Trade Act, section 102 authority of the 1974 Trade Act, and otherpresidential documents. The expedited approval procedures15 included insection 151 of the 1974 Trade Act encouraged foreign governments tonegotiate with their best offers, secure in the knowledge that Congress couldnot amend provisions separately, but instead had to approve or disapprove thewhole agreement as concluded by the negotiators. The United States enacted
10 Pub. L. 100-418, 102 Stat. 1123. Sec. 1102(a) authority was to enter intomultilateral tariff agreements; sec. 1102(b) authority was to enter in multilateral nontariffagreements; sec. 1102(c) authority was for bilateral agreements regarding tariff andnontariff barriers.
11 For further details, see section on the Uruguay Round Agreements.12 Committee on Ways and Means, Overview, pp. 229-230. Section 1102(c), which
authorized the President to enter into bilateral agreements regarding tariff and nontariffagreements under the same terms and procedures as applied to multilateral tradeagreements, also expired after May 31, 1993 following a similar 2-year extensionrequest.
13 Pub. L. 107–210, 116 Stat. 933.14 Section 2103(b)(3)(A).15 The expedited congressional approval procedures of sec. 151 of the 1974 Trade
Act became referred to commonly as “fast track” although the 1974 and 1979 Trade Actsdid not use the term. Sec. 1103(b) of the 1988 Trade Act used the term in its title“Application of Congressional ‘Fast Track’ Procedures to Implementing Bills.” Sec.2103(b)(3) of the 2002 Trade Act calls the provisions of sec. 151 of the 1974 Trade Actby the name of “trade authorities procedures.”
17
the Tokyo Round Agreements in the Trade Agreements Act of 1979,16
legislation that also extended the U.S. trade agreements authority until 1988.
Once the Tokyo Round Agreements entered into force in January 1980,major trading nations sought to open another round of multilateral tradenegotiations, in large part to counteract the world recession that followed the1973 and 1979 global oil price increases. This effort failed in November 1982,when world recession, high unemployment, and debt service problems in anumber of major countries, such as Mexico, made many countries reluctant toagree to further trade concessions.17 It was not until November 1985 that theGATT Secretariat began to establish a preparatory committee to develop anagenda and timetable for a new round of multilateral trade negotiations.18
Finally, in September 1986, the ministerial declaration in Punta del Este,Uruguay, launched the eighth round of multilateral trade talks–the UruguayRound of GATT trade negotiations.
The reluctance of other governments in 1982 to engage in multilateralliberalization shifted the United States’ focus to other trade liberalizationapproaches, such as regional and bilateral initiatives, even though multilateralefforts have typically been the primary thrust of U.S. trade policy.19 By thestart of the Uruguay Round, the United States had already embarked on thecomplementary policy of pursuing trade liberalization through regional andbilateral agreements, with the idea of using them as building blocks towardfuture multilateral market opening.20 The first of these was a bilateral freetrade agreement between the United States and Israel in 1985. The second wasa bilateral free trade agreement between the United States and Canada in 1988.The third, which began as a bilateral free trade agreement between the UnitedStates and Mexico, expanded to become a trilateral free trade agreementbetween the United States, Mexico, and Canada in 1993–the North AmericanFree Trade Agreement or NAFTA. In addition, the U.S. President unveiled in1990 the Enterprise for the Americas Initiative–a regional trade liberalization
16 Pub. L. 96-30, 93 Stat. 145.17 Office of the United States Trade Representative (USTR), Twenty-seventh Annual
Report of the President of the United States on the Trade Agreements Program 1983,transmitted to the Congress Apr. 10, 1984, p. 53. The GATT ministerial declaration inNovember 1982 called for positive steps to fight protectionism, avoid predatory tradepractices, resolve outstanding trade problems, and pursue greater trade liberalization. TheOECD ministerial declaration in May 1983 called for measures to ease trade restraints,end export subsidies and preferences to nonmarket economies, and promote economicand trade policies aimed at bolstering world economic recovery. The Group of Sevenmajor industrialized democracies announced in its summit communique later in May1983 a commitment to halt protectionism and reverse it by dismantling trade barriers.USTR, Annual Report 1983, p. 53.
18 Council of Economic Advisors (CEA), Economic Report of the President, 1986(GPO: Washington DC, 1986), p. 122.
19 CEA, Economic Report of the President, 1991, pp. 252-253.20 CEA, Economic Report of the President, 1995, pp. 214-219.
18
effort still underway in 2003, known more widely today as the Free TradeArea of the Americas (FTAA). The following discussion reviews the mainelements of the multilateral, plurilateral, and bilateral trade agreementsnegotiated under the section 102 authority and section 151 approvalprocedures first set down in the 1974 Trade Act.
1979 Tokyo Round Agreements
SettingThe context for the 1973-79 Tokyo Round can be illustrated by
comparison with previous trade rounds. The 1963-67 Kennedy Roundimmediately preceding was the most significant and comprehensive multilateraltrade agreement yet reached. Its success was due in large part to the use of a50-percent cut in tariffs for industrial goods–a tariff cutting formula–as well asthe large number of countries (62) that took part in these negotiations. Overall,the Kennedy Round resulted in an average tariff reduction for industrialproducts of 35 percent, liberalizing trade worth roughly $40 billion.
The very success of multilateral efforts at reducing tariff barriers had theeffect of highlighting the nontariff barriers that remained. Thus, the TokyoRound is perhaps most notable for the GATT plurilateral agreements onnontariff barriers that emerged, the first attempt to address nontariff barriers ina broad multilateral forum.21 The Tokyo Round also went beyond previousmultilateral negotiations in its treatment of trade in agriculture. As in previousrounds, the Tokyo Round in its multilateral format focused essentially onreducing trade barriers on industrial products (tropical agricultural productsbeing a notable exception). However, under the umbrella of the multilateralTokyo Round negotiations, a number of bilateral agreements also emerged thataddressed for the first time tariff and nontariff barriers on temperateagricultural products.
Review of the negotiationsThe seventh round of multilateral trade negotiations opened in Tokyo,
Japan in September 1973. U.S. officials negotiated on tariff reductions underthe general tariff authority found in section 101 of the Trade Act of 1974, andnegotiated on nontariff barriers liberalization under the authority found insection 102.
21 Distinctions between “multilateral,” “plurilateral,” and “bilateral” tradeagreements can be valid descriptors but can also be subject to different interpretations.For further details, see section on the Uruguay Round Agreements.
19
The Tokyo Round Agreements were signed on June 30, 1979. Theagreements were incorporated in the Geneva Protocol (1979), which containedthe tariff concessions negotiated by a number of countries during the Round. ASupplementary Protocol was opened in November 1979 for additionalsignatures and concessions.22 Most of the Tokyo Round Agreements enteredinto force on January 1, 1980, although a few did so on January 1, 1981. Tariffreductions were phased in over eight annual stages, beginning on January 1,1980; U.S. staged reductions for a few more sensitive products’ tariffs werecontinued through January 1, 1991.23
Overview of the agreement
Tariff barriers
For agricultural products, multilateral concessions by developed countrieson exports of tropical products from developing countries were the firstconcrete results of the Tokyo Round. Most developed countries implementedtheir concessions in 1976 and 1977, with further concessions effective as of1980. Approximately 46 developing countries submitted requests to 11developed country participants for tariff and nontariff concessions on exports oftropical products and materials–including agricultural, raw material, mineral,semimanufactured, and manufactured products containing tropical products. Of4,300 items with dutiable tariff lines that were tabled as requests,most-favored-nation (MFN) concessions and GSP concessions were granted on2,855 tariff lines. Of the 2,855 items, 940 were implemented early in thenegotiations in 1976 and 1977.
For industrial products, the GATT Secretariat estimated in 1980 that thetotal value of trade affected by MFN tariff reductions and bindings ofprevailing tariff rates resulting from the Tokyo Round, amounted to more than$155 billion.24 As a result of these cuts, the GATT estimated that the weightedaverage tariff on industrial products among the 19 major participants25 was todecline from 7.0 to 4.7 percent–a 34 percent reduction in customs duty rates.The tariff cutting formula known as the “Swiss formula” was designed, ingeneral, to result in the highest tariffs being reduced by the greatest amountand, consequently, harmonizing or bringing tariff rates for these countries moreclosely together.
22 USTR, Annual Report 1979, pp. 39 to 51.23 Pres. Proc. 4707 of Dec. 11, 1979; 44 FR 72348, et seq.24 GATT, Activities in 1979 and Conclusion of the Tokyo Round of Multilateral
Trade Negotiations (1973-1979) (Geneva: GATT, 1980), pp. 18-20.25 The 19 major trading partners were Austria, Belgium, Canada, Denmark, the
European Communities, Finland, France, Germany, Ireland, Italy, Japan, Luxembourg,the Netherlands, New Zealand, Norway, Sweden, Switzerland, the United Kingdom, andthe United States.
20
Nontariff barriers
The plurilateral agreements26 addressing nontariff barriers for bothagricultural and industrial products negotiated at the Tokyo Round ofmultilateral trade negotiations included:
S Agreement on Technical Barriers to Trade;27
S Agreement on Government Procurement;
S Agreement on Interpretation and Application of Articles VI, XVII andXXIII;28
S Agreement on Implementation of Article VII;29
S Agreement on Import Licensing Procedures;
S Agreement on Implementation of Article VI;30
S Arrangement Regarding Bovine Meat;
S International Dairy Arrangement; and the
S Agreement on Trade in Civil Aircraft.
In addition, the Tokyo Round resulted in several agreements aimed atimproving the systemic functioning of the General Agreement, that is, thefundamental rules governing the multilateral trading system. Theseagreements31 were entitled:
S Differential and More Favourable Treatment, Reciprocity and FullerParticipation of Developing Countries;32
S Declaration on Trade Measures Taken for Balance-of-PaymentsPurposes;
26 General Agreement on Tariffs and Trade, The Texts of the Tokyo RoundAgreements (Geneva: GATT, August 1986), pp. iii to v.
27 Also known as the “Standards Code.”28 Also known as the “Subsidies Code.”29 Also known as the “Customs Valuation Code.”30 Also known as the “Antidumping Code.” The Antidumping Code was the only
nontariff barrier agreement negotiated during the 1963-67 Kennedy Round.31 Whether decisions, declarations, agreements, understandings, undertakings, or
another name, they were commonly referred to collectively as the “FrameworkAgreements.”
32 Also known as the “Enabling Cause.”
21
S Safeguard Action for Development Purposes; and the
S Understanding Regarding Notification, Consultation, DisputeSettlement and Surveillance.
Tokyo Round bilateral negotiations
The United States exchanged major bilateral concessions on tariff andnontariff measures affecting trade in agriculture with Japan, the EuropeanCommunity (EC), and Canada, and on largely nontariff measures with Finland,Sweden, Norway, Switzerland, and Austria.33 The United States reached majorbilateral agreements on tariff and nontariff measures affecting trade inmanufactures with Australia, New Zealand, and South Africa.
Japan agreed to bind the duty rate on soybeans at its existing tariff of free.In 1976, soybeans accounted for $675 million (over 6.7 percent) of total U.S.exports to Japan. Japan also agreed to undertake to increase its general andhotel-use import quota for high quality beef from 16,800 to 30,800 tons byApril 1983,with the United States expected to be a major beneficiary. Japanagreed to reduce tariffs on agricultural products by an average of 18 percent.
The EC agreed to assure market access for a number of agriculturalproducts, such as beef, poultry, and variety meats; canned fruit cocktail andpeaches; certain fish, table grapes, and spirits (e.g. bourbon whiskey); driedprunes; rice; and tobacco. Assured market access indicated that the EC wouldreduce, harmonize, or bind tariffs, provide tariff-rate quotas, or adjust variablelevy calculations. Of major interest to the United States, the EC agreed to atariff-rate quota for high quality beef, with 10,000 tons in-quota that was levyfree, and an over-quota tariff rate of 20 percent ad valorem. Of major interestto the EC, the United States agreed to increase the U.S. cheese quota from17,700 to 44,000 tons for the EC.
Canada made concessions to the United States valued at around $600million and, in exchange, the United States gave concessions amounting toabout $350 million, in 1976 dollars. More than half the trade coverage of theseconcessions involved the livestock sector. Duty harmonization was a majorelement of trade liberalization in both directions, affecting cattle, pork, corn,and potatoes.
Australia agreed to reduce tariffs on 91 rate lines, of which tobacco was akey agricultural product; and computers, construction machinery, and scientificinstruments were key industrial products of interest to the United States. Ofinterest to Australia, the United States agreed to liberalize U.S. nontariffmeasures controlling meat and dairy imports.
33 USTR, Annual Report 1979, pp. 39 to 51.
22
New Zealand agreed to reduce tariffs on 76 rate lines, of which citrus, rice,tobacco, and turkey were key agricultural goods; and chemicals, engines,industrial machinery, medical equipment, and tools were key industrial goodsof interest to the United States. The United States agreed to reduce tariffs on36 rate lines, principally on meats (beef, lamb, veal), dairy products (butter,cheese, casein dairy mixtures), wool, and motorboat engines. The United Statesalso agreed to establish for New Zealand a bilateral quota for cheese of 17,422tons.
South Africa agreed to reduce tariffs by 50 percent on average for $27million of U.S. products. South Africa also agreed to eliminate preferentialtariffs on products from the United Kingdom, such as protein derivatives, earthmoving machinery, and tools. The United States agreed to reduce tariffs by 29percent on average for $74 million of South African products, principally finewool, tanning extracts, diamonds, and certain scrap metals.
Impact of the agreementTariff negotiations resulted in multilateral tariff reductions covering $126
billion in trade in industrial products among the 19 major developed countries,according to the 1979 annual report34 of the President to Congress followingthe negotiations. The tariff reductions were based on a tariff cutting formula,although there were a number of exceptions to the formula.35 The cutsachieved a simple average tariff reduction among the major trading partners ofabout 35 percent. For the United States, the average tariff on industrial productimports was to decline from 6.1 percent ad valorem to 4.2 percent–a 32 percentreduction.36 Multilateral tariff negotiations for agricultural products centeredlargely on concessions given by developed countries on exports of tropicalproducts from developing countries. A number of bilateral trade negotiationson agriculture also emerged from the Tokyo Round, largely among thedeveloped countries, and focused more on “market access measures”37 wherethe combined effect of tariff and nontariff measures was difficult fornegotiators to address separately.
34 USTR, Annual Report 1979, pp. 39 to 51.35 The formula settled upon in December 1978 was originally proposed by
Switzerland and, hence, was known as the “Swiss formula.”36 USTR, Annual Report 1979, p. 50.37 USTR, Annual Report 1979, pp. 39 to 51.
23
1985 United States-Israel Free Trade AreaAgreement
SettingFollowing the failure to launch a new round of multilateral trade
negotiations in 1982, U.S. trade policy efforts shifted focus toward bilateraland plurilateral discussions to liberalize trade.38 Israel originally proposed theidea of a free trade area between the United States and Israel in 1981.39 InNovember 1983, President Reagan and Israeli Prime Minister Shamir agreed tobegin bilateral negotiations on a reciprocal free trade area between the UnitedStates and Israel. At the time, U.S. exports to Israel suffered from a severetariff disparity as compared to exports from the EC, owing to an EC-Israelpreferential trade agreement for industrial products. In addition to broaderpolitical goals involved in closer U.S.-Israelities, the U.S.-Israel FTA alsosought to overcome this economic disadvantage for U.S. products.
Review of the negotiationsNegotiations began formally on January 17, 1984.40 Section 1101
(extension of nontariff barrier negotiating authority) of the 1979 Trade Act hadextended section 102 authority of the 1974 Trade Act to negotiate nontariffbarriers, as well as the section 151 provisions of the 1974 Trade Act underwhich Congress agreed to consider the agreement and its implementinglegislation under the fast-track approval procedures.41 An agreement wassigned on April 22, 1985 that was to eliminate tariff and nontariff barriers onmost products traded between the United States and Israel by January 1,1995.42 The agreement was submitted to the Congress for approval on April29, 1985, along with its statement of administrative action.43 Congressapproved the U.S.-Israel Free Trade Area Implementation Act of 1985,44 which
38 Staff of the U.S. House of Representatives, Committee on Ways and Means,Trade Legislation Enacted into Public Law – 1981 through 1988, Committee print,Jan. 27, 1989, 101st Cong., 1st Sess. (Washington DC, GPO: 1989), pp. 163-167.
39 USTR, Annual Report 1984-85, p. 97.40 Ibid.41 Ibid.42 Committee on Ways and Means, Trade Legislation, Committee print, pp. 163-167.43 Committee on Ways and Means, Trade Legislation, Committee print, pp. 163-167.
This notification began the period of 60 legislative days during which either the SenateCommittee on Finance or the House Committee on Ways and Means could disapproveconsideration of the agreement under the fast-track approval procedures of the 1974Trade Act.
44 Pub. L. 99-47 (H.R. 2268), 99 Stat. 82. See 19 U.S.C. 2112(b) and accompanyingnote.
24
was signed into U.S. law on June 11, 1985.45 The U.S.-Israel Free TradeArea agreement was the first reciprocal bilateral agreement negotiated by theUnited States.
Overview of the agreementThe agreement eliminated tariffs for various products according to four
different schedules: (1) upon entry into force of the agreement; (2) in 3reductions to January 1, 1989; (3) in 8 reductions to January 1, 1995; and (4)after a 5-year period of no reductions, by negotiated reduction by January 1,1995.46 In the area of nontariff barriers, the agreement ended a variety of tradedistorting practices. First, Israel agreed to eliminate export subsidies onindustrial products, including processed agricultural goods. Israel agreed toaccede to the GATT Subsidies Code on or before the agreement becameeffective. Second, the United States and Israel agreed to disciplines on takingactions for balance-of-payments reasons. Third, Israel agreed to automaticlicensing for virtually all nonagricultural products, unless a specific reason isprovided for nonautomatic licensing. Fourth, both countries agreed they couldmaintain import restrictions for agricultural policy purposes, with the exceptionof customs duties. Finally, the United States and Israel agreed to lower theGATT threshold for mutual procurement in order to expand access to theirgovernment procurement markets. The agreement also contains detailedsafeguard provisions modeled after section 201 of the Trade Act of 1974;dispute settlement procedures; rules of origin similar to those detailed in theCaribbean Basin Economic Recovery Act;47 and provisions for consultationsthrough an ongoing Joint Committee.
1988 United States-Canada Free Trade Agreement
SettingIn late 1983, Canada released a comprehensive review of its trade policy
during the early 1980s,48 which highlighted the importance of U.S. trade toCanada, but rejected the idea of a comprehensive, preferential free tradeagreement between the United States and Canada. The review insteadrecommended limited free trade agreements for particular sectors, resemblingthe 1965 U.S-Canada Auto Pact. Sectors initially considered by Canada as
45 Committee on Ways and Means, Trade Legislation, Committee print, pp. 163-167.46 Committee on Ways and Means, Trade Legislation, Committee print, pp. 163-167.47 These rules of origin were essentially the judicially interpreted “substantial
transformation” standard, under 19 U.S.C. 1304, as amended.48 USTR, Annual Report 1984-85, p. 98.
25
possibilities for such negotiations included steel, urban mass transit,petrochemicals, and textiles and clothing. Several joint working groups wereestablished in 1984 to examine the possibility of negotiating these sectoralagreements. However, these working groups remained dormant during theCanadian election campaign that began in the summer of 1984. Once electedin September 1984, the new government of Prime Minister Mulroney begana review of ways to promote freer trade with the United States.
Review of the negotiationsOn September 26, 1985, Prime Minister Mulroney formally requested that
the United States and Canada open negotiations on a United States-CanadaFree-Trade Agreement.49 U.S. negotiators held talks under section 102authority of the 1974 Trade Act, which had been extended by the 1979 TradeAct through January 3, 1988. Negotiations began on June 17, 1986. OnOctober 3, 1987, President Reagan notified the Congress of his intention toenter into a free trade agreement with Canada. Negotiators completed a finaltext on December 9, 1987.50 On January 2, 1988, President Reagan and PrimeMinister Mulroney formally entered into the agreement. On July 25, 1988, thePresident transmitted to the Congress the United States-Canada Free-TradeAgreement Implementation Act of 1988. The Congress passed the act and onSeptember 28, 1988, the President signed the act into law. The U.S-CanadaFTA took effect on January 1, 1989.51
Overview of the agreementThe U.S-Canada FTA eliminated all tariffs on originating goods, reduced
many nontariff barriers, liberalized investment practices, provided ground rulescovering trade in services, and supported efforts at multilateral tradeliberalization. Much of the value of the agreement to the United States layoutside the tariff area, by increasing the stability of cross-border trade, and byassuring that long-term commitments could be made by businesses andexporters without fear of arbitrary disruption from direct import restriction orother measures. The agreement addressed factors affecting trade in services, anarea of increasing economic importance. Cross-border investment was also
49 USTR, Annual Report 1988, pp. 21-24.50 USTR, Annual Report 1988, pp. 21-24.51 The CFTA remains in force technically, although it has been effectively
suspended by adoption of the NAFTA. The NAFTA has incorporated all the bilateralCFTA obligations that the parties agreed should be continued under the NAFTA.
26
addressed in an effort to make this area more efficient.52 In 1987, totalbilateral goods and services trade between the two countries exceeded $166billion.
The U.S-Canada FTA contained 21 chapters in eight broad sections: (1)objectives and scope; (2) trade in goods; (3) government procurement; (4)services, investment and temporary entry; (5) financial services; (6)institutional provisions; (7) other provisions; and (8) final provisions. The firstsection on objectives and scope comprising chapter 1 and 2 covers the overallaims of the agreement and the general definitions used in the agreement.Section 2 on trade in goods, comprising chapters 3 through 12, covers rules oforigin for goods, border measures, national treatment, technical standards,agriculture, wine and distilled spirits, energy, trade in automotive goods,emergency action, and exceptions for trade in goods. Section 3 in chapter 13covers government procurement. Section 4, comprising chapters 14 through 16,covers services, temporary entry for business persons, and investment. Section5, in chapter 17, covers financial services. Section 6, comprising chapters 18and 19, covers institutional provisions, and binational dispute settlement inantidumping and countervailing duty cases. Section 7, in chapter 20, coversother provisions. Section 8, in chapter 21, covers final provisions.
Impact of the agreementThe summary of the agreement’s effects submitted by the Administration in
its documentation to Congress estimated that duty-free trade between the twocountries would result in a gain of between $1 billion and $3.5 billion inannual U.S. welfare.53 U.S. exports to Canada were projected to increase by asmuch as $2.4 billion compared to a Canadian gain of $1.1 billion. Althoughmore difficult to quantify, liberalization of nontariff barriers was to providesignificant opportunities for U.S. businesses and exporters.
1993 North American Free Trade Agreement
SettingAfter the U.S-Canada negotiations, the United States continued its bilateral
and regional thrust toward trade liberalization with similar negotiations held
52 President of the United States, “Statement of Administrative Action” (hereafter“SAA-CFTA”), p. 2-7; found at President of the United States, Communication from thePresident of the United States transmitting the Final Legal Text of the U.S.-CanadaFree-Trade Agreement, the Proposed U.S.-Canada Free-Trade AgreementImplementation Act of 1988, and a Statement of Administrative Action, Pursuant to 19U.S.C. 2112(e)(2), 2212(a), 100th Cong., 2d Sess., H. Doc. 100-216, July 26, 1988,(GPO: Washington DC, 1993), p. 727-730 (hereafter, H. Doc. 100-216).
53 SAA-CFTA; found at H. Doc. 100-216, pp. 3 to 7.
27
with its southern neighbor, Mexico. In June 1990, the United States andMexican Presidents endorsed the goal of a comprehensive free tradeagreement (FTA) between the United States and Mexico, and instructed theirministers to open negotiations. Congress had renewed U.S. trade agreementauthority in the Omnibus Trade and Competitiveness Act of 1988,54 which,although focused primarily on the next round of multilateral tradenegotiations that began in 1986, also permitted U.S. negotiators to establishregional and bilateral trade agreements if possible.
Review of the negotiationsFollowing the June 1990 announcement, Canada expressed interest in
three-way negotiations between the United States, Mexico, and Canada.Negotiations formally began in June 1991 and proceeded quickly based onprevious bilateral discussions held between the United States and Mexicoearlier when Mexico was preparing to accede to the GATT in 1986.
On August 12, 1992, Canada, Mexico, and the United States announced thecompletion of the negotiations, 14 months after they began.55 The Presidentsubmitted to Congress on November 3, 1993 the legislative package necessaryfor the agreement to be considered under the fast-track approval procedures.The package included the text of the agreement, schedules of concessions, animplementing bill, a Statement of Administrative Action required to implementthe agreement, and certain administration statements required by Congress onhow the agreement would affect U.S. economic interests. The U.S. House ofRepresentatives approved the legislation on November 17, 1993; the U.S.Senate on November 20, 1993. Mexico ratified the agreement on November22, 1993; and Canada proclaimed the legislation on December 30, 1993. TheNAFTA entered into force on January 1, 1994.
Overview of the agreementThe NAFTA is a regionwide trade agreement aimed at progressively
eliminating tariff and nontariff barriers to trade in originating goods, improvingaccess for trade in services, establishing rules for investment, strengthening
54 Pub. L. 100-418, 102 Stat. 1102, 19 U.S.C. 2902. For further details, see thesection on the Uruguay Round Agreements.
55 USTR, Annual Report 1993, pp. 45-46. On Sept. 25, 1990, President Bushnotified the Senate Finance and the House Ways and Means Committees of his intent tonegotiate an FTA with Mexico.This notification began the period of 60 legislative daysduring which either committee could decline in advance to consider any trade agreementnegotiated under this authority using the fast- track approval procedures.The Presidentalso indicated that Canada had expressed a strong desire to participate in three-waynegotiations with Mexico and the United States. On Feb. 5, 1991, the President againinformed the two committees of the decision by the three governments to proceed withtrilateral negotiations toward forming a North American FTA. USTR, Annual Report1991, pp. 78-79.
28
protection for intellectual property rights, and creating an effective disputesettlement mechanism. Most tariff and nontariff barriers on eligible industrialproducts will be gradually eliminated over 10 years, including barriers totextiles and apparel that have substantial regional content. Moreover, theagreement provides that tariffs and most nontariff barriers on agriculturalproducts will be phased out over 15 years. Investment rules aim to ensurenational treatment and eliminate or significantly reduce most performancerequirements in all sectors, particularly in investment barriers in thepetrochemical and financial sectors in Mexico. The agreement liberalizestrade in services–in particular financial, land transportation, andtelecommunications services–and also aims to protect intellectual propertyrights. It creates a dispute resolution structure and contains mechanisms toenforce national labor and environmental laws. Last, the NAFTA providesfunds for environmental infrastructure and community adjustment along theU.S.-Mexican border.56
The NAFTA contains eight broad sections, both substantive andinstitutional: (1) general objectives and definitions; (2) trade in goods; (3)technical barriers to trade; (4) government procurement; (5) investment,services, and related matters; (6) intellectual property; (7) administrative andinstitutional provisions; and (8) final provisions. What follows is a briefoverview of the agreement’s provisions, drawing upon implementationdocuments submitted to Congress as part of its approval procedure for theagreement.57
Objectives
The first section contains chapters 1 and 2, which cover the objectives(establishment of the free trade area; objectives; relation to other agreements,including environmental and conservation agreements; and the extent ofobligations) and the general definitions used in the agreement.58
56 CEA, Economic Report of the President, 1995, pp. 220-221.57 President of the United States, “Statement of Administrative Action”; (hereafter
“SSA-NAFTA”); found at President of the United States, Message for the President ofthe United States transmitting North American Free Trade Agreement, Texts ofAgreement, Implementing Bill, Statement of Administrative Action and RequiredSupporting Statements, 103d Cong., 1st Sess., H. Doc. 103-159, Vol. 1, Nov. 4, 1993,(GPO: Washington DC, 1993), (hereafter, H. Doc. 103-159).
58 North American Free Trade Agreement between the Government of the UnitedStates of America, the Government of Canada and the Government of the UnitedMexican States, vol. I, 1993 (hereafter NAFTA); found at H. Doc. 103-159.
29
Trade in goods
The provisions covering trade in goods are contained in chapters 3 through8. NAFTA’s principal rules governing trade in goods, which are found inchapter 3, require nondiscriminatory national treatment and trade betweenNAFTA countries; a phaseout of tariffs on qualifying goods produced in NorthAmerica and traded between Canada, Mexico, and the United States; and theelimination of a wide variety of nontariff barriers and trade distortingmeasures.59 Chapter 4 establishes the rules of origin to identify the goods thatwill be deemed to originate in the territories of the NAFTA parties and thuseligible for the benefits of the agreement.60 Chapter 5 establishes proceduresfor customs administrations in each NAFTA country to follow, ensuring thatuniform treatment of goods under NAFTA’s rules of origin and marking ruleswill channel the benefits of lower tariffs to firms and individuals producing andtrading qualifying goods within North America.61 In general, goods whollyproduced in the NAFTA region, meeting listed changes in tariff classificationand other criteria, or made in the region from originating materials qualify forNAFTA benefits.
Chapter 6 establishes specific rules for trade in energy products andpetrochemicals. It also covers certain Mexican reservations (exceptions)regarding NAFTA rules governing national treatment of investments in theenergy and petrochemicals sectors, and governing trade in services related tothese sectors.62 Chapter 7 addresses the agriculture sector and sets out separateagricultural market access agreements between Mexico and the United States,and between Mexico and Canada. When considered in combination with theU.S-Canada FTA, these provisions largely create three separate bilateralagreements on agriculture between the NAFTA governments, rather than onetrilateral agreement. Chapter 7 also deals with sanitary and phytosanitary (SPS)measures that protect human, animal, and plant life and health from risks ofplant- and animal-borne pests and diseases, and from risks of additives andcontaminants in foods and feedstuffs. The NAFTA establishes generalrequirements and procedures so that SPS measures do in fact protect againstthe risk targeted and do not act as disguised trade barriers.63 Finally, chapter 8sets out procedures and remedies available to domestic industries that havesustained, or are threatened by, serious economic injury due to increasedimports. Special safeguard provisions apply elsewhere to agricultural andtextile products.64
59 SAA-NAFTA, p. 18; found at H. Doc. 103-159, p. 467.60 Ibid., p. 43; at p. 492. See general note 12 to the HTS.61 Ibid., p. 50; at p. 499.62 Ibid., p. 62; at p. 511.63 Ibid., p. 67, at p. 516; and SAA, p. 88, at p. 537.64 Ibid., p. 109; at p. 558.
30
Technical barriers to trade
Technical barriers to trade are covered by chapter 9, which establishesseveral procedural requirements concerning standards-related measures. Suchmeasures include voluntary and mandatory product or service standards and theprocedures used to determine whether a particular product or service meetsthese standards. This chapter establishes the requirements and proceduresintended to distinguish legitimate measures taken to protect a nation’s domesticinterests from those measures that are obstacles to trade.65
Government procurement
Government procurement obligations are contained in chapter 10, whichrequires the three NAFTA countries to eliminate “Buy National” restrictions onthe majority of nondefense goods and services that are supplied by firms inNorth America to the federal governments of member states.66
Investment and services
Chapters 11 through 16 on investment, services, and related matters set outthe investment obligations of member governments toward investors from otherNAFTA parties, provisions regarding cross-border trade in services and specificservices sectors such as telecommunications and financial services, as well asprovisions addressing competition policy and the entry of business personsengaged in investment or services matters. In chapter 1, each governmentagrees to four basic protections for investments made by persons from otherNAFTA countries. These obligations include: (1) nondiscriminatory treatment;(2) freedom from performance requirements; (3) free transfer of funds relatedto an investment; and (4) expropriation only in conformity with internationallaw. Chapter 11 also provides a mechanism for the settlement of disputesbetween an investor and the state, patterned after the standard investor-statedispute mechanism found in a U.S. bilateral investment treaty. This mechanismpermits an investor to submit a claim to binding arbitration underinternationally accepted rules.67
Chapter 12 establishes the basic rules regulating trade in services, whichparallel those in the agreement regulating trade in goods. Each country retainsthe right to set licensing standards for trade in services, provided the actionsare nondiscriminatory.68 Chapter 13 addresses measures affecting access to anduse of public telecommunications networks, as well as measures affecting the
65 Ibid., p. 120; at p. 569.66 Ibid., p. 134; at p. 583.67 Ibid., p. 140, at p. 589; and p. 145, at p. 594.68 Ibid., p. 150; at p. 599.
31
right of firms and individuals from member countries to provide suchservices. It contains rules to protect firms that operate private communicationnetworks, or provide enhanced services or computer services over anothersignatory’s basic telephone network.69 Chapter 14 sets down nationaltreatment rules governing how each NAFTA government must treat financialinstitutions from other NAFTA parties operating in its territory. These rulescover financial institutions owned by investors from other NAFTA countries,investors who own or seek to own such institutions, and persons in otherNAFTA countries that provide financial services on a cross-border basis. Therules apply to government measures in the financial sector at the federal,state, and local level.70
Chapter 15 on business conduct focuses on monopolies and stateenterprises and is designed to complement and support the market-openingobjectives of the agreement, particularly relating to the energy sector.71 Chapter16 addresses the temporary entry of business persons that are citizens of otherNAFTA countries while preserving each country’s right to protect its domesticlabor force and carry out its own immigration policies.72
Intellectual property rights
The section on intellectual property establishes comprehensive standardsfor the protection and enforcement of intellectual property rights in the threeNAFTA countries. These rules require each government to apply thesubstantive provisions of the world’s most important intellectual propertyconventions, to include additional protections, and to enforce criticalprocedures to safeguard these rights.73
Institutional provisions
The section on institutional provisions sets rules to foster transparency inadministering the agreement, establishes several bodies to provideadministrative support, and establishes general and specific dispute settlementprocedures for antidumping and countervailing duty matters. Chapter 18includes requirements regarding the publication, notification, andadministration of laws aimed at promoting the open and fair application ofmeasures covered by the agreement.74 Chapter 19 sets out procedures forbinational panel review of final antidumping and countervailing duty
69 Ibid., p. 160; at p. 609.70 Ibid., p. 163; at p. 612.71 Ibid., p. 173; at p. 622.72 Ibid., p. 174; at p. 624.73 Ibid., p. 184; at p. 633.74 Ibid., p. 193; at p. 642.
32
determinations, and for notification and review of trade law amendments.75
Chapter 20 sets out detailed procedures for government-to-governmentdispute resolution under the NAFTA. This chapter also establishes a FreeTrade Commission, the central institution of the NAFTA comprising ministersor similar officials designated by each country, and creates a NAFTASecretariat to provide support to the Commission.76
Exceptions
Chapter 21 spells out general, national security, taxation,balance-of-payments, disclosure of information, and cultural industriesexceptions to all or part of the agreement.77 In chapter 22, provisions are maderegarding the agreement’s annexes, amendments to the agreement, its entry intoforce, accession to and withdrawal from the agreement, and the authentic textof the agreement.78
Impact of the agreementThe impact of the NAFTA on national income growth has proven difficult
to isolate from other factors, particularly as the agreement’s provisions are stillin transition. Since the NAFTA went into effect in 1994, total trade hasincreased among Canada, Mexico, and the United States by approximately 128percent, from $297 billion in 1994 to $676 billion in 2000, according to recentestimates cited by the administration.79 The share of U.S. goods exported toNAFTA partners has increased from 14 percent to 37 percent during this periodas trade restrictions previously limiting U.S. exports have decreasedsignificantly. Nearly all of the $406 billion in bilateral trade in goods betweenCanada and the United States currently enters free of duty. When theagreement is fully implemented, some estimates have suggested that U.S. GDPcould experience an increase between 0.1 percent and 0.5 percent, or roughly$10 billion to $50 billion relative to the size of the U.S. economy in 2000.80
75 Ibid., p. 194; at p. 643.76 Ibid., p. 208; at p. 657.77 Ibid., p. 217; at p. 666.78 NAFTA, p. 22-1; at p. 1292.79 CEA, Economic Report of the President, 2002, pp. 279-280.80 CEA, Economic Report of the President, 2002, pp. 279-280. The report does not
cite specific studies. Also, note that NAFTA has not yet been fully implemented. Resultsreported in chapter 7 of the current study reflect implementation as of 2001.
33
1994 Uruguay Round Agreements
SettingIn September 1986, the ministerial declaration in Punta del Este, Uruguay,
launched the eighth round of multilateral trade negotiations known as theUruguay Round. Although the major trading nations had sought to beginanother round of negotiations after the Tokyo Round Agreements entered intoforce, these efforts failed in 1982 when many countries proved unwilling tomake fresh concessions to liberalize world trade at a time of world recession.After further efforts and several years of delay, these negotiations began slowlyin 1986.81
U.S. trade agreement negotiating authority was also delayed until theCongress passed the Omnibus Trade and Competitiveness Act of 1988, whichwas signed into law August 23, 1988. Section 1102(a) (agreements regardingtariff barriers) and section 1102(b) (agreements regarding nontariff barriers) ofthe 1988 Trade Act authorized the President to enter into trade agreementsconcerning tariff and nontariff barriers provided that the agreements madeprogress toward meeting the trade negotiating objectives set out in section 1101of the 1988 Trade Act.82 Trade agreement negotiating authority was grantedthrough May 31, 1993, and U.S. implementing legislation for resultingagreements was subject to fast-track approval procedures. On July 2, 1993, theCongress amended section 1102 authority to extend these approval proceduresfrom May 31, 1993 to April 16, 1994, to allow negotiators to conclude theUruguay Round negotiations. This extension was subject to the Presidentnotifying the Congress of his intent to enter into an agreement at least 120 daysprior to signing such a trade agreement (that is, by December 15, 1993).
81 CEA, Economic Report of the President, 1986, p. 122.82 Section 1101 (19 U.S.C. 2902) sets out 16 principal negotiating objectives that
involved (1) dispute settlement, (2) improvement of the GATT and multilateral tradenegotiation agreements, (3) transparency, (4) developing countries, (5) current accountsurpluses, (6) trade and monetary coordination, (7) agriculture, (8) unfair trade practices,(9) trade in services, (10) intellectual property, (11) foreign direct investment, (12)safeguards, (13) specific barriers, (14) worker rights, (15) access to high technology, and(16) border taxes. More broadly, section 1101 also elaborated 3 overall objectives,charging U.S. negotiators to obtain (1) more open, equitable, and reciprocal marketaccess; (2) the reduction or elimination of barriers and other trade-distorting policies andpractices; and (3) a more effective system of international trading disciplines andprocedures.
34
Review of the negotiationsIn December 1988, negotiators held a mid-term review of progress in
Montreal, Canada, to take stock of the Uruguay Round negotiations to date.83
As disagreements over trade in agriculture played a lead role in the 1982failure to launch new trade talks, so too did the same disagreements postponeconclusion of the mid-term review until April 1989. Nonetheless, the reviewdid streamline the GATT dispute settlement procedures, institute the TradePolicy Review Mechanism on a provisional basis, and even produced someagreement concerning agricultural trade–specifically, the early implementationof market access concessions on imports of tropical agricultural productsimportant to developing countries.
The Uruguay Round was scheduled to conclude in December 1990 inBrussels, Belgium, but an impasse over how to reform trade in agriculturedeadlocked the ministerial conference. Subsequently, the GATTDirector-General consulted with members about resuming negotiations until adraft text containing the likely elements of a final agreement emerged inDecember 1991. This draft Final Act became the basis for several more yearsof discussion. In November 1992, the United States and the European Union(EU) settled their differences concerning agriculture in the so-called BlairHouse accord. In July 1993, the four major trading partners–Canada, EU,Japan, and the United States–announced a market access agreement as part ofan effort to push for a conclusion to the Uruguay Round. On December 15,1993, the Uruguay Round of negotiations was concluded for all issues. OnApril 15, 1994, ministers met in Marrakesh, Morocco to sign the UruguayRound Agreements among 125 participating governments.
Overview of the agreement
Goods, services, and intellectual property
The Uruguay Round of multilateral trade negotiations took more than 7years to conclude, but once finished, it surpassed all other rounds of trade andtariff negotiations in the breadth of topics covered. While all previous roundshad failed to cover trade in agriculture in any substantive manner, the UruguayRound Agreements included an Agreement on Agriculture that covered trade inagricultural products on the same basis as trade in industrial products. Thoughprevious rounds applied only to trade in goods, the Uruguay RoundAgreements apply to trade in goods, trade in services, and trade-related aspectsof intellectual property rights, thus extending the multilateral trading rules to
83 This section is based largely on material provided by the WTO, “Trading into theFuture: the Introduction to the WTO,” April 1999, 2d edition; also available at Internetaddress http://www.wto.org/english/thewto_e/whatis_e/tif_e/fact5_e.htm, retrieved onOct. 29, 2002.
35
cover the technological progress and globalization of production that hasbeen transforming economies since the Second World War.
Single integrated package of agreements
Negotiators of the Uruguay Round incorporated all the resultingagreements together into a single package, so that a government accepting therights and obligations of any one agreement had to accept the rights andobligations in all the multilateral agreements. This package included anintegrated dispute settlement system intended to apply to all the UruguayRound Agreements and member countries, something lacking under previousmultilateral trading rules. Finally, the negotiators in the Uruguay Round agreedto institutionalize these rules by establishing an international organization–theWorld Trade Organization–to administer the Uruguay Round Agreements in aconsistent manner.
WTO agreement and integral annexes
The Uruguay Round Agreements consist collectively of 22 agreements andsome 30 ministerial decisions and declarations. On April 15, 1994, ministerssigned in Marrakesh, Morocco, the “Final Act Embodying the Results of theUruguay Round of Multilateral Trade Negotiations,” a one-page document thatindicated that they would submit for ratification to their legislatures a seconddocument–the Marrakesh Protocol Establishing the World Trade Organization.Ratification of the WTO Agreement means that a government accepts not onlythe slim 12-page text of the WTO Agreement, but also the voluminous annexesthat are an integral part of the agreement. The annexes comprise Annex 1 [notitle], which contains three parts: Annex 1A–the Multilateral Agreements onTrade in Goods; Annex 1B–the General Agreement on Trade in Services; andAnnex 1C–the Agreement on Trade-Related Aspects of Intellectual PropertyRights; Annex 2–the Dispute Settlement Understanding; Annex 3–the TradePolicy Review Mechanism; and Annex 4–the Plurilateral Agreements.
Annex 1A covers the multilateral agreements on trade in goods, containinga large number of separate agreements. These agreements cover agriculture,sanitary and phytosanitary measures, textiles and clothing, technical standards,investment measures, customs valuation, antidumping measures, preshipmentinspection, rules of origin, subsidies and countervailing measures, andsafeguards. Annex 1B contains the General Agreement on Trade in Services, orGATS. The GATS is the first multilateral framework devised to address tradein services, an increasingly important component of world trade and the worldeconomy. Annex 1C contains the Agreement on Trade-Related Aspects ofIntellectual Property Rights, also known as the “TRIPs Agreement,” the firstmultilateral agreement to bring intellectual property rights into the GATTframework of international trade disciplines. Annex 2 contains theUnderstanding on Rules and Procedures Governing the Settlement of Disputes,commonly known as the Dispute Settlement Understanding. The Dispute
36
Settlement Understanding is an integral part of the package of Uruguay RoundAgreements and aims to provide a unified dispute settlement mechanism acrossall the Uruguay Round Agreements overseen by the WTO, a unified approachthat was lacking under the previous GATT 1947 arrangement overseen by theGATT Secretariat. Annex 3 contains the Trade Policy Review Mechanism, ameans by which member government trade policies can be examined tohighlight policies that support the multilateral trading system as well as thosethat may not adhere to multilateral trade disciplines. Annex 4 covers severalseparate plurilateral agreements, which are administered through the WTOstructure. Originally, in 1995, there were four plurilateral agreements: (1) theAgreement on Trade in Civil Aircraft; (2) the Agreement on GovernmentProcurement; (3) the International Dairy Agreement; and (4) the InternationalBovine Meat Agreement. However, in 1997 the two sectoral agreements onbovine meat and dairy products were terminated, leaving only the Agreementon Government Procurement and the Agreement on Trade in Civil Aircraft inAnnex 4 of the Uruguay Round Agreements.
In principle, a plurilateral agreement differs from a multilateral one in thatthe specific signatories to a plurilateral agreement receive additional rights inexchange for accepting additional obligations. Although all WTO members aresignatories to the multilateral agreements embodied in the Uruguay RoundAgreements and all members receive the same rights in exchange for acceptingthe same obligations, only the signatories to the plurilateral agreements areentitled to the rights provided by the additional rules found in the plurilateralagreement in exchange for accepting additional obligations that complementthe multilateral WTO rules. Nonetheless, despite the separate nature of theplurilateral agreements, they are administered under the framework of theWTO institutionally in that the plurilateral disciplines extend or complementmultilateral WTO rules.
GATT 1947 vs. GATT 1994
Annex 1A also includes several legal instruments of importance–theGeneral Agreement on Tariffs and Trade 1994 (GATT 1994), and theMarrakesh Protocol to the GATT 1994. The very first provision in Annex 1Aincorporates the provisions of the General Agreement on Tariffs and Trade1947 (GATT 1947) and subsequently revises the interpretation of severalGATT articles, to form the GATT 1994. The GATT 1947 entered into force onJanuary 1, 1948, to reflect tariff negotiations held in 1947 and their attendantmultilateral rules on trade in goods. The GATT 1994 entered into force onJanuary 1, 1995, to reflect the Uruguay Round multilateral trade negotiationsheld from 1986 to 1993. Although GATT 1947 and GATT 1994 containessentially the same provisions, they are nonetheless legally distinct from oneanother under international law, and a country could sign only one of them.
Whereas the 1947-48 Havana Conference discussed an International TradeOrganization intended to administer the GATT 1947 trade rules governing the1947 tariff negotiations, the International Trade Organization was never
37
established. This lapse left the GATT 1947 to continue as a framework of traderules for nearly 50 years, but with no major supporting institution. In contrast,the World Trade Organization was established specifically to administer theGATT 1994, both entering into force on January 1, 1995.
Marrakesh Protocol of national schedules of commitments
Annex 1A also includes the Marrakesh Protocol to the GATT 1994, aprotocol that marks the legal and notional location within the framework of theUruguay Round Agreements where WTO Members affix their nationalschedules of concessions and commitments as negotiated during the UruguayRound. If considered literally, this section comprises thousands of pages ofnational schedules of concessions that are similar to national tariff schedules. Itshould be noted that market access concessions made as part of the negotiationof a multilateral agreement often do not appear explicitly under multilateralagreements but instead exist only in national schedules of concessions andcommitments, e.g. the overall Uruguay Round multilateral commitment fordeveloped countries to reduce their agricultural export subsidies by 36 percentover 6 years.
Impact of the agreementEstimates of the impact of the Uruguay Round Agreements prove difficult
owing to their continuing implementation and the difficulty of disentanglingthe agreements’ effects from current events. In 1994, the GATT Secretariatreleased its overview of the results of the round.84 The report said thatestimates of the value increase in world income due to the liberalization oftrade in goods ranged from $109 billion to $510 billion by the end of theagreements’ implementation period in 2005. Estimates of the volume increaseof world trade in goods ranged from 9 percent to 24 percent by 2005. Annualincome gains–based on the upper range assumption of $510 billion by2005–were estimated to be roughly $122 billion for the United States, $164billion for the EU, $27 billion for Japan, and $116 billion for the developingcountries and economies in transition85 as a single group.
For agricultural products, countries agreed to maintain current access, andif current access was not at 3 percent of domestic consumption countries madea minimum access commitment at 3 percent with a commitment to increase to5 percent by the end of the implementation period. The United States agreed tominimum market access commitments for, among others, 0.81 million tons ofwheat, 1.8 million tons of coarse grains, 1.1 million tons of rice, and 0.73million tons of dairy products. The participants’ agreement to the tarifficationof all agricultural products means that virtually only tariff barriers should
84 GATT Secretariat, The Results of the Uruguay Round of multilateral tradenegotiations – Market access for goods and services: Overview of the results, November1994 (Geneva: GATT, 1994).
85 This category comprises essentially the formerly centrally planned economies ofCentral and Eastern Europe.
38
remain in principle to distort trade in agriculture once all provisions are fullyimplemented. Participants also agreed to bind essentially 100 percent ofagricultural tariffs, and to reduce those tariff by a weighted average of 36percent, and not less than 15 percent for each tariff line. Bound tariff ratesprovide traders and investors with substantially greater market security and,as a consequence, can promote increased trade. Participants agreed to a 36percent reduction in agricultural export subsidies, decreasing from $22.5billion to $14.5 billion. Participants further agreed to a reduction inagricultural domestic support subsidies of 18 percent, decreasing from $197billion to $162 billion, in total.
For industrial products, the developed countries agreed to tariff reductionsthat declined from an average of 6.3 percent ad valorem to 3.8 percent, roughlya 40 percent reduction. The proportion of industrial products enteringdeveloped country markets at a tariff rate of free (duty-free) is scheduled todouble from 20 percent to 44 percent by 2005. The percentage of bound tariffrates rose from 78 percent to 99 percent for developed countries, from 21percent to 73 percent for developing countries, and from 73 percent to 98percent for transition economies. In the first multilateral negotiation of its kind,the participants agreed to market access commitments regarding trade inservices. In addition, the Uruguay Round Agreements succeeded–through theAgreement on Textiles and Clothing–in establishing a framework under whichinternational trade in textiles and clothing could be brought under GATTdisciplines in the multilateral trading system. The agreement’s 10-year phaseoutof quotas is scheduled to conclude on January 1, 2005, when all remainingtextile and clothing quotas are to be fully integrated into the GATT.
39
CHAPTER 3:Economic Changes in the UnitedStates Since the Beginning of
the Tokyo Round
In 1974, the year Congress first granted the President fast-track negotiatingauthority, the applied U.S. tariff rate on imported goods was 4.64 percent.1 By2001, the applied tariff rate had fallen to 1.59 percent.2 Tariff reductions, otherU.S. trade policy changes, and reductions in foreign trade barriers–along withother factors such as growing incomes and improved transportation andcommunication technologies–increased the real value of U.S. trade in goodsand services3 from $0.5 trillion in 1974 to $2.5 trillion in 2001.4 During thattime, trade has grown faster than overall U.S. economic activity. The ratio ofU.S. trade to GDP was 0.12 in 1974 and 0.28 in 2001.5
While growing international trade has undoubtedly affected the U.S.economy, a number of other changes were probably just as significant. The pastthree decades have seen substantial technological progress, deregulation ofseveral large service industries, sizable increases in workers’ average educationlevel, and substantial growth in both the capital stock and the size of thepopulation. The effects of these and other changes on the U.S. economycomplicate efforts to measure the economic impact of trade agreements.
The principal purpose of this study is to identify those economic outcomesthat can be credibly traced to trade policy changes. The key analyticaldifficulty in any such exercise is distinguishing the effects of trade policy fromthe effects of other sources of economic change. In the studies reviewed in
1 The World Bank Group, World Development Indicators, CD--ROM. The appliedtariff rate is calculated by dividing the value of import duties collected by the value oftotal imports. This measure tends to understate the true size of average tariffs becauseimporters substitute away from high tariff goods. It is included here as an indicativeaggregate measure of the degree to which the U.S. has reduced its tariffs over time.
2 USITC calculations from U.S. Department of Commerce data.3 Total U.S. trade is measured as the value of imports plus the value of exports.4 USITC calculations from U.S. Department of Commerce (USDOC), Bureau of
Economic Analysis, “Survey of Current Business,” August 2002. Trade is measured inconstant 1996 dollars.
5 USITC calculations from USDOC, Bureau of Economic Analysis, “Survey ofCurrent Business,” August 2002.
40
subsequent chapters, researchers take different approaches to identifying theeffects of trade and/or trade policy changes on the U.S. economy.Conclusions about the economic effects of trade and trade policy changesnecessarily depend on the way in which a study controls for other sources ofeconomic change. Because changes not related to trade policy have been sosubstantial, and because many of them have effects that look like the effectsof trade policy changes, this section undertakes a review of significantchanges in U.S. economic structure over the last three decades.
Particular attention is paid to those economic changes with a plausible linkto trade policy changes. Theories of international trade6 suggest that a policy ofreducing trade barriers should have the following effects: 1) the share of U.S.output produced by exporting industries should increase and the share of U.S.output produced by import-competing industries should decrease, 2) averagereal incomes should rise, as the shift toward exporting sectors increases thevalue of U.S. output, and 3) the relative rate of return paid to factors ofproduction will shift in favor of those resources employed more intensively inexporting industries and against those factors employed more intensively inimport-competing industries.7 All of these changes occurred between 1974 and2001. This chapter reviews the historical changes in the economic variables ofprimary interest to trade policy makers, and identifies other changes in the U.S.economy that might have also contributed to observed outcomes.
Structure of U.S. EconomyThe United States has seen considerable changes in the composition of
output since the mid-1970s. At the broad level, production has shifted awayfrom manufacturing, mining and agriculture, and toward services. Table 3-1shows real gross domestic product (measured in 1996 dollars) and the share of
6 The international trade models described here are those based on the concept ofcomparative advantage -- the Ricardian and Heckscher--Ohlin models. For a discussionof these models, see for example, chapters 2 and 4 in Paul R. Krugman and MauriceObstfeld, International Economics: Theory and Policy, Sixth Edition, (Boston: AddisonWesley, 2002).
7 U.S. output is capital-- and skill--intensive, relative to the rest of the world. In 1993,the United States had an estimated 19.4 percent of the world’s skilled labor, 20.8 percentof the physical capital, and 2.6 percent of the unskilled labor. See William Cline, Tradeand Income Distribution (Washington, D.C.: Institute for International Economics,1997),p.183. Donald Davis and David Weinstein, “An Account of Global Factor Trade,”American Economic Review, vol. 91, No. 5, December 2001, pp. 1423--1453 found thatU.S. production is more capital intensive than any other country in their sample. Giventhat the U.S. economy uses unskilled labor less intensively than the rest of the world, theHeckscher--Ohlin model (specifically, the Stolper--Samuelson theorem) of internationaltrade suggests that more open trade policies should lead to a relative decline in the returnto unskilled labor in the United States. The Heckscher--Ohlin model is reviewed ingreater detail in the chapter 4 discussion of the effect of trade on the distribution ofwages.
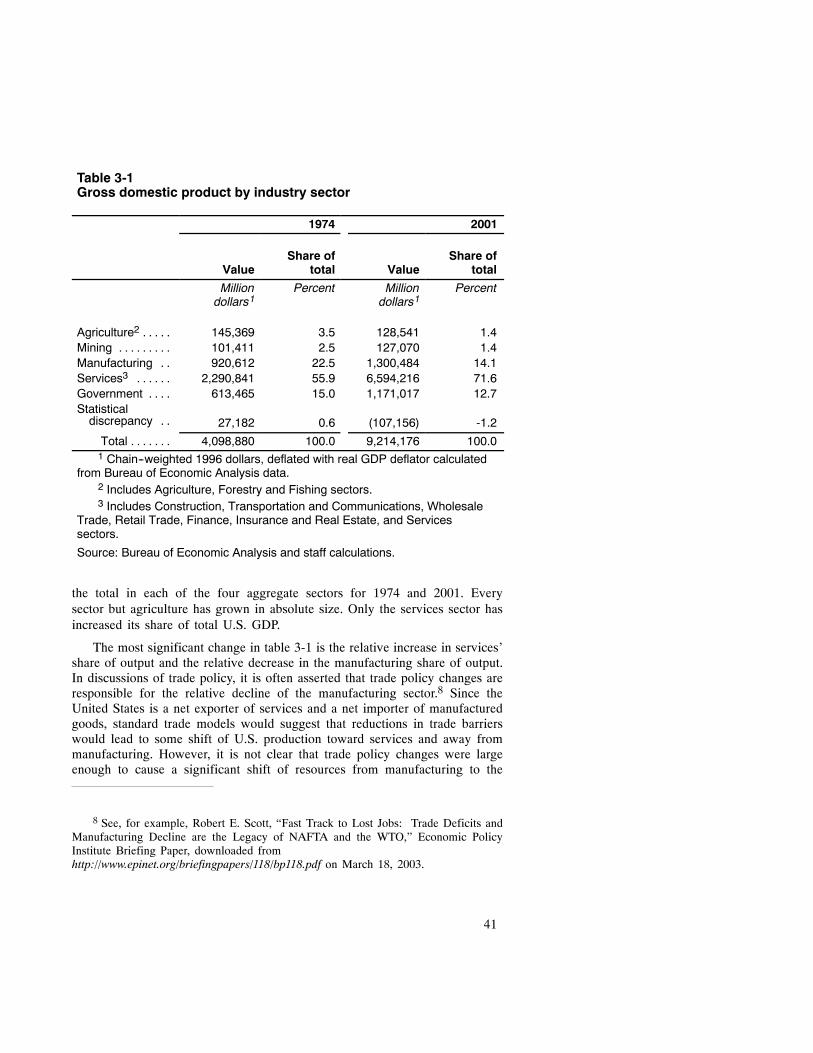
41
Table 3-1Gross domestic product by industry sector
1974 2001
ValueShare of
total ValueShare of
total
Milliondollars1
Percent Milliondollars1
Percent
Agriculture2 . . . . . 145,369 3.5 128,541 1.4Mining . . . . . . . . . 101,411 2.5 127,070 1.4Manufacturing . . 920,612 22.5 1,300,484 14.1Services3 . . . . . . 2,290,841 55.9 6,594,216 71.6Government . . . . 613,465 15.0 1,171,017 12.7Statisticaldiscrepancy . . 27,182 0.6 (107,156) -1.2
Total . . . . . . . 4,098,880 100.0 9,214,176 100.01 Chain--weighted 1996 dollars, deflated with real GDP deflator calculated
from Bureau of Economic Analysis data.2 Includes Agriculture, Forestry and Fishing sectors.3 Includes Construction, Transportation and Communications, Wholesale
Trade, Retail Trade, Finance, Insurance and Real Estate, and Servicessectors.
Source: Bureau of Economic Analysis and staff calculations.
the total in each of the four aggregate sectors for 1974 and 2001. Everysector but agriculture has grown in absolute size. Only the services sector hasincreased its share of total U.S. GDP.
The most significant change in table 3-1 is the relative increase in services’share of output and the relative decrease in the manufacturing share of output.In discussions of trade policy, it is often asserted that trade policy changes areresponsible for the relative decline of the manufacturing sector.8 Since theUnited States is a net exporter of services and a net importer of manufacturedgoods, standard trade models would suggest that reductions in trade barrierswould lead to some shift of U.S. production toward services and away frommanufacturing. However, it is not clear that trade policy changes were largeenough to cause a significant shift of resources from manufacturing to the
8 See, for example, Robert E. Scott, “Fast Track to Lost Jobs: Trade Deficits andManufacturing Decline are the Legacy of NAFTA and the WTO,” Economic PolicyInstitute Briefing Paper, downloaded fromhttp://www.epinet.org/briefingpapers/118/bp118.pdf on March 18, 2003.
42
service sector. A number of other significant changes have occurred thatmight also have contributed to the shift of U.S. output toward services,including increased relative preferences for services by households and firms,rapid productivity growth in manufacturing, and the deregulation of severallarge services industries.
There is considerable evidence that consumers allocate a larger share ofincome toward services as their incomes rise. In an earlier assessment ofcross-country demand patterns, the Commission found that the share ofnational income devoted to consumption of services increases with a country’sper capita income.9 The Commission also found that, for countries with a highper capita GDP, the share of national income devoted to consumption ofmanufactured goods falls as income increases. Since the United States has arelatively high per capita GDP, this analysis suggests that growth in U.S. percapita GDP since 1974 should have increased services’ share of householddemand, and decreased the manufacturing share of household demand.10
Much as the Commission’s earlier analysis suggested, economic growth inthe United States has coincided with an increase in the consumption share ofservices and a decrease in the consumption share of manufactured goods. U.S.per capita GDP increased substantially over the period, from $19,163 in 1974to $32,352 in 2001.11 During that time, services’ share of personalconsumption expenditures went from 45.5 percent to 58.8 percent.12Meanwhile, manufactured goods’ share of consumption expenditures fell from28.0 percent to 24.4 percent.13 One significant reason that U.S. production has
9 USITC, The Dynamic Effects of Trade Liberalization: An Empirical Analysis,Publication 3069, October 1997, Washington, DC.
10 For further evidence on the cross country relationship between services andaverage income, see table 4.2, World Development Indicators 1999, World Bank,Washington, DC, p.194. This evidence shows the share of services in production. Theshare of services in consumption is highly correlated with the share of services inproduction.
11 Measured in constant 1996 dollars. Data are from table 8--7 of USDOC, Bureau ofEconomic Analysis,“National Income and Product Accounts”; downloaded fromhttp://www.bea.doc.gov/bea/dn/nipaweb/ on March 15, 2003.
12 Commission calculations based on table 1--1 of USDOC, Bureau of EconomicAnalysis, “National Income and Product Accounts”; downloaded fromhttp://www.bea.doc.gov/bea/dn/nipaweb on March 21, 2003.
13 Commission calculations based on table 2--2 of USDOC, Bureau of EconomicAnalysis, “National Income and Product Accounts”; downloaded fromhttp://www.bea.doc.gov/bea/dn/nipaweb on March 21, 2003. Reported shares arecalculated from personal expenditures on durable goods plus non--durable goods, exceptfood and energy. The National Income and Product Accounts do not isolatemanufacturing activity in the food and energy sectors. Food processing and energyrefining activities are grouped with agriculture and mining sectors, respectively. Thefigures here exclude food and energy sectors to avoid including non--manufacturingactivities in the measures.
43
shifted toward services is that households have shifted their consumptionpatterns toward services over time.
Firms have also shifted demand toward services over time. In 1977, 40.7percent of economywide expenditures on intermediates went to services; in1999, 57.9 percent of intermediate input expenditures went to services.14 Somepart of the increased industrial demand for services can be attributed to theoverall change in output–a growing services sector demands more services.15Even the manufacturing sector has become more dependent on service inputsover time.16 Some part of this shift can be attributed to domestic outsourcingand related changes in industry employment practices. For example, workersemployed by a temporary service have their employment and value addedattributed to the service sector, even if their work involves manufacturingactivities.17 Management consulting activities are also attributed to the servicessector; these activities would be counted in manufacturing if a manufacturingfirm employed the consultants directly.
A second source of significant structural change has been the sizablechange in the oversight of service sectors. Many large service sectors,including banking, transportation, communications, and energy services,experienced significant deregulation during this period. Historical assessmentssuggest that liberalized sectors experienced price declines of between 25 and
14 Commission calculations based on the 1999 U.S. input--output table fromUSDOC, Bureau of Economic Analysis; data downloaded fromhttp://www.bea.gov/bea/industry/iotables/prod/table_list.cfm?anon=65#Tables on March24, 2003. The 1977 data obtained from Bureau of Economic Analysis staff interviews.
15 A total of 74.2 percent of service industries’ expenditure on intermediates goes toother service industries, and 32 percent of manufacturing expenditures on intermediatesis spent on services. USITC calculations are based on the USDOC, Bureau of EconomicAnalysis’ 1999 U.S. input--output table. Data are available athttp://www.bea.gov/bea/industry/iotables/prod/table_list.cfm?anon=65; downloadedMarch 21, 2003.
16 In 1977, 22.8 percent of manufacturers’ intermediate expenditures were allocatedto services. In 1999, 32 percent of manufacturers intermediate expenditures were onservices. USITC calculations are based on the USDOC, Bureau of Economic Analysis’input--output tables available athttp://www.bea.gov/bea/industry/iotables/prod/table_list.cfm?anon=65; downloadedMarch 21, 2003.
17 Segal and Sullivan estimate that employees of temporary services firms accountfor 4.5 percent of all manufacturing employment. See Lewis M. Segal and Daniel GSullivan, 1997, “The Growth of Temporary Services Work,” Journal of EconomicPerspectives vol. 11, 2, p 122.
44
75 percent.18 Given the service sector’s relatively small exposure to trade,19
domestic deregulation probably had a more significant impact on thehistorical experience of the service sector. Since service sectors account forsuch a large share of output, the economywide impact of service sectorderegulation was likely larger than the impact of the five trade agreements.20
Perhaps the most significant change in the manufacturing sector during thisperiod has been the rapid increase in manufacturing productivity.21 Figure 3-1shows productivity indices for the manufacturing sector and for the totalbusiness sector, which includes manufacturing as well as all other privatesector output, particularly services. Output per hour in the manufacturing sectorincreased 132 percent between 1974 and 2001. The broader business sector sawoutput per hour rise by only 69 percent over the same period. Manufacturingproductivity increases have allowed total manufacturing output and value addedto increase, even as manufacturing employment has fallen. Table 3-2 reportsemployment shares by industry for 1974 and 2001.
There have also been significant changes in the composition of outputwithin the broad sectors just described. Table 3-3 reports changes in valueadded by manufacturing sector since 1977.22 A sector’s value added is its
18 Clifford Winston, “U.S. Industry Adjustment to Economic Deregulation,” Journalof Economic Perspectives, vol. 12, No. 3, Summer 1998, p.98. Significant price declinesin the service sector would only increase the share of services expenditure if consumerdemand for services is elastic. That is, if a 1 percent price decline induces consumers toincrease their consumption of services by more than one percent, price declinesassociated with deregulation would increase the share of services in consumers’ budgets.
19 In 2001, services accounted for 71.6 percent of output, 27.6 percent of exportsand 14.9 percent of imports.
20 Winston (1998) cites conservative estimates of the net benefits from thederegulation of inter--city transportation, such as airlines, railroads and motor carriers,which indicate deregulation of these sectors produced net benefits of $50 billion in 1996dollars. The estimate in chapter 7 attributes a welfare gain of $56 billion to the five tradeagreements. Since services deregulation also included sizable sectors not included inWinston’s estimate (i.e. telecommunications, banking, natural gas and electricity), theimpact of services deregulation was almost certainly larger than the impact of the fiveagreements.
21 There is some evidence that increased trade, particularly increased imports,contributed to the growth in U.S. manufacturing productivity. This evidence is reviewedin chapter 4. Technological changes, increased capital intensity and increased skill levelsof U.S. workers may also have played a role. The relative importance of various sourcesof productivity growth is considered in further detail later in this chapter.
22 Data were not available for years prior to 1977. The Standard IndustrialClassification (SIC) data system was revised in 1987, so it is difficult to summarize someof the industry experiences over the entire period.
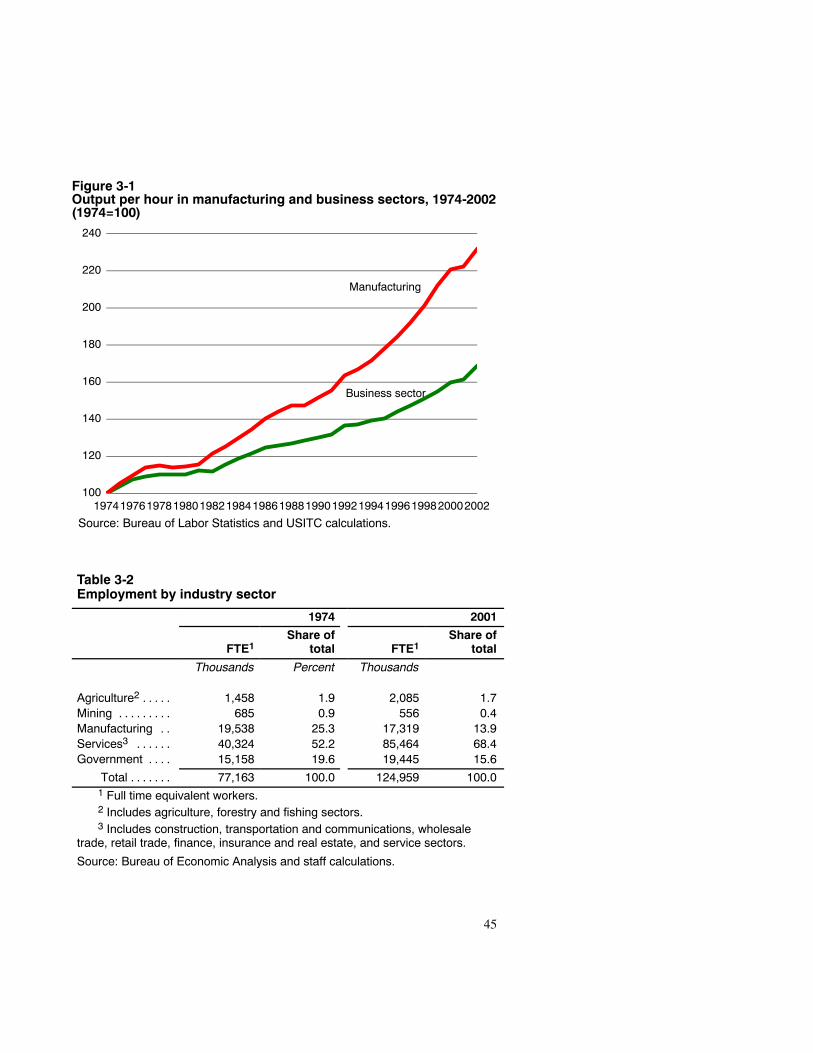
45
Figure 3-1Output per hour in manufacturing and business sectors, 1974-2002(1974=100)
100
120
140
160
180
200
220
240
197419761978198019821984198619881990199219941996199820002002
Source: Bureau of Labor Statistics and USITC calculations.
Manufacturing
Business sector
Table 3-2Employment by industry sector
1974 2001
FTE1Share of
total FTE1Share of
total
Thousands Percent Thousands
Agriculture2 . . . . . 1,458 1.9 2,085 1.7Mining . . . . . . . . . 685 0.9 556 0.4Manufacturing . . 19,538 25.3 17,319 13.9Services3 . . . . . . 40,324 52.2 85,464 68.4Government . . . . 15,158 19.6 19,445 15.6
Total . . . . . . . 77,163 100.0 124,959 100.01 Full time equivalent workers.2 Includes agriculture, forestry and fishing sectors.3 Includes construction, transportation and communications, wholesale
trade, retail trade, finance, insurance and real estate, and service sectors.
Source: Bureau of Economic Analysis and staff calculations.
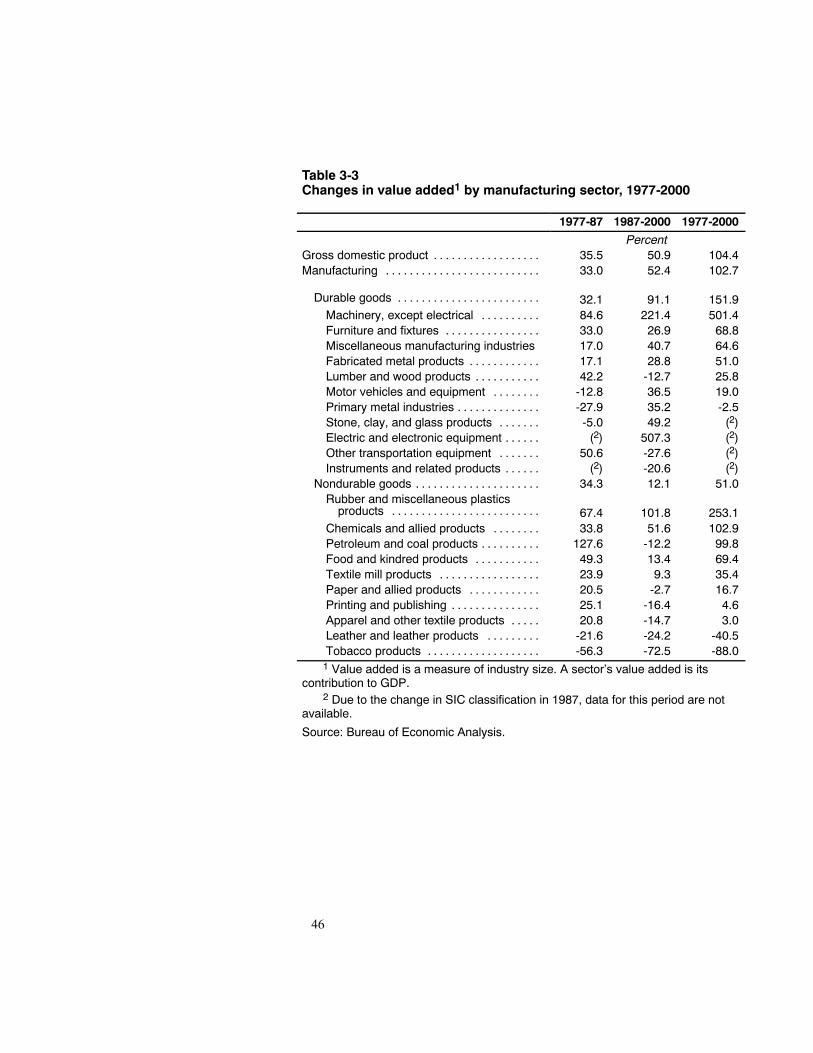
46
Table 3-3Changes in value added1 by manufacturing sector, 1977-2000
1977-87 1987-2000 1977-2000
PercentGross domestic product . . . . . . . . . . . . . . . . . . 35.5 50.9 104.4Manufacturing . . . . . . . . . . . . . . . . . . . . . . . . . . 33.0 52.4 102.7
Durable goods . . . . . . . . . . . . . . . . . . . . . . . . 32.1 91.1 151.9Machinery, except electrical . . . . . . . . . . 84.6 221.4 501.4Furniture and fixtures . . . . . . . . . . . . . . . . 33.0 26.9 68.8Miscellaneous manufacturing industries 17.0 40.7 64.6Fabricated metal products . . . . . . . . . . . . 17.1 28.8 51.0Lumber and wood products . . . . . . . . . . . 42.2 -12.7 25.8Motor vehicles and equipment . . . . . . . . -12.8 36.5 19.0Primary metal industries . . . . . . . . . . . . . . -27.9 35.2 -2.5Stone, clay, and glass products . . . . . . . -5.0 49.2 (2)Electric and electronic equipment . . . . . . (2) 507.3 (2)Other transportation equipment . . . . . . . 50.6 -27.6 (2)Instruments and related products . . . . . . (2) -20.6 (2)
Nondurable goods . . . . . . . . . . . . . . . . . . . . . 34.3 12.1 51.0Rubber and miscellaneous plasticsproducts . . . . . . . . . . . . . . . . . . . . . . . . . 67.4 101.8 253.1
Chemicals and allied products . . . . . . . . 33.8 51.6 102.9Petroleum and coal products . . . . . . . . . . 127.6 -12.2 99.8Food and kindred products . . . . . . . . . . . 49.3 13.4 69.4Textile mill products . . . . . . . . . . . . . . . . . 23.9 9.3 35.4Paper and allied products . . . . . . . . . . . . 20.5 -2.7 16.7Printing and publishing . . . . . . . . . . . . . . . 25.1 -16.4 4.6Apparel and other textile products . . . . . 20.8 -14.7 3.0Leather and leather products . . . . . . . . . -21.6 -24.2 -40.5Tobacco products . . . . . . . . . . . . . . . . . . . -56.3 -72.5 -88.01 Value added is a measure of industry size. A sector’s value added is its
contribution to GDP.2 Due to the change in SIC classification in 1987, data for this period are not
available.
Source: Bureau of Economic Analysis.
47
contribution to GDP.23 Growth in manufacturing value added has been mostrapid in machinery, electronic equipment, and rubber and plastic products.Total value added in primary metal industries, tobacco products, and leatherproducts has fallen. As with the broader sectoral classifications discussedabove, there are a number of reasons why sectors might grow at differingrates, including changes in relative demands, technical change, and changesin trade patterns. Specific industry experiences are discussed in greater detailin chapter 5.
Cross-industry Reallocation and FrictionalUnemployment
Changes in the composition of output may require productive resources tomove from the sectors in relative decline to the sectors that are experiencingrelative growth. The reallocation of resources across sectors can produceunemployment of inputs in the short- to medium-term.24 For example, workersdisplaced from a shrinking sector may not have the appropriate skills to findjobs in growing sectors. Even if their skills are appropriate for work in growingsectors, workers leaving shrinking sectors may require some time to identifyother jobs for which they are qualified.25 Unemployment associated with themovement of resources between sectors is called “frictional” unemployment.26
Unemployment may also arise because macroeconomic fluctuations leadfirms to require less labor during recessions or periods of slower economicgrowth. Fluctuations in the macroeconomy cause changes in the level ofcyclical unemployment. When GDP is growing rapidly, cyclical unemploymentfalls. When GDP is falling (or growing slowly) cyclical unemployment rises.
23 Sector value added is the difference between a sector’s sales and its cost ofmaterials. As the portion of revenues not allocated to materials, sector value addedrepresents income earned by one or more factors of production.
24 Many international trade models abstract from frictional unemploymentassociated with the movement of resources between sectors. For a theoretical perspectiveon trade, the movement of labor between sectors, and frictional unemployment, see CarlDavidson and Steven J. Matusz, 2000, “Globalization and Labour--Market Adjustment:How Fast and at What Cost?” Oxford Review of Economic Policy, vol. 16, No. 3, pp42--56.
25 Some discussions of unemployment distinguish structural unemployment (theunemployed worker’s skills are not appropriate for any available job) and frictionalunemployment (the unemployed worker’s skills are appropriate for a job that exists, theworker has simply not found that job yet). For the purposes of this discussion frictionalunemployment is intended to include both types of unemployment.
26 The phenomenon is not constrained to labor adjustment. Changes in thecomposition of output may also lead sector--specific capital to go unused.
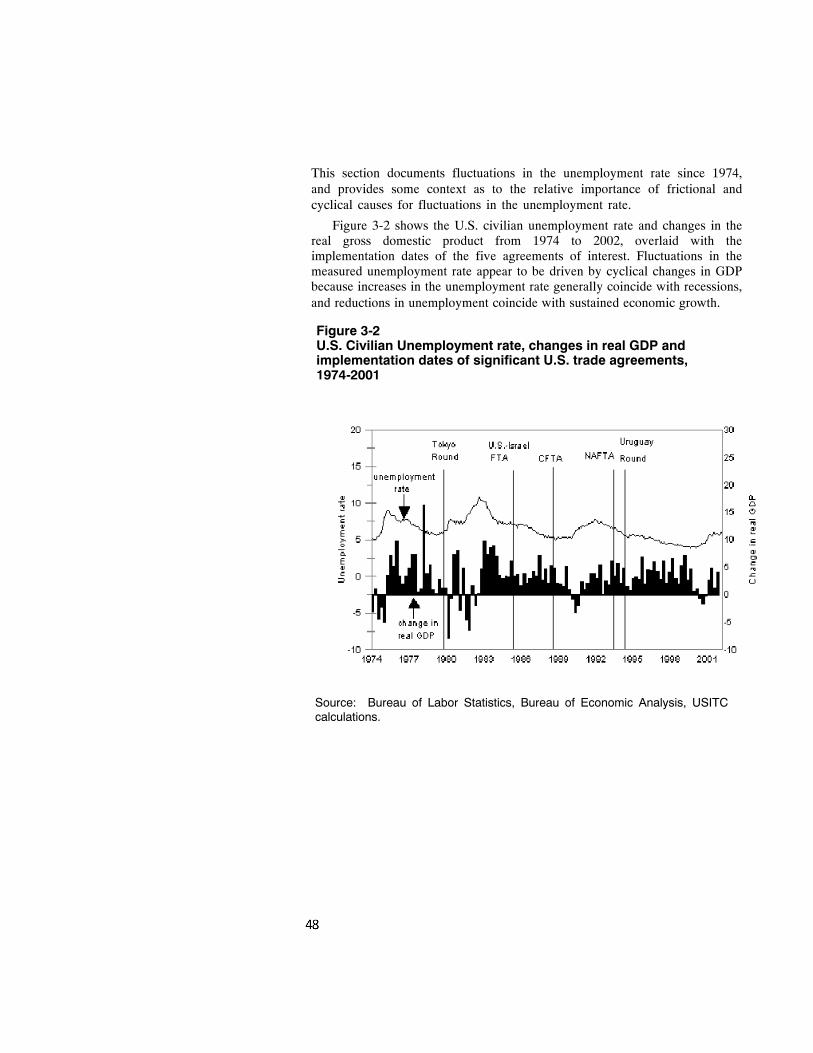
48
This section documents fluctuations in the unemployment rate since 1974,and provides some context as to the relative importance of frictional andcyclical causes for fluctuations in the unemployment rate.
Figure 3-2 shows the U.S. civilian unemployment rate and changes in thereal gross domestic product from 1974 to 2002, overlaid with theimplementation dates of the five agreements of interest. Fluctuations in themeasured unemployment rate appear to be driven by cyclical changes in GDPbecause increases in the unemployment rate generally coincide with recessions,and reductions in unemployment coincide with sustained economic growth.
Figure 3-2U.S. Civilian Unemployment rate, changes in real GDP andimplementation dates of significant U.S. trade agreements,1974-2001
Source: Bureau of Labor Statistics, Bureau of Economic Analysis, USITCcalculations.
49
Statements linking employment levels with the trade balance emergefrequently in public policy debate.27 However, a historical review of U.S. tradedeficit and unemployment figures suggests that periods of increased tradedeficits have been associated with low unemployment, and vice versa. Like theunemployment rate, changes in the trade balance are primarily driven bychanges in macroeconomic circumstances. Periods of strong economic growthfuel increasing demand for all goods, including imported products, increasingthe demand for labor and reducing unemployment.28 Figure 3-3 shows thatcyclical increases in the trade deficit are typically associated with decreases inthe unemployment rate.
Post-employment Experiences of Displaced WorkersWhile there do not appear to have been structural changes in the
unemployment rate over the period, one topic of interest to policy makers isthe experience of workers who are displaced as a result of economic change. Agrowing body of research explores information contained in the DisplacedWorker Survey, which reports the characteristics and experiences of workerswhose job losses are due to a plant closing, an employer going out of business,or a layoff from which he/she was not recalled.29 These figures count thenumber of workers who lost their jobs in a particular manner. They are not ameasure of economywide employment. The primary reason for collecting
27 See, for example, Robert E. Scott, “NAFTA’s Hidden Costs,” in NAFTA at Seven(Washington, DC: Economic Policy Institute, 2001), p. 3, and Gary C. Hufbauer andJeffrey J. Schott, NAFTA: An Assessment (Washington, D.C.: Institute for InternationalEconomics, 1993), p.14. Scott argues that an increase in the U.S. bilateral trade deficitswith Canada and Mexico of $46.2 billion induced 766,030 actual and potential lost jobs.Hufbauer and Schott use a similar methodology in a forward--looking evaluation ofNAFTA. They assume that NAFTA would reduce the trade deficit, and attribute 170,000new jobs to NAFTA. Trade--deficit--driven “job--counting” exercises do not take intoaccount the ability of trade policy changes to affect the relative price of inputs, nor dothey consider behavioral responses to relative price change.
28 The trade deficit has grown over time, from 0.3 percent of GDP in 1974 to 3.6percent of GDP in 2001. International economists attribute growth in the trade deficit toincreased U.S. borrowing on international financial markets. Because U.S. nationalsavings have not kept pace with the borrowing requirements of U.S. households, firmsand governments, the United States has become a net borrower from the rest of theworld. An accounting identity equates the current account deficit (a broad measure of thetrade deficit) and the capital account surplus. In order to be a net borrower ofinternational assets, the U.S. must have a current account deficit. See Krugman andObstfeld, 2000, pp. 300--322.
29 The Displaced Worker Survey is a supplement to the Current Population Surveycollected by the U.S. Census Bureau on behalf of the Bureau of Labor Statistics. Thedata are available at http://www.bls.census.gov/cps/dispwkr/sdata.htm.
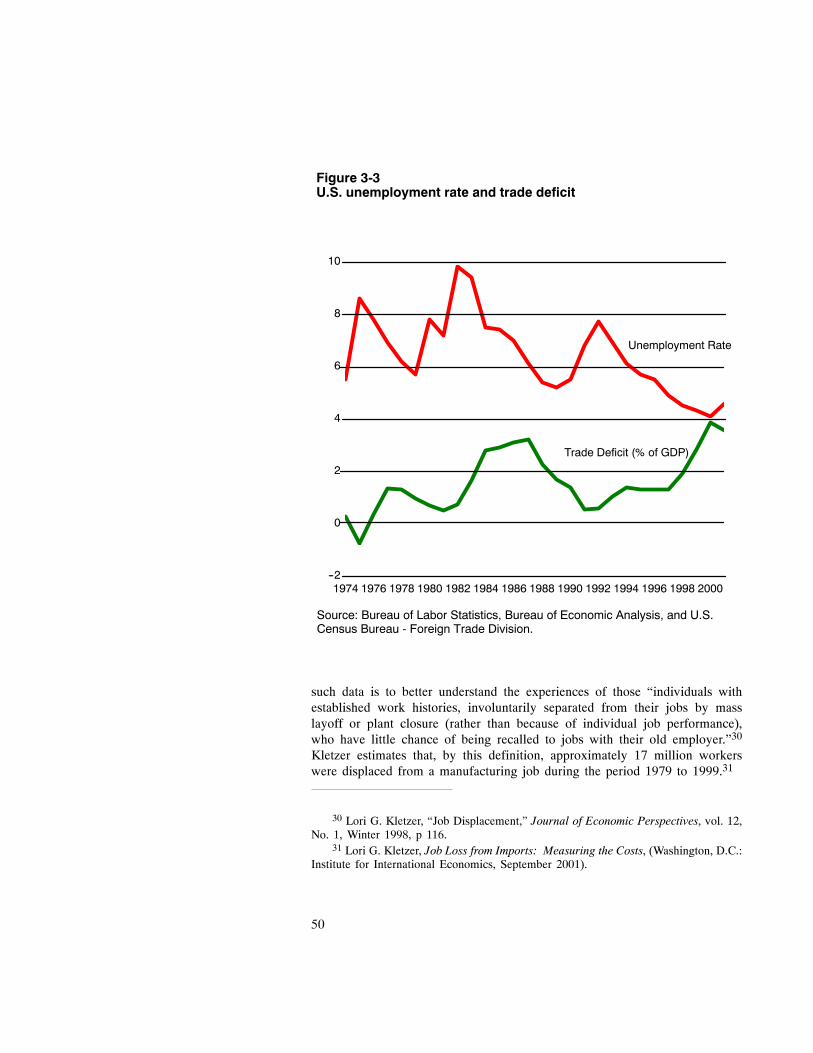
50
Figure 3-3U.S. unemployment rate and trade deficit
--2
0
2
4
6
8
10
1974 1976 1978 1980 1982 1984 1986 1988 1990 1992 1994 1996 1998 2000
Source: Bureau of Labor Statistics, Bureau of Economic Analysis, and U.S.Census Bureau - Foreign Trade Division.
Unemployment Rate
Trade Deficit (% of GDP)
such data is to better understand the experiences of those “individuals withestablished work histories, involuntarily separated from their jobs by masslayoff or plant closure (rather than because of individual job performance),who have little chance of being recalled to jobs with their old employer.”30
Kletzer estimates that, by this definition, approximately 17 million workerswere displaced from a manufacturing job during the period 1979 to 1999.31
30 Lori G. Kletzer, “Job Displacement,” Journal of Economic Perspectives, vol. 12,No. 1, Winter 1998, p 116.
31 Lori G. Kletzer, Job Loss from Imports: Measuring the Costs, (Washington, D.C.:Institute for International Economics, September 2001).
51
Assessments of Displaced Worker Survey data suggest that displacementsare strongly cyclical, with job loss rates rising in recessions and falling inexpansions.32 Displaced workers report longer periods of unemployment thanworkers who are laid off from jobs in which they expect to be reemployed.33Farber finds that over the period 1981-1995, post-displacement earnings were13 percent lower than pre-displacement earnings. Earnings losses were notuniform across all displaced workers– approximately one-third of displacedworkers report earnings losses of 25 percent or more, whereas 30 to 40 percentreport earning more in their post-displacement job than on theirpre-displacement job.34 A study of tax returns from Pennsylvania found that 4years after displacement, displaced workers earned $2000 per quarter less thanequivalent workers that were not displaced.35 Kletzer cautions that data fromPennsylvania, a traditional industrial state, may not be representative.36
A significant reason for earnings losses is the inability of displaced workersto find full-time employment.37 The evidence also suggests that the probabilityof unemployment is associated with various characteristics of displacedworkers. Farber finds that those without a college degree, women, andminorities are at a disadvantage in finding subsequent employment.38 Kletzercites a number of papers that find that “the post-displacement earnings of thosewho change industry are lower than the earnings of comparable individualswho stay in the same industry.”39 Chapter 4 presents evidence that thepost-displacement experiences of workers displaced from sectors with largeimport shares are reasonably similar to the experiences of other workersdisplaced from manufacturing overall.
Economic Growth and ProductivityThe U.S. economy has experienced substantial growth since 1974. In that
year, real GDP was $4.1 trillion; by 2001 it was $9.2 trillion.40 This change
32 Kletzer, 1998, p. 117.33 Ibid., p. 121.34 Henry S. Farber, 1997, “The Changing Face of Job Loss in the United States,”
Industrial Relations Section Working Paper 382, Princeton University, cited in Kletzer,1998, p. 123.
35 Louis S. Jacobson, Robert J. LaLonde, and Daniel G. Sullivan, The Costs ofWorker Dislocation (Kalamazoo, MI: W.E. Upjohn Institute for Employment Research,1993), pp. 124--126, cited in Kletzer, 1998.
36 Kletzer, 1998, p. 126.37 Ibid., p. 124.38 Farber 1997, cited in Kletzer 1998, p.123.39 Kletzer, 1998, p. 129.40 Measured in 1996 chain--weighted dollars. USDOC, Bureau of Economic
Analysis, “Survey of Current Business,” August 2002.
52
represents a 3 percent average annual growth rate over the period.41 Thesimplest models of economic growth suggest a number of reasons for growthin real GDP since 1974.42 Population growth and higher work forceparticipation rates have produced a much larger labor supply and growingemployment. The American labor supply also has become more productivebecause current workers are better educated than workers in the 1970s.Another source of economic growth and increased labor productivity hasbeen substantial growth in the capital stock. Finally, there is evidence thatinputs are being combined more efficiently than they were in the past, asmeasures of total factor productivity have also risen. Each of these sources ofgrowth is discussed in more detail in the next section.
Growth in Factor InputsOne important reason U.S. GDP has risen since 1974 has been the
substantial growth in the supply of labor.43 In 1974, total nonfarm employmentin the United States was 78.3 million; by 2001, it had reached 131.9 million, a68 percent increase.44 One reason for labor force growth has been growth inthe U.S. population, from 213.8 million45 in 1974 to 277.8 million46 in 2001, a30 percent increase.47 The labor supply is also larger because labor forceparticipation rates have grown, from 61.3 percent in January 1974 to 66.8percent in December 2001.48 Female labor force participation rates have growneven faster, from 45.1 to 60.0 percent over the same period.49
41 Commission calculations.42 For an introduction to models of economic growth, see Robert Barro and Xavier
Sala-i-Martin, Economic Growth (New York: McGraw--Hill Inc., 1995). The sources ofgrowth identified in this paragraph are consistent with the model proposed in N. GregoryMankiw, David Romer and David N. Weil, “A Contribution to the Empirics of EconomicGrowth,” Quarterly Journal of Economics, vol. 107, No. 2 May, pp. 407--437.
43 Discussions of macroeconomic fluctuations often attribute growth in employmentto growing GDP. Since this discussion focuses on sources of long run growth in GDP, ittreats GDP growth as an outcome of a growing labor supply. This treatment is consistentwith the literature on long--run economic growth.
44 U.S. Bureau of labor statistics. Found at internet addresshttp://data.bls.gov/cgi--bin/surveymost?ee, retrieved Jan. 16, 2003.
45 U.S. Census Bureau. Found at Internet addresshttp://eire.census.gov/popest/archives/pre1980/popclockest.txt, retrieved Jan. 16, 2003
46 U.S. Census Bureau projection. Found at internet addresshttp://www.census.gov/population/projections/nation/summary/np--t1.pdf.Retrieved Jan. 16, 2003.
47 Commission calculation.48 Civilian labor force participation rate, U.S. Department of Labor (USDOL),
Bureau of Labor Statistics. Found at Internet address http://www.bls.gov/cps/home.htm,retrieved Jan. 16, 2003.
49 Ibid.
53
A second source of GDP growth has been growth in the stock ofcapital–the machinery, equipment, factories, infrastructure, and otherinvestment goods that make future production possible. In 2001, the total valueof private fixed assets (measured in current dollars) was $22.1 trillion, a 109percent increase in real terms from 1974.50 The capital stock is theaccumulated value of past investment, net of depreciation. Gross privatedomestic investment as a share of GDP has risen over the period, from 13.7percent in 1974 to 17.1 percent in 2001.51
Productivity Measures and Changes inProductivity
While increases in labor supply and the capital stock have been important,another component of economic growth has been improvements in the overallefficiency of U.S. production. In the discussion of sectoral experiences, it wasnoted that output per hour had increased over the period, especially in themanufacturing sector. The “output per hour”measure, also known as “laborproductivity,” is the most straightforward measure of productivity growth.However, as the broadest measure of productivity, the labor productivitymeasure commingles several sources of productivity growth.
Labor productivity in the private business sector increased by 69 percentbetween 1974 and 2001, while labor productivity in the narrowermanufacturing sector increased by 132 percent. While labor productivity is thebroadest and most easily understood measure of productivity, it does notdifferentiate between various sources of productivity growth. Growth in laborproductivity only indicates that output is growing faster than employment.
A significant contributor to labor productivity growth has been growth inthe capital intensity of production. As noted, the capital stock grew by 109percent between 1974 and 2001, while employment grew by 69 percent. Thesedifferential rates of growth imply that the amount of capital per worker (thecapital intensity of production) has increased.
For many purposes, economists wish to distinguish between increasedcapital intensity and other sources of productivity change. The primary measureof productivity used in the studies reviewed next is total-factor productivity
50 Measured by chain--weighted quantity index (1996=100) of net fixed assets in theUnited States. Figures are net of depreciation, meaning that the capital stock does notinclude machinery or equipment that has outlived its own productive life ( worn out).USDOC, Bureau of Economic Analysis, “National Incomes and Product Accounts,”tables 2.1 and 2.2, found at Internet addresshttp://www.bea.gov/bea/dn/faweb/AllFATables.asp, retrieved Jan. 16, 2003.
51 Commission calculations based on data from USDOC, Bureau of EconomicAnalysis, “National Incomes and Product Accounts, found at internet addresshttp://www.bea.gov/bea/dn/nipaweb/index.asp, retrieved Jan. 16, 2003.
54
(TFP), which measures those changes in U.S. output that cannot be explainedby growth in the labor supply and capital stock.52 TFP is a residual measure,with some portion of real GDP growth attributed to growth in the capitalstock and the labor supply; and the remaining growth attributed to TFP.Increases in TFP can be attributed to technological change, education,efficiency improvements, returns to scale, reallocation of resources, and otherfactors. Increases in TFP may have been influenced by growing internationaltrade.
TFP has been an important source of economic growth in the past fewdecades. The U.S. Department of Labor’s Bureau of Labor Statisticscalculations indicate that TFP in the private business sector rose by 24.5percent between 1974 and 2000.53 This calculation suggests that even had thesize of the labor force and capital stock remained constant, private businesssector output would have risen by 24.5 percent simply because existing capitaland labor are now combined more efficiently than they were in 1974. TFP hasgrown even faster in the manufacturing sector–a 35.7 percent increase from1974 to 2000.54
One important component of TFP is human capital, the set of knowledge,skills, and experience embodied in the labor force. Education statistics arethought to be an indicative measure of the economywide stock of humancapital. The U.S. labor force is better educated than it was in 1974. At thattime, 61.2 percent of Americans over the age of 25 had completed 4 years ofhigh school, and 13.3 percent had completed 4 years of college. By 2000, thenumber of Americans over 25 years of age who completed 4 years of highschool had risen to 84.1 and those that had completed 4 years of college rose to
52 For more on TFP, also known as multifactor productivity, see USDOL, Bureau ofLabor Statistics,. “Why is Multi--factor productivity important?” Found at Internetaddress http://wwwbls.gov, retrieved Oct. 16, 2002.
53 Commission calculations based on data from USDOL, Bureau of Labor Statistics.Data available at http://www.bls.gov/news.release/prod3.t01.htm, retrieved Jan. 16, 2003.
54 Commission calculations based on data from USDOL, Bureau of Labor Statistics.Data available at http://www.bls.gov/news.release/prod5.t01.htm, retrieved Jan. 16, 2003.Measures of manufacturing productivity also account for changes in the prices ofmaterials and energy, since these are significant inputs into manufacturing activities. Fora detailed explanation of methods used to measure productivity in manufacturing, seeWilliam Gullickson, “Measurement of productivity growth in manufacturing,” MonthlyLabor Review, July 1995, available at http://www.bls.gov/opub/mlr/1995/07/art2full.pdf.One reason such adjustments are necessary for the years 1974--2001 is the fall in the realprice of energy. Refiners’ crude oil acquisition costs (measured in 1996 dollars) were$24.77 per barrel of oil in 1974. By 2001, they had fallen to $20.77 per barrel. See U.S.Energy Information Administration data available athttp://www.eia.doe.gov/emeu/aer/pdf/pages/sec5--201.pdf.
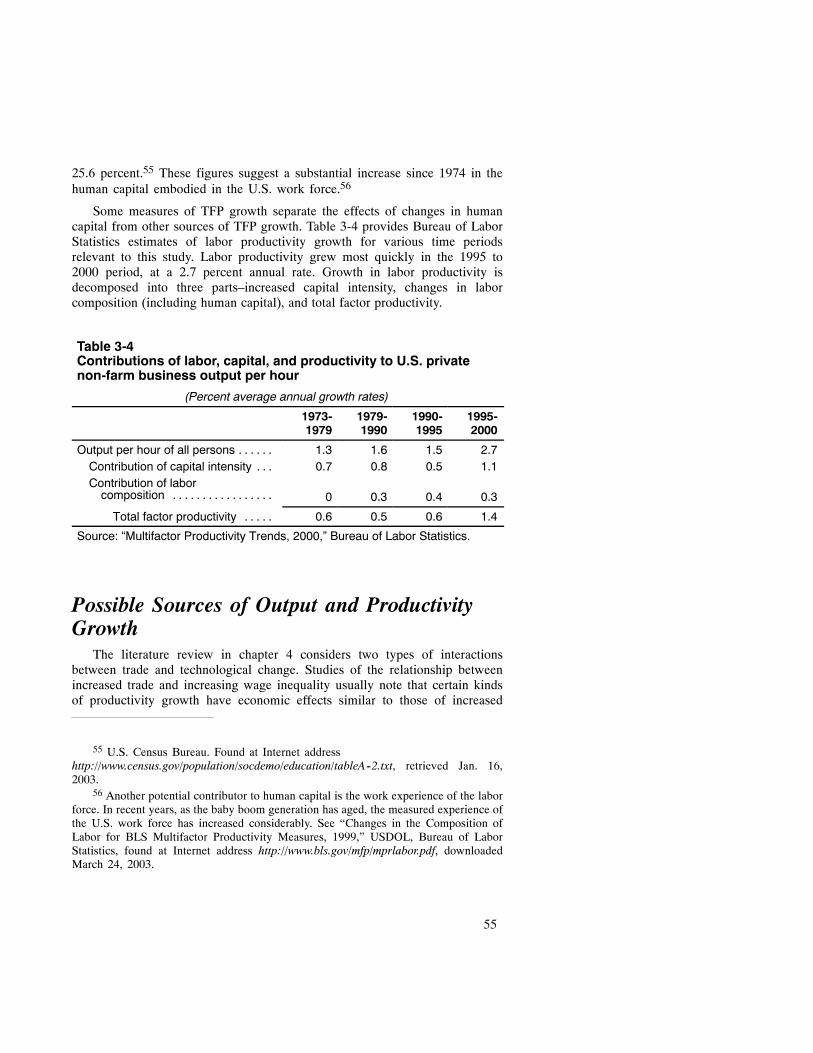
55
25.6 percent.55 These figures suggest a substantial increase since 1974 in thehuman capital embodied in the U.S. work force.56
Some measures of TFP growth separate the effects of changes in humancapital from other sources of TFP growth. Table 3-4 provides Bureau of LaborStatistics estimates of labor productivity growth for various time periodsrelevant to this study. Labor productivity grew most quickly in the 1995 to2000 period, at a 2.7 percent annual rate. Growth in labor productivity isdecomposed into three parts–increased capital intensity, changes in laborcomposition (including human capital), and total factor productivity.
Table 3-4Contributions of labor, capital, and productivity to U.S. privatenon-farm business output per hour
(Percent average annual growth rates)
1973-1979
1979-1990
1990-1995
1995-2000
Output per hour of all persons . . . . . . 1.3 1.6 1.5 2.7Contribution of capital intensity . . . 0.7 0.8 0.5 1.1Contribution of laborcomposition . . . . . . . . . . . . . . . . . 0 0.3 0.4 0.3
Total factor productivity . . . . . 0.6 0.5 0.6 1.4
Source: “Multifactor Productivity Trends, 2000,” Bureau of Labor Statistics.
Possible Sources of Output and ProductivityGrowth
The literature review in chapter 4 considers two types of interactionsbetween trade and technological change. Studies of the relationship betweenincreased trade and increasing wage inequality usually note that certain kindsof productivity growth have economic effects similar to those of increased
55 U.S. Census Bureau. Found at Internet addresshttp://www.census.gov/population/socdemo/education/tableA--2.txt, retrieved Jan. 16,2003.
56 Another potential contributor to human capital is the work experience of the laborforce. In recent years, as the baby boom generation has aged, the measured experience ofthe U.S. work force has increased considerably. See “Changes in the Composition ofLabor for BLS Multifactor Productivity Measures, 1999,” USDOL, Bureau of LaborStatistics, found at Internet address http://www.bls.gov/mfp/mprlabor.pdf, downloadedMarch 24, 2003.
56
trade.57 Other studies explore the possibility that more open trade contributesto faster productivity growth. If increased international trade contributes toproductivity growth, some of the effects of technological change can beattributed to trade and trade policy. This chapter explores sources ofproductivity growth that are not directly associated with trade.
A growing body of literature considers the effects of technical innovationin information technology sectors58 during a time period that roughly coincideswith years in which the trade agreements of interest were enacted. Recentresearch has paid special attention to the role of information technology as asource of productivity growth. There is some disagreement about the degree towhich information technology has had broad economywide effects onproductivity. Some authors attribute significant economywide changes inmeasures of productivity to information technology.59 Others argue that theproductivity-enhancing effects of information technology have largely beenlimited to durable goods manufacturing sectors.60 Evidence of substantialtechnological change suggests that it is a significant source of economicchange, particularly in manufacturing, and warrants discussion as a plausiblealternative to trade growth in explaining various economic outcomes.
Changes in the Distribution of WagesAcross Measures of Skill
One topic of concern to trade policy makers and empirical economists hasbeen the growing gap between the wages paid to skilled and unskilled labor.Economic research reviewed in chapter 4 suggests that growing internationaltrade has contributed to growth in the skilled wage premium, though otherfactors like technological change appear to be more important. There are anumber of measurement issues that complicate efforts to determine the effectsof trade and other causes on the skilled wage premium. This section reviewsthe relevant measurement issues, describes the historical experience of thewage distribution since the mid-1970s, and reviews those sources of economicchange that might have contributed to a growing skill-premium.
57 Technological progress that increases the productivity of one input relative toanother can either magnify or offset the impact of trade on the returns to the owners ofeach input. In the following discussion, skill--augmenting technological change is themost relevant kind of productivity growth. One example of skill augmentingtechnological change is the introduction of new technologies that increase the
58 Authors sometimes differ in the sectors considered to be information technologysectors. productivity of skilled workers more than they increase the productivity ofunskilled workers.
59 Dale Jorgenson, “Information Technology and the U.S. Economy,” AmericanEconomic Review, vol. 91, No. 1, 2001, pp. 1--32. Jorgenson defines informationtechnology as computers, communications equipment and software.
60 Robert J. Gordon, “Does the New Economy Measure Up to the Great Inventionsof the Past?” Journal of Economic Perspectives, vol. 14, No. 4, 2000, pp 49--74.
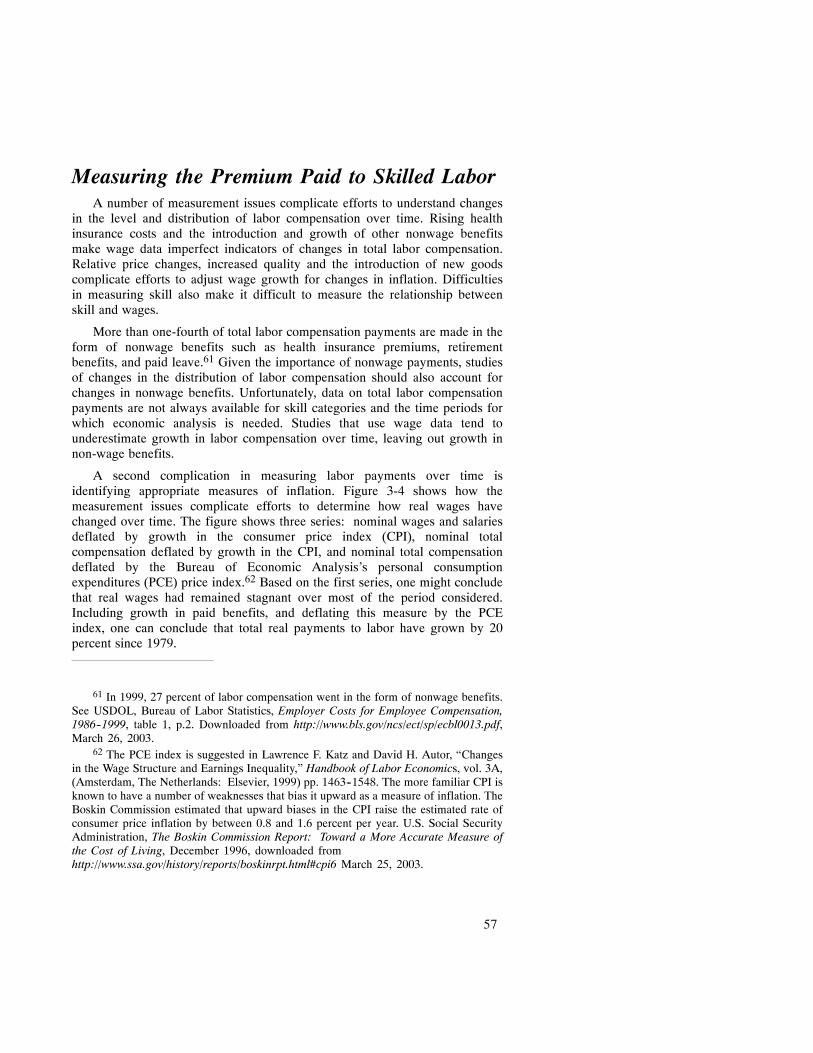
57
Measuring the Premium Paid to Skilled LaborA number of measurement issues complicate efforts to understand changes
in the level and distribution of labor compensation over time. Rising healthinsurance costs and the introduction and growth of other nonwage benefitsmake wage data imperfect indicators of changes in total labor compensation.Relative price changes, increased quality and the introduction of new goodscomplicate efforts to adjust wage growth for changes in inflation. Difficultiesin measuring skill also make it difficult to measure the relationship betweenskill and wages.
More than one-fourth of total labor compensation payments are made in theform of nonwage benefits such as health insurance premiums, retirementbenefits, and paid leave.61 Given the importance of nonwage payments, studiesof changes in the distribution of labor compensation should also account forchanges in nonwage benefits. Unfortunately, data on total labor compensationpayments are not always available for skill categories and the time periods forwhich economic analysis is needed. Studies that use wage data tend tounderestimate growth in labor compensation over time, leaving out growth innon-wage benefits.
A second complication in measuring labor payments over time isidentifying appropriate measures of inflation. Figure 3-4 shows how themeasurement issues complicate efforts to determine how real wages havechanged over time. The figure shows three series: nominal wages and salariesdeflated by growth in the consumer price index (CPI), nominal totalcompensation deflated by growth in the CPI, and nominal total compensationdeflated by the Bureau of Economic Analysis’s personal consumptionexpenditures (PCE) price index.62 Based on the first series, one might concludethat real wages had remained stagnant over most of the period considered.Including growth in paid benefits, and deflating this measure by the PCEindex, one can conclude that total real payments to labor have grown by 20percent since 1979.
61 In 1999, 27 percent of labor compensation went in the form of nonwage benefits.See USDOL, Bureau of Labor Statistics, Employer Costs for Employee Compensation,1986--1999, table 1, p.2. Downloaded from http://www.bls.gov/ncs/ect/sp/ecbl0013.pdf,March 26, 2003.
62 The PCE index is suggested in Lawrence F. Katz and David H. Autor, “Changesin the Wage Structure and Earnings Inequality,” Handbook of Labor Economics, vol. 3A,(Amsterdam, The Netherlands: Elsevier, 1999) pp. 1463--1548. The more familiar CPI isknown to have a number of weaknesses that bias it upward as a measure of inflation. TheBoskin Commission estimated that upward biases in the CPI raise the estimated rate ofconsumer price inflation by between 0.8 and 1.6 percent per year. U.S. Social SecurityAdministration, The Boskin Commission Report: Toward a More Accurate Measure ofthe Cost of Living, December 1996, downloaded fromhttp://www.ssa.gov/history/reports/boskinrpt.html#cpi6 March 25, 2003.
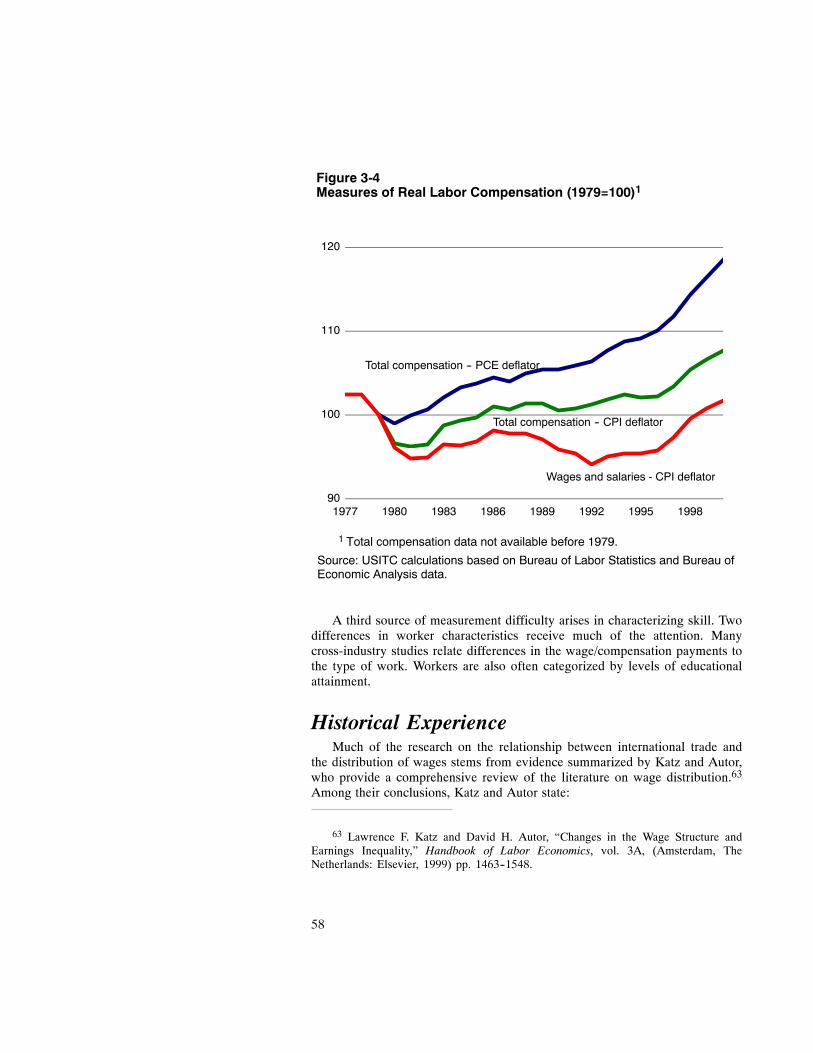
58
Figure 3-4Measures of Real Labor Compensation (1979=100)1
90
100
110
120
1977 1980 1983 1986 1989 1992 1995 1998
Total compensation -- PCE deflator
Total compensation -- CPI deflator
1 Total compensation data not available before 1979.
Source: USITC calculations based on Bureau of Labor Statistics and Bureau ofEconomic Analysis data.
Wages and salaries - CPI deflator
A third source of measurement difficulty arises in characterizing skill. Twodifferences in worker characteristics receive much of the attention. Manycross-industry studies relate differences in the wage/compensation payments tothe type of work. Workers are also often categorized by levels of educationalattainment.
Historical ExperienceMuch of the research on the relationship between international trade and
the distribution of wages stems from evidence summarized by Katz and Autor,who provide a comprehensive review of the literature on wage distribution.63Among their conclusions, Katz and Autor state:
63 Lawrence F. Katz and David H. Autor, “Changes in the Wage Structure andEarnings Inequality,” Handbook of Labor Economics, vol. 3A, (Amsterdam, TheNetherlands: Elsevier, 1999) pp. 1463--1548.
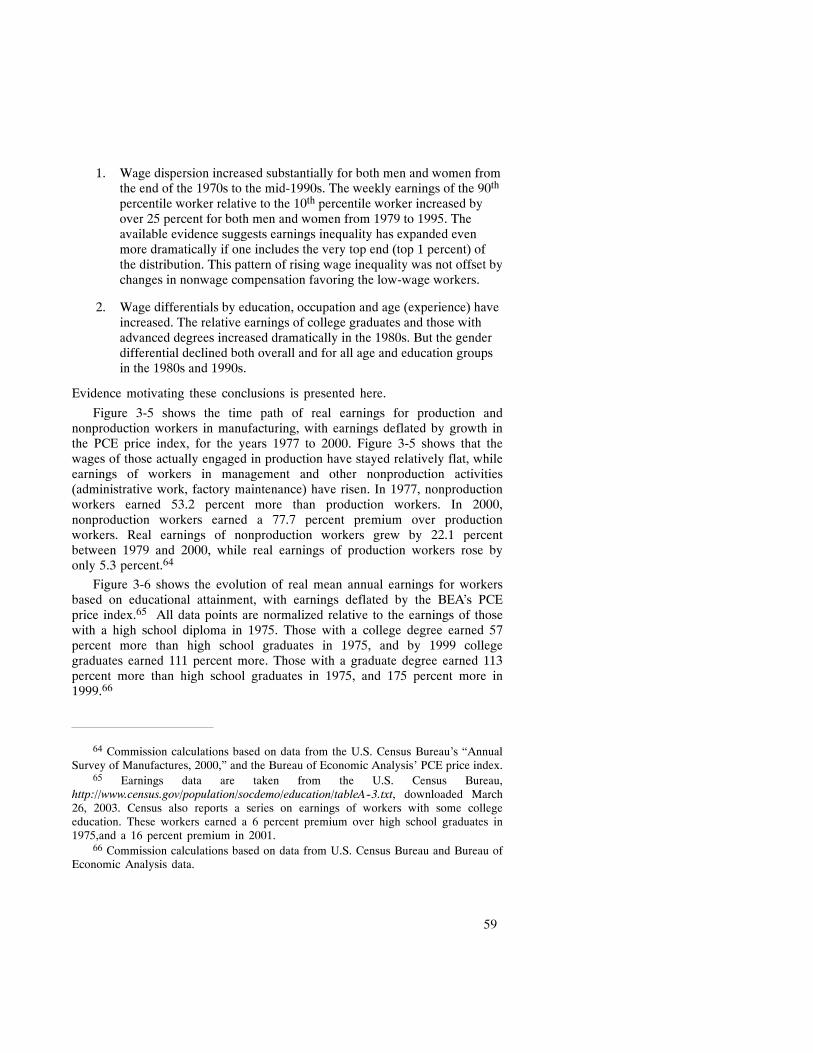
59
1. Wage dispersion increased substantially for both men and women fromthe end of the 1970s to the mid-1990s. The weekly earnings of the 90thpercentile worker relative to the 10th percentile worker increased byover 25 percent for both men and women from 1979 to 1995. Theavailable evidence suggests earnings inequality has expanded evenmore dramatically if one includes the very top end (top 1 percent) ofthe distribution. This pattern of rising wage inequality was not offset bychanges in nonwage compensation favoring the low-wage workers.
2. Wage differentials by education, occupation and age (experience) haveincreased. The relative earnings of college graduates and those withadvanced degrees increased dramatically in the 1980s. But the genderdifferential declined both overall and for all age and education groupsin the 1980s and 1990s.
Evidence motivating these conclusions is presented here.
Figure 3-5 shows the time path of real earnings for production andnonproduction workers in manufacturing, with earnings deflated by growth inthe PCE price index, for the years 1977 to 2000. Figure 3-5 shows that thewages of those actually engaged in production have stayed relatively flat, whileearnings of workers in management and other nonproduction activities(administrative work, factory maintenance) have risen. In 1977, nonproductionworkers earned 53.2 percent more than production workers. In 2000,nonproduction workers earned a 77.7 percent premium over productionworkers. Real earnings of nonproduction workers grew by 22.1 percentbetween 1979 and 2000, while real earnings of production workers rose byonly 5.3 percent.64
Figure 3-6 shows the evolution of real mean annual earnings for workersbased on educational attainment, with earnings deflated by the BEA’s PCEprice index.65 All data points are normalized relative to the earnings of thosewith a high school diploma in 1975. Those with a college degree earned 57percent more than high school graduates in 1975, and by 1999 collegegraduates earned 111 percent more. Those with a graduate degree earned 113percent more than high school graduates in 1975, and 175 percent more in1999.66
64 Commission calculations based on data from the U.S. Census Bureau’s “AnnualSurvey of Manufactures, 2000,” and the Bureau of Economic Analysis’ PCE price index.
65 Earnings data are taken from the U.S. Census Bureau,http://www.census.gov/population/socdemo/education/tableA--3.txt, downloaded March26, 2003. Census also reports a series on earnings of workers with some collegeeducation. These workers earned a 6 percent premium over high school graduates in1975,and a 16 percent premium in 2001.
66 Commission calculations based on data from U.S. Census Bureau and Bureau ofEconomic Analysis data.
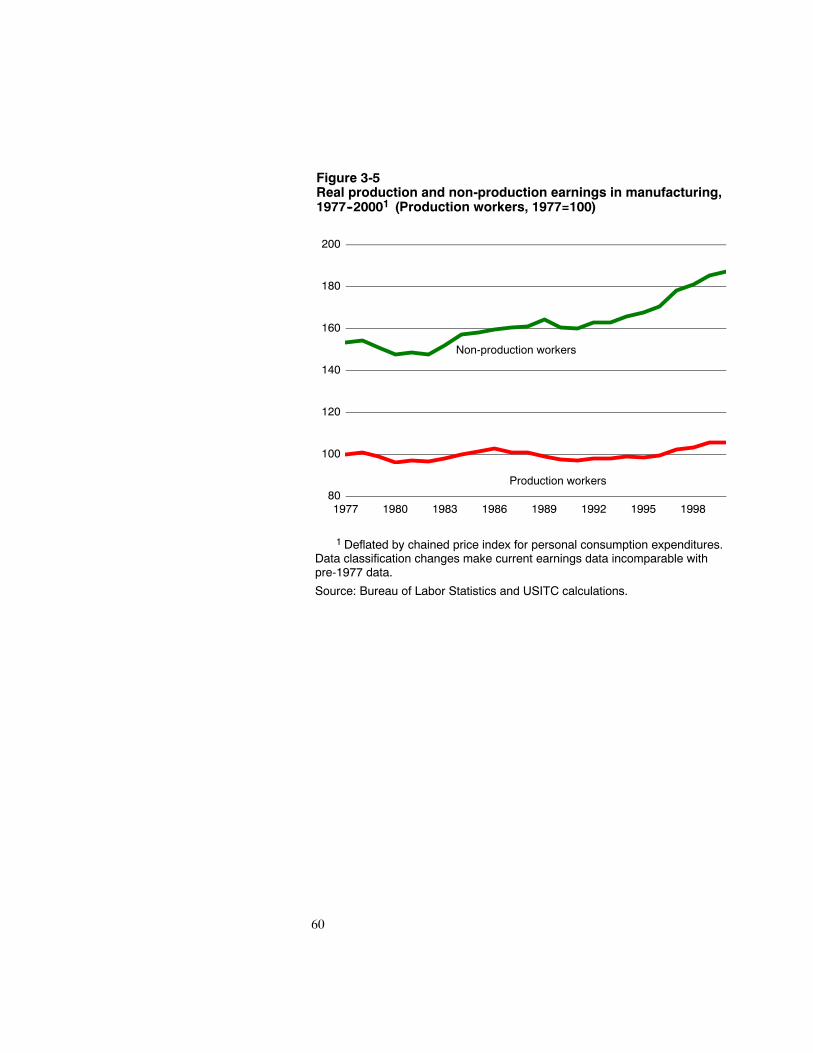
60
Figure 3-5Real production and non-production earnings in manufacturing,1977--20001 (Production workers, 1977=100)
80
100
120
140
160
180
200
1977 1980 1983 1986 1989 1992 1995 1998
Non-production workers
Production workers
1 Deflated by chained price index for personal consumption expenditures.Data classification changes make current earnings data incomparable withpre-1977 data.
Source: Bureau of Labor Statistics and USITC calculations.
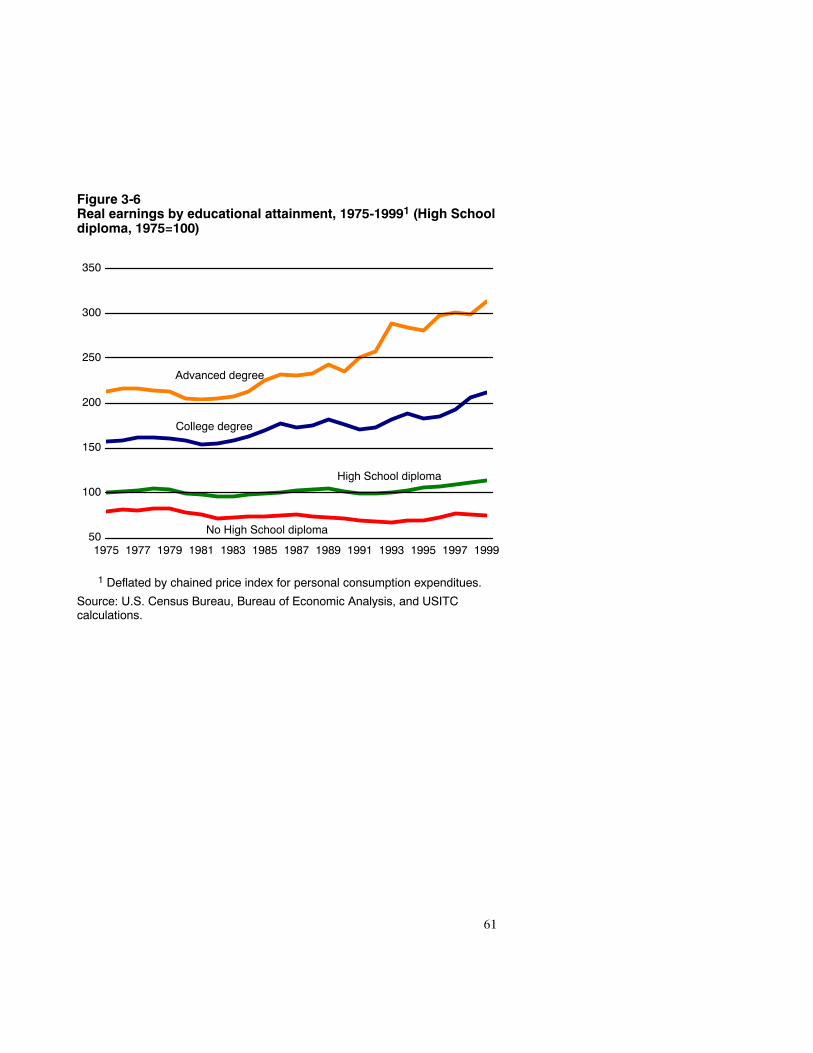
61
Figure 3-6Real earnings by educational attainment, 1975-19991 (High Schooldiploma, 1975=100)
50
100
150
200
250
300
350
1975 1977 1979 1981 1983 1985 1987 1989 1991 1993 1995 1997 1999
1 Deflated by chained price index for personal consumption expenditues.
Source: U.S. Census Bureau, Bureau of Economic Analysis, and USITCcalculations.
High School diploma
No High School diploma
Advanced degree
College degree

63
CHAPTER 4:The Effects of Trade
Liberalization on the U.S.Economy in Historical
Perspective:A Literature Review
OverviewThis chapter is devoted to providing a summary and overview of the
economic literature bearing on the question of whether or not the fiveagreements in particular or U.S. trade liberalization policies in general havehad an observable and significant effect on U.S. economic activity from themid-1970s onward. The question can be viewed from a number of perspectives,and the present review does not exhaust the literature that has been brought tobear on the issue.
This literature review has three primary purposes. First, it seeks to draw outany emerging consensus that may already exist on the economic impact ofrecent trade liberalization, particularly liberalization affecting the United States.Second, the review provides a motivating background for the new quantitativeanalysis presented in chapters 6 through 8, particularly with regard to thechoice of problems addressed and methods employed. Third, the reviewprovides, to the extent feasible, a basis for comparison for the empiricalfindings presented in chapters 6 through 8. Throughout this chapter, shortcitations are provided for works referenced. A bibliography appears asappendix E of this report, providing full citation information.
Types of Literature ReviewedEvidence of the economic effects of trade liberalization falls into two broad
categories. The first section of the review looks at studies that examine one ormore of the five agreements explicitly. Studies of the particular agreements fallinto two categories–ex ante and ex post studies. Ex ante studies are usuallydone prior to an agreement, generally in an attempt to contribute to the debateabout whether to enter into an agreement or how to formulate it, and they
64
usually involve simulation methods. Studies in this category typically produceestimates of the change in economic welfare expected from an agreement, andmay also present estimated changes in expected trade flows. This review treatsas ex ante studies those that have publication dates after agreements have goneinto effect, but that use simulation methods and data of a type indicating theycould have been executed ex ante. Ex post studies consist of attempts todetermine, after an agreement has gone into effect, whether or not it has had aneconomic impact by utilizing data from the post-agreement period.
The second section of the review looks at studies that examine theeconomic effects of increasing exposure to trade, or increasingly liberalizedtrade policies, on one or more economic variables without reference to aparticular agreement. This body of literature examines the relationship betweentrade liberalization and economic growth and productivity, looking at the roleof trade liberalization for wages, employment and income distribution, and hasbegun to address the extent to which trade liberalization increases the varietyof goods available to firms and consumers.1
Methodologies Employed In The LiteratureWhile the methodological issues involved in each branch of literature will
be discussed more fully in those sections of the review, some general points arein order here.
The ex ante studies of particular agreements use simulation methods, mostcommonly computable general equilibrium (CGE) modeling. A CGE modelrepresents a national economy, or a world economy consisting of multiplenations or regions. Each of these nations or regions consists of a certainnumber of sectors or industries. The base data of the model represent theeconomic situation in each region and sector as it existed in a particular baseyear. The regions are connected to each other by international trade (exportsand imports), and sectors are connected to each other by supply and demand.In other words, regions buy goods and services from one another, and a certainpart of their output is delivered to final demand or GDP and consumed byhouseholds or governments, invested, or accounted for by international trade.The interconnections among regions and sectors can be altered or disrupted byvarious sorts of government policies. For example, the trade relationships canbe influenced by tariffs and nontariff measures, and the other markets by taxesand subsidies.
1 The division between studies of particular agreements and studies addressinggeneral economic effects of trade liberalization is not always sharp. In cases in which astudy of a particular agreement also covers its effects on growth, productivity, labormarkets, or product variety, that study will be discussed either in the second section or inboth sections, as warranted.
65
A “run” or simulation of the CGE model consists of altering the policies ofinterest. To ask, “What are the effects of NAFTA?” by this method meansapproximately, “What would the base-year economy have looked like with thepre-NAFTA trade barriers removed?” Advantages of the CGE approachinclude the fact that it provides “controlled experiments” that isolate the effectsof policies of interest (because in the real world other things change besidesNAFTA), and that it disciplines the results obtained according to the logic ofeconomic theory. In addition, because all markets are interconnected, it ispossible to obtain estimates of the effect of changing one policy on any othervariable in the system, regardless of how small such effects might be.
Limitations of the approach arise from the inevitable simplificationsnecessary to represent the complexities of the actual economy, even in a largemodel, and from the data requirements needed to run larger models. Themodels’ quantitative estimates are also sensitive to the choice of behavioralparameters such as the elasticity of substitution–the parameter that measuresthe degree to which buyers are willing and able to switch between varieties ofparticular goods. Moreover, even when great care is taken to insure that asimulation model is based on economic logic and calibrated to observable data,experiments that validate the full structure of the model against historicalexperience are difficult to perform.2
The ex post studies rely on a variety of econometric techniques and usehistorical data. Particularly when these studies involve time-series data (e.g.import or export data for 1970-2001, of which one asks the question whether,for example, NAFTA made any difference from 1994 onward) the difficultyfaced by the researcher is that it is not possible to conduct pure “controlled”experiments with historical data, because the data values from 1994 onward areinfluenced not only by the presence of NAFTA, but by all other forcesinfluencing the economy during that period of time. Statistical techniquesattempting to sort out which of these forces are operating, and at what degreeof strength, may be more or less successful depending on whether actualhistorical circumstances allow the “signal” of changing trade policy to be easilyseparated from such other forces, or from the “noise” of purely unexplainablefluctuations in the variables in question.
2 In a critique of the ex post validation experience with CGE models of NAFTA,Kehoe (2002) made the case that models available to policymakers prior to theimplementation of NAFTA substantially understated NAFTA-induced increases in trade.However, this finding does not per se indicate that the models are misspecified, since it iswell-understood that much of the growth in international trade in any historical period isdue to income growth, which may not be explicitly accounted for in a model that isdesigned to isolate the economic effects of the trade agreement alone. Fox (2000)showed that it was possible to do a good job of tracking historical changes inU.S.-Canada trade after the U.S.-Canada FTA, using a CGE model which took accountof factors such as changes in the capital stock, labor supply, and total expenditure.
66
The ability to discern policy effects, in turn, depends on whether enoughtime has passed to permit a statistically significant comparison between thepre-agreement and post-agreement period. For these reasons, the ex poststudies are fewer in number, and are more recent in date. Nonetheless, suchwork is attracting increasing effort on the part of economists, particularlybecause policymakers inevitably wish to have information regarding the actualeffects of the policies they have just chosen, as well as advance estimates ofthe effects of policies they are about to choose.
The research relating openness to trade and open trade policies to economicgrowth, productivity, labor, and product variety, uses a wide variety ofstatistical and econometric techniques that will be discussed in general terms inthe following sections, and in more detail in the underlying works cited.
Principal FindingsThere is a broad consensus in the available literature on the following
results:
1. Ex ante estimates of the effects on the United States of tradeliberalization arising from particular agreements generally have beenmodest, on the order of less than 0.5 percent of GDP even for largeliberalizations like the Tokyo Round, NAFTA, and the Uruguay Round.The estimated percentage increase in aggregate exports and imports isusually greater than that for GDP. More than one agreement, in morethan one study, has been estimated ex ante to increase output in U.S.agriculture and decrease it in textiles and apparel. This is consistentwith the significant prior degree of import restraints in foreign marketsfor agriculture and the U.S. market for textiles and apparel,respectively. The amount of information researchers have on the stateof play of multilateral negotiations influences the results they obtain.Studies that obtain large estimates of the benefits of liberalization byinvoking scale economies may not be consistent with empiricalevidence obtained ex post, such as for the U.S.-Canada FTA.
2. Econometric estimates of the effect of tariff reductions on trade suggestthat tariff reductions explain approximately 25 percent of the growth inworld trade. Other phenomena, notably reductions in the cost of airtransportation, appear to have been at least as important a source ofworld trade growth. Foreign outsourcing also contributed to world tradegrowth. A model that assumes that tariff reductions induce foreignoutsourcing attributes as much as one half of world trade growth totariff reductions.
3. Available ex post estimates of the effect of NAFTA have found that theNAFTA liberalizations have increased U.S.-Mexico trade in bothdirections. While earlier studies had some difficulties identifying these
67
increases at all, improved methodologies and a longer post-NAFTAtime period have enabled them to be identified with increasingprecision, associating them with particular products that have nowbenefitted from especially deep NAFTA tariff cuts.
4. Openness to trade and more liberal trade policies are associated withfaster rates of economic growth both in the United States and abroad.There have been many studies relating trade liberalization to rates ofeconomic growth across countries, and as their methodology hasimproved, early skepticism about the robustness of the trade-growthconnection has diminished somewhat. It is easier to show a linkbetween economic growth and investment, which in turn may increaseas a result of trade liberalization.
5. The available literature associating international trade andproductivity has mostly focused on the experience of developingeconomies, though there are some relevant studies for the UnitedStates. Foreign growth and productivity gains may influence U.S.outcomes by increasing U.S. exports. Studies for both the United Statesand other countries suggest a possible short-term relationship betweenproductivity and increased trade, but the direction of causation maywell be reversed (e.g. firms become productive first, and then export,rather than vice versa). Evidence that exposure to trade causes industryoutput to shift from less-productive to more-productive firms isrelatively strong, while evidence for a possible link between tradingopportunities and scale economies is sketchy at best. There is also someindustry-level evidence for higher rates of productivity growth inindustries exposed to import competition or trade policy liberalization.
6. Since the 1970s, there has been a steady rise in the wages ofmore-skilled U.S. workers relative to less-skilled U.S. workers.Economic theory suggests that a possible cause for this is the increasein U.S. imports from developing countries, relative to the U.S.economy as a whole. A consensus of a wide range of studies, using avariety of methods, is that at most 10-20 percent of the growth in the“skilled wage premium” can be attributed to international trade, withthe rest most likely accounted for by technological change increasingthe demand for skilled labor. Evidence on the transition experiences ofworkers affected by increasing imports, or in sectors influenced bytrade policy, suggests that their transitions from old to new jobs are notmarkedly different in terms of wage changes or duration ofunemployment from other workers in the economy.
7. Recent increases in trade in intermediate goods, known variously as“outsourcing” or “production sharing,” may provide an additionalchannel through which increases in trade may affect U.S. wages, asless-skilled portions of vertically integrated production processes are
68
located overseas. Some estimates indicate that as much as 40 percent ofincreases in the relative wages of nonproduction workers in the 1970sand 1980s may be attributable to outsourcing, but these estimates donot rule out the possibility that technological changes such as increasedcomputerization may have played an equally large or larger role.
8. A significant portion of recent increases in international trade consistsof “new” goods, that is, goods coming from destinations that they didnot come from before. This is particularly true of the increase in U.S.imports from Mexico post-NAFTA. It appears that such increases canbe linked to specific cuts in tariffs. Estimates for one developingcountry suggest that as much as a third of the gains of tradeliberalization may be due to increased import product variety.
Economic Effects Attributed ToParticular Agreements Negotiated Under
Trade Promotion Authority
Simulation Analyses of U.S. Trade PolicyChanges
Comprehensive assessments of the economic impact of trade policychanges often rely on models that simulate economic responses to changes intrade policy in an environment that mimics observed economic relationships.The primary relationships represented in simulation models of internationaltrade are the geographic trade pattern among nations and input-outputrelationships within national economies. When a simulation model is given atrade policy “shock,” such as the implementation of tariff reductions embodiedin an agreement, the model traces the effects of the shock through the bilateraltrade and input-output relationships in a manner consistent with a particulareconomic theory. Model results depend primarily on the size of the shock, thedegree to which agents in the model are assumed to readjust their behaviorwhen the shock changes relative prices, and theoretical assumptions about thenature of competition and production.
The standard economic simulation model used in trade policy analysis is astatic general equilibrium model that assumes perfectly competitive markets,constant returns to scale in production, and differentiation of products bycountry of origin.3 Models of this type have been used for trade policy analysis
3 See Devarajan et al. (1997).
69
since the Tokyo Round.4 Experience with the standard models suggests thatsignificant trade policy liberalizations raise economic welfare by between 0.5and 1 percent of GDP.5 Most of the studies reviewed in this section areconsistent with this finding, though the estimated effects on the United Statesare typically smaller.6 However, alternate assumptions about the size of theshock, the nature of market competition, the technology of production, andthe degree to which there are economic links between current and futurebehaviors can affect the results.
Economywide general equilibrium models are particularly useful forproducing estimates of the effect of trade policy changes on sectoral output andemployment, and bilateral trade flows. They can also provide estimates ofchanges in wages and capital returns, as well as summary measures ofeconomic welfare.7 Most simulation studies reviewed below suggest that U.S.production, wages, the rental rate of capital, exports, and imports increasemodestly as a result of implementation of each of the agreements.
Consistent with economic theory, the models report that trade policyliberalization reallocates resources across sectors. Some sectors, primarilyexport-oriented sectors that benefit from foreign tariff reductions, grow as aresult of the agreement. Output falls in other sectors, primarily those that facesignificant import competition and a significant change in U.S. importrestraints. As in the aggregate results, sectoral estimates suggest that therelative impact of liberalization on the United States appears to be modest,
4 The earliest of this work was Brown and Whalley (1980). See also Deardorff andStern (1983).
5 The similarity of this result across experiments is so consistent that the 0.5 to 1.0percent figure has been given a name–the Harberger constant (after Arnold Harberger,who first described the measurement of these types of losses). See Rutherford and Tarr(2002).
6 Because of the large size of the U.S. economy, trade accounts for a smaller share ofoutput than in most countries. The United States also has a large share of services inoutput, and services are less likely to be traded than goods. Thus, economy-wide effectsof trade liberalization on the U.S. economy are smaller, in relative terms, than for mostother countries. Moreover, trade agreements have historically done much less toliberalize services trade than goods trade.
7 Because model estimates can predate the implementation of an agreement, modelresults are sometimes misinterpreted as predictions that can be verified after theagreement has been implemented and economic variables observed, which is not acorrect understanding of the model output. The model only measures the effect of tradepolicy changes, but leaves constant all other sources of economic change that mightaffect one or more variables. Because it is impossible to account for all other sources ofeconomic change, it is not possible to verify the model ex post simply by comparing themodel to observed changes in economic data. Model verification exercises mustincorporate other economic shocks, including exchange rate movements, economicgrowth, and technological change, before the results can be compared with data that areobserved ex post.
70
especially when compared to other changes that were expected tosimultaneously occur in economy. The relatively modest degree of sectoraloutput and employment shifts suggests that adjustment costs associated withliberalization (worker dislocation and plant closure) are correspondinglymodest.
Recent developments in economic theory, along with greater computingpower and data availability, have allowed researchers to consider the effects oftrade policy changes using alternative models of economic behavior. Modelsthat differ from those with the basic structure described above began to bewidely used at the time of the Uruguay Round and NAFTA negotiations.8 Ingeneral, models that included scale economies in production, imperfectcompetition, or dynamic investment flows and an endogenous price of capitalshowed larger economic responses to trade policy changes. Model experimentsthat removed both tariffs and nontariff barriers also produced larger effects thanmodel experiments that removed only tariffs.
While the diversity of policy simulation approaches makes it difficult tosummarize results, an overview captures a sense of the reasonable bounds forthe impacts of trade policy. Table 4-1 provides a guide to the simulation studiesreviewed as background for this chapter. The selection of studies reviewed isrepresentative rather than exhaustive; many of the studies discussed herecontain citations to further studies. The table shows a description of keyassumptions and the predicted impact on welfare, exports, and imports fromeach of the models surveyed, by trade agreement. Sectoral results for eachstudy are also reported in Table 4-2. The table lists sectors for which the largestimpacts on output, exports, and imports are expected for the NAFTA and theUruguay Round agreements.
Overall Impact on U.S. EconomyAlthough the ex ante studies were done using different base periods and
methodologies for various experiments, most show that overall U.S. welfare,9wages, the rental rate of capital, exports, and imports were expected to increase
8 Earlier examples of CGE trade analyses exploiting scale economies, productdifferentiation and oligopolistic behavior include studies of the Canadian economy byHarris and Cox. See Harris (1984), Cox and Harris (1985 and 1986). The first two ofthese papers modeled unilateral free trade and stylized, multilateral free trade as itaffected Canada. Cox and Harris covered the effects on Canada of a limited sectoraltrade agreement with the United States. Because these studies only reported effects forCanada, they are not included in table 4-1.
9 Welfare is measured as equivalent variation, as most studies report it. Equivalentvariation is useful for measuring welfare changes in situations in which prices change,such as changes in trade policy. It is defined as the amount of additional income that onehas to provide at the old prices to make one equally as well off as they would be at thenew prices. This number is positive for an increase in welfare, and is usually measured interms of the preferences of one or more representative consumers in the model.
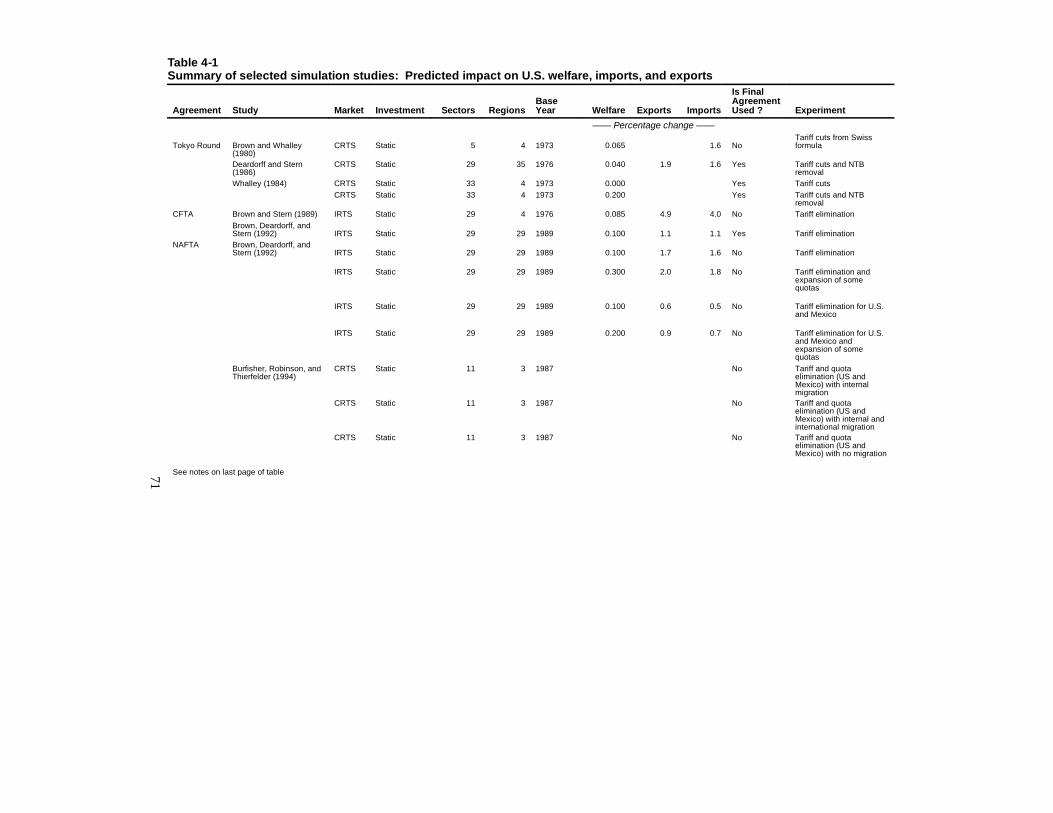
71
Table 4-1Summary of selected simulation studies: Predicted impact on U.S. welfare, imports, and exports
Agreement Study Market Investment Sectors RegionsBaseYear Welfare Exports Imports
Is FinalAgreementUsed ? Experiment
—— Percentage change ——
Tokyo Round Brown and Whalley(1980)
CRTS Static 5 4 1973 0.065 1.6 NoTariff cuts from Swissformula
Deardorff and Stern(1986)
CRTS Static 29 35 1976 0.040 1.9 1.6 Yes Tariff cuts and NTBremoval
Whalley (1984) CRTS Static 33 4 1973 0.000 Yes Tariff cutsCRTS Static 33 4 1973 0.200 Yes Tariff cuts and NTB
removalCFTA Brown and Stern (1989) IRTS Static 29 4 1976 0.085 4.9 4.0 No Tariff elimination
Brown, Deardorff, andStern (1992) IRTS Static 29 29 1989 0.100 1.1 1.1 Yes Tariff elimination
NAFTA Brown, Deardorff, andStern (1992) IRTS Static 29 29 1989 0.100 1.7 1.6 No Tariff elimination
IRTS Static 29 29 1989 0.300 2.0 1.8 No Tariff elimination andexpansion of somequotas
IRTS Static 29 29 1989 0.100 0.6 0.5 No Tariff elimination for U.S.and Mexico
IRTS Static 29 29 1989 0.200 0.9 0.7 No Tariff elimination for U.S.and Mexico andexpansion of somequotas
Burfisher, Robinson, andThierfelder (1994)
CRTS Static 11 3 1987 No Tariff and quotaelimination (US andMexico) with internalmigration
CRTS Static 11 3 1987 No Tariff and quotaelimination (US andMexico) with internal andinternational migration
CRTS Static 11 3 1987 No Tariff and quotaelimination (US andMexico) with no migration
See notes on last page of table
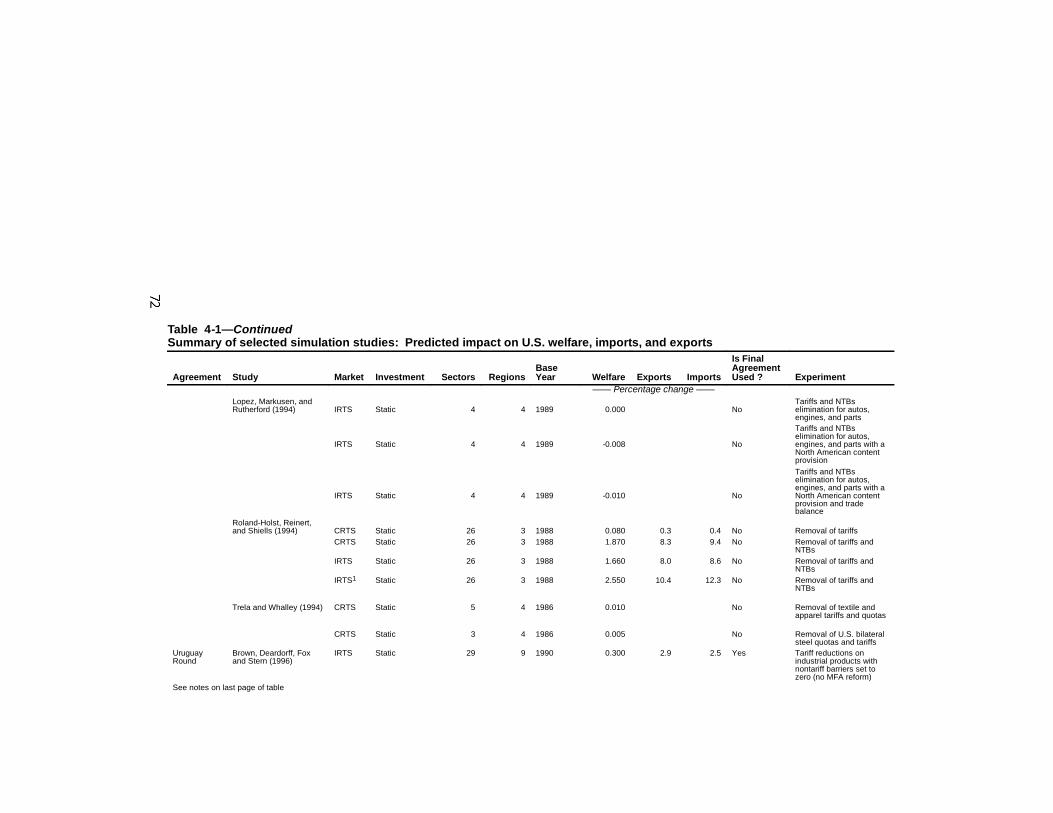
Table 4-1—ContinuedSummary of selected simulation studies: Predicted impact on U.S. welfare, imports, and exports
Agreement Study Market Investment Sectors RegionsBaseYear Welfare Exports Imports
Is FinalAgreementUsed ? Experiment
—— Percentage change ——Lopez, Markusen, andRutherford (1994) IRTS Static 4 4 1989 0.000 No
Tariffs and NTBselimination for autos,engines, and parts
IRTS Static 4 4 1989 -0.008 No
Tariffs and NTBselimination for autos,engines, and parts with aNorth American contentprovision
IRTS Static 4 4 1989 -0.010 No
Tariffs and NTBselimination for autos,engines, and parts with aNorth American contentprovision and tradebalance
Roland-Holst, Reinert,and Shiells (1994) CRTS Static 26 3 1988 0.080 0.3 0.4 No Removal of tariffs
CRTS Static 26 3 1988 1.870 8.3 9.4 No Removal of tariffs andNTBs
IRTS Static 26 3 1988 1.660 8.0 8.6 No Removal of tariffs andNTBs
IRTS1 Static 26 3 1988 2.550 10.4 12.3 No Removal of tariffs andNTBs
Trela and Whalley (1994) CRTS Static 5 4 1986 0.010 No Removal of textile andapparel tariffs and quotas
CRTS Static 3 4 1986 0.005 No Removal of U.S. bilateralsteel quotas and tariffs
UruguayRound
Brown, Deardorff, Foxand Stern (1996)
IRTS Static 29 9 1990 0.300 2.9 2.5 Yes Tariff reductions onindustrial products withnontariff barriers set tozero (no MFA reform)
See notes on last page of table
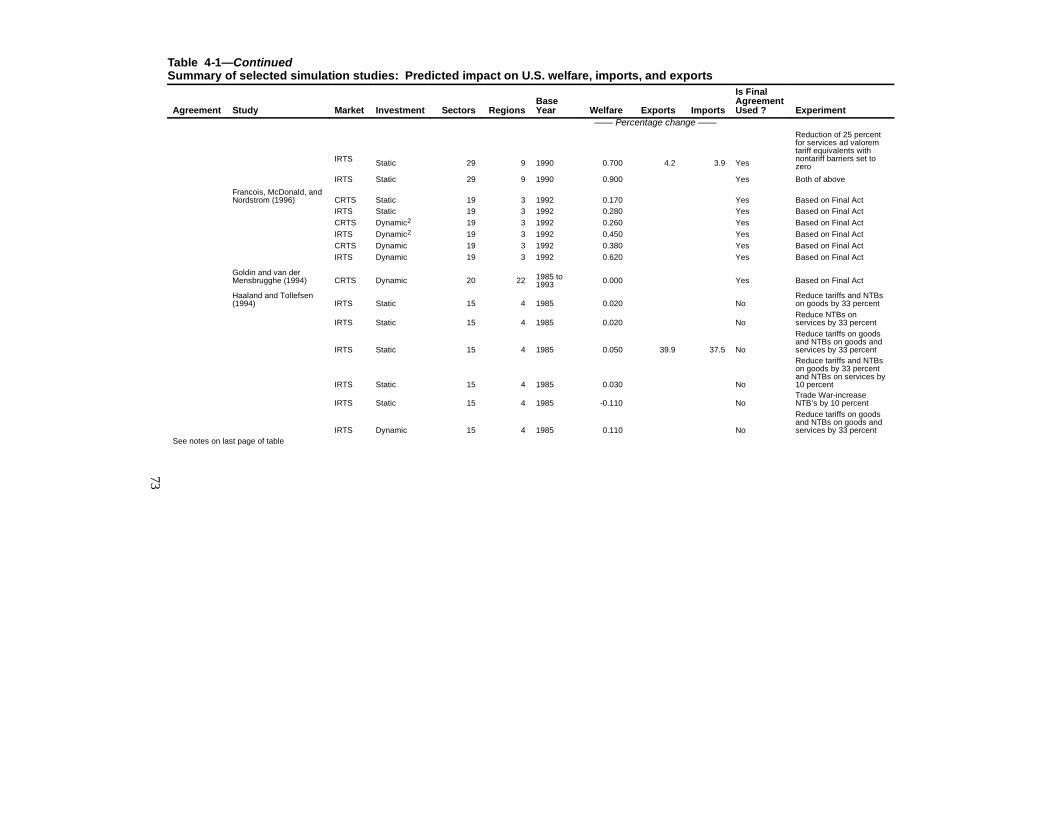
73
Table 4-1—ContinuedSummary of selected simulation studies: Predicted impact on U.S. welfare, imports, and exports
Agreement Study Market Investment Sectors RegionsBaseYear Welfare Exports Imports
Is FinalAgreementUsed ? Experiment
—— Percentage change ——
IRTS Static 29 9 1990 0.700 4.2 3.9 Yes
Reduction of 25 percentfor services ad valoremtariff equivalents withnontariff barriers set tozero
IRTS Static 29 9 1990 0.900 Yes Both of above
Francois, McDonald, andNordstrom (1996) CRTS Static 19 3 1992 0.170 Yes Based on Final Act
IRTS Static 19 3 1992 0.280 Yes Based on Final ActCRTS Dynamic2 19 3 1992 0.260 Yes Based on Final ActIRTS Dynamic2 19 3 1992 0.450 Yes Based on Final ActCRTS Dynamic 19 3 1992 0.380 Yes Based on Final ActIRTS Dynamic 19 3 1992 0.620 Yes Based on Final Act
Goldin and van derMensbrugghe (1994) CRTS Dynamic 20 22 1985 to
1993 0.000 Yes Based on Final Act
Haaland and Tollefsen(1994) IRTS Static 15 4 1985 0.020 No
Reduce tariffs and NTBson goods by 33 percent
IRTS Static 15 4 1985 0.020 NoReduce NTBs onservices by 33 percent
IRTS Static 15 4 1985 0.050 39.9 37.5 No
Reduce tariffs on goodsand NTBs on goods andservices by 33 percent
IRTS Static 15 4 1985 0.030 No
Reduce tariffs and NTBson goods by 33 percentand NTBs on services by10 percent
IRTS Static 15 4 1985 -0.110 NoTrade War-increaseNTB’s by 10 percent
IRTS Dynamic 15 4 1985 0.110 No
Reduce tariffs on goodsand NTBs on goods andservices by 33 percent
See notes on last page of table
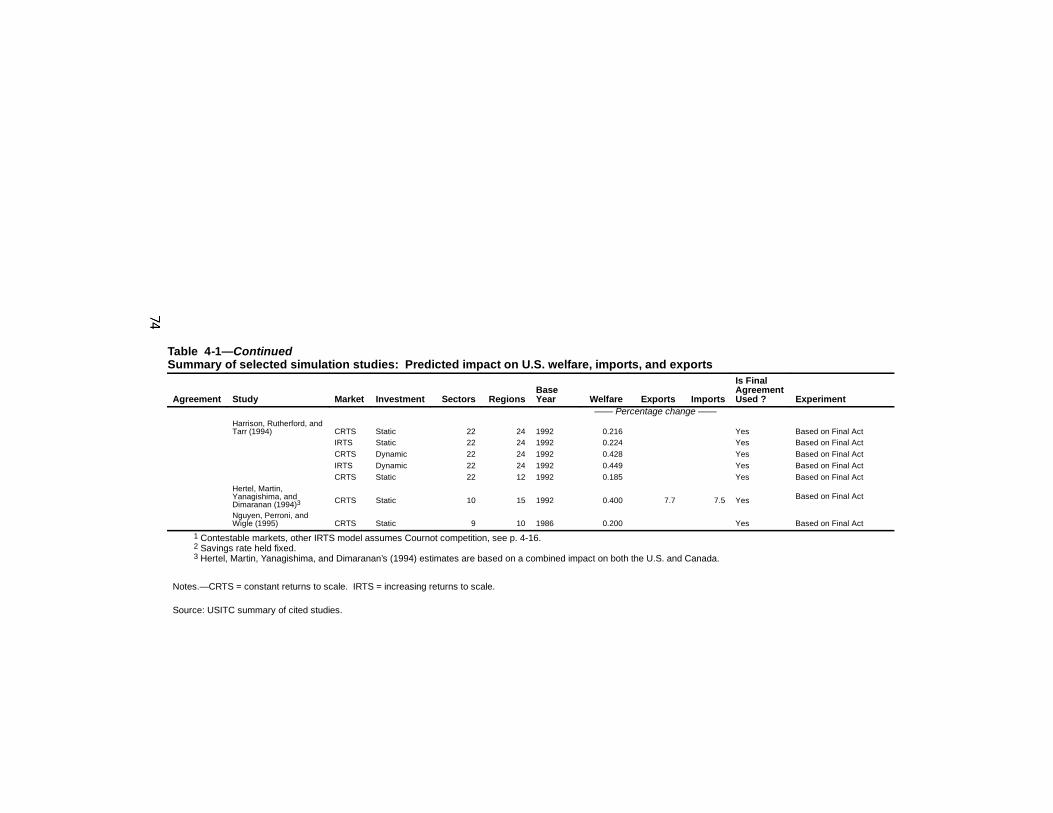
Table 4-1—ContinuedSummary of selected simulation studies: Predicted impact on U.S. welfare, imports, and exports
Agreement Study Market Investment Sectors RegionsBaseYear Welfare Exports Imports
Is FinalAgreementUsed ? Experiment
—— Percentage change ——Harrison, Rutherford, andTarr (1994) CRTS Static 22 24 1992 0.216 Yes Based on Final Act
IRTS Static 22 24 1992 0.224 Yes Based on Final ActCRTS Dynamic 22 24 1992 0.428 Yes Based on Final ActIRTS Dynamic 22 24 1992 0.449 Yes Based on Final ActCRTS Static 22 12 1992 0.185 Yes Based on Final Act
Hertel, Martin,Yanagishima, andDimaranan (1994)3 CRTS Static 10 15 1992 0.400 7.7 7.5 Yes Based on Final Act
Nguyen, Perroni, andWigle (1995) CRTS Static 9 10 1986 0.200 Yes Based on Final Act
1 Contestable markets, other IRTS model assumes Cournot competition, see p. 4-16.2 Savings rate held fixed.3 Hertel, Martin, Yanagishima, and Dimaranan’s (1994) estimates are based on a combined impact on both the U.S. and Canada.
Notes.—CRTS = constant returns to scale. IRTS = increasing returns to scale.
Source: USITC summary of cited studies.
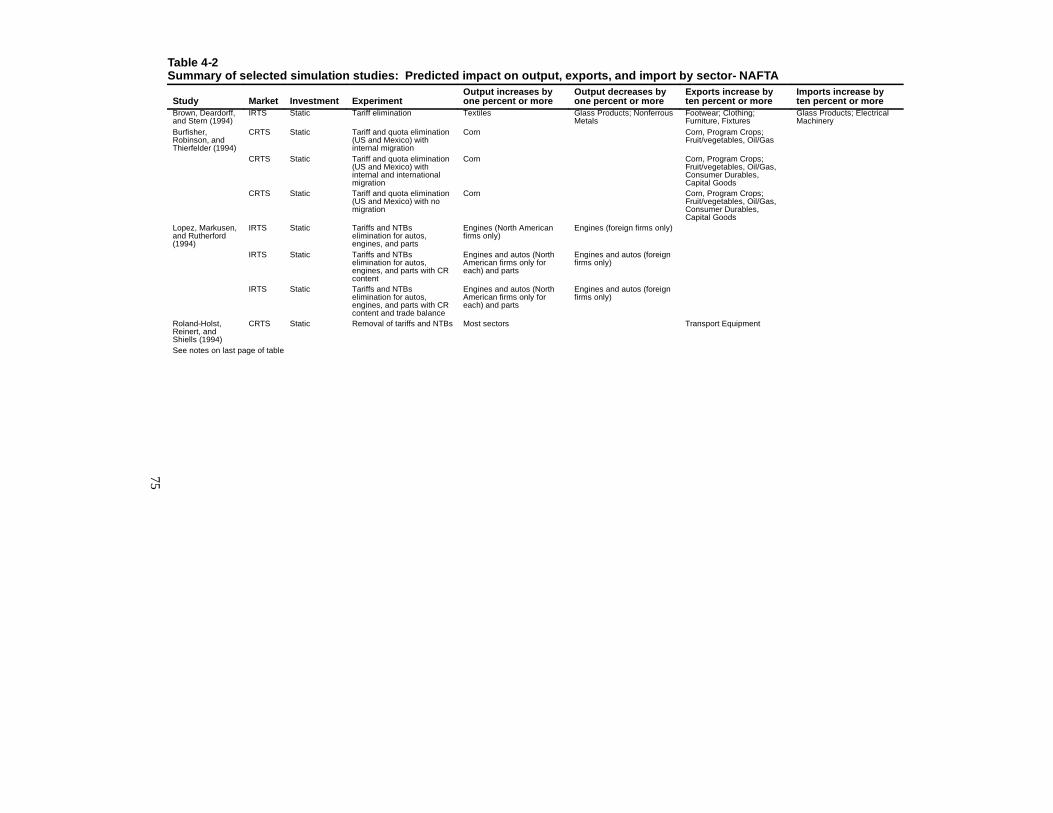
75
Table 4-2Summary of selected simulation studies: Predicted impact on output, exports, and import by sector- NAFTA
Study Market Investment ExperimentOutput increases byone percent or more
Output decreases byone percent or more
Exports increase byten percent or more
Imports increase byten percent or more
Brown, Deardorff,and Stern (1994)
IRTS Static Tariff elimination Textiles Glass Products; NonferrousMetals
Footwear; Clothing;Furniture, Fixtures
Glass Products; ElectricalMachinery
Burfisher,Robinson, andThierfelder (1994)
CRTS Static Tariff and quota elimination(US and Mexico) withinternal migration
Corn Corn, Program Crops;Fruit/vegetables, Oil/Gas
CRTS Static Tariff and quota elimination(US and Mexico) withinternal and internationalmigration
Corn Corn, Program Crops;Fruit/vegetables, Oil/Gas,Consumer Durables,Capital Goods
CRTS Static Tariff and quota elimination(US and Mexico) with nomigration
Corn Corn, Program Crops;Fruit/vegetables, Oil/Gas,Consumer Durables,Capital Goods
Lopez, Markusen,and Rutherford(1994)
IRTS Static Tariffs and NTBselimination for autos,engines, and parts
Engines (North Americanfirms only)
Engines (foreign firms only)
IRTS Static Tariffs and NTBselimination for autos,engines, and parts with CRcontent
Engines and autos (NorthAmerican firms only foreach) and parts
Engines and autos (foreignfirms only)
IRTS Static Tariffs and NTBselimination for autos,engines, and parts with CRcontent and trade balance
Engines and autos (NorthAmerican firms only foreach) and parts
Engines and autos (foreignfirms only)
Roland-Holst,Reinert, andShiells (1994)
CRTS Static Removal of tariffs and NTBs Most sectors Transport Equipment
See notes on last page of table
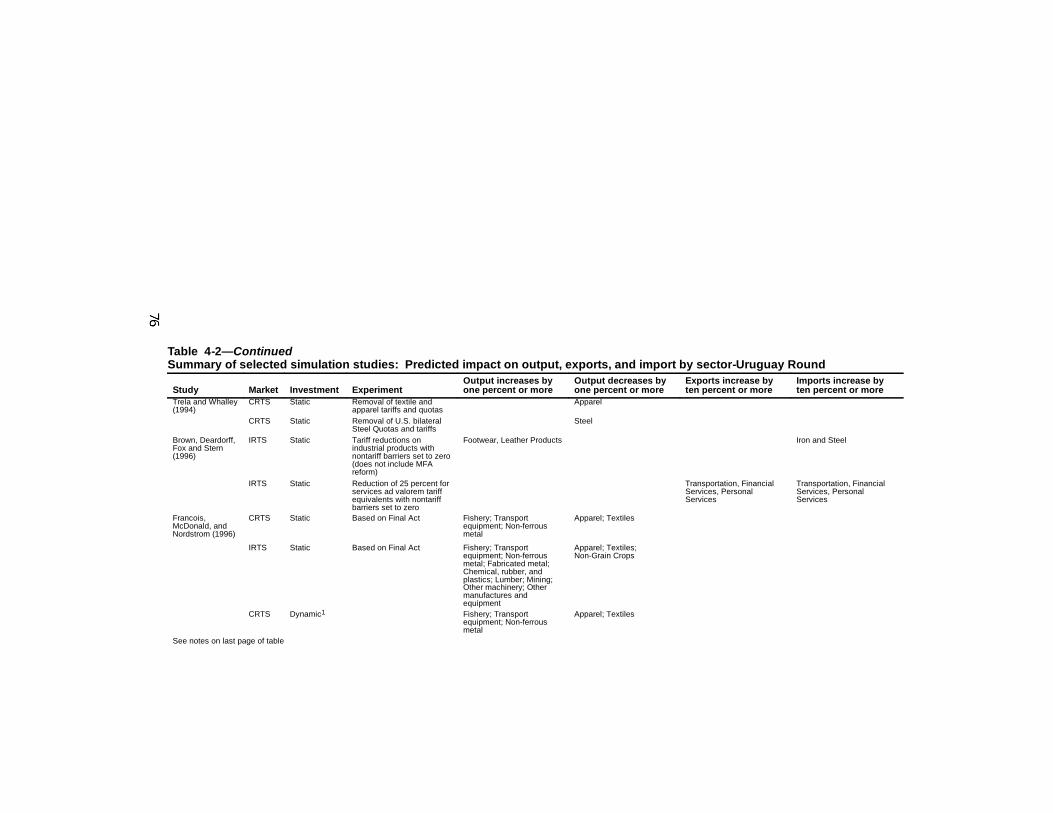
Table 4-2—ContinuedSummary of selected simulation studies: Predicted impact on output, exports, and import by sector-Uruguay Round
Study Market Investment ExperimentOutput increases byone percent or more
Output decreases byone percent or more
Exports increase byten percent or more
Imports increase byten percent or more
Trela and Whalley(1994)
CRTS Static Removal of textile andapparel tariffs and quotas
Apparel
CRTS Static Removal of U.S. bilateralSteel Quotas and tariffs
Steel
Brown, Deardorff,Fox and Stern(1996)
IRTS Static Tariff reductions onindustrial products withnontariff barriers set to zero(does not include MFAreform)
Footwear, Leather Products Iron and Steel
IRTS Static Reduction of 25 percent forservices ad valorem tariffequivalents with nontariffbarriers set to zero
Transportation, FinancialServices, PersonalServices
Transportation, FinancialServices, PersonalServices
Francois,McDonald, andNordstrom (1996)
CRTS Static Based on Final Act Fishery; Transportequipment; Non-ferrousmetal
Apparel; Textiles
IRTS Static Based on Final Act Fishery; Transportequipment; Non-ferrousmetal; Fabricated metal;Chemical, rubber, andplastics; Lumber; Mining;Other machinery; Othermanufactures andequipment
Apparel; Textiles;Non-Grain Crops
CRTS Dynamic1 Fishery; Transportequipment; Non-ferrousmetal
Apparel; Textiles
See notes on last page of table
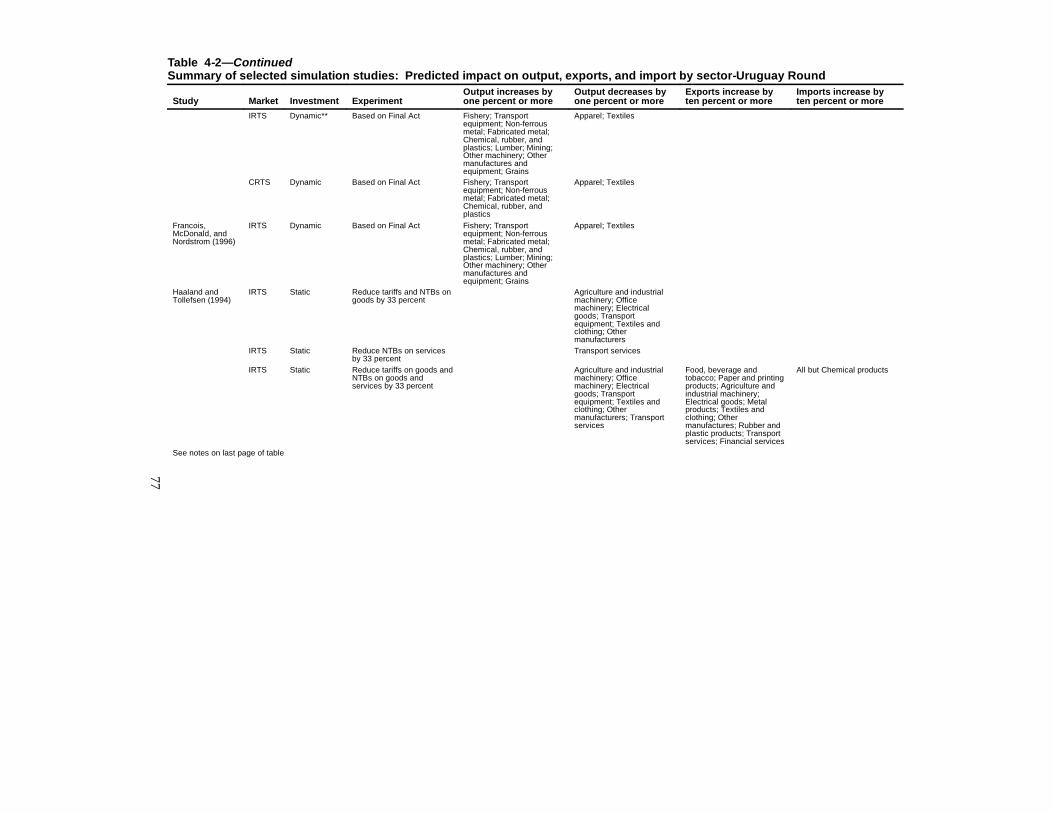
77
Table 4-2—ContinuedSummary of selected simulation studies: Predicted impact on output, exports, and import by sector-Uruguay Round
Study Market Investment ExperimentOutput increases byone percent or more
Output decreases byone percent or more
Exports increase byten percent or more
Imports increase byten percent or more
IRTS Dynamic** Based on Final Act Fishery; Transportequipment; Non-ferrousmetal; Fabricated metal;Chemical, rubber, andplastics; Lumber; Mining;Other machinery; Othermanufactures andequipment; Grains
Apparel; Textiles
CRTS Dynamic Based on Final Act Fishery; Transportequipment; Non-ferrousmetal; Fabricated metal;Chemical, rubber, andplastics
Apparel; Textiles
Francois,McDonald, andNordstrom (1996)
IRTS Dynamic Based on Final Act Fishery; Transportequipment; Non-ferrousmetal; Fabricated metal;Chemical, rubber, andplastics; Lumber; Mining;Other machinery; Othermanufactures andequipment; Grains
Apparel; Textiles
Haaland andTollefsen (1994)
IRTS Static Reduce tariffs and NTBs ongoods by 33 percent
Agriculture and industrialmachinery; Officemachinery; Electricalgoods; Transportequipment; Textiles andclothing; Othermanufacturers
IRTS Static Reduce NTBs on servicesby 33 percent
Transport services
IRTS Static Reduce tariffs on goods andNTBs on goods andservices by 33 percent
Agriculture and industrialmachinery; Officemachinery; Electricalgoods; Transportequipment; Textiles andclothing; Othermanufacturers; Transportservices
Food, beverage andtobacco; Paper and printingproducts; Agriculture andindustrial machinery;Electrical goods; Metalproducts; Textiles andclothing; Othermanufactures; Rubber andplastic products; Transportservices; Financial services
All but Chemical products
See notes on last page of table
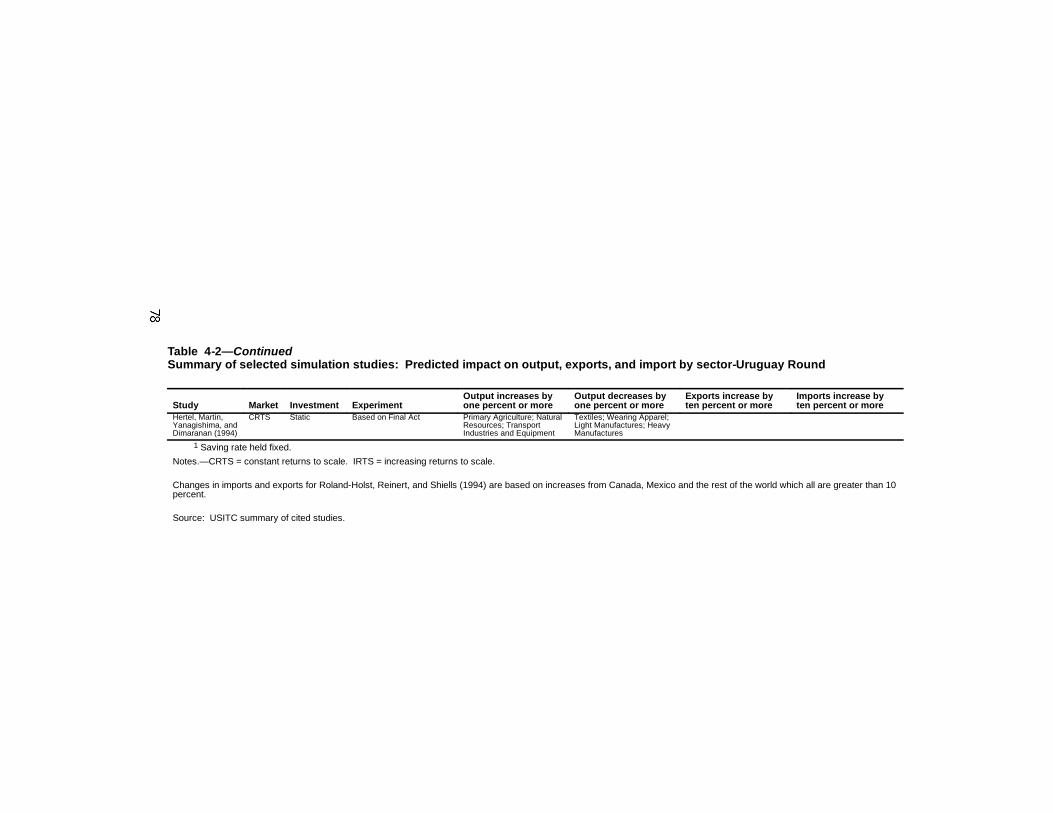
Table 4-2—ContinuedSummary of selected simulation studies: Predicted impact on output, exports, and import by sector-Uruguay Round
Study Market Investment ExperimentOutput increases byone percent or more
Output decreases byone percent or more
Exports increase byten percent or more
Imports increase byten percent or more
Hertel, Martin,Yanagishima, andDimaranan (1994)
CRTS Static Based on Final Act Primary Agriculture; NaturalResources; TransportIndustries and Equipment
Textiles; Wearing Apparel;Light Manufactures; HeavyManufactures
1 Saving rate held fixed.
Notes.—CRTS = constant returns to scale. IRTS = increasing returns to scale.
Changes in imports and exports for Roland-Holst, Reinert, and Shiells (1994) are based on increases from Canada, Mexico and the rest of the world which all are greater than 10percent.
Source: USITC summary of cited studies.
79
modestly as a result of implementation of each of the agreements.10
Employment and output, while shifting from one sector to another, in mostmodels do not grow significantly owing to assumptions about fullemployment in the models. The main focus of most of the studies is theeffect on U.S. welfare, and most find that U.S. welfare as a percentage ofGDP increases by much less than 1 percent of GDP.11 For the Tokyo Round,welfare estimates range from zero to 0.2 percent of GDP, the impact onwelfare being less than 0.1 percent for GDP in both cases where only tariffcuts are considered. With the exception of Roland-Holst, Reinert et al.(1992), the impact on welfare was less than 0.1 percent for studies of theU.S.-Canada FTA and NAFTA, even when nontariff barriers are considered.12
For the Uruguay Round, the estimated impact on welfare is greater than thatfound for the other agreements, but is still less than one percent of GDP. Theimpact is also greater for the Uruguay Round than for the other agreementswhen only estimates with constant returns to scale and static investment areassumed, with the welfare impact ranging from 0.17 to 0.40 percent of GDP.
Studies also generally estimate that U.S. exports and imports increased as aresult of the agreements. Although the impact on exports and imports wasreported to be less than a 2-percent increase for the Tokyo Round, theU.S.-Canada FTA, and NAFTA, the impact is greater than 2 percent for allUruguay Round studies.13 Similarly, most studies find that output, and therental rate on capital would increase by modest amounts, usually less than 0.5percent.
10 Surveys of studies that make this assessment for the United States are Burfisher etal. (2001); see p. 126; and Kehoe and Kehoe (1994). Studies that make this assessmentabout the overall effect of a particular agreement on all countries for the Tokyo Roundinclude Deardorff and Stern (1986); for the Uruguay Round, Perroni (1996).
11 See the discussion of the Harberger constant in footnote 4.12 Note that Hertel, et al. (1995) reports combined results for the United States and
Canada. The exception was a model of NAFTA in Roland-Holst et al. (1994). Theyreport welfare effects ranging from 0.08 percent to 2.55 percent of GDP. The maindifference between the conclusions of Roland-Holst, et al. and those of other NAFTAresearchers is that Roland-Holst, et al. generate high estimates that included theelimination of all nontariff barriers among NAFTA countries, even if those nontariffbarriers were not explicitly phased out. As noted below, their estimates of the magnitudeof those barriers are controversial.
13 Although there are no known ex ante CGE studies of the U.S.-Israel Free TradeArea, Sawyer and Sprinkle (1986) use a simple partial-equilibrium framework to showthat U.S. imports (net of trade diversion) increase by $127.3 million (1983 dollars) andU.S. exports to Israel increase by $9.4 million.
80
Scale Economies and Imperfect CompetitionThe impact of trade liberalization in models allowing for scale economies
and imperfect competition depends on the type of imperfect competition14
introduced and the degree of scale economies15 assumed. Although in mostcases the introduction of imperfect competition increases the agreements’measured impact on U.S. welfare, the estimated magnitude of the impact varieswidely. These mixed results are not surprising since the gains from trade thataccrue by taking advantage of scale economies and introducing morecompetition may be dominated by profit shifting, as illustrated in the strategictrade policy literature.16
Early applications of increasing returns to scale to CGE modeling of tradeliberalization, such as those done ex ante for the Canadian economy by Harris(1984) and Cox and Harris (1985, 1986), assumed substantial scale economiesbased on engineering estimates, and consequently produced large estimates ofwelfare gains. Subsequent empirical work on the U.S.-Canada FTA indicatedthat scale economies of the magnitude assumed were likely not realized inpractice. There is better empirical evidence for a “selection effect” of tradeliberalization, i.e. that average productivity may rise through exit of the lessefficient firms in an industry, with a consequent increase in the market share ofmore efficient firms.17
In many cases, incorporation of scale economies and imperfect competitionincreases estimates of the gains in economic welfare.18 This relation is clearest
14 The textbook ideal of “perfect competition” involves a large number of producersand consumers in each industry trading a homogeneous (identical) product underconditions of free entry and exit and perfect information. The market structure of perfectcompetition as usually described involves firms producing under constant returns toscale. Even standard CGE models depart somewhat from the assumption ofhomogeneous product by differentiating among products produced in different countries.Thus, “product differentiation” in the models described as “imperfect competition”below refers to product differentiation within a country. There is more than one potentialmodel of imperfect competition, depending on which of the above assumptions arerelaxed, and in what manner.
15 In models with scale economies, also known as “increasing returns to scale,”when output increases, the cost of production increases at a slower rate, so that averageor unit costs decline. By contrast, in cases of constant returns to scale, costs increaseproportionately with output, so that average or unit costs remain constant.
16 For example, see Brander and Spencer (1984).17 Feenstra (2003). The section of this chapter on trade and productivity discusses
studies pertaining to the selection effect, as well as Head and Ries (1999) with respect toscale economies and the U.S.-Canada FTA.
18 The presence of scale economies is typically measured by estimates of the costdisadvantage ratio, which is a measure of the ratio of average costs to marginal costs inbase data. A variety of types of imperfect competition have been assumed. Althoughtypically firms are allowed to enter and exit, driving profits to zero, in some models thenumber of firms is held fixed.
81
in studies that use both types of models. Direct comparisons of studies canbe potentially misleading because of differences in underlying assumptionsother than those made about scale economies. Market behavior underconditions of imperfect competition is complex, and studies using this typeof model are difficult to compare to studies that assume perfect competition.Studies that incorporate models of both perfect and imperfect competitionoffer better comparisons.
For NAFTA, Roland-Holst, et al., consider three market structures: perfectcompetition with constant returns to scale, Cournot competition, andcontestable markets. Cournot competition assumes that firms compete bychoosing quantities of output after observing the output of other firms. Anygiven firm will choose a smaller output if other firms in the industry areobserved to choose a larger output, taking into account the amount of themarket left over. Each firm has different reactions to different observed outputsof firms, with the degree of this reaction depending on the number and marketshares of other firms in the market and the elasticities that are assumed in themodel. For contestable markets, it is assumed that existing firms set price equalto average cost to deter entry from other firms.19 While the Cournot modelassumes that firms can freely enter and exit the industry, the contestablemarkets model assumes that the number of firms is held fixed. The authors findthat assuming Cournot competition decreases the gain in U.S. welfare, realGDP, and employment20 resulting from NAFTA compared to the perfectlycompetitive case, although introducing contestable pricing causes gains in all ofthese indicators.21 They claim that because firm entry is not restricted in theirCournot specification, aggregate gains are reduced in most countries as“crowding in” by new market entrants drives incumbent firms up their averagecost curves.22
For the Uruguay Round, Harrison et al. (1995) assume a similar Cournotmodel and find that U.S. welfare increases slightly from 0.216 percent to 0.224percent of GDP, compared to their standard constant returns to scale model.Francois et al. (1995) assume that imperfect competition takes the form ofmonopolistic competition where increased specialization in intermediateproducts makes the final goods sectors more productive because of a greatervariety in choice of specialized inputs.23 They find that assuming this form ofimperfect competition increases the impact on welfare from 0.17 percent to0.28 percent of GDP. This study estimated a larger impact than Harrison, et al.
19 De Melo and Tarr (1992), p. 152.20 Most ex ante studies assume a fixed labor supply, so aggregate employment does
not change when trade policies change. Roland-Holst et al. assume an excess supply oflabor and a fixed wage. Under these assumptions, the trade agreements increaseemployment.
21 Roland-Holst, et. al (1994). See table 2-8 on p. 70.22 Ibid, p. 71.23 Francois, et al. (1995), pp. 150.
82
(1996) due to the use of higher estimates of the cost disadvantage ratios andthe use of a form of imperfect competition that captured gains fromincreased input varieties, in addition to the gains from lower average costs inexpanding sectors that were captured in both studies.24
Sectoral ResultsAlthough most studies found that U.S. welfare and other economic
indicators increased in aggregate, the results for these economic indicators weremixed when reported by individual U.S. sectors. While exports and importsexperience some growth for most sectors in all studies, the impact on output,employment, and prices in particular sectors depended on the specifics of eachagreement and structure of the economies involved in the agreement, as well asthe level of aggregation of the model being used.
In Deardorff and Stern (1986) implementation of the Tokyo Roundagreements results in a shift in employment toward the agriculture, forestry andfish sector, which increases by 1.7 percent from its 1976 level, and away fromemployment in production of nontradable goods.25 Their simulation featuresthe removal of substantial U.S. or global non-tariff barriers in the agriculturesector.
For NAFTA, studies found a variety of results. Roland-Holst, et al. (1994)found that U.S. output in transportation equipment would increase by 17.6percent, which the authors attribute to trade diversion. Brown et al. (1994) findthat output in glass products would decrease by 11.8 percent, while the largestincrease in output would be an increase of slightly greater than one percent fortextiles. Burfisher et al. (1994) find that output of corn in the United States,which was disaggregated from the food sector, increased by 4.9 percent to 6.7percent as compared to changes of less than 0.3 percent in all other sectors,including the aggregate farm sector of which it is part. At the implementationof NAFTA about 30 percent of rural Mexican workers worked in the highlyprotected maize sector.26 Also, Trella and Whalley (1994) find that removal ofboth textile and apparel quotas and steel quotas would decrease U.S. output ofapparel by 5.0 percent and steel by 10.7 percent, with only a 0.1 percentreduction in production of textiles.
Sectoral results from studies estimating the effects of the Uruguay Roundusually report that textile and apparel sectors sustained the greatest impact. Thereduction in trade barriers in these sectors, particularly reforms to the
24 See Harrison, et al. (1995), pp. 241, appendix C, pp. 280-284 and Francois, et al.,(1995), p. 141 for discussions about the differing specifications between two of themodels. The specification for Roland-Holst, et al. (1994) is discussed on pp. 60-68.
25 Deardorff and Stern (1986) table 4-5, pp. 56-57, p. 58. Note that overallemployment is exogenous in their model and can only shift across sectors.
26 Brown et al. (1992), p. 1514.
83
Multi-Fiber Arrangement (MFA), were very important in the Uruguay RoundAgreements.27 Various studies of implementation of the Uruguay Roundfound that the removal of quotas under the ATC made up a large part of theincrease in welfare from the entire agreement, ranging from 30 percent to 80percent of all welfare gains for the U.S.28
Studies that report changes in sectoral output attributable to tradeagreements find that, as a rule, the most significant percentage changes forimporting markets consist of output decreases in the apparel sector, followedby the textile sector. Harrison, et al. (1995) found that U.S. employment wasmost impacted in the textile and apparel sectors, where estimated employmentfalls by 10 percent and 25 percent respectively; and that the only sectorpositively affected by more than 1percent is the agriculture sector.29 Similarly,product prices are most changed in the wearing apparel sector (a 10-percentdecrease), the paddy rice sector (an 8.5-percent increase), and the wheat sector(a 5.6-percent increase) with the only sectors changing by more than 1.0percent being other agricultural sectors and textiles.30 Also, although they findthat the welfare gains for the United States decline when a more aggregated12-region model was estimated instead of the standard 24-region model, theycaution that in some cases the more disaggregated model did not alwaysgenerate larger efficiency gains from liberalization.31
The estimated impact of liberalization on the United States appears to bemodest, both in the aggregate and by sector, when compared to other changesthat simultaneously occurred or were expected to occur in the economy.32
Compared to the increase in real GDP between 1979 and 2001,which grewfrom $4.1 trillion to $9.2 trillion in constant 1996 dollars, the gain in overallwelfare attributable to trade agreements was small.
Hertel, et al. (1996) provided an example of a study with a usefulcomparison between baseline changes in the economy and additional changesexpected as a consequence of liberalization. The authors found that expectedincreases in output for the United States and Canada between 1992 and 2005
27 The MFA was replaced by the Agreement on Textiles and Clothing (ATC), underwhich quotas will be eliminated at the end of 2004.
28 Harrison, et al. (1995), Francois, et al. (1995), and Hertel et al. (1995). However,while another study shows that liberalization in textiles and clothing contributed about30 percent of the welfare impact on the United States, it shows that liberalization inagriculture contributed more than 40 percent of the welfare impact. Perroni (1996), table4, p. 16. This data is originally from Nguyen et al. (1995).
29 Harrison, et al. (1995) appendix B.30 Ibid.31 Ibid, pp. 230-231.32 Deardorff and Stern claim that small tariff reductions (from 8 percent to 6
percent) imply a small impact and claim that the “effect of the Tokyo Round on trade,employment, and welfare should be measured in tenths, or even hundredths of apercent.” Deardorff and Stern (1986), p. 59.
84
were not much different whether or not trade liberalization in the UruguayRound took place.33 Output in the textile sector was projected to increase by30 percent between 1992 and 2005 in the absence of liberalization, but byonly 7 percent if the Uruguay Round were included.34 While the differencebetween 30 percent and 7 percent represents significantly less output thanwould otherwise have been produced, use of the dynamic baseline showedthat the general effect of increased demand was likely to outweigh MFNtariff removal. The authors projected an increase for the United States andCanada of 41 percent in aggregate GDP between 1992 and 2005 in theabsence of the agreement, which can be usefully compared to the modestincrease in economic welfare of 0.4 percent of GDP attributed to theagreement.35
Nontariff BarriersThe impact of removing nontariff barriers was generally found to be larger
than that of lowering tariffs. Although nontariff barriers are difficult toquantify, the gains from their elimination may be larger than the gains fromremoving tariffs. The estimated effects of nontariff barriers on welfare can besignificantly altered by the modelers’ assumptions about who gets the rentsfrom such barriers, and about how the barriers are measured.36
Whalley (1984) finds that by accounting just for the quantifiable nontariffbarriers that were to be eliminated as part of the Tokyo Round, the impact onU.S. welfare increased from $430 million (less than one-tenth of 1 percent of1973 GNP) to $2.22 billion.37 Using a similar model, Brown and Whalley(1980) find that eliminating all nontariff barriers increased the impact on U.S.
33 Hertel, et al. (1995), table 14, p. 92. The underlying assumptions driving demandseem to be modest for the 1992 to 2005 period: A 10-percent increase in population,13-percent increase in the labor force, 43-percent increase in the capital stock, 67-percentincrease in human capital, 4-percent increase in total factor productivity growth, and41-percent increase in real GDP. The assumption for total factor productivity was basedon a Global Trade Analysis Project (GTAP) simulation and the other assumptions areestimates by the International Economic Analysis and Prospects Division of The WorldBank (Hertel et al. (1995), Table 6, p. 82.)
34 Hertel, et al. (1995), table 14, p. 92.35 Hertel, et al. (1995), table 6, p. 82.36 In the case of quota-type barriers, if the quota is assumed to be administered by
the exporting country (as in the case of MFA quotas), the rents accrue to the exporter,and eliminating the barrier causes income from these rents to fall for the exportingcountry. If the quota is assumed to be held by a domestic interest, or sold by theimporting country, the same drop in rents affects primarily the income of the importingcountry. Modeling of nontariff measures other than import quotas still involves at leastan implicit assumption about who earned the quota prior to liberalization.
37 Whalley (1984), table 9-3, p. 167.
85
welfare from $780 million (in 1973 US$) to $2.04 billion.38 Deardorff andStern (1986) also conclude that elimination of unquantifiable nontariffbarriers has a significant impact on welfare, possibly even outweighingwelfare gains from tariff reduction.39
The relatively large impact of removing nontariff barriers is strikingly clearin the Roland-Holst, et al. (1994) study, in which estimates of removing tariffsfrom all NAFTA countries are compared to estimates of removing both tariffsand nontariff barriers from all NAFTA countries.40 The estimated increase inwelfare for the United States is 0.08 percent for removal of tariffs only, but1.87 percent of GDP when nontariff barriers also are removed.41 The impacton real GDP is similar, while the relative impact on imports and exports iseven more striking. The estimated increase in imports changes from 0.38percent to 9.37 percent of GDP and the estimated increase in exports changedfrom 0.28 percent to 8.29 percent of GDP.42
However, the large size of these estimates is controversial because these advalorem equivalents were not taken from a direct measure of the trade costs ofnontariff barriers. The measures used by Roland-Holst, et al., which were basedon the number of tariff lines covered by at least some nontariff barriers,misrepresented and may have substantially overstated the degree to whichnontariff barriers imposed a cost on international trade, thereby inaccuratelymeasuring and probably overstating the benefits of removing these barriers.
Other NAFTA studies that focused on specific nontariff barriers yielded asmaller impact. Trella and Whalley (1994) found that removal of textile andapparel quotas between NAFTA countries increased welfare by 0.01 percent ofGDP over a 1-year period and removal of steel quotas between NAFTAcountries increased welfare by 0.006 percent of GDP over 40 years.
Various studies on implementing the Uruguay Round found that theremoval of quotas under the WTO’s Agreement on Textiles and Clothing make
38 Brown and Whalley (1980) table 14, p. 864. It is important to note that abolitionof all non-tariff barriers without the duty reductions from the Tokyo Round woulddecrease U.S. welfare by $1.55 billion (1973 U.S. dollars). This emphasizes that thewhole may be greater than the sum of the parts in measuring the welfare gains fromreducing non-tariff barriers.
39 Deardorff and Stern (1986), pp. 61-63, qualitatively estimate the effects ofchanges in custom valuation, government procurement, import-licensing procedures,subsidies and countervailing duties, and product standards. They also note that thenontariff barriers not covered by the Tokyo Round maybe more important than the tariffand nontariff barrier concessions that were included.
40 The proxy for nontariff barriers is an ad valorem equivalent previously estimatedby the authors in Roland-Holst et al. (1992).
41 Roland-Holst, et al. (1994), table 2-8, p. 70.42 Ibid.
86
up a large part of the increase in welfare from the entire agreement, rangingfrom 30 percent to 80 percent of all welfare gains for the United States.43
Investment DynamicsStudies that allow for dynamic investment flows and a fixed price of
capital show a larger impact on U.S. welfare as a result of implementing theagreements, generally doubling estimates of the impact of the Uruguay Roundon welfare. Unlike the results for scale economies and imperfect competition,the impact can be assessed by comparing studies that allow for investmentdynamics and those which do not.44
Typically studies account for investment dynamics by assuming that theinitial level of the capital stock was optimal and then allowed the rate ofinvestment to fluctuate so that the capital stock adjusts to its new optimal levelas a result of the policy shock while holding the rental rate of capital constant.By comparison, in the static model, the level of investment is held fixed whilethe rental rate of capital adjusts to the trade liberalization introduced in themodel. In the dynamic model, the change in investment alters the amount ofresources in the economy, making the impact on welfare larger while thechange in the rental rate of capital in the static model does not significantlyaffect welfare. However, Harrison, et al. (1996) note that by holding otherfactors constant, these models provide an upper bound on potential welfaregains in the long run, given that the forgone consumption necessary to obtainthe larger capital stock is ignored.45
Dynamic models of this type were used in studies of the Uruguay Round,generally doubling the impact of the agreement. Harrison, et al. (1996) showthat the impact on welfare increased from 0.22 percent to 0.45 percent of GDPwhen they allow the capital stock to be endogenous (determined within themodel by the behavior of other variables) and hold the price of capital fixed ineach country, the opposite of the static case.46 However, effects on employmentand prices by sector changed only slightly when the capital stock isendogenized.47 Likewise, Haaland and Tollefsen (1994) find that the impact on
43 See the discussion at footnote 25.44 One study for which such a comparison can be made is Goldin and van der
Mensbrugghe (1995). However the investment dynamics introduced in their model aremuch different than those used in the other studies.
45 Harrison, et al. (1995), p. 231.46 Ibid, p. 232, table 4, p. 221, table 9, p.229, table 10, p. 232, and table 13, p.239.
This results from is the result using their “the preferred increasing returns to scale model.The results from the constant returns to scale model show that the impact on welfareincrease from to 0.22 percent to 0.43 percent of GDP.
47 Harrison, et al. (1995), appendix B.

87
welfare increases from a 0.05-percent increase to a 0.11-percent increasewhen shifting from a static model to a dynamic model.48
Francois, et al. (1996) find that the impact on U.S. welfare and real wageswas larger when allowing for an endogenous capital stock and an endogenoussaving rate.49 Assuming constant returns to scale, they find that the impact onU.S. welfare increases from 0.17 percent to 0.26 percent of GDP when thecapital stock is allowed to be endogenous and the savings rate is fixed, thuskeeping the capital-to-GDP ratio constant. Welfare increases more, to 0.38percent of GDP when both the capital stock and saving rate are endogenous.50
Moreover, the impact on real wages roses from a 0.30-percent increase to a0.38-percent increase when the capital stock is endogenous. The impact riseshigher, to a 0.51-percent increase, when the saving rate is also endogenized.51
With increasing returns to scale, the shock to U.S. welfare increases from 0.28percent to 0.45 percent of GDP when endogenizing capital but fixing thesavings rate, and increased further to 0.62 percent of GDP when both areendogenized.52 Likewise the impact on the real wage rises from a 0.32-percentincrease to 0.45-percent increase of GDP when allowing the capital stock isallowed to be endogenous, and grows to a 0.62-percent increase when thesaving rate is also endogenized.53
ConclusionDespite various model specifications and different forms of trade
liberalization, most of the models surveyed here showed that the expectedimpact on welfare, exports, imports, and other economic factors from thesetrade agreements was modest compared to general trends in the economy.Whether these models capture the full impact from trade liberalization is stillan open question. In this regard, model validation with respect to historicaldata is difficult to perform, and should be borne in mind.54 However, thepresent work with nontariff barriers, imperfect competition, and the dynamicimpact of investment shows the potential for future development of CGEmodels in these areas, which may reveal other gains from trade liberalizationthat have not yet been analyzed.55
48 Haaland and Tollefsen (1994), table 17, p. 24.49 Francois et al. (1995), table 21, p. 164.50 Ibid p. 164, p. 151.51 Ibid, table 15, p. 157.52 Ibid, table 21, p. 164.53 Ibid, table 16, p. 158.54 See Kehoe (2002).55 See Rutherford and Tarr (2002) for examples of this potential.
88
General Economic Effects of TradeLiberalization in the “Fast-Track” Era
Studies Evaluating Sources of Trade GrowthThis section reviews the econometric literature on trade liberalization and
trade growth. While many studies link U.S. economic outcomes to growth intrade, relatively few identify the role of trade policy changes directly.Non-policy changes such as improved transportation and communicationtechnologies also contributed to trade growth.
In order to provide some context for later studies that assess the impact ofgrowing international trade on the U.S. economy, this section of the literaturereview seeks to better understand the role that trade policy changes have playedin increasing trade. Most recent studies on this topic have attempted to explaingrowth in world trade, not just U.S. trade, and this literature review reflectsthat emphasis. The literature considers three alternatives to trade policychanges as causes for trade growth: U.S. and global income growth,innovations in transportation and communication technologies, and growth ofmultistage production processes.56
The studies reviewed below take two approaches to measuring the effectsof trade policy on trade, and comparing them with other possible causes oftrade growth. Econometric studies identify a list of possible sources of tradegrowth, and use statistical hypotheses and correlation patterns to attributecausation to one phenomenon or another. Simulation methods are used toconsider complex models that are not easily estimated with econometricmethods. Econometric studies of trade growth are often designed to attribute allobserved trade growth to one cause or another.57 Simulation studies typicallyconsider individual phenomena and leave the rest of trade growthunexplained.58 The new analysis in the present report includes econometricapplications in chapters 6 and 8, the first evaluating the impact of NAFTA and
56 Another possible source of global trade growth–but one that does not appear to beaddressed in the literature explaining global trade growth–is unilateral economic reformin developing countries such as India and China. At least one study (Bernard, et al. 2003)reviewed links U.S. economic outcomes to the entry of poor countries into worldmarkets. No studies were identified that linked global trade growth directly to economicreforms in developing countries. Chapter 8 notes that 2.5 percent of U.S. import growthover the period can be attributed to trade in new product-country pairs.
57 Such studies require the assumption that the author has included all of the mainsources of trade growth as explanatory variables. If one source of trade growth has beenleft out, the procedure may attribute trade growth to another source, when it should beattributed to the missing source.
58 Simulation studies require the author to quantify specific behavioral relationshipsthat define the economy’s response to trade policy changes. Estimates from a simulationstudy are based on the assumption that these responses have been quantified correctly.
89
the second considering increases in product variety. A simulation study of allfive agreements is presented in chapter 7.
All of the studies reviewed in this section use an economic model toevaluate historical experience. An economic model is needed to provide aframework for assigning trade growth to various sources. While modelsprovide needed clarity, they also shape conclusions, to some extent. Twoparticular questions about model features are relevant to this discussion. First,is trade growth assumed to be proportionate to income, or does the modelallow income growth to produce a disproportionate increase in trade? In somecases, authors do not explicitly assume proportionate trade and income growth,but the measures they report may require us to interpret their models in thatway for the purposes of this discussion.59 Second, in what manner does themodel allow trade policy changes to interact with other sources of tradegrowth? Models that allow interaction between trade policy changes and othertrade-inducing phenomena attribute a greater portion of trade growth to tradepolicy changes.
The studies reviewed below suggest that the direct effect of trade policychanges explain at most one-fourth of the growth in world trade.60 Otherfactors, particularly income growth, appear to explain a larger share of tradegrowth. When the economic model used to explain trade growth allows tradepolicy changes to interact with other economic changes, especially fallingtransportation costs and the growth of multistage production, trade policychanges explain a greater part of total trade growth. One model withinteractions between tariff changes and multistage production attributes half oftrade growth to tariff reductions.
The Role of Trade Policy in Explaining TradeGrowth
In an article in Brookings Papers on Economic Activity, Krugman (1995)explains that the causes of the growth in world trade are in dispute. He notesthat journalistic discussion of the growth in world trade tend to emphasizechanges in transport and communication technologies, while the academicliterature tends to emphasize the role of trade policy changes. Research since1995 has brought forth further evidence on this discussion, but it remainsdifficult to assign any one cause a leading role.
59 Several authors seek to explain growth in the ratio of exports to GDP. Thismeasure would remain constant if exports and GDP grew proportionately.
60 Since U.S. tariff reductions over the period are more modest than tariff reductionsin the rest of the world, it is likely that a smaller share of U.S. import growth can bedirectly attributable to trade policy changes.
90
Baier and Bergstrand (2001) use an econometric approach to address theissue, estimating a gravity model of trade (a model that empirically relatestrade to measures of the size of the trading economies and of the distancebetween them) to explain trade growth among members of the Organizationfor Economic Cooperation and Development (OECD), an organization thatincludes most of the world’s developed countries. Baier and Bergstrandconsider the period 1958-1988, during which intra-OECD trade increased by148 percent. They conclude that about two-thirds of the trade growth in theperiod can be attributed to growing incomes, about one-fourth to tariffreductions, and less than one-tenth is attributed to lower transport costs.61
Baier’s and Bergstrand’s paper is perhaps the most straightforwardassessment of the relative importance of various explanations for world tradegrowth. While useful, a number of qualifications should be made before anyconclusions are drawn. First, the international transport cost data used in thisassessment appear to be poorly correlated with more reliable measures of tradecosts.62 Second, the experiment does not contain measures of nontariff barrierremoval, which might have given more weight to trade policy changes. Third,the model measures trade in final goods, and does not allow the growth inmultistage production to account for trade growth. Finally, the model does notallow trade policy changes to interact with other sources of trade growth. Thesequalifications are addressed in individual papers that follow, but none of thesubsequent literature has provided the comprehensive overview that Baier andBergstrand provide.
A number of technological improvements in transportation, particularly thecontainerization of freight, have suggested to many that international transportcosts may have declined significantly in recent years. A recent article byHummels (1999) evaluates this hypothesis. Hummels notes that freight ratesaverage about 12 to 15 percent of the value of imported products, so freightrates are a larger impediment to trade than existing tariffs. Ocean shippingfreight charges rose through the 1970s, peaked around 1985, and have fallenback to early 1970 levels. Air freight rates have fallen considerably over time,which is significant because air freight now accounts for nearly 25 percent ofimport value (Hummels 2001). Overall, Hummels concludes that freight rates
61 Baier and Bergstrand consider a fourth potential cause of trade growth, growingsimilarity of incomes across countries. The economic model posited by Baier andBergstrand suggests that increased income similarity should increase trade flows. Theyattribute little, if any, of world trade growth to this fourth cause.
62 In order to obtain transport cost data for all countries in their sample, Baier andBergstrand use matched country trade data from the International Monetary Fund toinfer transport costs. Some countries, including the United States, collect direct evidenceon freight costs. It does not appear that the transport cost data inferred from InternationalMonetary Fund statistics match up well with the directly observed data availableelsewhere. See Hummels and Lugovskyy (2002).
91
as a whole are not appreciably lower than in early 1970s,63 but that rapiddeclines in air freight rates signal an important quality improvement intransportation technologies. Other innovations such as containerization andfaster ocean shipping may also have improved speed, even if thesetechnological changes have not produced lower measured freight rates.
In another article, Hummels (2001) uses the difference between ocean andair freight charges to estimate the value of faster shipping times totime-sensitive importers. Air freight rates are typically 2.5 times higher thanocean freight rates, yet 30 percent of U.S. imports arrived by air in 1998, soHummels postulates that a large number of importers are time sensitive. Usingan econometric model that evaluates importers’ willingness to pay for fastershipping, he concludes that the use of air freight and falling air freight chargesimply significant reductions in the tariff equivalent of time costs associatedwith trade. Hummels estimates that the introduction of lower-cost air freightsince 1950 has been equivalent to a 23-percent tariff reduction formanufactured goods.64 Hummels argues that these reductions may have beenparticularly important in facilitating the growth of multiple-stage production inmanufacturing.
A growing body of literature seeks to better understand multiple-stageproduction, also known as “outsourcing,” “production fragmentation,” and“vertical specialization.” Most trade models, such as the one used in Baier andBergstrand, assume that traded goods cross only one national border. In recentyears, manufacturers have “sliced up the value chain,” segmenting productionof goods into multiple stages in multiple countries. By the time final assemblyis completed, some components may have crossed several international borders.As evidence in the growth of this phenomenon, Feenstra (1998) reports theratio of merchandise trade to merchandise value added. In 1970, the value oftraded goods divided by value added in goods-producing industries was 13.7percent; by 1990 the ratio had grown to 35.8 percent.65 By 2000, the ratiomeasured by Feenstra had risen to 56.7 percent.66 Other industrial countriesalso saw increases in the Feenstra measure.
Hummels et al. (2001) use a similar concept, “vertical specialization,”which is a measure of the value of a country’s imports that are embodied in its
63 Data on the freight charges associated with U.S. trade are available beginningwith 1974. U.S. freight charges in 1998 were approximately 30 percent lower than in1974. However, data from other freight series suggest that 1974 rates may have beenabout 30 percent higher than 1973 rates because of increased fuel prices. The differencebetween the imputed 1973 data and the actual 1998 charges suggests very little change inthe average freight charges between 1973 and 1998. See Hummels (1999).
64 Note that the tariff reductions embodied in the five agreements considered hereimplied average tariff reductions of only 3 percent (see chapter 3).
65 Feenstra (1998), table 2.66 USITC calculations based on USDOC, Bureau of Economic Analysis data. Note
that trade is measured in total value terms, not value added, so this ratio is notconstrained to be less than 100 percent.
92
exports. In 1972, 6 percent of U.S. merchandise export value was importedintermediates; by 1990 that figure had risen to 11 percent of value. Thevertical specialization measure for the OECD increased from 16.2 to 19.8between 1970 and 1990. This suggests that some part of U.S. and OECDtrade growth can be explained by increased fragmentation of production.Hummels et al. provide a decomposition total trade growth. After accountingfor trade growth associated with GDP growth, about 30 percent ofindustrialized country trade growth between 1970 and 1990 can be attributedto vertical specialization.67 Estimates for the United States over a similarperiod indicate that 14 percent of U.S. export growth not explained bygrowing output was due to vertical specialization.
Yi (2001) builds a simulation model in which tariff reductions couldfacilitate vertical specialization. Yi notes that the merchandise export share ofoutput tripled over the period 1962-1999. Standard final goods models couldnot explain this growth without implausible assumptions about consumers’willingness to substitute imports for domestic production. Yi demonstrates thata model allowing tariff reductions to induce vertical specialization can explaina larger portion of world trade growth. In Yi’s model, tariff reductionsexplained only 35 percent of the growth in exports. That 35 percent occurredwhen tariff reductions were assumed not to induce increased verticalspecialization. When tariffs were allowed to induce vertical specialization, themodel explained 53 percent of observed export growth. This model indicatedthat the role of tariff reductions can be magnified if tariff reductions interactwith other phenomena.68
Hummels and Skiba (2003) investigate the interaction between tariff ratesand transportation costs. The authors suggest a number of reasons why lowertariffs might be associated with lower transport costs. For example, lowertariffs may induce increased trade volumes, which may in turn facilitatecompetition among shippers, thus lowering transport costs. Larger tradevolumes may also justify increased investment in transport infrastructure.Hummels and Skiba demonstrate that containerized shipping is more likely onroutes with higher trade volumes. Using an econometric model linking freight
67 Where Baier and Bergstrand attribute a specific share of trade growth to incomegrowth, Hummels et al. measure that part of the trade growth exceeding growth in GDP.Thus, Hummels, et al. explain that portion of trade growth not explained byproportionate growth in trade and GDP.
68 Yi’s simulation techniques do not assign all the trade growth to one cause oranother, as Baier and Bergstrand’s econometric techniques do. In Yi’s model, tradegrowth unexplained by the simulation model is left unexplained. Simulation models likeYi’s might overemphasize trade growth if the trade cost reductions were sufficientlylarge. For example, including the tariff equivalent reductions in the time costs oftransport generated by Hummels (2001) would likely lead Yi’s model to generate moretrade growth than was actually observed. While simulation models allow investigationsof more complex phenomena, such as the interaction between trade costs and verticalspecialization, they do not allow a comprehensive decomposition of the growth in trade.
93
rates to trade volumes, they find that a doubling of trade volumes reducestransport costs by one-third. Thus, if tariff reductions induce trade, theyshould also lead to lower freight charges. Like the Yi model, this modelsuggested that tariff reductions might have spillover effects that magnify theimpact of tariffs on trade.
In a recent controversial piece, Rose (2002) finds that a country’s date ofWorld Trade Organization (WTO) membership is uncorrelated with a largenumber of measures of liberal trade policy. This finding appears to imply thatmembership in the WTO does not induce trade liberalization. However, such aconclusion ignores several important institutional features of the WTO. First,much WTO-induced liberalization takes place not at the time of membership,but in the rounds of WTO-sponsored negotiations taking place aftermembership. Second, a good deal of apparent unilateral liberalization takingplace prior to WTO membership takes place in order to satisfy the members ofa country’s WTO accession party in a process which typically lasts five to tenyears, or longer. Thus, the particular year in which a country gains its seat inthe General Council, as analyzed by Rose, reflects relatively little of thecountry’s actual policy interactions with the WTO.
ConclusionEconometric estimates of the effect of tariff reductions on trade suggest
that tariff reductions explain anywhere from 25 percent to 50 percent of thegrowth in world trade, with models that assume that tariff reductions induceforeign outsourcing yielding higher estimates. Other phenomena, notablyreductions in the cost of air transportation, appear to have been at least asimportant a source of world trade growth.
Estimates of the Effects of the Agreements onTrade
This section presents the relevant findings of quantitative studies that usedata for the period after the agreements came into effect.69 Most of theextensive literature that examines the impact of these agreements on trade areex ante analytical studies. Only a few use actual data to explicitly analyzepreferential trading arrangements and to determine if these arrangements weretrade-creating or trade- diverting. In addition, very few of these studiesinvestigate the direct impact of the agreements. Most employed the gravitymodel to capture the impact of the agreements on trade. Gravity modelsfrequently use binary variables to capture this impact. One problem with this
69 Empirical studies of the Tokyo and Uruguay Rounds tend to be political economycase studies, such as Baldwin and Murray (1997), and Ray and Marvel (1995). Nostudies were found dealing with the U.S.-Israel FTA.
94
approach is that the estimated coefficient on the binary variable measures thetrade effect of the agreements as well as all other events during this periodthat affected trade. To overcome this, more recent studies have attempted touse a more direct measure of the agreements. The estimated coefficient inthese studies provides a more direct measure of the impact of tariffreductions due to the agreements but does not capture the impact of nontariffbarrier reductions owing to the agreements.
A growing body of studies looks explicitly at preferential tradearrangements and their impact on trade. Most of these studies use the gravitymodel to determine the impact of the formation of trading blocs on trade flows.Examples include Frankel (1997), Gould (1998), Krueger (1999), and Baierand Bergstrand (2001). More recent studies employ a more direct measure ofan agreement to measure its impact on trade. These include Clausing (2001),Romalis (2001), and Agama and McDaniel (2003).
Frankel (1997) uses the gravity equation to examine the impact of tradingblocs on intraregional trade and finds that even after holding constant for thenatural determinants of bilateral trade, preferential trading blocs boost tradeamong member countries in the European Community, Association ofSoutheast Asian Nations, the Australia-New Zealand Closer EconomicRelations, the Andean Pact, and the Southern Common Market Agreement(Mercosur). Frankel also examines broader regional groups including WesternEurope, Western Hemisphere and Asia and again finds statistically significanteffects. Frankel cautions that it may not be possible to distinguish from the datawhether true concentration effects were coming from the formal regionaltrading blocs or from the broader regional groups, given the overlap inmembership.
Gould (1998) finds that NAFTA had an effect on U.S.-Mexico trade, but noeffect on U.S.-Canada or Canada-Mexico trade. Gould reports that both U.S.imports from Mexico and U.S. exports to Mexico were, on average, about 16percent higher for each year during the 1994-1996 period than they would havebeen without NAFTA. Gould reports the cumulative impact of NAFTA duringthis period to be $20.5 billion in U.S. imports, and $21.3 billion in exports. Incontrast to these two studies, Krueger (1999) finds no evidence that NAFTAhad any significant effects on North American trade.
In a new application of the gravity model to the analysis of preferentialtrade arrangements, Adams et al. (2003) extensively review existing gravitymodel studies of such agreements as well as undertake new analysis of sixteenbilateral and plurilateral agreements over the period 1970-1997. This analysistakes account of many econometric issues associated with gravity modeling,such as variation across industries and across the provisions of different tradeagreements, controlling for a wide variety of distance measures, and carefullyhandling the large number of observations with zero trade.
Adams et al. find that the model they estimate attributes net trade diversionto twelve of the sixteen agreements under study. Both previous literature andtheir own model associate net trade diversion with NAFTA, while their model
95
associates net trade creation with the U.S.-Israel Free Trade Agreement, whichhad not been previously analyzed using this technique. In a separate analysis ofthe investment provisions of preferential trade agreements, Adams et al. findthat such provisions were associated with larger stocks of direct investmentbetween NAFTA and the rest of the world (both inward and outward), butsmaller intra-NAFTA investment stocks.
More recent studies attempt to use more direct measures of the agreementsto assess the impact on trade. Clausing (2001) was the first to exploit thevariation in tariffs at the detailed commodity level in an attempt to betterisolate the trade effects of the U.S.-Canada FTA . Clausing finds that theU.S.-Canada FTA had significant effects on trade between Canada and theUnited States over the 1989-1994 period. Clausing’s regression results indicatethat U.S. imports from Canada were 26 percent higher owing to the agreement.Clausing estimates that over half (54 percent) of the $42-billion increase inU.S. imports from Canada is attributable to the agreement. In another study,Romalis (2001) uses a methodology similar to Clausing’s to examine theimpact of NAFTA on North American trade. Romalis calculates the tariffpreference owing to NAFTA for one year and examined its impact acrossindustries, finding that NAFTA had a substantial effect on North Americantrade. Romalis reports that the estimated effect of an additional 1-percentpreference is a 0.23- to 0.28-percentage point increase in Canada’s share ofU.S. imports. Similarly, an additional 1-percent preference is associated with a0.18- to 0.28-percentage point increase in Mexico’s share of U.S. imports. In athird study, Agama and McDaniel (2002) extend the work done by Romalis tocapture the time-varying effects of the tariff preference and find that, onaverage, an additional 1-percent preference corresponds to a 11.2- to16.5-percent increase in U.S. import demand for Mexican goods over the 1989to 2001 period. During the NAFTA period, an additional 1-percent preferencecorresponds to a 3.8- to 4.4-percent increase in U.S. import demand forMexican goods. On the export side, the authors find that a 1-percent increase inthe NAFTA tariff preference corresponds to about a 5.1- to 6.7-percent increasein Mexico’s demand for U.S. goods.
There is a consensus in the literature that trade agreements have thepotential to increase trade among member countries. However, questionsinitially raised by Viner (1950) and Meade (1955) remain about the extent towhich these trade agreements are net trade creating or net trade diverting.70
Viner and Meade argue that preferential trading arrangements71 can eitherenhance or reduce welfare, depending on the relative magnitudes of the trade
70 Trade agreements increase trade within the trading bloc as low-cost membercountries displace high-cost domestic producers (trade creation), and divert trade awayfrom non-member countries outside the bloc as member countries reorient trade awayfrom low-cost, nonmember countries towards higher-cost member countries (tradediversion).
71 Unless otherwise indicated, the terms “preferential trading arrangement” and“regional trading arrangement” will be used interchangeably.
96
creation and trade diversion effects. Some economists, such as Krueger(1999) and Burfisher et al. (2001) argue that although this distinction hasbeen modified and amended in a number of ways, the original Viner andMeade conclusion that preferential trading arrangements can enhance orreduce welfare remains. Therefore, the issue of the net effect of preferentialtrading arrangements on welfare is an empirical one. Other economists, suchas Wall (2003), argued that integration affects trade in numerous ways, andfew studies fit into the simple Vinerian dichotomy between trade creation andtrade diversion.
One significant non-Vinerian way for integration to affect trade is throughincreasing returns to scale. If economies of scale can be realized, they offerindividual firms an opportunity to achieve greater internationalcompetitiveness.72 This issue has been explored in the previous section onsimulation modeling in the context of the Cox and Harris estimates of theeffects of the U.S.-Canada FTA. The issue, which will be discussed further inthe section on productivity, is whether significant gains from scale as a resultof trade liberalization can be inferred using estimates of scale effects that arereasonable as opposed to implausibly large.
Most ex ante studies using simulation methods maintain the orthodoxassumptions underlying the pure theory of international trade, including theassumptions of perfect competition and production and consumption ofhomogeneous traded goods. A large number of ex post studies use the gravitymodel to determine the impact of a specific trading agreement on trade.Gravity models are less restrictive than CGE models in that they do not requirestrong explicit assumptions about the structure of the economy in order toprovide results. Burfisher et al. (2001) argue that although gravity models donot incorporate the features of many trade theory models, they provide anempirical way to control for income changes and other macroeconomic shocks.
In its original form, the gravity equation relates the value of bilateral tradeflows to national income and distance. Researchers have commonly extendedthe gravity model beyond its original form in an ad-hoc fashion.73 Dummyvariables (binary variables indicating, in this case, the existence of a tradeagreement) have typically been used to measure the impact of a tradingagreement on trade. Examples of gravity studies include Rose (2000), Feenstra,Markusen and Rose (2001) and Frankel and Rose (2002). These studiesincluded new variables such as common colonial ties, common colonizer,remoteness, landlocked condition, and land area in their models, as well as asingle dummy variable to control for trade within any regional tradingarrangement instead of a set of dummy variables, as in earlier studies. Despitethe lack of agreement among researchers about which additional variables
72 See DeRosa (1998).73 Most authors include additional variables to control for differences in geographic
factors, colonial ties, exchange rate volatility and trade policy.
97
should be included in the extended gravity model, the general consensus isthat members of a common trading arrangement tend to trade more with eachother than they would otherwise. However, unless additional structure isimposed either in the estimation or in the interpretation of the results, thisfinding cannot for many studies readily be interpreted as a confirmation orfalsification of Vinerian hypotheses about trade creation and trade diversion.This consensus among empirical researchers has recently been questioned byGhosh and Yamarik (2003, forthcoming) who used extreme bounds analysis74
to test the robustness of the hypothesis that regional trading arrangements aretrade creating and find that the trade-creation effect of most of thesearrangements is fragile.
A few studies examine the effect of the U.S.-Canada FTA on bilateraltrade. For example, Trefler (2001) uses an econometric framework to assess theimpact of tariff cuts under the agreement on Canadian imports of manufacturedgoods from the United States as a share of Canadian output. Trefler find thatthe U.S.-Canada FTA tariff cuts were a statistically significant determinant ofthese import shares. According to Trefler, the tariff cuts explain most of thelarge shift in import shares experienced by the most impacted industries. Forexample, the ratio of imports to output increased by 72 percent for the mostaffected industries, and this number was very close to the 67 percent attributedto the FTA.
Other studies examine the impact of NAFTA on North American trade. Asnoted, most of these studies use the gravity model to measure the impact ofNAFTA. Gould (1998) uses the gravity model to examine the impact ofNAFTA on the growth of North American trade over 1980-1996, andconcluded that NAFTA had an effect on U.S.-Mexico trade, but had no effecton U.S.-Canada or on Canada-Mexico trade. Gould compared his modelpredictions of bilateral trade flows to actual bilateral flows over this period,and concluded that both U.S. imports from Mexico and U.S. exports to Mexico
74 The traditional econometric approach to the specification problem is to applycertain criteria tests such as correct signs, significant t-values and high R-squares tosearch for the “best” specification. This approach encourages selective reporting from alarge set of estimated models. The extreme bounds analysis of Leamer (1982), andLeamer and Leonard (1983) avoids the selective reporting bias of the traditionalapproach by explicitly incorporating prior information and following a systematicapproach to testing the robustness of coefficient values. Utilizing this approach, Ghoshand Yamarik (2003, forthcoming) summarize the previous gravity model literature intotwo priors–trade creation and trade creation and diversion. For each prior, thek-regressors are divided into two categories: “free” variables and “doubtful” variables.The free variables were always included in previous studies, whereas the doubtfulvariables were not always included. An application of extreme- bounds analysis yieldsthe minimum and maximum values for the coefficient of each free variable when allpossible combinations of the doubtful variables are considered.
98
were on average about 16 percent higher each year during 1994-1996 due toNAFTA. This translated into a cumulative NAFTA impact of $20.5 billion inimports, and $21.3 billion in exports over this time period.
Krueger (1999) uses a gravity model to study North American tradepatterns. She analyzes data for 61 countries over 6 years, comprising everyother year over the 1987-1997 period, but finds little evidence that NAFTA hadany significant effect on North American trade at the aggregate level. Kruegeralso uses “shift-and-share” analysis to examine North American trade at theSITC 1-digit level and reports large increases in Mexican exports of particularcategories of goods, most notably machinery and equipment. Krueger finds thatin instances where Mexico’s share of the U.S. market increased dramatically,Mexico’s share of third country markets also increased. She offers a number ofexplanations for this result. One is that NAFTA was primarily trade creatingand not trade diverting. An alternative is that the exchange rate change in 1995was probably a more important factor than NAFTA in explaining the increasesin trade in individual commodity groups. Krueger concluded that other events,especially those affecting trade through the real exchange rate and Mexico’sother trade liberalization such as the Uruguay Round, appear to havedominated whatever effects NAFTA may have had on trade patterns over thistime period.
Burfisher et al. (2001) examine changes in bilateral trade data for threesectors–agriculture, autos, and textiles–to determine the impact of NAFTA. Theauthors reported that between 1993 and 1998, U.S. agricultural exports toNAFTA partners increased by an annual average rate of 9.5 percent comparedto a 2.8-percent annual increase to non-NAFTA partners. U.S. agriculturalimports from NAFTA countries increased by an average of 13.8 percentannually compared to a 7.7-percent annual increase from non-NAFTAcountries. The study found evidence of increased integration in the NorthAmerican auto industry since NAFTA went into effect. The data showed thatU.S. auto imports from Mexico more than doubled between 1993 and 1998,and U.S. auto exports to Mexico increased 14-fold, albeit from a low base,during this period.
The authors report that since NAFTA, U.S. imports of textiles and apparelfrom Mexico have risen, while imports from East Asia have declined. U.S.textiles export shares to Mexico rose from 13.4 percent in 1993 to 31.0 percentin 1999, but U.S. textiles export shares to East Asia fell from 14.5 percent to10.3 percent during this period. The results were similar for apparel trade. U.S.apparel import shares from Mexico increased from 4.0 percent in 1993 to 13.5percent in 1999, whereas U.S. apparel import shares from East Asia declinedfrom 70.7 percent in 1993 to 55.4 percent in 1999. U.S. apparel export sharesrose from 17.5 percent in 1993 to 31.6 percent in 1999. Other industry studies,such as Wylie and Wylie (1996), found that while there is some tradediversion, the increase in NAFTA trade is dominated by trade creation.
Soloaga and Winters (2001) use the gravity model to study preferentialtrading arrangements and found no evidence of trade diversion for NAFTA.
99
Coughlin and Wall (2000) use the gravity model to analyze how NAFTA haschanged the pattern of exports of U.S. states to foreign geographic destinations.Wall (2003) uses the gravity model to examine how NAFTA has changed theregional pattern of North American trade and finds significant differencesacross countries and regions.
There are a number of ex post empirical studies on preferential tradingarrangements that used alternative methods to the gravity model to capture thetrade effects of specific agreements. For example, the USITC NAFTA study(1997) uses import demand and export demand functions to estimate the effectsof the NAFTA on U.S. trade with Canada and Mexico using an error-correctionmodel and monthly data from January 1989 to October 1996 at the 4-digit SIClevel. Trade flows are assumed to be functions of prices of traded goods anddomestic substitutes, income in the importing country, and, in the case of U.S.exports for which the two prices are denominated in different currencies,exchange rates. The effect of NAFTA is identified using dummy variables for1994, 1995, and 1996. A trade flow at the 4-digit SIC sector is identified ashaving a NAFTA-induced increase or decrease in trade if the dummy variableswere of the same sign and statistically significant for all 3 years.
Using this methodology, the USITC NAFTA study (1997) finds thatNAFTA had a significant effect on the level of U.S. trade with Mexico, butfinds no significant additional effects of the agreement on U.S. aggregate tradewith Canada during this period. As a result of NAFTA, the volume of U.S.imports from Mexico is estimated to have increased by 1.0 percent in 1994, 5.7percent in 1995, and 6.4 percent in 1996. On the export side, the studyestimates that, as a result of NAFTA, the volume of U.S. exports to Mexicowas higher by 1.3 percent in 1994, by 3.8 percent in 1995, and by 3.2 percentin 1996. Further, the USITC states that NAFTA resulted in significant changesin the volume of bilateral trade for a modest number of industries. With respectto U.S.-Mexico trade, the study attributes significant growth in U.S. exports toMexico in 13 industries to the agreement, but finds no industries showingdecreased exports to Mexico due to NAFTA during this period. On the importside, the USITC attributes significant growth in U.S. imports from Mexico in16 industries to NAFTA, and reportes significant declines in 7 industriesbecause of the agreement. With respect to U.S.-Canada trade, the USITC findsthat U.S. exports to Canada increased significantly because of NAFTA in 10industries and declined significantly in 8 industries. Similarly, the USITC findsthat U.S. imports from Canada increased significantly in 13 industries due toNAFTA, and declined significantly in 8 industries.
Romalis (2001) uses a methodology similar to Clausing (2001) to examinethe impact of NAFTA on North American trade. He uses a conceptualframework to develop reduced-form equations in which the shares of U.S.imports of commodities from Canada and Mexico are dependent on the tariffpreferences the U.S. affords to Canada and Mexico under NAFTA. Romaliscalculates the tariff preference afforded to NAFTA partners and examines itsimpact across industries. He concludes that NAFTA had a substantial effect on
100
North American trade. However, Romalis finds no evidence of trade creationand concluded that NAFTA has been primarily trade diverting.
ConclusionEx post studies of U.S. trade performance in the “fast-track” period have
focused on NAFTA, due to considerations of data availability. These estimateshave demonstrated that the NAFTA liberalizations have increased U.S.-Mexicotrade in both directions. While earlier studies had some difficulties identifyingthese increases at all, improved methodologies and a longer post-NAFTA timeperiod have enabled them to be identified with increasing precision, associatingthem with particular products that have now experienced especially deepNAFTA tariff cuts
Effects on Growth and ProductivityFor several decades now, researchers have investigated whether more open
trade has dynamic effects on a country’s economy. Does freer trade cause acountry to grow faster? If so, exactly how does this happen? Many empiricalstudies have posited that freer trade increases a country’s growth rate by raisingthe productivity of a country’s labor and capital (total factor productivity orTFP). The channels through which this could occur include: exposure toincreased competition in the global market; access to new technology via tradein information or imitation of new products; and increased foreign directinvestment (FDI) that may bring new technology.
Researchers testing the relationship between trade and growth most oftenexamine cross-country evidence. They test whether or not countries withrelatively open trade policies, such as the United States, have grown faster thancountries with relatively restrictive trade policies. When a time dimension isadded, they are able to test whether changes in trade policies across countrieshave affected growth rates. Research covering groups of developing countrieshelps us understand whether or not multilateral trade liberalization raisesgrowth in foreign countries, thus increasing the market for U.S. exports.
Much empirical research has been devoted to testing for evidence of theeffect of trade openness on GDP growth, via its effect on total factorproductivity. Using country-level data, researchers have found a large amountof evidence that more open economies do grow faster. Although this work islimited by imperfect measures of trade openness, as well as lack of precision inmodeling links between trade policy and growth, progress on both of theseproblems has been made. Recent work shows that the positive effects of tradeopenness on growth are evident for the United States and other industrialcountries, as well as for developing countries. These results hold for differenttime periods, and for many different measures of trade openness. New evidencealso suggests that the links between trade openness and growth may beindirect, with trade liberalization inducing more investment, and thereby moregrowth.
101
Researchers have also looked at firm-level data to see if there is anyevidence that trade liberalization has increased productivity at themicroeconomic level. For example, if increased exposure to global competitionmakes firms more efficient, we might expect to see firms that produce export-or import-competing goods exhibiting higher productivity than firms producingnontraded goods. In addition, we might expect that less competitive exportingand import-competing firms would either become more efficient or drop out ofthe market, as a result of being exposed to trade. Remaining firms would alsobe likely to price more competitively, since monopoly power would be erodedby new foreign competition. With greater access to foreign markets, firmsmight be able to take advantage of economies of scale, or might accessimported intermediate inputs more cheaply. Both of these factors would lowerfirms’ production costs. Finally, sectors with relatively high levels of FDImight show relatively high productivity, due to technological spillovers fromthe foreign firms. One of the most important limitations of this work has beenlack of data to accurately measure firm productivity. Another difficulty hasbeen the explicit accounting for entry and exit of firms when testing the effectsof trade liberalization on productivity.
Researchers studying trade and productivity most often examine evidenceacross industries within a single country. Many recent studies have examinedU.S. firms in detail. Similar studies for other industrial countries cancorroborate the strength of the results for the United States. Studies of otherindustrial and developing countries can suggest whether or not multilateraltrade liberalization has increased the efficiency of industries globally,contributing to higher incomes and expanding markets worldwide.
Evidence from the United States, other industrial countries, and developingcountries thus far suggests that exporting firms are more productive thannonexporting firms, and that more productive firms self-select to export.Exporting itself may not increase productivity beyond the first year. In contrast,import-competing industries do appear to experience increased productivityafter trade liberalization. Much of this increase occurs because resources shiftfrom less to more efficient firms. Some evidence suggests that exposure tocompetition does reduce mark-ups in import-competing industries, and possiblyencourages more efficient scales of production. FDI may raise firm levelproductivity, at least among the partners in joint ventures. Though the presenceof foreign firms may be associated with decreased productivity indomestic-owned firms within the same industry, they could generate positivespillovers for upstream local suppliers.
Trade Liberalization and GDP GrowthThe relative openness of industrial countries like the United States,
compared to developing countries, and the vast differences in standard of livingbetween industrial and developing countries spurred initial empirical work onpossible links between trade and growth. Edwards (1993) surveys a largenumber of these studies and finds evidence that, across developing countries,
102
freer trade is associated with more rapid growth. However, there were nocomprehensive aggregate measures of a country’s trade restrictiveness at thetime of the Edwards study.
The most popular proxy– the ratio of exports to GDP (or total trade toGDP)–does not necessarily reflect changes in a country’s trade policy. Inaddition, higher rates of GDP growth might cause high export-to-GDP ratiosand vice versa, introducing bias into the estimation procedure. Though theresearchers suggest several ways in which trade openness could affect growth,they do not test these links in their analyses. Edwards concludes that the twomost important areas for future research are in developing better measures ofopenness directly linked to policy variables, and better models of the channelsthrough which trade liberalization could affect growth.
Direct links between unilateral liberalization and growthThe USITC dynamic effects study (1997) reviews a large body of work
from the 1990s that tested for a direct relationship between unilateral tradeliberalization and growth. This research analyzes average annual growth acrosslarge numbers of countries between 1960-1990 or a time period within thatspan. The sample of countries examined have a wide variation of incomelevels, though most often they included only developing countries. All of thesestudies made attempts to address the issues of measurement and modelspecification. Some studies developed single composite indices that reflectedoverall trade policy (e.g., Dollar (1992) and Sachs and Warner (1995)). Othersuse multiple indicators of trade openness (e.g., average tariff rates, coverage ofnon-tariff barriers, the black market premium on the exchange rate) to testwhether or not their results are influenced by the choice of openness measure(e.g. Edwards (1992) and Harrison (1996)). Virtually all of these studies findevidence that openness positively affected average annual growth rates,although the strength of these results depends on the measure of trade opennessused. Often only a few measures of openness appear to be strongly related togrowth.
Harrison’s 1996 study is particularly noteworthy because it demonstratesthe serious weaknesses arising from ignoring time series data. Previous studieshad measured the openness of a country in the initial year of study. Aresearcher studying growth between 1960 and 1990, for example, would use ameasure of openness calculated for 1960. But clearly many countries in thesample liberalized trade during the long time period under examination. Inaddition, the Kennedy and Tokyo Rounds occurred during that period, as wellas a number of preferential or regional trade agreements. Thus, one would notbe surprised if the openness of a country in 1960 was not related to its growthduring the following 30 years. Harrison uses data across countries and overtime, capturing changes in trade policy during this time period. Harrision’sresults show that a much larger number of openness measures had positive,significant effects on growth than previous studies suggested.
103
Edwards’ 1992 study demonstrates the importance of modeling linksbetween trade liberalization and growth. Edwards posits that a country’s growthwas dependent on local innovation and the rate at which the world’s knowledgewas growing. Local innovation would depend in part on the stock ofknowledge and human capital already available in the country. Countries withvery low initial stocks of knowledge would experience larger benefits from the“catch-up factor,” access to world knowledge. More open countries would havemore access to new ideas from the rest of the world. However, it is likely that amore educated work force would increase a country’s ability to absorb thesenew ideas. Thus, Edwards suggests TFP growth would be influenced by initialGDP per capita, openness, and human capital. He finds evidence that thesethree effects were indeed significant in explaining the dispersion of growthacross countries.
The 1997 USITC study concludes that the evidence regarding linksbetween trade openness and growth is mixed. This conclusion is largely basedon the fact that no good single measure of openness exists, and that many ofthe trade openness indicators used by researchers are not necessarily correlatedwith each other (Pritchett (1996) and Lee and Swagel (1997)). Because it is notclear a priori which indicators better capture the overall restrictiveness of acountry’s trade policy, different measures could yield very differentconclusions. The studies by Edwards and Harrison are thus important in thatthey test the sensitivity of their results by using many different indicators oftrade openness. In each case they find multiple indicators that are positivelyassociated with growth. However, the debate on measuring openness has notbeen resolved.
Rodriguez and Rodrik (1999) sharply criticize the trade and growthevidence, due chiefly to the shortcomings of the trade policy measures,although they also criticize model specification. They emphasize that poormeasurement of trade openness could pick up the effects of other variables,wrongly attributing them to trade policy. In addition, correlations between tradepolicy variables and other omitted macroeconomic policies could bias theestimates of the effects of trade policy itself. A notable example is the blackmarket premium on foreign exchange, which Rodriguez and Rodrik show is thekey component of measures like the Sachs-Warner75 openness index.Rodriguez and Rodrik dismiss the black market premium as consistent with anumber of different macroeconomic policies and unlikely to accurately reflecttrade policy itself. Yet there is much evidence that the black market premiumreflects distortions from foreign exchange licensing, which is often directly andpurposely linked to quotas and other nontariff barriers to trade. It is not clear
75 The Sachs-Warner index is a dummy variable indicating whether a giveneconomy is considered to be “open” or “closed” in a given year. See Sachs and Warner(1995).
104
that this critique can really dismiss all evidence based on poor measurement,particularly in regressions using data with time series observations on tradepolicy and a wide variety of measures of trade policy.
The most recent studies have examined evidence from both industrial anddeveloping countries for evidence of a link between trade openness andgrowth. Edwards (1998) estimates growth over two time periods, 1960-1990,and 1980-1990, using panel data for 93 countries, including the United Statesand 21 other industrial countries. From this Edwards calculates 10-yearaverages of TFP growth for each country. Using the model from his 1992study, Edwards estimates the effects of trade openness on TFP growth itself,with 9 alternative measures of openness or restrictiveness. Edwards finds thatopenness is positively and significantly related to growth. A 1-percent decreasein the average import tariff, for example, raises TFP growth by 0.05 percent to0.11 percent. This significant positive relationship is robust to the use ofseveral of the other eight openness measures. There is also strong evidence fora “catch-up” effect. Finally, human capital is also strongly significant and moreimportant in magnitude than openness for explaining total factor productivitygrowth. Interestingly, Edwards finds evidence that enforcement of propertyrights is an important factor in explaining this growth, whereas estimates ofother political or macro variables are not.
Greenaway et al. (1998) investigate growth in 69 countries, including theUnited States and 21 other industrial countries, over the period 1975-1993.They limit their empirical testing to three composite measures ofopenness/trade liberalization, but each of these was based on multipleindicators, such as nontariff barrier coverage, import tariffs (mean anddispersion), black market premium, commitment to trade policy reform,existence or absence of state monopolies in the export sector, and whether ornot the country is socialist. These indices are used to capture both theimmediate effect of trade reform and its average effect during the post-reformperiod. The authors also add three new insights with respect to modelspecification. First, in an attempt to capture the dynamic links between tradeopenness and TFP growth, the authors specify a per capita GDP growthfunction that includes investment, human capital, and population growth.Second, they allow trade reform to have lagged effects. Third, they correct forsecond-order serial correlation. Results for all three measures show asignificant positive relationship between freer trade and growth.
Greenaway et al. find that in any given year, a 1-percentage-point increasein the trade openness measure raised per capita GDP growth by 0.005 percentto 0.01 percent in that year, by 0.004 percent to 0.02 percent in the next year,and by 0.002 percent to 0.02 percent two years later. All three measuressuggest that the largest effects occur one or two periods after initialliberalization. Results also suggest that the impact of a specific tradeliberalization on growth is smaller than the impact of a country’s openness overtime.
105
Frankel and Romer (1999) investigate the relationship between the volumeof trade (trade share) and income levels, rather than trade liberalization andgrowth. Because of the difficulty of measuring trade openness accurately, theauthors propose measuring the geographic component of trade shares. Theauthors use a gravity model to explain the trade share, which was calculated asexports plus imports as a share of GDP. The authors also use distance and thesizes of trade partners, measured by population and area, as explanatoryvariables. This yields a geographic component of trade shares–a factor that isnot endogenous or correlated with macroeconomic variables. They then testwhether geographic trade share and trading partner size could explain thedispersion of income levels across 150 countries, including the United Statesand about 28 other industrial countries, in 1985. The authors find that thegeographic component of trade share has a large, positive and marginallysignificant effect on income level. They note that the geographic component isonly one component of the effects of trade on growth; hence it is likely tounderstate the effect of openness on income levels. The authors alsodecompose income growth (1960-1985), and find a large and marginallysignificant effect of the geographic component of trade share on per capitaincome growth. A one-percentage point increase in the trade share raises percapita income growth by about 1.3 percent.
Indirect links between unilateral and multilateral liberalization,investment, and growth
In a sensitivity analysis of cross-country growth regressions, Levine andRenelt (1992) find that the link between trade openness and growth was notrobust to changes in measures of openness, nor to the inclusion of varying setsof explanatory variables. Instead, they find that freer trade strongly increasedinvestment, and that higher investment strongly increased growth. These resultswere robust, and suggest an indirect link between trade liberalization andgrowth via investment.
Recent papers by Baldwin and Seghezza (1996a, 1996b, 1997, 1998) placegreater emphasis on the indirect link between freer trade, investment, andgrowth. They argue that freer trade may increase the return to capital,generating trade-induced, investment-led growth through such channels asreductions in the cost of imported intermediates; increased demand forinvestment goods (assuming tradables are relatively capital-intensive comparedto non-tradables); and the competitive effects of investment goods, othertradable goods, and/or the financial sector.
Baldwin and Seghezza (1996b) test the impact of trade liberalization onaverage annual growth in the United States and 38 other industrial countriesbetween 1960 and 1989. In a significant departure from previous studies, theyposit that trade openness directly affects the rate of physical capitalaccumulation, thereby indirectly affecting growth. To capture this link, theauthors use a two-equation simultaneous model of growth and investment, andweighted average ad valorem import charges to measure trade restrictions.
106
Results suggest that reductions in trade barriers at home and abroad generathigher rates of investment, with reductions in the home-country trade barriershaving a larger impact than reductions in trade barriers abroad. Baldwin andSeghezza’s main finding is that a 1-percent drop in home countrytrade-weighted import charges raises investment by about 1 percent, while a1-percent drop in the foreign country’s barrier against the home country raisesinvestment by about 0.82 percent. A 1-percent increase in investment raisedGDP growth by about 0.24 percent. However, there was little evidence of asignificant direct link between trade liberalization and growth. These resultsheld for some of the alternative openness measures used.
Wacziarg (2001) analyzes growth in 57 countries, including the UnitedStates and 20 other OECD countries, between 1970 and 1989. The authordevelops a model in which trade policy affects growth indirectly. However, heincludes six channels through which this might occur–incentives for bettermacroeconomic policy (maintaining stability); impact on government size;lower degree of price distortion; higher rates of investment in physical andhuman capital; increased exposure to new technology; and technologytransmission through FDI. To avoid the many problems with measuring tradeopenness, Wacziarg estimates the trade policy component of the trade share.Somewhat analogous to Frankel and Romer, the author estimates the influenceof trade policy variables (tariffs and nontariff barriers) on trade share, as wellas the influence of factor endowments and geographic variables. The estimatedcoefficients on the policy variables were used as weights to construct an indexreflecting the net impact of trade policy on trade share. Like Baldwin andSeghezza, Wacziarg estimates these effects simultaneously, using aneight-equation system. Wacziarg’s results show that an 8.5-percent increase inthe trade policy measure (equivalent to one standard deviation) is associatedwith a 0.61-percent increase in the annual growth rate. Among the eightchannels through which this occurred, investment was the most important (63percent of the total effect), followed by technology transmission (23 percent).
Several studies explicitly examine the role of FDI in influencing aggregategrowth. The USITC dynamic effects study (1997) examines a number of thesestudies, which are again based on cross-country analysis using large groups ofdeveloping countries. These studies find evidence that increased FDIcontributes to higher aggregate growth, but that the ability of a country toabsorb these benefits depends upon its own policies and/or characteristics.Balasubramanyam et al. (1996), for example, found that the impact of FDI ongrowth was stronger for countries with relatively export-promoting policies.Borensztein et al. (1998) argue that FDI may have a more significant effect ongrowth than domestic investment, but this effect only holds if a country has aminimum amount of human capital available. USITC (1997) also discussesevidence suggesting that multinational firms do transfer technology and maygenerate at least some positive spillovers in the host country.
107
Trade Liberalization and ProductivityA number of studies of productivity utilize longitudinal micro-level
datasets, i.e., data which follow the performance of particular firms over time.In particular, the U.S. Bureau of the Census’ Longitudinal Research Database(LRD) is widely used in studies of U.S. firms. In their 2000 survey, Bartelsmanand Doms (2000) review many of these studies in the course of examining theliterature on manufacturing productivity in industrial countries. The LRD is alarge dataset containing information on U.S. manufacturing plants over time.From the descriptive statistics, Bartelsman and Doms conclude that the amountof productivity dispersion across U.S. industries is very large, and is persistentover time; a large proportion of productivity growth is due to exit and entry(resource reallocation); and highly productive firms today are more likely to beproductive in the future. They also observe that regulation that inhibits resourcereallocation can be detrimental to productivity growth, that productivity of anestablishment is related to the productivity of the firm that owns it, and that thechoice of technology across establishments is correlated with the level ofhuman capital in the establishments.
Bartelsman and Doms emphasize that it is easier to identify such stylizedfacts in the micro-level data than to isolate econometrically the effects ofpotential underlying determinants of productivity changes such as internationalexposure, domestic regulation, ownership structure, managerial quality,technology choice, and human capital, and that much observed variation inindividual firms’ productivity performance remains unexplained.
Global competition and the productivity of exporting andimport-competing firms
If increased exposure to global competition makes firms more efficient, onemight expect to see exporters and import-competing firms exhibiting higherproductivity than firms producing for the domestic market only. Examining theU.S. Census LRD, Bernard and Jensen (1995) find a strong correlation betweenexporting and productivity. In their 1999 study, Bernard and Jensen find thatU.S. exporting firms are 50 percent to 60 percent larger and 7 percent to 22percent more capital-intensive than firms producing for the domestic marketonly. U.S. exporting firms also had 12-percent to14-percent higher laborproductivity, and pay 9-percent to 18-percent higher wages than nonexportingfirms. The question was whether exporting itself raises firm productivity, orwhether more productive firms choose to be exporters.
Using data for more than 50,000 plants per year for 1984, 1987, and 1992,Bernard and Jensen calculate the differential between U.S. exporters and U.S.nonexporters with respect to wages, employment, TFP, and a number of otherfactors. They attempt to determine whether exporter status helps explain thesedifferentials. Their results suggest that more productive firms self-select to beexporters, and that future exporters already have desirable performancecharacteristics several years prior to entering the export market. In fact, future
108
exporters grow faster in the years prior to entering the export market thanfuture nonexporters do. Exporting appears to raise growth rates in the initialyear, but seem to have little effect on growth rates after that.
Tybout (2000) summarizes evidence found in developing country studies,which by far accounted for the largest share of the literature on this subject todate. He concludes that exporting firms do have higher productivity thannonexporting firms, but again due to self-selection, with the more productivefirms selecting to export. The efficiency gap between exporting andnonexporting firms does not seem to grow over time, suggesting that littleimprovement occurs once already efficient firms have begun to export.However, the gap grew in some firms in some industries, so longer term effectscannot be ruled out. Recent work by Aw et al. (2000) suggests that productivityis a critical factor in Taiwan firms’ decision to export, and that in some casesTaiwan firms’ productivity did increase after entering the export market.However Aw, et al. found little evidence of these effects for Korean firms.Delgado, et al. (2002) argue that self-selection is the main determinant behindrelatively high productivity among Spanish exporting firms.
A recent study of United Kingdom manufacturing firms also providedevidence that exporting firms are generally more productive than nonexportingfirms, and that these firms self-select–i.e., firms that are more productivechoose to enter the export market (Girma, Greenaway, and Kneller (2002)).However, in contrast to earlier studies, Girma et al. try to compare theperformance of exporting firms to nonexporters with similar characteristics(size, wage levels, and initial productivity level). Their results show thatexporting firms tend to have higher productivity than nonexporters, not only inthe first year of exporting, but also in the second year. Thus, exporting appearsto increase productivity growth. They also find that the degree to whichexporting affects productivity growth in the initial year depends upon theexport-intensity of the firm.
One serious difficulty in all of these studies is measurement of productivity.Bartelsman and Doms (2000) point out that researchers usually measure thechange in the value of a firm’s output, deflated by an industry price index. Ifquality improvements have taken place that are not reflected in the pricedeflator, this will bias downward the estimate of firm productivity. In addition,if there is imperfect competition in an industry and differentiated products,prices may differ across firms. Assuming a single price deflator for an industrywill incorrectly assign higher productivity to firms with higher-than-averageprices. Finally, if firms’ choices of inputs today are affected by theirexpectations of productivity in the future, some of the impact of productivitychange will not be picked up by standard TFP calculations.
Several recent studies have taken up these issues. The USITC’s dynamiceffects study (1997) reviews Harrison’s 1994 study, in which the measure ofproductivity is revised to allow for market power and scale economies. Thiscorrection leads to stronger effects of trade liberalization on productivity thanare obtained without it. Katayama et al. (2002) provide evidence that standard
109
measures of plant productivity growth are biased downward owing to productdifferentiation and differences in firm mark-ups. As a result, these measurestend to underestimate the productivity of exporting firms.
Pavcnik (2002) provides evidence (from Chilean firms) that theendogeneity between a firm’s choice of inputs and its expectations of futureproductivity creates a large downward bias in the measurement of firmproductivity. Pavcnik also notes that plant closings can be a problem. Firmsthat are relatively more productive today are less likely to shut down. If plantprofitability is at all correlated with investment in capital, this will introduce abias in the calculation of firm productivity growth. Pavcnik finds evidence ofsignificant bias when the correlation problem is not corrected.
Another serious difficulty is export market entry and exit. As Bernard andJensen (1999) note, a large amount of entry into and exit out of the exportmarket occurs in any given year within U.S. manufacturing. New entrantsexperience the fastest growth in employment, wages, TFP, shipments, valueadded, and other indicators, followed by incumbent exporters (those who haveremained in the market for at least one year). Exiting exporters show slowergrowth on all indicators. Yet in Bernard and Jensen’s analysis, the determinantsof entry and exit are not accounted for when testing for a relationship betweenexporting and productivity. If exiting firms are indeed less productive thanthose that continue to export, a bias can be introduced in the estimated effect ofexporting on productivity.
The USITC dynamic effects study (1997) presents a detailed discussion ofstudies examining the performance of import-competing firms for the UnitedStates, other industrial countries, and developing countries. Two studies usingU.S. firm-level data and several different measures find that increased importcompetition raises an industry’s efficiency, once industry concentration wastaken into account. Caves and Barton (1990) found that a one standarddeviation increase in import competition (a 10-percent increase in imports)increase an industry’s efficiency by 0.05 standard deviations. For highlyconcentrated industries, MacDonald (1994) finds that a 5-percent increase inimport share over three years was associated with a 3.7-percent increase inannual labor productivity growth over the next three years. In addition, anindustry-level study using U.S. data from 1958-1984 shows evidence that freertrade might cause a short-run drop in productivity, but a long-run increase(Harrison and Revenga (1995)).
Many of the developing country studies described in the USITC dynamiceffects study (1997) also show evidence that increased import competitionraises productivity in import-competing firms. Harrison (1994), for example,finds that firms in Côte d’Ivoire had higher levels of productivity after tradereform, and that low-protection sectors showed higher productivity increasesthan high-protection sectors. Tybout (2000) also cites evidence that protectedindustries show higher productivity dispersion than nonprotected industries.
Pavcnik (2002) also discusses the question of productivity ofimport-competing firms in a developing-country context. Pavcnik classified
110
Chilean firms as net exporters or net importers and allowed for differentresponses to trade liberalization between the two groups and finds strongevidence that there were significant plant closings after Chile’s major tradeliberalization (1979-1986), and that a much larger proportion of these tookplace in import-competing sectors than export sectors. Thus, much of theadjustment to trade liberalization was experienced in the form of plant exit. Shefinds strong evidence that aggregate industry productivity increased in six outof eight sectors, growing the most in import-competing sectors, and the least innon-traded goods sectors, and suggesting that exposure to global competitiondoes increase efficiency in import-competing sectors.
Trefler examines the impact of the U.S.-Canada FTA on Canadian firms.Using data on more than 1,000 plants, Trefler examines labor productivity,TFP, and many other variables before (1980-1986) and after (1988-1996) theimplementation of the FTA. One of the important innovations in this study wasthat it directly examined the impact of the changes in tariffs at the industrylevel, on the firms in that industry. This focus allows Trefler to see whether ornot the size of the tariff cut influences the industry’s performance. Forindustries subject to large tariff cuts, Trefler finds that employment, output, andthe number of plants fell in the short run. However, these same industriesexperienced very large productivity growth over the longer term.
Head and Ries (1999) address the question of potential rationalization ofCanadian industry as a result of the U.S.-Canada FTA. In principle, exposure ofdomestic firms to a larger market was thought in the policy debate on the FTAto potentially generate substantial efficiency gains through domesticrationalization, with a smaller number of Canadian firms enjoying increasedscale economies.
Head and Ries note that data on Canadian manufacturing seem to indicatethe occurrence of post-FTA rationalization. In the 6 years following theagreement (1988-94), manufacturing output per plant grew significantly whilethe number of plants fell. Yet their tests suggest that the net effect ofUS-Canada FTA liberalization on scale economies was smaller than predictedprior to the agreement. While lower U.S. tariffs toward Canada enabled a10-percent increase in output per plant for Canadian firms, lower output owingto lower Canadian tariffs tended to offset this effect almost entirely. Theauthors attribute the observed rise in aggregate output per plant to non-FTAeffects, such as a shift in output toward high scale industries, undercounting ofsmall plants in the data, and a depreciation of the Canadian dollar.
Trefler (2001), who measures short-run and long-run effects separately andfinds long-run productivity gains for Canadian firms after implementation ofthe trade agreement, argues that a large part of these long run gains were aresult of reallocation of resources from less efficient plants to more efficientplants. Pavcnik also finds that the increase in productivity experienced byChilean industries following a period of liberalization (1979-1986) was largelydue to reallocation of resources within industries, from less efficient plants tomore efficient plants. These results taken together suggest that firm selection
111
effects (entry and exit) play an important role in facilitating gains from tradeliberalization, with scale economies of secondary importance, if any.
Using industry-level data, Benjamin and Ferrantino (2001) evaluateproductivity growth in 13 OECD countries and 18 manufacturing sectors, withdata from the 1980s. Within individual sectors, the authors find strongconvergence effects within the OECD. Controlling for this convergence, theyfind evidence of a positive relationship between low tariffs and productivitygrowth, though none between import penetration and productivity growth. Asin other studies, the authors find a positive association between highproductivity growth and strong export performance.
Bernard et al. (1980) test whether or not aggregate industry productivity inU.S. manufacturing rises as trade costs (tariffs and transport costs) fall due tothe closing of lower productivity nonexporting plants; entrance of moreproductive nonexporters into the export market; and increase in output of themore productive exporting firms. U.S. trade costs were measured for 5-yearintervals from 1977-1996. Again using the Census LRD, the authors find that a10-percent decline in trade costs is associated with a 1.5-percent increase inannual productivity growth rates. Declining trade costs do appear to increasethe probability of plant closure and the probability of successful entry intoexporting, though both of these results are only weakly significant.Low-productivity plants are the quickest to shut down, and highly productiveplants that do not produce export products are the most likely to beginexporting. A 1-percent decline in trade costs also causes exporters to increaseforeign sales by about 1 percent, though again this result is only weaklysignificant.
There are a number of limitations in this work, however, which suggest theneed for more study. The authors’ results show that only a very small part ofTFP growth or labor productivity growth can be explained by changes in tradecosts and some industry characteristic dummy variables. This suggests thatthere are omitted variables that explain a large part of the productivity variationacross U.S. manufacturing plants. In estimating the probability of plant closure,the authors use plant labor productivity, exporter status, and change in tradecosts as determinants. Yet their first test and a subsequent test reveals that thesethree variables influence each other, calling into question the reliability of theresults. In addition, the questions of plant closure and of entry into the exportmarket appear to call for some kind of duration model, since plant survival inthe last period is contingent on plant survival in the first period, and only aplant that survives can become an exporter.
Reductions in price distortions and production costsTrade liberalization means domestic firms face increased foreign
competition, which makes it more difficult to maintain monopoly power in amarket, and thus should result in lower price-cost margins, and expandedoutput–the “imports as discipline” hypothesis. In addition, access to the globalmarket could lower production costs through economies of scale, or cheaper
112
imported intermediate inputs. While the effect of freer trade on productivity viathese channels is important for both industrial and developing countries, it islikely to be larger in countries with small domestic markets. Tybout notes thatseveral studies provide evidence to support the imports-as-disciplinehypothesis. For example, both Harrison (1994) and Levinson (1993) findevidence that the more highly protected firms had higher price-cost markups,and some evidence that these mark-ups fell with trade liberalization in Côted’Ivoire and Turkey. Krishna and Mitra (1998), incorporating flexibility inreturns to scale in their analysis, find strong evidence that India’s 1991liberalization reduced price-cost margins in a variety of Indian industries.Because explicit trade policy measures are not used in these studies, however,it is possible (as Tybout notes) that these results capture other effects, such asexchange rate appreciation, or reflect falling relative import prices rather thanreductions in market power.
In a recent study, Kim (2000) tests for the impact of trade liberalization onproductivity of Korean firms, via its effects on price-cost markups and scaleefficiency. Using data on 36 manufacturing sectors, Kim calculates TFP foreight periods between 1966 and 1988. The author then estimates a modifiedform of the production function, which incorporates the possibility of imperfectcompetition and increasing returns to scale, as well as interactions betweenthese characteristics and trade policy. In contrast to the earlier studies that usedbinary variables to represent post-liberalization periods, Kim uses threealternate measures of trade policy (tariffs, quota coverage, and the price gapbetween goods sold domestically and those sold internationally). Kim findstrong evidence that Korean firms are imperfectly competitive, and displayincreasing returns to scale. Although tariffs appear to be unrelated to TFPgrowth, reductions in quota coverage and reductions in price gaps significantlyincrease TFP growth. In addition, reductions in quota coverage significantlyreduce price-cost markups and increase scale efficiency.
FDI, technological spillovers, and firm productivityTrade liberalization typically involves liberalization of FDI as well. Many
have argued that sectors with relatively high levels of FDI might showrelatively high productivity, due to technological spillovers from the foreignfirms. Evidence from firm-level studies appears to be mixed. Doms and Jensen(1998) find that foreign-owned firms in the United States have 2.3-percent to3.7-percent higher TFP than domestic-owned firms. When comparing foreignmultinationals to U.S. multinationals, they find that U.S. multinational firms’domestic plants are the most productive, but that foreign-owned firms are moreproductive than U.S. domestic firms with no overseas assets. While thisevidence supports the idea that firms that invest abroad have relatively higherproductivity, it does not directly test for evidence of spillovers from theseforeign firms to the domestic counterparts in the same sector.
Studies that examine industrial and developing country FDI in specificdeveloping countries show evidence that FDI brings with it more efficient
113
technology, but the evidence on diffusion is mixed. Haddad and Harrison(1993) find foreign-owned firms to be more productive than their domesticcounterparts, and firms in industries with a relatively high multinationalpresence to be more productive than firms in other industries, in Mexico andMorocco. Aitken and Harrison (1999), using Venezuelan plant-level data, findthat foreign equity participation is positively correlated with plant productivity,though only for small firms. However, higher multinational presence isassociated with less productive domestic-owned firms. As Tybout and theauthors note, this may be because the multinational firms bid up the cost ofskilled workers and/or attract demand away from local competitors. Theauthors conclude that some of the positive association between productivityand multinational presence is due to the tendency for multinationals to invest inthe relatively productive sectors, and that benefits from this investment do notspill over to domestic-owned firms, but are internal to the joint venture.
More recently, Smarzynska (2002) tests for FDI spillovers using Lithuanianfirm-level data. As in Pavcnik, Smarzynska calculated TFP growth correctingfor endogeneity between expectations of future productivity and the firm’schoice of inputs today. Smarzynska introduces two innovations in the study.First, she looks for evidence of spillovers within the industry and at otherpoints in the production process. Second, she investigates whether spilloversare both local and regional. She finds evidence that suggests the presence ofspillovers between foreign affiliates and their domestic upstream suppliers, butno evidence of spillovers between firms in the same industry. Local firmsappear to benefit from spillovers in their immediate region as well as fromspillovers from other parts of the country. While type of foreign ownershipappears unimportant, foreign firms producing for the local market appear togenerate greater productivity benefits than those producing for export.
ConclusionA wide variety of evidence now points to an association between trade
liberalization and faster rates of economic growth, both in the United Statesand abroad. When research focuses on particular causes of economic growth,such as increased investment or accelerated productivity gains throughtechnological change, evidence for the linkage between freer trade and morerapid growth Methodological improvements have diminished somewhat earlyskepticism about the robustness of the trade-growth connection.
In the case of productivity gains, many studies find that causation runsfrom productivity to exports rather than vice versa, so that firms which becomemore productive choose to export. There is also relatively strong evidence thatexposure to trade causes industry output to shift from less-productive tomore-productive firms, and some industry-level evidence for higher rates ofproductivity growth in industries exposed to import competition or trade policyliberalization. Evidence of direct links between trade liberalization and scaleeconomies remains harder to identify.
114
Effects on Labor OutcomesOver the last three decades, reductions in U.S. tariffs and increased trade
volumes have coincided with growth in the gap between wages paid to skilledand unskilled workers in the United States. For example, the ratio of wages fornonproduction to production workers in the U.S. manufacturing industryincreased 16 percent between 1977 and 2000 (figure 3-5 in the previouschapter).76 In addition, between 1975 and 1999 the mean real earnings ofworkers 18 years old and over increased by 47 percent for those with anadvanced degree while those with no high school degree decreased by 6percent (figure 3-6). A sizable economic literature has sought to betterunderstand the degree to which trade in general, and trade policy in particular,has contributed to the growing wage gap.
Studies that evaluate trade policy changes generally find little or nomeasurable impact on U.S. labor market outcomes. For example, Haskel andSlaughter (2000)77 model the share of price changes resulting from trade policychanges, and their estimates suggest that tariff changes in the 1970s and 1980shad no significant impact on the wage premium. In addition, most studies ofNAFTA and the U.S.-Canada FTA find that these agreements had little or noeffect on U.S. labor market outcomes.
Studies of displacement of individual workers in trade-sensitive industries,in general, find that although import-competing displaced workers’ experiencesare similar to non-import-competing displaced workers, import-competingdisplaced workers are slightly older, more likely female, and slightly less likelyto be re-employed. Depending on the source data, geographic coverage, andsample period, findings differ on the effect of displacement on subsequentearnings if re-employed. Relatively few studies, however, evaluate a direct linkbetween trade policy changes and job displacement or wage inequality. Thissection also reviews a growing literature on the transition costs associated withadjustment of labor.
A considerably larger literature investigates the impact of changes in thelevel and composition of U.S. trade on labor market outcomes. While thesestudies make no direct link to trade policy changes or to specific tradeagreements, their conclusions can offer insight into the effects of trade on theU.S. economy. Most of these studies suggest that increased trade hascontributed to growing inequality in wages. Other economic forces, however,such as rapid technological change, appear to have had a greater impact thantrade. Consensus estimates suggest that approximately 10 percent to 20 percentof the growth in the wage gap should be attributed to changes in international
76 For a discussion of the use of production activity as a proxy for worker skill level,see Feenstra and Hanson (2001), footnote 4, pg. 3.
77 Haskel and Slaughter (2000) p. 16. In checking for robustness, they concluded,“all checks yielded the same qualitative finding: mostly insignificant mandated changesin the U.S. skill premium.”
115
trade. These studies are reviewed in the next section, along with a variety ofstudies that reach conclusions different from the consensus view.
Economic TheoryThe best-known statements from trade theory about wages come from the
Heckscher-Ohlin model, a widely-used workhorse of academic theory.78 Thismodel, in its simplest form, describes a situation with two countries, twogoods, and two factors or inputs into the production process. The two factorsare usually described as labor and capital, and can also be usefully thought ofas skilled labor and unskilled labor. The model requires stringent assumptionsincluding identical technology and tastes, homogeneous products, two goodsproduced by two factors (or more generally, n factors and m goods),incomplete specialization, and constant returns to scale. A main result of themodel, the Stolper-Samuelson theorem, describes long-run results of tradewhere factors of production are completely mobile, such as the liquidation andredeployment of capital or the training of labor.79
The Stolper-Samuelson theorem, which links product prices to factorprices, has also assumed importance in the debate on trade and wages (Stolperand Samuelson (1941), pp. 58-73)). This theorem explains what happens whena country faces altered relative prices for its exports and imports. Thesealterations can occur when a tariff is imposed or removed or when otherfluctuations in world markets alter the terms of trade. When the relative priceof one good increases, the economic returns will increase for the factor that is
78 For a basic discussion of the Heckscher-Ohlin model, see Krugman and Obstfeld(2000), pp. 66-91, 729-731; Caves et al. (2002), pp. 107-128, S-23 - S-27; and Markusenet al. (1995), pp. 98-126, 445-451. For more detailed explanations, see Bhagwati et al.(1998), pp. 53-90, 107-130; and Wong (1995), pp. 23-138. Wong intermingles thetreatment of the Ricardian, Heckscher-Ohlin and specific factors models.
79 Another result of the Heckscher-Ohlin model is the Factor-Price EqualizationTheorem, which states that if countries that share the same technology engage ininternational trade, and if trade equalizes prices, then the rewards to labor and capital (orskilled labor and unskilled labor) will be equalized in the trading countries. Theimplication for advanced countries like the United States, which is relatively moreskilled-labor abundant, is that free trade would cause the wages paid less-skilled workersto fall to an absolute international level and increase wages of less-skilled workers indeveloping countries. This theorem is consistent with the popular notion that free tradewould cause U.S. less-skilled worker wages to fall to the much lower world averagewage. Conditions in the real world, however, diverge sharply from the strict theoreticalassumptions required for the Factor-Price Equalization Theorem to hold, such asinternational differences in technology, the tendency of consumers to prefer goodsproduced in their home countries, transport costs, and scale economies. Nonetheless, thetendency for trade liberalization to cause at least some price convergence acrosscountries means that in principle, some associated wage convergence takes place as well,with the amount and speed of such convergence being a matter for empiricalinvestigation.
116
more intensely used in the production of that good. The economic returns tothe other factor will decline. For example, if the relative prices of goodsusing mostly unskilled labor decline relative to the prices of goods usingmostly skilled labor, then the wages of unskilled labor should fall relative tothe wages of skilled labor, and vice versa. Consequently, changes ininternational trade or trade policy that affect relative wages should be evidentin concomitant changes in relative prices of goods. The implication foradvanced countries, such as the United States, which is relativelyskilled-labor abundant and would witness a relative decline in unskilled-laborintensive product prices, is that trade liberalization would decrease the realwage of less-skilled labor.
The Heckscher-Ohlin model assumes that workers in all industries earn thesame wage at any point in time, and similarly that capital in all industries earnsthe same rate of return. A corollary of this is the prediction that if tradeliberalization leads to lower relative prices for unskilled-labor-intensive goods,all affected workers tend to oppose that liberalization, while all owners ofcapital (or skilled workers) tend to support it. In reality, proposals to raise theprice of imports tend to be supported actively by both workers and firms in theindustry involved. Workers in other industries with similar skill sets andeducational levels generally have little comment, positive or negative, about thepolicy changes. This outcome occurs because workers in different industriesare in fact different, as is capital equipment used in different industries. Thesefacts are reflected in the specific-factors model, which focuses on the differingexperiences of workers across industries as trade is liberalized.80 As mentionedabove, the Heckscher-Ohlin model assumes that factors are completely mobile,whereas the specific-factors model assumes that some factors of production aretied to a particular industry and cannot move at all. If trade liberalization leadsto increased imports, and the price falls for domestic goods that compete withthose imports, capital or labor resources in the import-competing industry thatcannot move receive lower rates of return, while immobile resources in theexpanded export industry receive higher rates of return. The specific factorsmodel explains why the views of workers and firms about trade liberalizationtend to be influenced relatively heavily by industry type, rather than by theparticular assets or skills that those firms or workers possess.
The situation in actual labor markets represents an intermediate positionbetween that represented by the Heckscher-Ohlin model, in which workers canmove freely between industries without any change in wages, and the limitedlabor mobility of the specific factors model. The compensation of workersreflects in part specific job skills or “human capital” acquired in the industriesand firms for whom they work. A significant portion of these skills are
80 For expositions of the specific-factors model, see Krugman and Obstfeld (2000),pp. 37-65 and pp. 723-728; Caves et al. (2002), pp. 91-106, and pp. S-17 - S-22;Markusen et al. (1995), pp. 127-141 and pp. 452-464; Bhagwati et al. (1998), pp. 91-106ff.; and Wong (1995).
117
industry-specific, and thus are not worth as much when the worker changesjobs or industries. Other skills are more universally useful. If marketconditions generate new opportunities, workers may actually find that theirskills are worth more in a different job or industry, and change jobs for thatreason. Thus, some workers will move from industry to industry dependingon the market forces affecting those industries, but may experiencesignificant costs, such as reduced wages, if their skills are firm or industryspecific. This means that labor markets create significant incentives forworkers to remain in their current jobs. Workers generally move from oneindustry to another only when market conditions change. These changingconditions may be positive, as when better job opportunities arise, ornegative, as when jobs are lost in a certain sector.
In summary, international trade theory predicts that for a country such asthe United States, rich in physical and human capital, and which hastraditionally placed import restrictions on goods made with less-skilled labor,trade liberalization may lower the returns to less-skilled labor. This prediction,though useful, is made under a simplified set of assumptions that abstract fromthe rich variety of phenomena occurring in actual labor markets.
Empirical Studies of Wage InequalitySince the 1970s, there has been a steady rise in the wages of more-skilled
U.S. workers relative to the wages of less-skilled workers, and increasingincome inequality. This trend is apparent whether workers are compared byeducation, occupational category, or other proxies of skill, or whether incomeinequality is measured by wages, family income, or poverty levels. Forexample, wages of college graduates were approximately 38 percent higherthan those of high-school graduates in 1979, but were 63 percent higher in1993 (Burtless (1997)). In 1985, median weekly earnings of males working fulltime in managerial and professional specialty occupations were 79 percenthigher than for operators, fabricators, and laborers; by 2000 they earned 104percent more.81
Although there is a general consensus that increasing inequality has beendriven by declining demand for less-skilled workers resulting in an increasingskilled-wage premium, the sources of this demand shift and growing wage gapare still at issue. Two commonly cited causes are increased international trade,or more accurately increased competition from low-wage or developingcountries, and technological change. Increased imports of goods produced withless-skilled labor might have pushed down the relative wage of such labor,particularly if such imports pushed down the relative price of such goods.Alternately, technical change may have increased the demand for intellectuallabor relative to manual labor, for example, for computer skills relative to
81 USITC calculations using Bureau of Labor Statistics data.
118
mechanical skills. This could account for the change in relative wages evenin the absence of influences from international trade.
Katz and Autor provide a comprehensive discussion of recent changes inwage structure and a review of various explanations.82 The authors cite threemain explanations for increasing inequality: (1) an increased growth rate ofthe relative demand for highly educated and more-skilled workers driven byskill-based technological changes, (2) rising globalization pressures in reducingmanufacturing production employment and thereby shrinking the relativedemand for the less educated, and (3) a slowdown in the rate of growth of therelative supply of skills and an increased rate of unskilled labor immigration.
Katz and Autor used a supply-demand-institution framework to assess thesethree primary explanations. They found that, “Substantial secular increases inthe relative demand for more-educated and more-skilled workers appearnecessary to explain . . . the evolution of the wage structure,” andwithin-industry skill upgrading “appears to be the major driving force in therise in the relative demand for the more skilled.”83 The authors added thatskill-biased technological change appears to be a key factor and is somewhatmore important than international trade changes.
A prevalent method of understanding the various analyses is to categorizestudies based on the type of data employed, product price or trade volume.Arguing from the Stolper-Samuelson theorem, if imports ofunskilled-labor-intensive goods depress U.S. wages of unskilled labor, therelative prices of such goods should be falling. Some studies suggest thatrelative prices of unskilled-labor-intensive goods in the United States have notfallen (Lawrence and Slaughter (1993)). In light of the Stolper-Samuelsontheorem, this finding can then be interpreted as meaning that increased importshave had minimal effect on the wages of unskilled labor. Studies of this typeusually conclude that most of the increase in the skilled-wage premium is dueto technological change. For example, Slaughter’s 1998 review of the literaturefound that, in general, product-price changes explain very little of risinginequality. Also, Harrigan (2000) analyzed the role of prices and finds that thedirect impact of import prices on wages is negligible. In reviewing nineprice-based studies, Slaughter found that the results are relatively sensitive tothe selection and weighting of industries sampled and to the decade considered,whereas the results are relatively insensitive to the extent of data aggregationand skills measurement choice (Slaughter (2000)). The treatment of certainindustries, such as computers for which appropriate price measures areproblematic, can significantly affect study results (Sachs and Shatz (1994)).
82 For a general overview of historic changes in wage structure and inequality, seeKatz and Autor (1999). See also Feenstra (2000).
83 Katz and Autor (1999), p. 1539.
119
Several criticisms have been made of studies that use product prices toinfer the effect of trade on wages. A common critique is that unskilled andskilled labor may not be well-measured by proxies such as production andnonproduction workers. Also, price-based studies ignore other factors that shiftprices such as change in consumer demand/taste, increasing per capita income,and falling real value of minimum wage. Another concern with price-basedstudies is that other features of the world changed at the same time as productprices. In particular, the U.S. supply of college graduates relative toless-educated workers has increased in recent decades. The results of suchstudies can be sensitive to various model specifications.84 In a recent study,Haskel and Slaughter (2000) disaggregated the share of price changes resultingspecifically from trade policy changes. This approach allowed the authors toaddress two common criticisms of price-based studies. The first criticism isthat many studies model the United States as a small country or price taker,and the second is that studies implicitly assume that all domestic product pricechanges are due to trade policy or do not directly link the share to trade policychanges. Haskel and Slaughter, however, segregated domestic and internationaldeterminants of price changes in order to assess the effect of trade-inducedprice changes. They analyzed the sector bias of price changes induced bychanges in U.S. tariff and transportation cost reductions during the 1970s and1980s. Based on various estimations, they did not find strong evidence thatfalling tariffs and transportation costs mandated rises in inequality workingthrough price changes. In addition, although the authors documented that tariffand transportation reductions during the 1970s and 1980s were concentrated inunskill-intensive sectors, these reductions were likely not large enough togreatly affect prices (Haskel and Slaughter (2000)).
Other studies, also known as factor-content studies, attempt to explainchanges in relative wages by changes in import volumes rather than changes inproduct prices. In this approach, traded goods are considered to embody thelabor they contain, with imports representing an addition to the supply of U.S.labor (thus depressing wages) and exports representing a reduction in thesupply of U.S. labor (thus increasing wages). The effect of imports is thusanalogous to the effect of immigration. Some studies attempting to inferchanges in relative wages from changes in import and/or immigration volumeshave estimated relatively high wage effects (Borjas, Freeman and Katz (1997))while others estimated much smaller impacts (Katz and Murphy (1992), Borjasand Ramey (1993)). For example, Borjas, Freeman, and Katz estimate that 40percent of the increase in the log wage ratio between all other workers andhigh school dropouts can be attributed to the increased relative supply ofdropouts from trade and immigration; while Katz and Murphy (1992) find that“the effects on relative labor demands of trade were quite moderate,” and
84 For an example of critiques of price-based studies, see William R. Cline (1997),pp. 90-92.
120
estimate that “changes in trade caused a reduction of 0.63 to 1.48 percent indemand for male high school dropouts and a reduction of 2.22 to 4.00percent for female high school dropouts.”85
Some of the highest and most controversial estimates assume that importsfrom developing countries in effect embody the much larger quantity of laborthat is actually used to make the goods in developing countries.86 Suchmethods attribute nearly all of the relative decline in U.S. wages of unskilledlabor to international trade. One criticism of factor-content studies is that theytreat changes in the production of goods as output shocks that affectemployment at existing wages. But if wages adjusted rapidly with importpenetration it would reduce the labor cost competitiveness of imports andreduce import flows, leading to a possible underestimate of labor/wage effects(Freeman (1995)). In addition, factor-content studies tend to ignore howdemand for output may respond to changes in prices. By ignoring potentialconsumer response, these studies may overstate import displacement of localproduction and ensuing labor/wage estimates.87
In a series of papers, Leamer considers the impact of increases in importsof less-skilled-labor intensive goods on the U.S. wage distribution.88 Thesepapers took advantage of the relationship between high wages and high effort,as measured by hours worked. Weekly wages and weekly hours worked arecorrelated strongly since at least 1970, and high wage-high effort jobs tend tobe concentrated in capital-intensive industries. By lowering the relative price oflow-wage, low-effort jobs, Leamer argues that increased imports ofless-skilled-labor intensive goods affect the distribution of wages throughoutthe economy, including for the large majority of U.S. workers employed inservices, and not only in import-competing manufacturing industries. In
85 Borjas et al. (1997) and Katz and Murphy (1992).86 This approach is associated with Wood (1994). A more recent estimate of this
type is Kucera and Milberg (2002). This study used a counterfactual factor-contentanalysis to measure the employment effects of manufacturing trade expansion over1978-1995 for 10 OECD countries, including the United States. The authors concludedthat the United States experience net loss of 2.0 million manufacturing jobs, representinga 9.9-percent decline in manufacturing labor demand (as a percent of the averagemanufacturing employment for the 1978-1995 period). They also concluded that most ofthe net loss is accounted for by trade with non-OECD countries (US: 1.29 million of2.03 million is accounted for by non-OECD trade); that most of the net loss isconcentrated in relatively labor-intensive industries; and that deindustrialization (declinein manufacturing share of employment) is more highly correlated with the employmenteffects from trade with OECD rather than non-OECD countries. They also noted that “tothe extent trade is the culprit, it is the employment effects of North-North trade that mostclosely track the overall change in the manufacturing share of employment in each[OECD] country.” (p. 8.)
87 Freeman (1995), p. 27.88 For example, Leamer (1999) and Leamer and Thornburg (2000).
121
testimony before the U.S. Trade Deficit Review Commission, Leamerindicated that in contrast to the academic consensus that trade does notmatter much for relative wages or the loss of manufacturing jobs, he viewedthe evidence as “not compelling in either direction.”89
Outsourcing and wagesMore recently, researchers have paid increasing attention to the possible
effect of the global disaggregation or fragmentation of the production processon wages. Feenstra and Hanson (2001) provide a comprehensive survey ofstudies analyzing international production sharing and its effect on wages.Trade in intermediate inputs, labeled as “outsourcing” or “global productionsharing”, involves relocating low-wage, low-skilled parts of a verticallyintegrated production process overseas (e.g. manufacture of components) whileretaining high-wage, high-skilled operations in the home country (e.g. finalassembly, R&D, or headquarters functions), and shipping the components tomaintain coordination of production.90 The authors argue that trade inintermediate inputs is a potentially important explanation for the increasingwage gap. They show that both trade in inputs and skill-biased technicalchange will shift demand away from low-skilled activities and raise relativedemand for higher skilled labor.
The authors argue that recognizing the increase in outsourcing helps toresolve several of the empirical arguments to support the contention thatinternational trade does not have much effect on U.S. wages, including (1) therelatively small magnitude of trade flows between the United States anddeveloping countries, (2) the apparently contradictory movement betweenimport prices and relative wages, and (3) the fact that changes in employmentshares by skill level primarily take place within industries, rather betweenindustries as one would expect if Stolper-Samuelson forces were linkingimports to wages.
On the first point, the ratio of trade to GDP understates the increasing tradeintensity of the U.S. economy because of the increasing share of services inGDP. A more appropriate measure, the ratio of merchandise trade tomerchandise value-added, has trended upward significantly over time for theUnited States, rising from 13.2 percent in 1913 to 35.8 percent in 1990. Theestimated share of imported intermediate inputs to manufacturing has almostdoubled from 1972 to 1990, rising from 6.5 percent to 11.6 percent of totalintermediate purchases (Feenstra and Hanson (1999)). Advanced economiesother than the United States also engage in outsourcing. Second, when pricesare compared within industries rather than across industries, the authors find
89 January 21, 2000, p. 60. Downloaded athttp://www.ustdrc.gov/hearings/21jan00/p07012100.pdf on May 7, 2003.
90 Evidence on outsourcing as observed in the Section 9802 production-sharingprogram, and its economic effects, is discussed in Feenstra et al. (2000).
122
that domestic prices are increasing relative to import prices. This trend isconsistent with foreign outsourcing, and unlike similar price comparisonsbased on cross-industry comparisons (e.g. Lawrence and Slaughter (1993)),this method can be used to support a claim that lower import prices areassociated with a relative fall in the less-skilled wage. The presence ofoutsourcing also can explain the relatively large share of the shift towardmore-skilled or nonproduction labor that occurs within industries. Rather thanattribute this phenomenon entirely to skill-biased technological change,relocation of the less-skilled jobs through outsourcing and importation of thecomponents can account for many of the changes in the observed data evenwith technology remaining constant.
Estimates of the effects of outsourcing on the relative wage ofnonproduction and production workers are sensitive to choices in econometricmethodology, and the choice between outsourcing and technological upgradingas explanations for the increased wage premium is not yet entirely resolved.Feenstra and Hanson (1999) consider the period from 1972-90, during whichthe average increase in U.S. nonproduction wages relative to production wageswas 0.72 percent per year. A simple analysis attributes 15 percent of thisincrease (0.11 percent per year) to outsourcing, but this estimate increases to 30percent (0.25 percent per year) if increased computer use rather thanoutsourcing is considered to be the structural cause. Analyses allowing forinteractions between the explanatory variables and quantities of labor andcapital attribute 40 percent of the relative increase in wages to outsourcing(0.29 percent per year), but alternately attribute 75 percent of the increase (0.56percent per year) to increased computer use.
Agreement-Specific AnalysisThere exist few studies and reviews that investigate the specific effects on
labor markets of the five agreements identified in this report. A 1997 USITCstatistical analysis of NAFTA identifies effects (positive or negative) onemployment for 20 of the 120 disaggregated industries reviewed, of anabsolute magnitude of negligible to 15 percent in either direction. These sectorsaccount for approximately 3 percent of the total labor force and 17 percent ofthe manufacturing labor force (USITC (1997a)). Elsewhere, Ferrantino (2001)argues, “the effects of NAFTA on the U.S. economy have been relativelysmall,” and have minimal impact on overall levels of unemployment. Usingnew unemployment insurance claims as a benchmark, Ferrantino estimates that,“the highest available estimates of NAFTA job loss attribute no more than 0.5percent of U.S. layoffs to NAFTA. On an economywide basis, job ‘creation’ or‘destruction’ of this magnitude is relatively small compared to the amount offluctuation in employment levels over the business cycle.”91
91 Ferrantino (2001), pp. 4-5.
123
Two recent studies of NAFTA and the U.S.-Canada FTA conclude thattrade-induced wage effects are more likely to occur in the economies of theUnited States’ smaller trading partners than in the larger U.S. labor market. Inan econometric analysis of the North American labor market, Robertson uses athree-region labor supply-demand model with 1987-1997 household-level datafrom the United States and Mexico to examine labor market integration,concluding that, although there is a large wage differential between the UnitedStates and Mexico, the labor markets are closely integrated, and that evidenceof this integration precedes NAFTA and may be largely the result of migration(Robertson (2000), p. 742). Robertson’s method is designed to analyze changesin the Mexican labor market. By assuming that the larger U.S. labor marketdrives such changes, he is precluded from analyzing NAFTA’s effect on theU.S. labor market directly.1 In a recent study, Trefler (2001) analyzes theshort-run costs and long-run efficiency gains of the U.S.-Canada FTA, but doesso only from the Canadian perspective. In testing for the endogeneity of U.S.employment, output, value added, and number of plants, however, Treflerconcluded that the effect of the FTA was swamped by more fundamentalmovements in industry demand and supply.
Non-Agreement-Specific AnalysisA number of econometric studies have attempted to identify the relative
influences of U.S. or developed country trade and technology changes inincreasing the relative wages of skilled workers over the past two decades.Although these studies have used a variety of methodological assumptionsabout the linkage between trade and wages, studies and literature reviewsspanning the last 15 years have generally found that trade accounts for arelatively small amount of the changes in wage and income distribution ofdeveloped countries. In an early review of the literature, Freeman (1995, p. 25)found that, “Standard factor content analysis studies indicate that trade canaccount for 10 to 20 percent of the overall fall in demand for unskilled laborneeded to explain rising wage differentials in the United States or risingjoblessness in Europe.” Later, a comprehensive literature review published by
1 Robertson treats Mexico as a small country and the United States as a largecountry, consequently invoking the assumption that Mexico is too small to affectaggregate wages in the United States. After controlling for exchange rate movements, therate of wage convergence slows after NAFTA, and Robertson posits a possibleexplanation in that if migration is the primary vehicle in labor market integration,increasing opportunities for Mexicans within Mexico as a result of NAFTA may help toexplain the reduced convergence rate. (p. 744) Robertson qualifies that it is too early toevaluate the complete effect of NAFTA on labor-market integration because with the1990 announcement, actors may have changed their behavior before, during or afterNAFTA; full provisions will take 15 years to enter, with the most controversial slated forlater; and the December 1994 peso collapse triggered a recession that may mask theresponsiveness of Mexican wages to changes in U.S. wages. (p. 763).
124
the Institute for International Economics (Cline (1997)) concluded thatproponents exist at both extremes. Wood (1994) attributed all of risinginequality to trade, while Berman et al. (1994), Bound and Johnson (1992),and Lawrence and Slaughter (1993) attributed almost no causation to trade.The Institute for International Economics’ review found that “The majorityview attributed rising wage inequality primarily toward skill-biasedtechnology change (ibid., pp. 15 and 139).”
After surveying almost 30 economic estimates of the impact of trade onrising U.S. wage inequality, Cline (1997, p. 144) concludes that internationalinfluences contributed about 20 percent of the rising wage inequality in the1980s. A recent International Monetary Fund literature review concluded thattrade accounted for only about 10 or 20 percent of the changes in wages andincome distribution in the advanced economies (Slaughter and Swagel (1997),p. 3) More recently, Slaughter (1998, p. 452) reviewed research on the effectof international trade on labor markets and found that, “Despite unresolvedmethodological differences, the current consensus is that trade accounts for apositive yet relatively small share of rising inequality.”
New insights into the experiences of displaced workers and theirrelationship to international trade have been obtained from the analysis of largemicroeconomic data sets on individuals and households. Much of this work isreviewed in USITC (2002). Briefly, Kletzer (2001) finds that workers displacedfrom jobs in import-competing industries are approximately equal ineducational attainment and job tenure, slightly older, and significantly morelikely to be female. Relative to other displaced manufacturing workers, thosedisplaced from import-competing industries are slightly less likely to bereemployed as of the survey date, in part due to the lower re-employment ratesof displaced females. Their subsequent earnings are similar to those of otherdisplace manufacturing workers, with about 36 percent of such workersreporting earning the same or more on their new jobs and 25 percent of suchworkers reporting earnings losses of 30 percent or more.93
The USITC analyzed the possible labor efforts of simultaneously removingU.S. import restraints, including tariffs and most quantifiable nontariffmeasures94 The USITC model results showed that if all significant U.S. importrestraints had been unilaterally removed in 1999, approximately 175,000full-time equivalent (FTE) workers would have been displaced from theircurrent industries and would need to seek employment in industries other thanthose being liberalized. Approximately 155,000 of these FTE workers would
93 Kletzer (2001), table 3-3, p. 36.94 USITC 92002), chapter 2,. While this analysis is in fact an ex ante analysis of a
hypothetical liberalization rather than an expost analysis of an actual one, and thusmethodologically similar to the CGE analyses reviewed earlier in the chapter it isdiscussed at this point in order to highlight its implications for labor transition.
125
have been in the textile and apparel sectors. Based on the experience ofsimilar workers surveyed for the U.S. Department of Labor’s Bureau ofLabor Statistics, the estimated one-time increase in workers receivingunemployment compensation as a result of removing all significant importrestraints is approximately 111,000, equal to about two days’ worth of newclaims. This estimate took into account the fact that workers in the affectedindustries are significantly more likely to receive unemployment insurance.Overall, the measurable effect on aggregate U.S. unemployment of removingall significant U.S. import restraints on a phased-in basis, rather thansimultaneously, likely would be too small to measure. About 17,000 netadditional FTE workers would be drawn into the labor market nationwide asa result of removing all significant import restraints.
ConclusionThe changes in less-skilled wages and income inequality paralleled a trend
toward increasing trade, particularly with less-developed countries, leadingmany observers to attribute these wage changes, and the concomitantdisplacement of workers, to international trade. These views found a footholdin economic theory, and the debate led to a flowering of studies attempting toquantify the impact of trade liberalization on wages and income. The broadthrust of these studies and the literature is that changes in technology andeducational patterns probably drive most of the recent changes in the U.S.income distribution, with changes in international trade playing a secondary butnon-trivial role. While growing trade volumes appear to have had an impact onthe wage distribution, there is little evidence that trade policy changes havebeen responsible for significant changes in the wage distribution.
Effects on Product VarietyThere are more than 17,000 statistical reporting categories in the
Harmonized Tariff Schedule, and the United States had more than 200 tradingpartners in 2001.95 For purposes of analytical simplicity, economists and othertrade policy analysts frequently ignore much of this detail by aggregatingacross countries and products. While aggregation may be a helpful abstractionfor many trade policy questions, assessments of product level data can providesome valuable insights into the changing nature of international trade. Thissection reviews the academic literature on increasing product variety ininternational trade.
The literature establishes an important fact: a significant portion of thetrade growth over the last three decades can be attributed to growth in the
95 USITC calculations using data downloaded from International Trade Resourcesweb pagehttp://www.macalester.edu/research/economics/PAGE/HAVEMAN/Trade.Resources/TradeConcordances.html, downloaded Nov. 13, 2002, and U.S. Commerce dept data.
126
number of import sources per commodity. Countries trade more products andwith a larger number of countries than in the past. Growth in the number ofproduct-country pairs, particularly the number of products imported from lowwage countries, constitutes a sizable portion of the growth in U.S. and globaltrade.96 While the emergence of a new product-country pair may in manycases represent importation of an old commodity from a new source, datagathered in this fashion may at least form a useful initial proxy for the extentto which increasing trade is accounted for by product differentiation.
Hummels and Klenow (2002) point out that the value of a given aggregatetrade flow can be understood as the product of the number of products tradedand the average value per traded product. Hummels and Klenow argue thatchanges in the number of products traded have substantially different economicconsequences than changes in the average value per traded product. Growth inthe number of imported products can indicate that consumers and intermediategoods buyers in the United States have access to a wider variety of goods.Following Romer (1994) and Feenstra (1994), Hummels and Klenow argue thatthe economic gains from growth in the number of imported products can bequite large, relative to estimates of the gains from trade that ignore thisdimension.
Schott (2001) investigates changes in the sourcing pattern of U.S. importsat the product level over the period 1972-1994. He divides the world’scountries into three groups, according to their per capita income: high, middleand low.97 He finds a substantial decrease in the number of manufacturedproducts that the United States imports exclusively from high income countries.Much of the growth in manufactured imports over the period occurs in productcategories in which at least one low income country enters the U.S. market.While the share of U.S. imports from low income countries remains small(only 8 percent of U.S. import value in 1994), growth in the number ofcategories with low income exporters suggests that a growing share of U.S.industries face price competition from low-income countries.98
Hillberry and McDaniel (2002) use the Hummels and Klenow methodologyto decompose growth in North American trade flows since NAFTA. Using data
96 The emergence of new traded products over time has also been identified as apossible source of upward bias in the import price index. This in turn implies thatpublished estimates of the income elasticity of import demand may also beupward-biased. See Feenstra and Shiells (1997).
97 Countries with per capita incomes of in the 30th percentile or less are consideredlow. Countries with per capita incomes in the 30th to 70th percentiles are middle income,and countries with incomes in the 70th percentile or higher are considered high income.
98 Schott also notes sizable disparities between price of goods from low income andhigh income countries. Men’s shirts from Japan are about 30 times as expensive as men’sshirts from the Philippines. That Japanese shirts remain in the market despite this pricegap suggests that high-income countries produce higher quality goods than low-incomecountries, and that some consumers are willing to pay more higher quality products.
127
at the HS10-digit product level, they decompose growth in U.S. imports andexports with its NAFTA partners from 1993 to 2001. They find that 23.8percentage points of the 190-percent increase in U.S. imports from Mexicooccurred in products that the United States did not import from Mexico in1993. Of the 69-percent increase in imports from Canada, 4.4 percentagepoints occurred in products not imported from Canada in 1993. U.S. exportsalso benefitted from an increase in the number of traded varieties. Anestimated 3.4 percentage points of the 35 percent increase in exports toCanada, and 8.3 percentage points of the 93 percent increase in exports toMexico, were attributable to the growth in the number of products the U.S.exports to those markets.
Most economic analyses measure the benefits from growth in trade amongproducts that are continuously traded. Consumer benefits are measured as afunction of the lower prices that occur when additional imports compete withdomestically produced goods. Schott, Hummels and Klenow, and Hillberry andMcDaniel all show that growing trade also increases the number of varietiesthat U.S. importers have available to them. Theoretic models by Romer andFeenstra suggest that getting access to more varieties may well be morevaluable to importers than lower priced goods. Welfare gains from additionalsources occur if consumers have a taste for variety, or if producers benefit fromhaving access to a greater number of specialized intermediate inputs.
Klenow and Rodriguez-Clare (1997) assess the benefits to Costa Rica fromits trade liberalization in the late 1980’s. They note sizable increases in thenumber of imported sources for each product as a result of trade liberalization.They also find that changes in the number of import sources per commoditycan be linked to changes in tariffs. They estimate that a 1-percent decrease intariffs causes a 0.34-percent increase in the number of import sources availableto intermediate producers and 0.73-percent increase in the number of importsources available to consumers. Accounting for growth in the number of importsources, Klenow and Rodriguez-Clare estimate the benefits to Costa Ricansfrom trade liberalization are equivalent to a 1.5-percent increase in nationalincome. Ignoring the benefits of added variety in import sources reduces theestimated welfare gain to that of a 1-percent increase in national income.Thus, one-third of Costa Rica’s economic benefit from trade liberalization isattributable to increased variety of sources for import products.
One of the empirical analyses in chapter 8 links growth in the number ofimported varieties to reductions in U.S. tariff levels. Econometric methodsestablish that commodities within larger tariff reductions generally had thelargest increases in the number of import sources. Simulation modeling basedon a variant of the Klenow-Rodriguez-Clare model shows that variety growthmay account for as much as three-quarters of the economic benefits associatedwith tariff reduction.
128
ConclusionA significant portion of recent increases in international trade consists of
“new” goods, that is, goods coming from destinations that they did not comefrom before. This is particularly true of the increase in U.S. imports fromMexico post-NAFTA. It appears that such increases can be linked to specificcuts in tariffs. Estimates for one developing country suggest that as much as athird of the gains of trade liberalization may be due to increased import productvariety.
129
CHAPTER 5:Industry Sector Analysis
IntroductionThis chapter provides a brief overview of output, employment, and
productivity trends in all U.S. industry sectors (including services) during1978-2001 and describes the effects of the five trade agreements on eachsector. It examines other factors that have affected developments in thesesectors including domestic and foreign competitive conditions, macroeconomicinfluences, technological innovation, changes in industry structure, andgovernment regulations. For the purposes of this investigation, all U.S.industries have been grouped into 10 sectors. Unless otherwise noted, thesesectors are based on the major industrial groups defined by the 1987 StandardIndustrial Classification (SIC) system. These sector groupings do notnecessarily conform to the industry aggregations used in previous Commissioninvestigations and, consequently, the estimated effects of trade agreements onparticular sectors may not be comparable to other investigations. For example,the Commission’s three-year review of NAFTA1 provided detailed analyses of67 industry sectors.
The data presented in the tables in this chapter are based on officialstatistics of the Department of Commerce, Bureau of Economic Analysis andBureau of the Census, and U.S. Department of Labor, Bureau of LaborStatistics. All shipment, trade, and consumption values presented in this chapterhave been converted to real (1996) dollars using the Bureau of EconomicAnalysis’ implicit price deflator. Each sector discussion, with the exception ofservices, contains a table presenting major trade issues addressed by one ormore of the five agreements that are relevant to the sector. The “X’s” thatappear in the table indicate that a particular trade issue was covered by thecorresponding agreement regardless of whether the agreement effectivelyaddressed the issue or significantly affected trade in the sector. The five tradeagreements also addressed certain cross sectoral trade issues such ascountervailing and antidumping measures that were not included in thesetables.
1 U.S. International Trade Commission, The Impact of the North American FreeTrade Agreement on the U.S. Economy and Industries: A Three Year Review, June 1997,USITC Pub. 3045.
130
Trade liberalization since the Tokyo Round has affected U.S. producersdirectly, by reducing or eliminating tariffs and other trade barriers, andindirectly, by encouraging market integration and the adoption of new businessstrategies such as outsourcing and production sharing. As a result, outsourcingand production sharing have increased significantly in the chemicals,machinery and equipment, transportation, miscellaneous product, and textilesectors. These developments have allowed U.S. producers to concentrate oncore competencies, reduce inventories and input costs, and increase theircompetitiveness in global markets. Transparent institutional frameworks fordispute settlement such as those established in the Uruguay Round andgovernment policies that provide guarantees for foreign investment havefurther encouraged market integration by eliminating much of the risk ofmoving capital and products across national borders.
Many factors in addition to the five subject trade agreements havesignificantly affected U.S. trade in specific sectors during the past two decades.Revolutionary advances in information and communications technologysparked global demand for electronics products which, in turn, spurred U.S.exports of advanced computer and communications equipment and U.S.imports of commodity-type electronics products. The oil crises of the 1970swere a major impetus behind a sharp increase in U.S. demand for imports ofsmall, fuel-efficient Japanese vehicles. Quotas, trigger price mechanisms, andvoluntary restraint agreements restricted many types of U.S. steel importsduring the period under review, while the Multifiber Arrangement and theCaribbean Basin Economic Recovery Act largely determined the quantity,source, and composition of U.S. textile and apparel imports. U.S. crude oiltrade has been principally affected by price levels which fluctuate erratically assupply and demand are driven by myriad global events.
Many diverse factors have also affected U.S. regional trade during theperiod under review including financial crises in Latin America during the1980s, in Mexico during 1994, and in East Asia during 1997-98. These eventsand the exchange rate fluctuations associated with them significantlycontributed to ebbs and flows in U.S. trade with each of those regions. U.S.trade has also been strongly affected by the economy-wide growth rates ofmajor markets, changes in government policy, and investments in infrastructuresuch as ports, roads, and telecommunication networks. China has emerged asboth a major global supplier and market in recent years largely because it has avery large and growing domestic market, it has revised its policies andreformed institutions to attract foreign investment, and it has made vastimprovements in the infrastructure necessary to accommodate increasedmanufacturing and trade.
Services, chemicals and allied products, and machinery and electronicsincreased their share of non-government GDP in the United States, while thetransportation sector maintained its share, and all other sector shares decreasedduring 1978-2001. The services sector, as discussed in this report, is a largeand diverse aggregation of industries that is much larger than the other sectors.
131
Its share of non-government GDP expanded from 68.3 percent to 78.6 percentduring 1980-2001 (table 5-1). Growth in the services sector was largely drivenby increases in telecommunication, business, and financial services.Innovations in telecommunication and information technologies have led to thecreation of new services, such as mobile telephony, the Internet, and Internetadvertising, and have increased productivity in existing services, such asfinance and design. Other sectors also underwent significant change.Advancements in medical knowledge and improved standards of livingcontributed to the expansion of the pharmaceutical industry, which accountedfor much of the growth in the chemicals sector. The machinery and electronicssector also benefitted from technological developments which haverevolutionized the production of electronic equipment by steadily decreasingthe size and cost of electronic components while steadily enhancing theirperformance. These developments combined with fierce competition havespurred market expansion for electronic equipment, such as cellular telephonesand personal computers. The strong growth of the U.S. economy as a wholeand its salutary effect on the construction industry have been the primaryfactors affecting the expansion of the machinery subsector.
The value of shipments in the minerals and metals and the textiles andapparel sectors decreased significantly during the period, largely owing toforeign competition and technological advances that have lowered productioncosts. Much of the decrease in the minerals and metals sector can be attributedto lower prices for primary metal products, especially steel. The total quantityof steel product shipments increased by 11 percent during the period, whereasthe total value of these shipments decreased by 60 percent. The value ofshipments in the U.S. textile and apparel sector decreased by 25 percent duringthe period as imports from lower-wage countries replaced U.S.-made productsin many market segments.
Employment shifted significantly during 1978-2001 from themanufacturing sectors to the services sector. The share of total privateemployment2 accounted for by the services sector increased from 70 percent to82 percent while employment in each of the manufacturing sectors, with theexception of the chemicals sector and the forest and fishery sector, decreasedduring the period. Employment cutbacks in the manufacturing sector were dueto decreased production, increased labor productivity, or both. Cutbacks weresharpest in the minerals and metals sector, the textiles and apparel sector, andthe energy and fuels sector where output decreased significantly during theperiod. Increased labor productivity in the machinery and electronics sector,and the transportation equipment sector allowed firms to reduce employmentwhile increasing output.
2 Does not include farm workers or government employees.
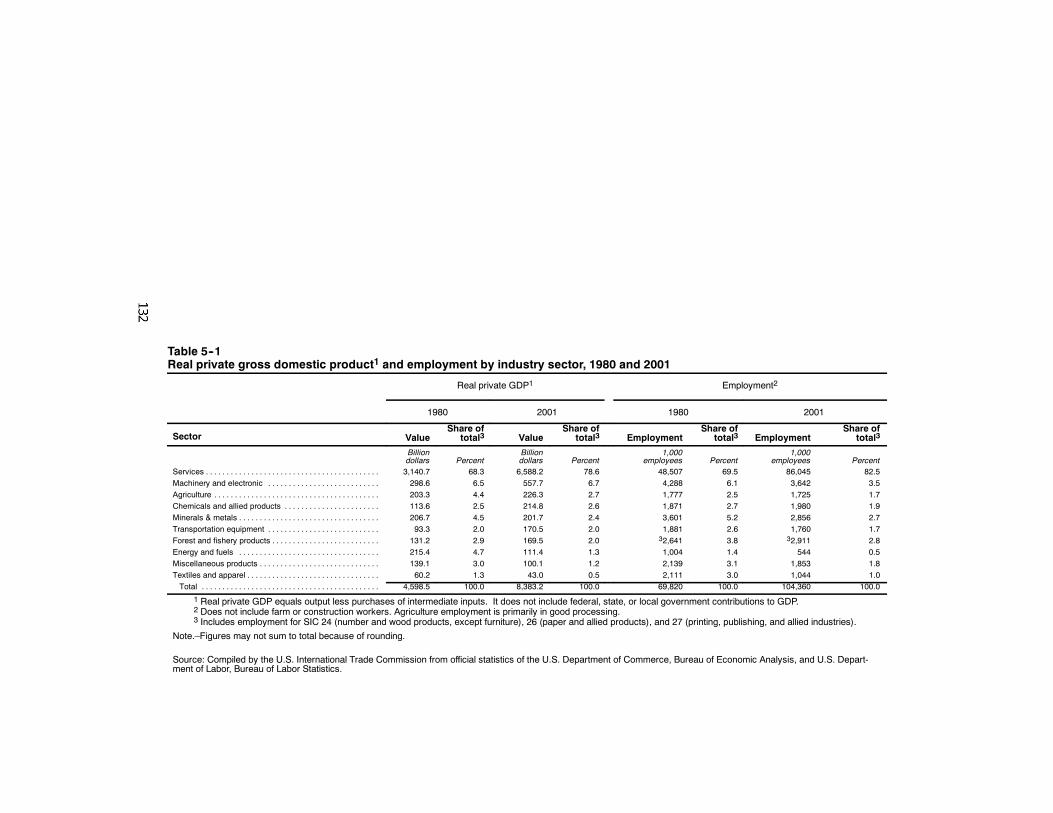
Table 5--1Real private gross domestic product1 and employment by industry sector, 1980 and 2001
Real private GDP1 Employment2
1980 2001 1980 2001
Sector ValueShare of
total3 ValueShare of
total3 EmploymentShare of
total3 EmploymentShare of
total3
Billiondollars Percent
Billiondollars Percent
1,000employees Percent
1,000employees Percent
Services . . . . . . . . . . . . . . . . . . . . . . . . . . . . . . . . . . . . . . . . . . 3,140.7 68.3 6,588.2 78.6 48,507 69.5 86,045 82.5Machinery and electronic . . . . . . . . . . . . . . . . . . . . . . . . . . . 298.6 6.5 557.7 6.7 4,288 6.1 3,642 3.5Agriculture . . . . . . . . . . . . . . . . . . . . . . . . . . . . . . . . . . . . . . . . 203.3 4.4 226.3 2.7 1,777 2.5 1,725 1.7Chemicals and allied products . . . . . . . . . . . . . . . . . . . . . . . 113.6 2.5 214.8 2.6 1,871 2.7 1,980 1.9Minerals & metals . . . . . . . . . . . . . . . . . . . . . . . . . . . . . . . . . . 206.7 4.5 201.7 2.4 3,601 5.2 2,856 2.7Transportation equipment . . . . . . . . . . . . . . . . . . . . . . . . . . . 93.3 2.0 170.5 2.0 1,881 2.6 1,760 1.7Forest and fishery products . . . . . . . . . . . . . . . . . . . . . . . . . . 131.2 2.9 169.5 2.0 32,641 3.8 32,911 2.8Energy and fuels . . . . . . . . . . . . . . . . . . . . . . . . . . . . . . . . . . 215.4 4.7 111.4 1.3 1,004 1.4 544 0.5Miscellaneous products . . . . . . . . . . . . . . . . . . . . . . . . . . . . . 139.1 3.0 100.1 1.2 2,139 3.1 1,853 1.8Textiles and apparel . . . . . . . . . . . . . . . . . . . . . . . . . . . . . . . . 60.2 1.3 43.0 0.5 2,111 3.0 1,044 1.0Total . . . . . . . . . . . . . . . . . . . . . . . . . . . . . . . . . . . . . . . . . . . 4,598.5 100.0 8,383.2 100.0 69,820 100.0 104,360 100.0
1 Real private GDP equals output less purchases of intermediate inputs. It does not include federal, state, or local government contributions to GDP.2 Does not include farm or construction workers. Agriculture employment is primarily in good processing.3 Includes employment for SIC 24 (number and wood products, except furniture), 26 (paper and allied products), and 27 (printing, publishing, and allied industries).
Note.–Figures may not sum to total because of rounding.
Source: Compiled by the U.S. International Trade Commission from official statistics of the U.S. Department of Commerce, Bureau of Economic Analysis, and U.S. Depart-ment of Labor, Bureau of Labor Statistics.
133
Services was also the largest sector in terms of U.S. trade, increasing itsshare of total exports from 19 percent to 32 percent and its share of totalimports from 15 percent to 17 percent during 1980-2001 (table 5-2). U.S.exports increased in all sectors during this period with the exception ofagriculture and energy and fuels, while U.S. imports increased for all sectorsexcept energy and fuels. Most of the decrease in the value of energy and fuelscan be attributed to lower oil prices during the latter part of the period.
Views of Interested PartiesA public hearing was held in connection with this investigation on January
14, 2003. Interested parties presented their views on the subject tradeagreements at this hearing, and in written statements submitted in response toannouncements that appeared in the Federal Register. A summary of theseviews is given in appendix F to this report. In addition, those views areprovided in this chapter where they apply to specific industries. Several partiespresented statements that pertain to the effects of the trade agreements on thecountry as a whole, or on broad segments of the country. These general views,which are provided by the AFL-CIO, by economist Ben Goodrich, by theInternational Intellectual Property Alliance, and by the National Association ofManufacturers, are presented here.
AFL-CIO3
The AFL-CIO is a voluntary federation of 65 national and internationallabor unions that represent 13 million workers.
U.S. trade policies have resulted in “exploding trade deficits and staggeringjob losses, especially in [the] manufacturing sector; significant impingement onthe power of the national government and state and local authorities to regulatein the public interest; and dilution of protections under domestic trade laws.”The United States should “go back to square one” and recraft its trade policies“to ensure that they promote and protect workers’ rights and the environmentin the United States and other nations.”
Uruguay RoundThe U.S. trade deficit in goods and services nearly quadrupled during
1994-2002 and these deficits have substantially retarded GDP growth. Growingtrade deficits have also eliminated a net total of 3 million actual and potentialjobs from the U.S. economy. Most (65 percent) job losses were in themanufacturing sector. Displaced workers in import-competing sectors have haddifficulty finding jobs in growing sectors. Further, real manufacturing wageshave not kept pace with the cost of living.
3 AFL-CIO, written submission to the Commission, Feb. 14, 2003.
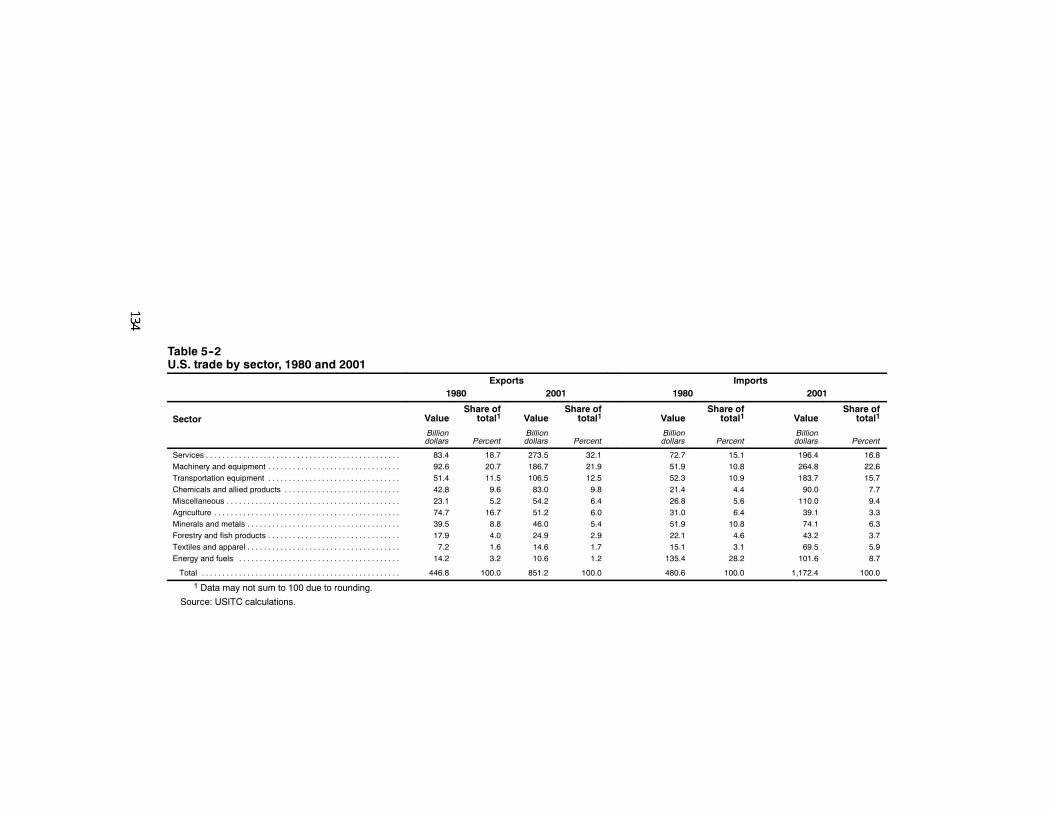
Table 5--2U.S. trade by sector, 1980 and 2001
Exports Imports1980 2001 1980 2001
Sector ValueShare of
total1 ValueShare of
total1 ValueShare of
total1 ValueShare of
total1
Billiondollars Percent
Billiondollars Percent
Billiondollars Percent
Billiondollars Percent
Services . . . . . . . . . . . . . . . . . . . . . . . . . . . . . . . . . . . . . . . . . . . . . . . 83.4 18.7 273.5 32.1 72.7 15.1 196.4 16.8Machinery and equipment . . . . . . . . . . . . . . . . . . . . . . . . . . . . . . . . 92.6 20.7 186.7 21.9 51.9 10.8 264.8 22.6Transportation equipment . . . . . . . . . . . . . . . . . . . . . . . . . . . . . . . . 51.4 11.5 106.5 12.5 52.3 10.9 183.7 15.7Chemicals and allied products . . . . . . . . . . . . . . . . . . . . . . . . . . . . 42.8 9.6 83.0 9.8 21.4 4.4 90.0 7.7Miscellaneous . . . . . . . . . . . . . . . . . . . . . . . . . . . . . . . . . . . . . . . . . . 23.1 5.2 54.2 6.4 26.8 5.6 110.0 9.4Agriculture . . . . . . . . . . . . . . . . . . . . . . . . . . . . . . . . . . . . . . . . . . . . . 74.7 16.7 51.2 6.0 31.0 6.4 39.1 3.3Minerals and metals . . . . . . . . . . . . . . . . . . . . . . . . . . . . . . . . . . . . . 39.5 8.8 46.0 5.4 51.9 10.8 74.1 6.3Forestry and fish products . . . . . . . . . . . . . . . . . . . . . . . . . . . . . . . . 17.9 4.0 24.9 2.9 22.1 4.6 43.2 3.7Textiles and apparel . . . . . . . . . . . . . . . . . . . . . . . . . . . . . . . . . . . . . 7.2 1.6 14.6 1.7 15.1 3.1 69.5 5.9Energy and fuels . . . . . . . . . . . . . . . . . . . . . . . . . . . . . . . . . . . . . . . 14.2 3.2 10.6 1.2 135.4 28.2 101.6 8.7
Total . . . . . . . . . . . . . . . . . . . . . . . . . . . . . . . . . . . . . . . . . . . . . . . . 446.8 100.0 851.2 100.0 480.6 100.0 1,172.4 100.0
1 Data may not sum to 100 due to rounding.
Source: USITC calculations.
135
These factors have affected local businesses and have eroded state andlocal tax bases. The Uruguay Round Agreements (URA) have negativelyaffected the power to regulate in the public interest as the WTO disputeresolution procedures have challenged domestic laws and regulations design toprotect the environment, health and safety, consumers, or workers. The URAhas also weakened the substance of U.S. trade laws and reduced the ability toeffectively implement these laws. If global competition remains unchecked, itwill make the world increasingly “unstable” by creating greater inequality and“weaker democracies.”
NAFTANAFTA has been a “dismal failure” and workers’ wages in all three
NAFTA countries have fallen or stagnated. The trade surplus that the UnitedStates had with Mexico before NAFTA is now a deficit and the deficit that ithad with Canada is now much larger. These deficits eliminate jobopportunities. NAFTA also has caused jobs to shift from “relativelyhigh-paying manufacturing jobs with good benefits and higher union density toservice sector jobs that pay less and provide fewer benefits.” The effect hasbeen particularly negative on the textile and apparel sector and the automotivegoods sector. Wage disparities between manufacturing production workers inMexico and the United States have increased, encouraging U.S. production toshift to Mexico and undocumented Mexican workers to move to the UnitedStates. “NAFTA has also made it less risky and more lucrative to moveproduction to Canada and Mexico” thereby “undermining the bargainingposition of U.S. workers.”
Benjamin Goodrich4
Benjamin Goodrich is employed by the Institute for InternationalEconomics. However, the views expressed in his submission are his own anddo not necessarily reflect the views of individual colleagues or the members ofthe Institute’s Board or Advisory Committee.
Mr. Goodrich generally holds a favorable view of all the subject tradeagreements. His submission emphasizes a number of points for theCommission to keep in mind when evaluating the effects of the subject tradeagreements on the U.S. economy. It also discusses the merits and shortcomingsof various economic models that can be used to estimate the counterfactualcondition expressed as “What would the U.S. economy look like if the UnitedStates had not implemented a certain trade agreement?”
4 Benjamin Goodrich, Institute for International Economics, written submission tothe Commission, Jan. 3, 2003.
136
International Intellectual Property Alliance5The International Intellectual Property Alliance (IIPA) represents the U.S.
copyright-based industries in bilateral and multilateral efforts to improveinternational protection of copyrighted materials. IIPA’s six member tradeassociations represent over 1,100 U.S. companies producing and distributingmaterials protected by copyright laws throughout the world.
Both NAFTA and the Uruguay Round have played an important role inelevating the standards of copyright protection and enforcement around theworld although the NAFTA intellectual property provisions, which in severalways, provide better copyright protection than that of the Uruguay RoundTRIPS6 agreement. NAFTA’s Intellectual Property Rights chapter still containsproblematic issues regarding secondary uses of sound recordings and Canada’sextension of its “cultural industries” exclusion to intellectual property. Themultilateral reach of TRIPS and the regional reach of NAFTA have providedfirm foundations for countries to improve their copyright laws and enforcementmechanisms to protect both domestic and foreign rightsholders. The TRIPSagreement achieved major obligations desired by the copyright industry. Theenforcement obligations of the TRIPS agreement provide a comprehensivefoundation for the development of the procedures and remedies necessary foreffective enforcement against copyright piracy.
National Association of Manufacturers7The National Association of Manufacturers (NAM) represents about 14,000
U.S. manufacturing companies, including approximately 10,000 small andmedium-sized firms, and more than 200 sector specific industrial tradeassociations.
All of the trade agreements under investigation have been “unambiguously”positive for the U.S. economy.
NAFTANAFTA has been an important source of U.S. manufacturing export
growth. “The U.S. merchandise trade deficit with Mexico is mainly caused byU.S. oil imports and U.S.-Mexico trade in the highly integrated automotivesector.” GDP in motor vehicles increased at an average annual rate of4.8 percent during 1995-99 (while the rest of GDP grew at 3.8 percent.) Inaddition, “NAFTA has contributed to making U.S. manufacturing firms more
5 Maria Strong, Vice President and General Counsel, International IntellectualProperty Alliance, written submission to the Commission, Feb. 14, 2003.
6 Trade-related aspects of intellectual property rights.7 Frank Vargo, Vice President, International Economic Affairs, National Association
of Manufacturers, written submission to the Commission, Mar. 31, 2003.
137
globally competitive by permitting easier access to cheaper industrial inputsand allowing bigger companies to reallocate resources in such a way as tofacilitate just-in-time manufacturing and outsource low-skill, low-payactivities to Mexico while retaining high-skill, high wage activities in theUnited States.” NAFTA has improved regional competitiveness by“facilitating the improvement of North America’s transport infrastructure.”“NAFTA has not shifted U.S. foreign direct investment in manufacturing toMexico and Canada.” “Foreign direct investment from other countries intoMexico and Canada, ... has increased under NAFTA” sustaining stableeconomies in these countries that “benefit U.S. economic and nationalsecurity interests.”
Uruguay RoundThe URA has “benefitted U.S. manufacturing in multiple ways.” It has cut
industrial tariffs, most importantly in the zero-for-zero or tariff-harmonizationagreements that eliminated tariffs for major industrial sectors among a criticalmass of participating countries. It has also incorporated intellectual propertyright protection into the system of global trading rules; improved the GATTsubsidies code; made progress in defining and proscribing the use of certaintrade-related investment measures by governments; and established a bindingdispute mechanism for resolving government-government commercial disputes.Although the effects of the URA were generally positive, they failed toincrease “effective market access for U.S. manufactured exports to the newlyindustrializing economies of developing nations.”
Services8
OverviewIn 2001, the service sector accounted for $6.2 trillion, or 66.9 percent, of
real gross domestic product (GDP) and employed 79 million workers,representing 63.2 percent of the U.S. workforce.9 Financial services accountedfor 29.9 percent of the total value of the sector; retail trade for 15.4 percent;transportation and public utilities for 12.7 percent; and wholesale trade for 12.1
8 For the purposes of this investigation, principal service sectors includetransportation and public utility services, wholesale trade, retail trade, financial services,and other services, the latter of which includes business services and most professionalservices.
9 U.S. Department of Commerce, Bureau of Economic Analysis (BEA), IndustryAccounts Data, found at http://www.bea.doc.gov/bea/dn2/gpo.htm, retrieved Dec. 18,2002.
138
percent during the same year.10 During 1987-2001,11 real GDP in the servicesector increased at an average annual rate of 3.8 percent.12
The United States is the world’s largest exporter and importer of services.U.S. services exports grew 8.3 percent annually during 1987-2001, and totaled$243.3 billion in 2001,13 which represented approximately 20 percent of globalservices.14 In 2000, other major service exporters such as the United Kingdom,Germany, France, and Japan each accounted for less than 10 percent of globalservice exports. In 2001, the United States imported services valued at $175.8billion.15 This level reflected average annual growth of 4.5 percent, and likelyrepresented approximately 15 percent of global imports.16 No other countryaccounted for more than 10 percent of global services imports. In 2001, theUnited States enjoyed a services trade surplus of $67.5 billion, the largest inthe world.
U.S. service firms have significantly expanded their presence in foreignmarkets in recent years. U.S. direct investment stock in foreign serviceaffiliates measured $1.4 trillion in 2001, reflecting 19.3 percent average annualgrowth during 1987-2001.17 By 2001, U.S. outbound investment stock inservice affiliates accounted for 65 percent of total U.S. direct investmentabroad.18 In 2001, the U.S. investment position in service industries was largestin finance; wholesale and retail trade; computer-related services;communication services; and electric, gas, and sanitary services.19 As a
10 Ibid.11 The services sector discussion focuses on the period 1987-2001 because reliable
data for the sector are not available prior to 1987, and the two subject trade agreementsthat entered into force prior to 1987 did not address the services sector.
12 U.S. Department of Commerce, BEA, Industry Accounts Data, found athttp://www.bea.doc.gov/bea/dn2/gpo.htm, retrieved Dec. 18, 2002.
13 Ibid.14 Organization for Economic Cooperation and Development (OECD), Services:
Statistics on International Transactions: Partner Country Data and Summary Analysis,1999-2000, July 2002, p. 8. Approximations of global export shares are based on 2000data.
15 U.S. Department of Commerce, BEA, Survey of Current Business, Oct. 2002, p.67. Import data have been deflated using the implicit price deflator for gross domesticproduct (base year 1996).
16 Ibid., and OECD, Services: Statistics on International Transactions July 2002, p.8. Approximations of global import shares are based on 2000 data.
17 U.S. Department of Commerce, BEA, Survey of Current Business, Aug. 1990, p.98; and July 2001, p. 29.
18 U.S. Department of Commerce, BEA, Survey of Current Business, Sept. 2002, pp.95-96.
19 Ibid., pp. 95-96.
139
consequence of direct investment overseas, U.S. service firms’ sales throughaffiliates exceeded cross-border exports by 42 percent in 2000.20
Labor productivity in the services sector grew slowly, averaging 1.2 percentper annum during 1987-2001, despite rapid acceleration in productivity growthin the years following 1995. Yet, there was significant variation in productivitygrowth among the service industries. Labor productivity in the wholesale tradeindustry increased by an average annual rate of 4.5 percent; retail trade by2.5 percent; finance by 2.3 percent, and transportation and public utilities by2.0 percent. Other services, however, exhibited little change in productivityduring the period.21 Further disaggregation shows greater divergence withinthese broad industry groupings. Several service industries, including thesecurities, banking, telecommunication, energy and water utilities, wholesaletrade, and retail trade service industries, rank very high in labor and total factorproductivity growth.22 Productivity growth in these industries is greater thanthat in nondurable goods manufacturing, and comparable to that in durablegoods manufacturing. At the other end of the spectrum are health services,education, air transportation, business services, and many professional services,which exhibited little productivity growth.23
Employment in the service sector increased at an average annual rate of 2.6percent during 1987-2001.24 Job creation was slow in the wholesale trade andfinancial service industries as relatively strong productivity growth moderateddemand for workers. By contrast, employment grew rapidly in other services,where overall low productivity levels continued to create demand for additionalworkers. Wages in the service sector grew by 1.7 percent per annum, onaverage, during 1987-2001.25 Wage growth was led by financial services, whilewages in the transportation and public utilities industry and the retail tradeindustry trailed. In 2001, average annual salaries ranged from a high of
20 U.S. Department of Commerce, BEA, Survey of Current Business, Oct. 2002, p.67. Cross-border supply and sales through affiliates are two means of delivering servicesto foreign consumers. Cross-border supply refers to when a service is delivered to aconsumer in a territory that is different from the territory of the service supplier. Affiliatetrade occurs when a service supplier establishes a commercial presence in a foreignmarket.
21 U.S. Department of Commerce, BEA, Industry Accounts Data, found athttp://www.bea.doc.gov/bea/dn2/gpo.htm, retrieved Dec. 18, 2002.
22 See USITC, Recent Trends in U.S. Services Trade, inv. No. 332-345, May 2001,Pub. 3409, pp. 21-2 to 21-6.
23 Ibid. Professional services generally require accreditation by a professional bodyresponsible for standards. Business services include services that do not requireaccreditation, such as data processing services.
24 U.S. Department of Commerce, BEA, Industry Accounts Data, found athttp://www.bea.doc.gov/bea/dn2/gpo.htm, retrieved Dec. 18, 2002.
25 Ibid.
140
$161,879 for securities and commodities brokers to a low of $22,759 forworkers in personal services, such as laundry, cleaning, and garmentservices.26
Technological change, particularly in the area of information technology,has resulted in the creation of new service industries and the transformation orreform of long established industries. Internet services provision, energy andfinancial derivatives trading, and pay-per-view entertainment services areexamples of new services enabled by the application of advanced computer andcommunication technologies. The parameters of competition in professionalservices, such as advertising and architectural services, have been transformedby the advent and application of new information technologies. The Internethas compelled advertising firms to develop the ability to create and effectivelytarget Internet advertisements.27 Communications technology has enabled manyprofessional and business services, such as architectural and engineering firms,to operate a virtual 24-hour office, relaying design work from offices on onecontinent to another, allowing work on time-sensitive projects to continuearound the clock. Architectural and engineering firms enhanced the benefits ofthe 24-hour virtual offices by employing new computer assisted design (CAD)technology. Communications and computer technology have also benefitted thetransportation and distribution industries by enabling firms to improve theirlogistics and tracking services. Information technologies, such as cellularcommunications and multi-firm interaction over electricity networks, haveoften been the focus of reform within the telecommunication and energyservices industries.
Outsourcing has also had a significant impact on the service sector asservice firms have focused on developing highly differentiated and high qualityservices while reducing operating costs. Air transporters buying the services offreight forwarders, wholesale traders and retailers buying advertising services,or a commodities or securities broker paying another broker to execute aspecific trade are examples of outsourcing. In the transportation and publicutilities sector, real intermediate inputs (a proxy for outsourcing) increased by4.5 percent per annum, on average, during 1987-2000; in wholesale services,by 4.6 percent; in retail services, by 2.9 percent; in financial services, by 4.6percent; and in other services, by 6.7 percent. Intermediate inputs as a share ofgross output increased in real terms in the transportation and public utilities,financial, and other service industries during 1987-2000.28 Surveys conducted
26 U.S. Department of Commerce, BEA, Survey of Current Business, Aug. 2002,Table 6.6C, p. 81.
27 USITC, “Internet Advertising,” Industry, Trade, and Technology Review, Sept.1998, pp. 1-16.
28 U.S. Department of Commerce, BEA, Survey of Current Business, June 2000, p.52; and Nov. 2001, p. 32.
141
by the Outsourcing Institute in 1997 showed that companies with more than$80 million in annual revenues increased outsourcing by 26 percent in thatyear alone. Reportedly, information technology was the fastest growingoutsourced activity, followed by human resources, marketing and sales, andfinancial services.29
Effect of Trade Agreements on the SectorWhile the subject trade agreements have contributed to increased trade in
services, their effects are likely overshadowed by external market conditions.Trade in services was not covered by the Tokyo Round of Multilateral TradeNegotiations or the U.S.-Israel FTA, and therefore the agreements are notaddressed in the following discussion. The U.S.-Canada FTA provided for apartial liberalization of trade in services that was subsequently expanded by theNAFTA to include virtually all aspects of cross-border trade in services.NAFTA also provides for enhanced access and for fair, transparent, andnon-discriminatory treatment in the provision of cross-border services betweenNAFTA members. NAFTA also establishes governing principles and rulescovering temporary access, which is vitally important to many serviceproviders. Generally, U.S. service firms face more favorable market access andnational treatment conditions in Canada and Mexico than they did beforeNAFTA. One of the major achievements of the Uruguay Round was theGeneral Agreement on Trade in Services (GATS). The GATS improved legalcertainty and regulatory transparency, and discouraged the implementation ofnew trade impediments where commitments had been scheduled. However,GATS commitments generally bound current market conditions and, whilepreventing a worsening of the trade regime, did not achieve significant tradeliberalization.30
U.S.-Canada FTA31
U.S.-Canadian trade in services increased at an average annual rate of 5.6percent during 1989-2001, reaching $42.4 billion at the end of the period.32U.S. exports of services to Canada totaled $13.3 billion in 1989, and reached$24.3 billion in 2001, a 5.1 percent average annual increase (table 5-3). U.S.
29 Claude E. Barfield and Cordula Thum, The New World of Services: Implicationsfor the United States (Miami: Institute for International Professional Services, 2001),p. 13.
30 USTR, WTO Services Trade Negotiations, found athttp://www.ustr.gov/sectors/services/gat.pdf, retrieved June 3, 2003.
31 The U.S.-Canada FTA includes several sections relating to services includinginvestment, temporary entry, and financial services.
32 U.S. Department of Commerce, BEA Survey of Current Business, Oct. 2002,pp. 86-107; Oct. 1999, pp. 68-81; Nov. 1996, pp. 86-99; Sept. 1994, pp. 107-116.
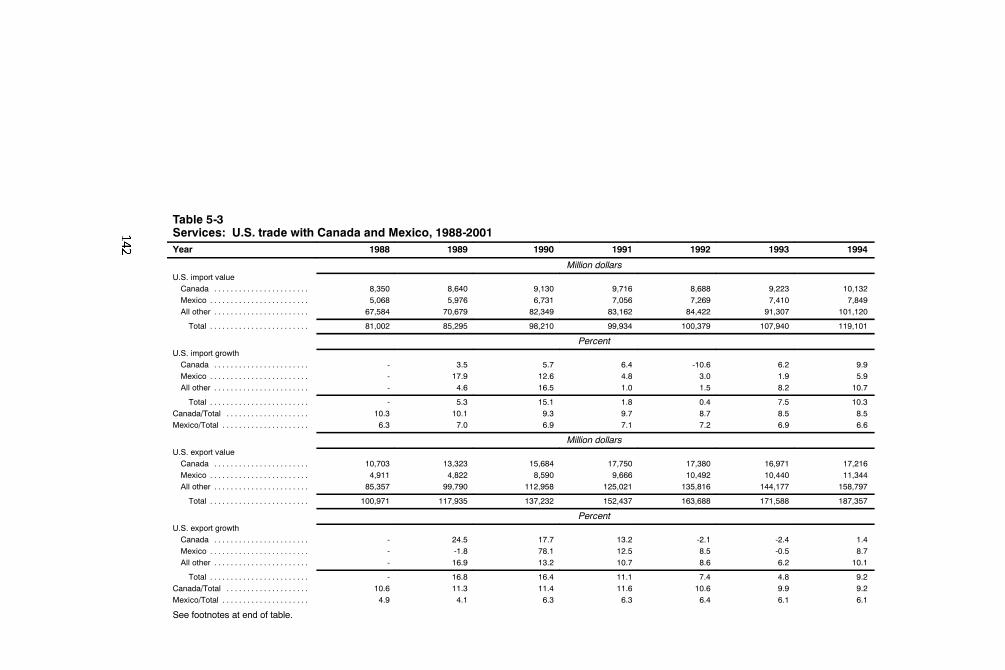
Table 5-3Services: U.S. trade with Canada and Mexico, 1988-2001Year 1988 1989 1990 1991 1992 1993 1994
Million dollarsU.S. import valueCanada . . . . . . . . . . . . . . . . . . . . . . . 8,350 8,640 9,130 9,716 8,688 9,223 10,132Mexico . . . . . . . . . . . . . . . . . . . . . . . . 5,068 5,976 6,731 7,056 7,269 7,410 7,849All other . . . . . . . . . . . . . . . . . . . . . . . 67,584 70,679 82,349 83,162 84,422 91,307 101,120
Total . . . . . . . . . . . . . . . . . . . . . . . . 81,002 85,295 98,210 99,934 100,379 107,940 119,101
PercentU.S. import growthCanada . . . . . . . . . . . . . . . . . . . . . . . - 3.5 5.7 6.4 -10.6 6.2 9.9Mexico . . . . . . . . . . . . . . . . . . . . . . . . - 17.9 12.6 4.8 3.0 1.9 5.9All other . . . . . . . . . . . . . . . . . . . . . . . - 4.6 16.5 1.0 1.5 8.2 10.7
Total . . . . . . . . . . . . . . . . . . . . . . . . - 5.3 15.1 1.8 0.4 7.5 10.3Canada/Total . . . . . . . . . . . . . . . . . . . . 10.3 10.1 9.3 9.7 8.7 8.5 8.5Mexico/Total . . . . . . . . . . . . . . . . . . . . . 6.3 7.0 6.9 7.1 7.2 6.9 6.6
Million dollarsU.S. export valueCanada . . . . . . . . . . . . . . . . . . . . . . . 10,703 13,323 15,684 17,750 17,380 16,971 17,216Mexico . . . . . . . . . . . . . . . . . . . . . . . . 4,911 4,822 8,590 9,666 10,492 10,440 11,344All other . . . . . . . . . . . . . . . . . . . . . . . 85,357 99,790 112,958 125,021 135,816 144,177 158,797
Total . . . . . . . . . . . . . . . . . . . . . . . . 100,971 117,935 137,232 152,437 163,688 171,588 187,357
PercentU.S. export growthCanada . . . . . . . . . . . . . . . . . . . . . . . - 24.5 17.7 13.2 -2.1 -2.4 1.4Mexico . . . . . . . . . . . . . . . . . . . . . . . . - -1.8 78.1 12.5 8.5 -0.5 8.7All other . . . . . . . . . . . . . . . . . . . . . . . - 16.9 13.2 10.7 8.6 6.2 10.1
Total . . . . . . . . . . . . . . . . . . . . . . . . - 16.8 16.4 11.1 7.4 4.8 9.2Canada/Total . . . . . . . . . . . . . . . . . . . . 10.6 11.3 11.4 11.6 10.6 9.9 9.2Mexico/Total . . . . . . . . . . . . . . . . . . . . . 4.9 4.1 6.3 6.3 6.4 6.1 6.1
See footnotes at end of table.
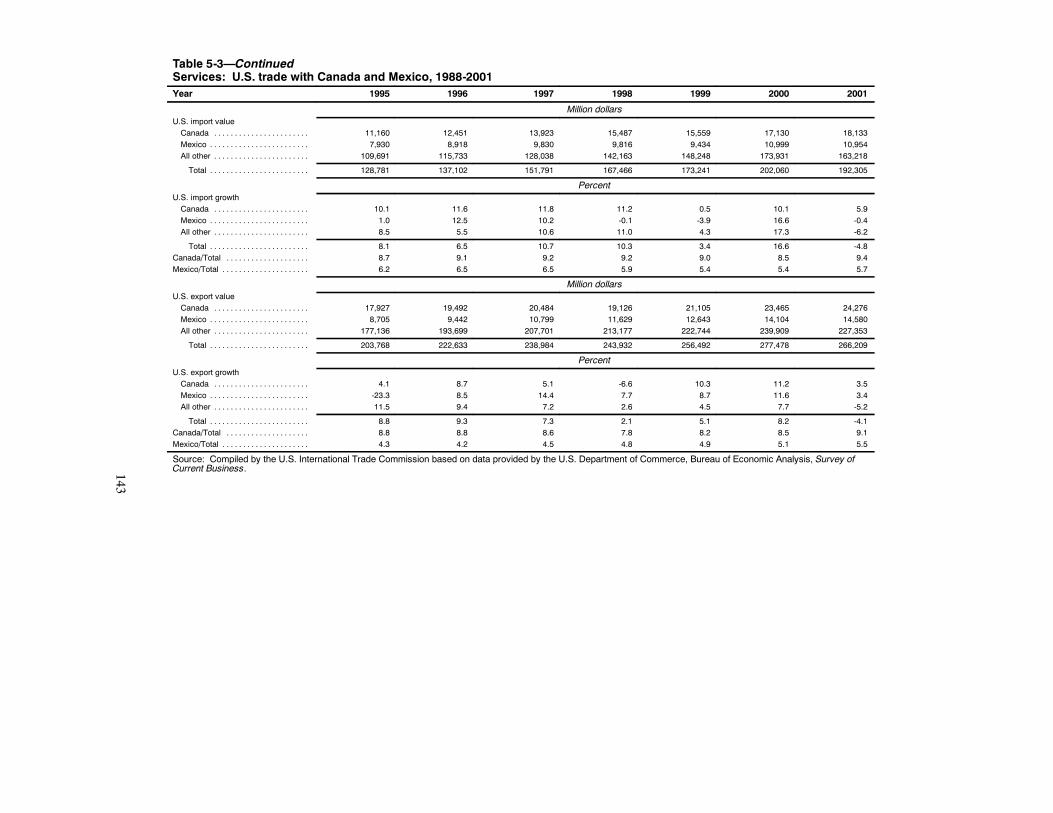
143
Table 5-3—ContinuedServices: U.S. trade with Canada and Mexico, 1988-2001Year 1995 1996 1997 1998 1999 2000 2001
Million dollarsU.S. import valueCanada . . . . . . . . . . . . . . . . . . . . . . . 11,160 12,451 13,923 15,487 15,559 17,130 18,133Mexico . . . . . . . . . . . . . . . . . . . . . . . . 7,930 8,918 9,830 9,816 9,434 10,999 10,954All other . . . . . . . . . . . . . . . . . . . . . . . 109,691 115,733 128,038 142,163 148,248 173,931 163,218
Total . . . . . . . . . . . . . . . . . . . . . . . . 128,781 137,102 151,791 167,466 173,241 202,060 192,305
PercentU.S. import growthCanada . . . . . . . . . . . . . . . . . . . . . . . 10.1 11.6 11.8 11.2 0.5 10.1 5.9Mexico . . . . . . . . . . . . . . . . . . . . . . . . 1.0 12.5 10.2 -0.1 -3.9 16.6 -0.4All other . . . . . . . . . . . . . . . . . . . . . . . 8.5 5.5 10.6 11.0 4.3 17.3 -6.2
Total . . . . . . . . . . . . . . . . . . . . . . . . 8.1 6.5 10.7 10.3 3.4 16.6 -4.8Canada/Total . . . . . . . . . . . . . . . . . . . . 8.7 9.1 9.2 9.2 9.0 8.5 9.4Mexico/Total . . . . . . . . . . . . . . . . . . . . . 6.2 6.5 6.5 5.9 5.4 5.4 5.7
Million dollarsU.S. export valueCanada . . . . . . . . . . . . . . . . . . . . . . . 17,927 19,492 20,484 19,126 21,105 23,465 24,276Mexico . . . . . . . . . . . . . . . . . . . . . . . . 8,705 9,442 10,799 11,629 12,643 14,104 14,580All other . . . . . . . . . . . . . . . . . . . . . . . 177,136 193,699 207,701 213,177 222,744 239,909 227,353
Total . . . . . . . . . . . . . . . . . . . . . . . . 203,768 222,633 238,984 243,932 256,492 277,478 266,209
PercentU.S. export growthCanada . . . . . . . . . . . . . . . . . . . . . . . 4.1 8.7 5.1 -6.6 10.3 11.2 3.5Mexico . . . . . . . . . . . . . . . . . . . . . . . . -23.3 8.5 14.4 7.7 8.7 11.6 3.4All other . . . . . . . . . . . . . . . . . . . . . . . 11.5 9.4 7.2 2.6 4.5 7.7 -5.2
Total . . . . . . . . . . . . . . . . . . . . . . . . 8.8 9.3 7.3 2.1 5.1 8.2 -4.1Canada/Total . . . . . . . . . . . . . . . . . . . . 8.8 8.8 8.6 7.8 8.2 8.5 9.1Mexico/Total . . . . . . . . . . . . . . . . . . . . . 4.3 4.2 4.5 4.8 4.9 5.1 5.5
Source: Compiled by the U.S. International Trade Commission based on data provided by the U.S. Department of Commerce, Bureau of Economic Analysis, Survey ofCurrent Business.
144
imports of services from Canada totaled $8.6 billion in 1989, and reached$18.1 billion in 2001, a 6.4 percent average annual increase. Over the period,the U.S. services trade surplus with Canada increased by an average annualrate of 2.3 percent.
Although the data indicate growing trade between the United States andCanada, there is limited evidence that the U.S.-Canada FTA has had asignificant effect on trade between the two countries. In 1989, U.S.-Canadiantrade accounted for 10.8 percent of total U.S. trade in services. This figuredeclined fairly consistently until 2001, when Canada accounted for 9.2 percentof the total. Although trade with Canada was growing, U.S. trade with othercountries was growing at a faster rate. During 1989-2001, U.S.-Canadian tradein services grew at an annual rate of 5.6 percent, slightly less than the averagegrowth rate of 7.0 percent for total U.S. trade in services with all countries.This slower-than-average pace allowed the United Kingdom to supplantCanada as the second largest export market for U.S. services in 2001.
Data for individual industries within the services sectors reaffirm thelimited effects of the U.S.-Canada FTA. Within the services sector, the travelindustry accounts for the largest portion of U.S. cross-border trade, both forCanada and all countries in total. U.S. trade with Canada in the travel industrytotaled $13.0 billion in 2001 and accounted for 30.6 percent of allU.S.-Canadian services trade. U.S. travel exports to Canada increased at anaverage annual rate of 1.6 percent during 1989-2001, far below the growth ratefor all countries.
NAFTAU.S. trade in services with Canada increased at an average annual rate of
6.5 percent during 1994-2001, reaching $42.4 billion at the end of the period.33U.S. exports of services to Canada totaled $17.2 billion in 1994, and reached$24.3 billion in 2001, a 5.0 percent average annual increase. U.S. imports ofservices from Canada totaled $10.1 billion in 1994, and reached $18.1 billionin 2001, an 8.7 percent average annual increase. As imports rose faster thanexports, the U.S. trade surplus in services declined 2.0 percent during theperiod. U.S.-Mexican trade in services increased at an average annual rate of4.2 percent during 1994-2001, totaling $25.5 billion.34 U.S. exports of servicesto Mexico totaled $11.3 billion in 1994 and $14.6 billion in 2001, whichrepresented a 3.7 percent average annual increase. U.S. imports of services
33 U.S. Department of Commerce, BEA, Survey of Current Business, Oct. 2002,pp. 86-107; Oct. 1999, pp. 68-81; Nov. 1996, pp. 86-99; Sept. 1994, and pp. 107-116.
34 Ibid.
145
from Mexico totaled $7.9 billion in 1994 and $11.0 billion in 2001, a 4.9percent average annual increase.35 Trade with Mexico accounted for 6.3percent of all U.S. services trade in 1994 and 5.6 percent in 2001.
Trade in services between the United States and Canada and Mexico hasincreased steadily since the NAFTA entered into force, yet the correlationbetween the growth in trade and any trade creating effects of the Agreementappear to be low. For example, although U.S.-Canadian trade in business,professional, and technical services,36 rose by an annual rate of 15.2 percentduring 1994-2001, the growth was likely due to factors other than the NAFTA,as there were few barriers to such trade in place before 1994. Generally, theseservices became more prominent because demand for them increasedsignificantly during the economic expansion of the late 1990s. In contrast,financial services is one service industry where the effects of NAFTA areregarded as significant. NAFTA has raised foreign investment ceilings, therebyfacilitating greater investment by U.S. banking and security firms in Mexico.
Uruguay RoundOne of the major achievements of the Uruguay Round was the General
Agreement on Trade in Services (GATS), the first multilateral, legallyenforceable agreement on trade and investment in services. The GATScomprises a framework of general regulatory obligations, schedules whereinWTO Members identify market access and national treatment commitments,and annexes that specify the parameters of negotiations and establish workprograms as necessary. The GATS improved legal certainty and regulatorytransparency, and discouraged the implementation of new trade impedimentswhere commitments had been scheduled. However, because WTO members’market access and national treatment commitments generally bound the statusquo, the GATS did not achieve significant trade liberalization.37
Data for the period suggest that the GATS had little or no effect on U.S.cross-border services trade. On average, U.S. cross-border services exportsincreased at a slower annual rate during the five years following the GATS’entry into force–5.9 percent–than in the five years prior, when exportsincreased by 8.1 percent annually. This, combined with relatively rapid importgrowth in the latter period, resulted in a 2.7-percent average annual growth inthe U.S. service trade surplus during 1995-99, compared to 15-percent averageannual growth during 1990-94.38
35 U.S. exports of services to Mexico were disrupted in 1995, 1996, and, to a lesserextent, in 1997 by effects of the peso devaluation on Mexico’s economy.
36 U.S.-Canadian trade in business, professional, and technical services accountedfor 11.9 percent of total U.S. trade in services in 2001.
37 USTR, WTO Services Trade Negotiations, found athttp://www.ustr.gov/sectors/services/gat.pdf, retrieved June 3, 2003.
38 U.S. Department of Commerce, BEA, Survey of Current Business, Oct. 2002,p. 67. During 1995-99, services trade reflected broad economic currents as well as trade
146
Although the GATS did not fully liberalize cross-border trade, itsprovisions regarding the establishment of a commercial presence appear tohave contributed to the rise in U.S. direct investment abroad during the 1990s,and consequent increased sales of services through foreign affiliates. Such salesgrew at an average annual rate of 16.8 percent during 1995-99.39 Bolstered bythe strong growth in foreign direct investment, U.S. parent firms’ stock inforeign service affiliates increased by 14 percent per annum, on average, during1990-98.40
Views of Interested Parties
Air Transportation Association41
The Air Transportation Association (ATA) is the principal trade and serviceorganization of the U.S. scheduled airline industry.
Of the 5 subject trade agreements, only the URA covers commercial airtransport although the ATA generally supports all of these and otheragreements that liberalize trade with foreign partners. However, some free tradeagreements, such as the U.S.-Singapore FTA, cover express delivery servicessimilar to those provided by certain ATA members. Even so, there is not yetindustry consensus on this approach to liberalization.
The URA, particularly the General Agreement on Trade in Services(GATS), covers limited aspects of commercial air transportation. The GATSAnnex on Air Transport Services covers three sub-sectors, two of which theUnited States has taken exemptions on. ATA supports the U.S. governmentposition that liberalization of air transportation services can best be achievedunder the current, broad exclusion from the GATS of most activities in thissector. ATA believes that the existing venues and mechanisms for air transportliberalization are sufficient.
38—Continuedagreements. Export prospects were likely dampened in the latter 1990s by relativelyweak economic growth in continental Europe and Japan, the principal U.S. servicesexport markets. For example, average annual growth of gross domestic product during1995-99 measured 2.3 percent in France, 1.5 percent in Germany, and 1.0 percent inJapan. By contrast, U.S. gross domestic product averaged 4.1-percent annual growthduring this period, which stimulated services imports. OECD, Quarterly NationalAccounts, No. 1, 2000.
39 U.S. Department of Commerce, BEA, Survey of Current Business, Oct. 2002,p. 67.
40 USITC, Examination of U.S. Inbound and Outbound Direct Investment, Jan.2001, Pub. 3383, p. 3-22.
41 Edward A. Merlis, Senior Vice President, Legislative and International Affairs,Air Transportation Association written submission to the Commission, Jan. 21, 2003.
147
Machinery and Electronics42
OverviewThe United States is the world’s largest producer and consumer of
machinery and electronic products. The sector includes a large and extremelydiverse group of industries that manufacture products ranging from cellulartelephones to farm tractors. The electronics subsector, which is dominated bythe computer hardware, communications equipment, and electronic componentindustries, has significantly expanded and evolved since the implementation ofthe Tokyo Round Agreements in 1980. The machinery subsector, on the otherhand, is primarily composed of mature industries such as those producingrefrigeration and heating equipment, construction machinery, and farmequipment that, for the most part, have changed comparatively little during thisperiod. Despite apparent differences, the two subsectors share certaincharacteristics. They are both dominated by a relatively small number ofproducers that are headquartered primarily in the United States, Japan, the EU,and Korea. Further, industries in both subsectors tend to be globalized in termsof production, sourcing of inputs, and sales.
U.S. shipments of machinery and electronics, as a group, increased at arelatively modest average annual rate of 2.5 percent, from $488.1 billion to$833.5 billion43 during 1978-2000 (table 5-4). Most of this growth occurredduring the last 10 years of the period aided by the vibrant U.S. economicexpansion of 1991-2000 and sharply increasing demand for sector products.U.S. apparent consumption of sector products increased by 79 percent during1991-2000. However, the value of shipments and apparent consumption eachfell by 18 percent when this expansion ended in 2001. Growth rates forindividual subsectors did not necessarily follow the same trends; factorsaffecting production and demand differed widely, causing shipment,employment, and wage trends to move independently of one another. The shareof total sector shipments from each subsector changed appreciably during theperiod. Electronic components and communications equipment, which eachaccounted for more than 7 percent of the value of sector shipments in 1978,had increased to 18 percent and 12 percent, respectively, in 2001 while theshare accounted for by computer and office equipment increased from 9percent to 12 percent. During the same period, the share of the sector total thatcomprises construction, mining, and materials handling equipment decreasedfrom 12 percent to 7 percent, and the general industrial equipment sharedecreased from 8 percent to 6 percent.
42 For the purposes of this investigation, the machinery and electronics sectorincludes all industries classified in groups 35 and 36 of the Standard IndustrialClassification of 1987. This sector also includes electrical equipment. Althoughcomputer equipment and office machinery is classified in SIC group 35 with industrialand commercial machinery, in this chapter it will be treated as part of the electronicssubsector.
43 In real (1996) dollars.
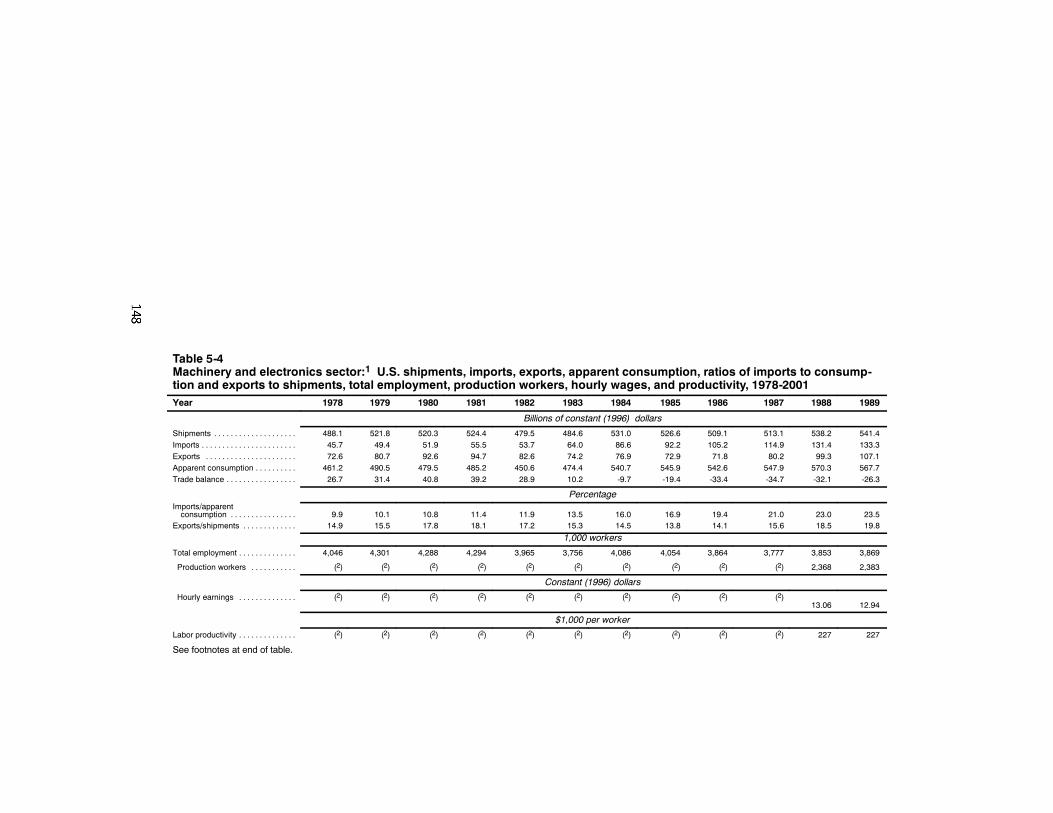
Table 5-4Machinery and electronics sector:1 U.S. shipments, imports, exports, apparent consumption, ratios of imports to consump-tion and exports to shipments, total employment, production workers, hourly wages, and productivity, 1978-2001Year 1978 1979 1980 1981 1982 1983 1984 1985 1986 1987 1988 1989
Billions of constant (1996) dollars
Shipments . . . . . . . . . . . . . . . . . . . . 488.1 521.8 520.3 524.4 479.5 484.6 531.0 526.6 509.1 513.1 538.2 541.4Imports . . . . . . . . . . . . . . . . . . . . . . . 45.7 49.4 51.9 55.5 53.7 64.0 86.6 92.2 105.2 114.9 131.4 133.3Exports . . . . . . . . . . . . . . . . . . . . . . 72.6 80.7 92.6 94.7 82.6 74.2 76.9 72.9 71.8 80.2 99.3 107.1Apparent consumption . . . . . . . . . . 461.2 490.5 479.5 485.2 450.6 474.4 540.7 545.9 542.6 547.9 570.3 567.7Trade balance . . . . . . . . . . . . . . . . . 26.7 31.4 40.8 39.2 28.9 10.2 -9.7 -19.4 -33.4 -34.7 -32.1 -26.3
PercentageImports/apparentconsumption . . . . . . . . . . . . . . . . 9.9 10.1 10.8 11.4 11.9 13.5 16.0 16.9 19.4 21.0 23.0 23.5
Exports/shipments . . . . . . . . . . . . . 14.9 15.5 17.8 18.1 17.2 15.3 14.5 13.8 14.1 15.6 18.5 19.8
1,000 workers
Total employment . . . . . . . . . . . . . . 4,046 4,301 4,288 4,294 3,965 3,756 4,086 4,054 3,864 3,777 3,853 3,869
Production workers . . . . . . . . . . . (2) (2) (2) (2) (2) (2) (2) (2) (2) (2) 2,368 2,383
Constant (1996) dollars
Hourly earnings . . . . . . . . . . . . . . (2) (2) (2) (2) (2) (2) (2) (2) (2) (2)13.06 12.94
$1,000 per worker
Labor productivity . . . . . . . . . . . . . . (2) (2) (2) (2) (2) (2) (2) (2) (2) (2) 227 227
See footnotes at end of table.
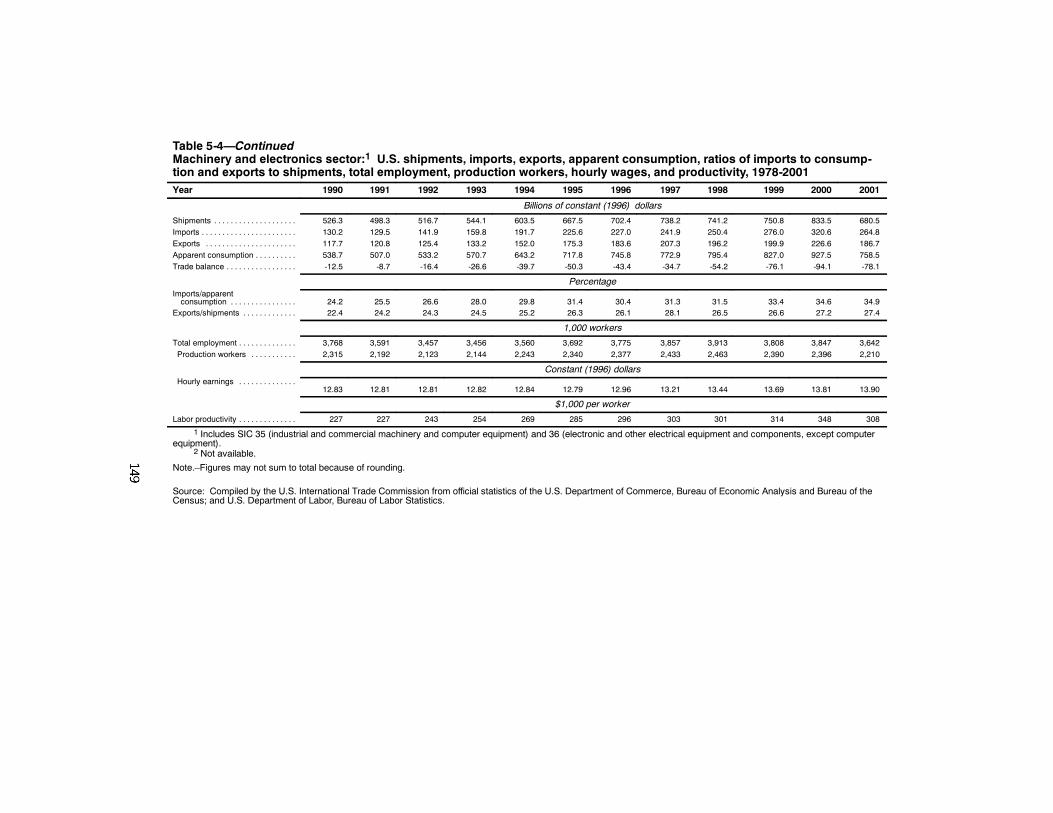
Table 5-4—ContinuedMachinery and electronics sector:1 U.S. shipments, imports, exports, apparent consumption, ratios of imports to consump-tion and exports to shipments, total employment, production workers, hourly wages, and productivity, 1978-2001Year 1990 1991 1992 1993 1994 1995 1996 1997 1998 1999 2000 2001
Billions of constant (1996) dollars
Shipments . . . . . . . . . . . . . . . . . . . . 526.3 498.3 516.7 544.1 603.5 667.5 702.4 738.2 741.2 750.8 833.5 680.5Imports . . . . . . . . . . . . . . . . . . . . . . . 130.2 129.5 141.9 159.8 191.7 225.6 227.0 241.9 250.4 276.0 320.6 264.8Exports . . . . . . . . . . . . . . . . . . . . . . 117.7 120.8 125.4 133.2 152.0 175.3 183.6 207.3 196.2 199.9 226.6 186.7Apparent consumption . . . . . . . . . . 538.7 507.0 533.2 570.7 643.2 717.8 745.8 772.9 795.4 827.0 927.5 758.5Trade balance . . . . . . . . . . . . . . . . . -12.5 -8.7 -16.4 -26.6 -39.7 -50.3 -43.4 -34.7 -54.2 -76.1 -94.1 -78.1
PercentageImports/apparentconsumption . . . . . . . . . . . . . . . . 24.2 25.5 26.6 28.0 29.8 31.4 30.4 31.3 31.5 33.4 34.6 34.9
Exports/shipments . . . . . . . . . . . . . 22.4 24.2 24.3 24.5 25.2 26.3 26.1 28.1 26.5 26.6 27.2 27.4
1,000 workers
Total employment . . . . . . . . . . . . . . 3,768 3,591 3,457 3,456 3,560 3,692 3,775 3,857 3,913 3,808 3,847 3,642Production workers . . . . . . . . . . . 2,315 2,192 2,123 2,144 2,243 2,340 2,377 2,433 2,463 2,390 2,396 2,210
Constant (1996) dollarsHourly earnings . . . . . . . . . . . . . .
12.83 12.81 12.81 12.82 12.84 12.79 12.96 13.21 13.44 13.69 13.81 13.90
$1,000 per worker
Labor productivity . . . . . . . . . . . . . . 227 227 243 254 269 285 296 303 301 314 348 308
1 Includes SIC 35 (industrial and commercial machinery and computer equipment) and 36 (electronic and other electrical equipment and components, except computerequipment).
2 Not available.
Note.–Figures may not sum to total because of rounding.
Source: Compiled by the U.S. International Trade Commission from official statistics of the U.S. Department of Commerce, Bureau of Economic Analysis and Bureau of theCensus; and U.S. Department of Labor, Bureau of Labor Statistics.
150
Production increases were more than matched by gains in laborproductivity so that the increase in sector output coincided with a decrease insector employment. Total employment for machinery and electronics decreasedslightly, from 3.7 million in 1978 to 3.6 million in 2001, and fluctuatedbetween 3.4 million and 3.9 million during the interim. Real average wages forproduction workers in the group increased by 7 percent from $13.08/hour to$13.98/hour during 1988-2001,44 while labor productivity increased by 36percent from $227,000 per worker to $308,000 per worker.
The electronics subsector, especially communications equipment, computerequipment, and electronic components, led sector growth during the period.The real value of electronic component shipments more than quadrupledbetween 1978 and 2000, while the real value of communications equipmentand computer and office equipment nearly tripled. However, shipments of eachof these products decreased significantly during 2001. Productivity gains wereespecially high for electronics subsector industries such as communicationsequipment and electronic components. Output per production worker increasedby 110 percent in the communications equipment industry and by 58 percent inthe electronic components industry during 1988-2001.
The electronics subsector’s significant growth in output and productivityreflects a pervasive transformation shaped by technological advances, hugegrowth in U.S. and global demand for subsector products, increasingglobalization, and intense competition. Throughout this transformation, theU.S. electronics subsector has been a leading innovator in industries such astelecommunications and computer equipment, and semiconductors. U.S.innovative strength has led to continuous improvements in manufacturingtechnology which allowed the production of ever-smaller integrated circuits(chips) containing an ever-larger number of components. Since chips are theheart of most electronic devices, these improvements led to lower pricesrelative to performance and contributed to the growth and development of thecomputer and telecommunications equipment industries. Lower prices, in turn,created new markets for chips in high volume end uses such as children’s toys,home appliances, and automobiles.45 In fact, the share of the total cost of anaverage automobile accounted for by electronic components increased fromapproximately 1 percent in 1980 to between 8 and 15 percent in 2000.46
44 Employment and wage data were not available for all production workers in thesegroups prior to 1988 due to changes in classification.
45 Thomas Walter Smith, “Semiconductors”, July 18, 2002, Standard & PoorsIndustry Survey, p.1, found athttp://www.netadvantage.standardandpoors/netahtml/IndSur/sec/sec30702.htm,retrieved Nov. 2, 2002.
46 U.S. Department of Commerce, “Microelectronics,” U.S. Industry and TradeOutlook 2000 (New York, NY: McGraw-Hill, 2000), p. 16-1.
151
The introduction of the IBM personal computer (PC) in 1981 andcommercial cellular telephone service in 1983 contributed significantly to thegrowth of the electronics subsector. IBM’s decision to use open architecture inits PC design spawned competition that could use off-the-shelf components tocreate IBM clones. This decision and the adoption of Microsoft DOS in the1980s, which standardized computer operating systems, made personalcomputers a product that could be easily mass produced to meet escalatingdemand. The creation of a cellular telephone infrastructure, its subsequentupgrades, and the demand for cellular handsets with the latest features havedriven much of the growth of the telecommunications equipment industry andhave increased the number of new players in the U.S. market.
The 1984 breakup of the AT&T monopoly in local telecommunicationservice and the spinoff of Lucent Technologies from AT&T in 1996 promotedgreater competition among telecommunications equipment manufacturers forsales to U.S. local and long distance service providers that had previouslyrelied on in-house production. The creation of the Worldwide Web in 1989vastly increased the resources available through the personal computer andgreatly enhanced its value as a communications tool. In addition, theprivatization of European telecommunication service providers and theliberalization of the markets for these services during the 1980s and 1990sforced these entities to increase their investment in communications equipmentto remain competitive with new entrants to the market, thereby creating newexport opportunities for U.S. firms.47
The leading position of the U.S. electronics industry in advancedtechnologies throughout the period was supported by significant investment inresearch and development, an educated and technically skilled workforce, andnumerous institutions of higher learning with curricula tailored to electronicand computer engineering.48 Strong competition within the U.S. market haspromoted the flexibility required to adapt to changing market conditions, andU.S. firms were often among the first to adopt new, more efficient, businessmodels.49 For example, in recent years, many U.S. firms have turned tooutsourcing, contract manufacturing, and production sharing in lower wagecountries to reduce costs and focus production on higher value operations. Thisapproach allows many firms to remain competitive despite the most significantcompetitive weakness of the U.S. electronics industry—its relatively higherlabor costs vis-à-vis emerging suppliers Asia, Mexico, and Eastern Europe.50
47 Multimedia Telecommunications Association, 1998 Multimedia Telecommu-nications Market Review and Forecast (Arlington, VA: MMTA Market Research Board,1998), pp. 12-13.
48 National Science Foundation, “Higher Education in Science and Engineering,” inScience and Engineering Indicators 2002 (Arlington, VA: National Science Board,2002), vol. 1, pp. 2-1 to 2-50.
49 Stephen Shankland, “High-tech Manufacturers Add Brains to Brawn,” CnetNews.Com, Aug. 18, 2000, found at http://news.cnet.com, retrieved Apr. 4, 2001.
50 Deutsche Bank Securities, Inc., Global Equity Research, Supply and Demand:Uneven Odds, Jan. 17, 2003, p.12.
152
The machinery subsector has not undergone the dramatic transformationsthat have characterized the electronics industry since 1980. Whereas changes inthe electronics sector created new markets and stimulated demand for a widevariety of new products and services, the machinery sector, for the most part,manufactured products for traditional markets and end uses. Products such asconstruction and farm machinery typically are durable and not much innovationoccurs from year to year so that sales are driven by factors such as crop pricesand interest rates rather than technological advances. Many types of heating, airconditioning, farm, construction, and mining equipment have becomemarginally more efficient during this period or more environmentally friendly,although they have remained largely unchanged. Demand for machineryproducts is affected by a number of cyclical factors and, for the most part,moves with general economic upswings and downturns. Interest rates have alarge impact on demand because most major machinery purchases are financed.Construction machinery is affected by the level of construction activity andgovernment spending on public buildings, roads and other infrastructure.Mining equipment is affected by many of the same factors– a large share ofthis equipment is used to quarry stone and gravel used by the constructionindustry– and by the price of various minerals and metals. Farm equipmentsales typically rise and fall with interest rates and crop prices.
The number of production workers employed in the machinery subsector asa whole remained steady at 1.2 million during 1988-2001,51 while productionincreased by 27 percent. Productivity gains were among the highest in theconstruction machinery, refrigeration and heating equipment, and farmmachinery subsectors, each increasing by 30 percent or more during the period.Wages for production workers in these three subsectors increased by anaverage of 35 percent.
Globalization and consolidation increased in industries such as farmmachinery, construction equipment, and heating, ventilation, and airconditioning (HVAC) equipment. Major manufacturers of farm machinery suchas John Deere, Case, Caterpillar, AGCO, and New Holland and HVACequipment such as York, Trane, and Rheem, are multinational businesses thatmanufacture throughout the world, producing equipment to meet local marketneeds.52 The United States and Canada have been the largest producers ofhigh-horsepower farm equipment during the period, while Europe hasdominated the production of mid-range equipment, and Japan has been theworld’s leading producer of small-scale equipment. Despite the growingnumber of production facilities located in foreign markets byU.S.-headquartered firms, export sales continue to account for a significantshare of U.S. machinery production.
51 Employment data were not available for this subsector prior to 1988.52 U.S. Department of Commerce, “Production Machinery,” U.S. Industry and Trade
Outlook 2000 (New York, NY: McGraw-Hill, 2000), p. 18-8; York InternationalCorporation, 2002 Form 10-K; American Standard Companies Inc. 2002 Form 10-K, andAbout Rheem found at www.rheemac.com/press/081402.html, retrieved May 28, 2003.
153
Effect of Trade Agreements on the SectorAlthough the subject trade agreements are not the primary factors driving
the expansion of the sector, they addressed a broad range of trade issues thatcontributed to the expansion (table 5-5). Four of the five trade agreements–Tokyo Round Agreements, the U.S.-Canada FTA, NAFTA, and the UruguayRound agreements– likely had measurable positive effects on U.S. sector trade.The U.S.-Israel FTA did not have a measurable effect on U.S. trade primarilybecause Israel accounts for such a small share of total sector trade. TheUruguay Round Agreements likely had a significant effect on trade ofelectronic equipment through the Information Technology Agreement and theBasic Telecommunications Agreement. The former eliminated tariffs on manyinformation technology products in most major markets and the latter openedtelecommunications services to competition in all major markets which, in turn,spurred demand for telecommunications equipment.
However, most of the growth in production and trade that has taken placein the U.S. machinery and electronics industry since 1980 can be attributed tofactors other than the 5 trade agreements that are the subject of thisinvestigation (table 5-20). These factors include very strong growth in demand,the development of new technologies and applications; increased deregulationand privatization of the telecommunication services industries (the majorcustomers for telecommunications equipment); the rapid evolution of wirelesscommunications, data communications, and Internet services;53 increasedproduction sharing and global outsourcing of equipment and components byU.S., EU, Japanese, and Canadian producers. Macroeconomic factors such asexchange rate fluctuation and economic crises in Mexico (1995) and severalAsian countries (1998) have also had a major impact on sector trade. Asdiscussed below the magnitude of these effects on the U.S. economy variesamong the 5 agreements.
Tokyo RoundThe effect of Tokyo Round agreements on the U.S. machinery and
electronics sector was modest at best. The trade-weighted average tariffconcessions by the EC, Canada, and Japan for sector imports from the UnitedStates were 2.1 percentage points, 5.3 percentage points, and 7.8 percentagepoints, respectively. The trade-weighted average U.S. tariff on sector importswas relatively low (5.4 percent) during 1979, the year prior to the entry intoforce of the agreement, and had fallen only 2.5 percentage points by 1987, theyear of the final tariff reduction under the agreement. Increased trade duringthis period can be primarily attributed to factors discussed above such asprivatization and technological advances in the electronics industry, rather thantrade liberalization.
53 Telecommunications Industry Association (TIA), 2001 MultiMediaTelecommunications Market Review and Forecast (Washington, DC: TIA, 2001),pp. 3-15.
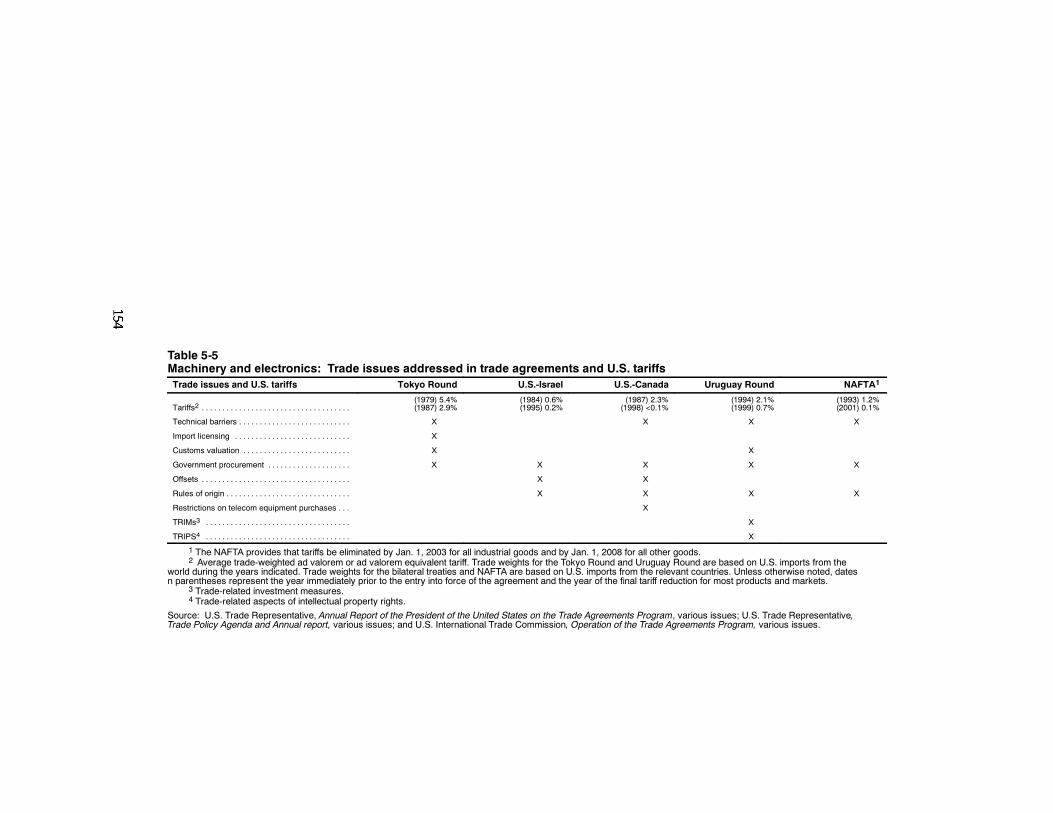
Table 5-5Machinery and electronics: Trade issues addressed in trade agreements and U.S. tariffsTrade issues and U.S. tariffs Tokyo Round U.S.-Israel U.S.-Canada Uruguay Round NAFTA1
Tariffs2 . . . . . . . . . . . . . . . . . . . . . . . . . . . . . . . . . . . .(1979) 5.4%(1987) 2.9%
(1984) 0.6%(1995) 0.2%
(1987) 2.3%(1998) <0.1%
(1994) 2.1%(1999) 0.7%
(1993) 1.2%(2001) 0.1%
Technical barriers . . . . . . . . . . . . . . . . . . . . . . . . . . . X X X X
Import licensing . . . . . . . . . . . . . . . . . . . . . . . . . . . . X
Customs valuation . . . . . . . . . . . . . . . . . . . . . . . . . . X X
Government procurement . . . . . . . . . . . . . . . . . . . . X X X X X
Offsets . . . . . . . . . . . . . . . . . . . . . . . . . . . . . . . . . . . . X X
Rules of origin . . . . . . . . . . . . . . . . . . . . . . . . . . . . . . X X X X
Restrictions on telecom equipment purchases . . . X
TRIMs3 . . . . . . . . . . . . . . . . . . . . . . . . . . . . . . . . . . . X
TRIPS4 . . . . . . . . . . . . . . . . . . . . . . . . . . . . . . . . . . . X
1 The NAFTA provides that tariffs be eliminated by Jan. 1, 2003 for all industrial goods and by Jan. 1, 2008 for all other goods.2 Average trade-weighted ad valorem or ad valorem equivalent tariff. Trade weights for the Tokyo Round and Uruguay Round are based on U.S. imports from the
world during the years indicated. Trade weights for the bilateral treaties and NAFTA are based on U.S. imports from the relevant countries. Unless otherwise noted, datesn parentheses represent the year immediately prior to the entry into force of the agreement and the year of the final tariff reduction for most products and markets.
3 Trade-related investment measures.4 Trade-related aspects of intellectual property rights.
Source: U.S. Trade Representative, Annual Report of the President of the United States on the Trade Agreements Program, various issues; U.S. Trade Representative,Trade Policy Agenda and Annual report, various issues; and U.S. International Trade Commission, Operation of the Trade Agreements Program, various issues.
155
The Tokyo Round agreements addressed several market access barriers thatwere important to the sector such as government procurement and technicalbarriers although significant obstacles remained. Government procurement wasespecially important to the telecommunications industry because mosttelecommunication service providers–the largest customers fortelecommunications equipment–were government-owned during the 1980s.
Between 1980, the year of the first stage of the Tokyo Round tariffreductions, and 2000, total U.S. trade in machinery and electronics productsincreased at an average annual rate of 6.9 percent, reaching $547 billion beforedropping by 17.5 percent in 2001. U.S. sector imports increased more thansix-fold, reaching $321 billion, while sector exports nearly tripled to$264 billion during 1980-2000. A sector trade surplus of $41 billion in 1980became a $94-billion deficit by 2000. International trade became increasinglyimportant to the sector during this period as globalization increased andproduction sharing became a more widely accepted business model. Imports asa share of U.S. apparent consumption increased from approximately 11 percentto 35 percent and exports as a share of shipments increased from 18 percent to27 percent during 1980-2001.
U.S.-Israel FTA54
It is likely that most of the growth in U.S.-Israel sector trade since 1985has resulted from factors other than the U.S.-Israel FTA because most sectorimports already entered the United States duty-free prior to 1985. The averagetrade-weighted tariff for U.S. imports of sector products from Israel was only0.6 percent in 1984, and Israel continues to account for a very small share ofU.S. sector trade. Although trade has grown steadily since the FTA was signed,Israel still accounts for less than one percent of total sector trade. Further, theFTA did not specifically address product standards, a significant barrier to U.S.trade in electronics products. Israel tends to apply European standards, and thishas become a recurring issue in talks between the United States and Israel.
U.S. trade in sector products with Israel increased at an average annual rateof 10.2 percent during 1985-2000 reaching $5.2 billion, before decreasing by27 percent in 2001. The value of U.S. sector imports from Israel increased by652 percent during 1985-2000 while sector exports to Israel approximatelytripled (table 5-6).
U.S.-Canada FTAThe U.S.-Canada FTA had a moderate effect on U.S. sector trade and
production,although factors other than the trade agreement were responsible formost sector growth. The average U.S. trade-weighted tariff on sector importsfrom Canada was 2.3 percent in 1987 and was almost zero in 1998. Rapidly
54 The U.S.-Israel FTA was signed in 1985 and was fully implemented by Jan. 1,1995.
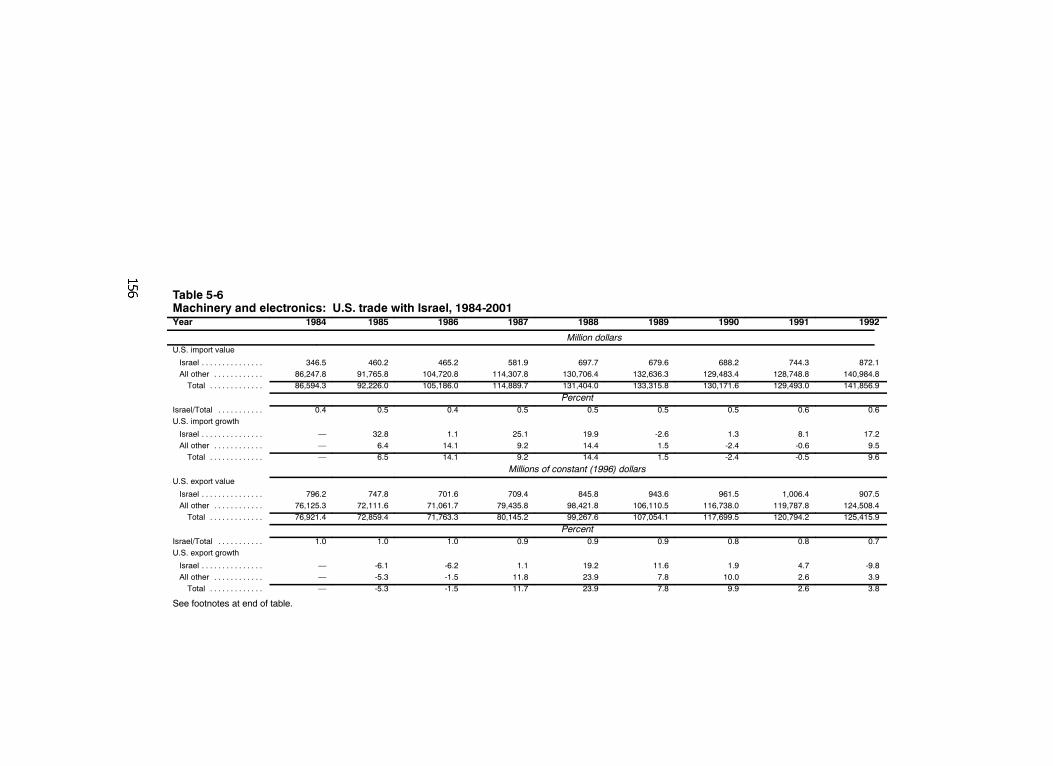
Table 5-6Machinery and electronics: U.S. trade with Israel, 1984-2001Year 1984 1985 1986 1987 1988 1989 1990 1991 1992
Million dollarsU.S. import value
Israel . . . . . . . . . . . . . . . 346.5 460.2 465.2 581.9 697.7 679.6 688.2 744.3 872.1All other . . . . . . . . . . . . 86,247.8 91,765.8 104,720.8 114,307.8 130,706.4 132,636.3 129,483.4 128,748.8 140,984.8Total . . . . . . . . . . . . . 86,594.3 92,226.0 105,186.0 114,889.7 131,404.0 133,315.8 130,171.6 129,493.0 141,856.9
PercentIsrael/Total . . . . . . . . . . . 0.4 0.5 0.4 0.5 0.5 0.5 0.5 0.6 0.6U.S. import growth
Israel . . . . . . . . . . . . . . . — 32.8 1.1 25.1 19.9 -2.6 1.3 8.1 17.2All other . . . . . . . . . . . . — 6.4 14.1 9.2 14.4 1.5 -2.4 -0.6 9.5Total . . . . . . . . . . . . . — 6.5 14.1 9.2 14.4 1.5 -2.4 -0.5 9.6
Millions of constant (1996) dollarsU.S. export value
Israel . . . . . . . . . . . . . . . 796.2 747.8 701.6 709.4 845.8 943.6 961.5 1,006.4 907.5All other . . . . . . . . . . . . 76,125.3 72,111.6 71,061.7 79,435.8 98,421.8 106,110.5 116,738.0 119,787.8 124,508.4Total . . . . . . . . . . . . . 76,921.4 72,859.4 71,763.3 80,145.2 99,267.6 107,054.1 117,699.5 120,794.2 125,415.9
PercentIsrael/Total . . . . . . . . . . . 1.0 1.0 1.0 0.9 0.9 0.9 0.8 0.8 0.7U.S. export growth
Israel . . . . . . . . . . . . . . . — -6.1 -6.2 1.1 19.2 11.6 1.9 4.7 -9.8All other . . . . . . . . . . . . — -5.3 -1.5 11.8 23.9 7.8 10.0 2.6 3.9Total . . . . . . . . . . . . . — -5.3 -1.5 11.7 23.9 7.8 9.9 2.6 3.8
See footnotes at end of table.
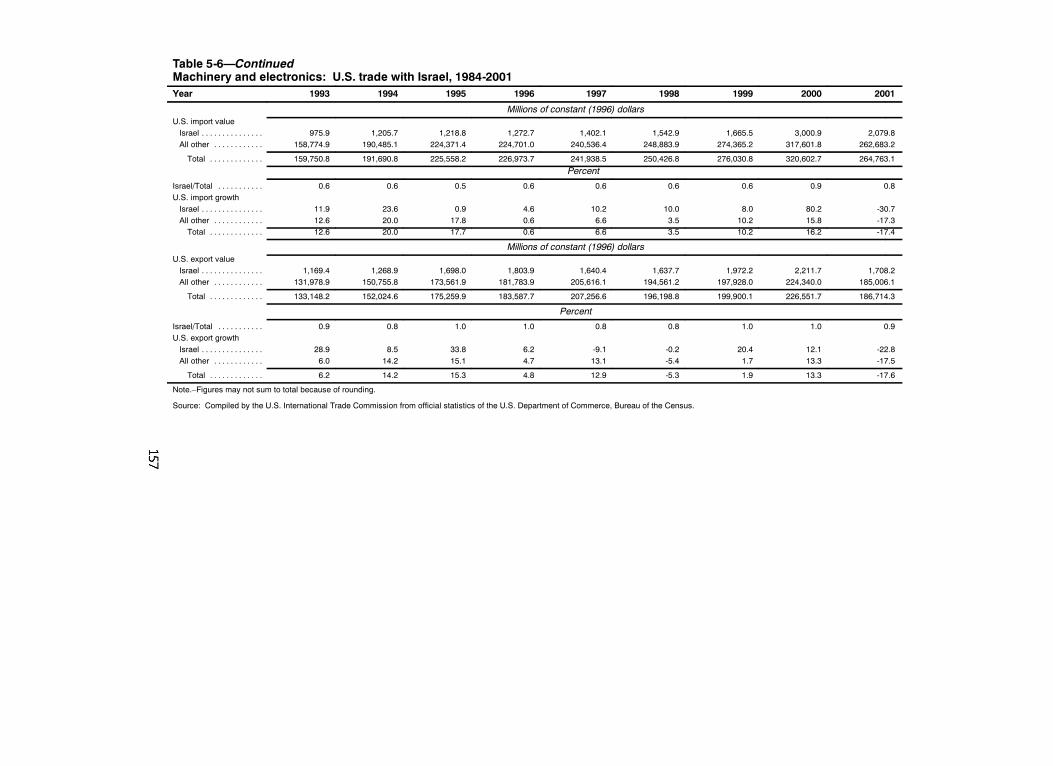
Table 5-6—ContinuedMachinery and electronics: U.S. trade with Israel, 1984-2001Year 1993 1994 1995 1996 1997 1998 1999 2000 2001
Millions of constant (1996) dollarsU.S. import valueIsrael . . . . . . . . . . . . . . . 975.9 1,205.7 1,218.8 1,272.7 1,402.1 1,542.9 1,665.5 3,000.9 2,079.8All other . . . . . . . . . . . . 158,774.9 190,485.1 224,371.4 224,701.0 240,536.4 248,883.9 274,365.2 317,601.8 262,683.2
Total . . . . . . . . . . . . . 159,750.8 191,690.8 225,558.2 226,973.7 241,938.5 250,426.8 276,030.8 320,602.7 264,763.1
Percent
Israel/Total . . . . . . . . . . . 0.6 0.6 0.5 0.6 0.6 0.6 0.6 0.9 0.8U.S. import growthIsrael . . . . . . . . . . . . . . . 11.9 23.6 0.9 4.6 10.2 10.0 8.0 80.2 -30.7All other . . . . . . . . . . . . 12.6 20.0 17.8 0.6 6.6 3.5 10.2 15.8 -17.3Total . . . . . . . . . . . . . 12.6 20.0 17.7 0.6 6.6 3.5 10.2 16.2 -17.4
Millions of constant (1996) dollarsU.S. export valueIsrael . . . . . . . . . . . . . . . 1,169.4 1,268.9 1,698.0 1,803.9 1,640.4 1,637.7 1,972.2 2,211.7 1,708.2All other . . . . . . . . . . . . 131,978.9 150,755.8 173,561.9 181,783.9 205,616.1 194,561.2 197,928.0 224,340.0 185,006.1
Total . . . . . . . . . . . . . 133,148.2 152,024.6 175,259.9 183,587.7 207,256.6 196,198.8 199,900.1 226,551.7 186,714.3
Percent
Israel/Total . . . . . . . . . . . 0.9 0.8 1.0 1.0 0.8 0.8 1.0 1.0 0.9U.S. export growthIsrael . . . . . . . . . . . . . . . 28.9 8.5 33.8 6.2 -9.1 -0.2 20.4 12.1 -22.8All other . . . . . . . . . . . . 6.0 14.2 15.1 4.7 13.1 -5.4 1.7 13.3 -17.5
Total . . . . . . . . . . . . . 6.2 14.2 15.3 4.8 12.9 -5.3 1.9 13.3 -17.6
Note.–Figures may not sum to total because of rounding.
Source: Compiled by the U.S. International Trade Commission from official statistics of the U.S. Department of Commerce, Bureau of the Census.
158
growing demand for sector products in both markets and the presence ofmajor electronics producers on both sides of the border to meet this demandwere the principal factors spurring trade growth between Canada and theUnited States during this period. Most of the beneficial effects of the tradeagreement were due to the elimination of technical barriers anddiscriminatory government procurement procedures rather than tariffelimination because tariffs were already relatively low. Trade-weightedaverage U.S. tariffs on imports of sector products from Canada were 2.3percent in 1987, the year before the FTA took effect, and had fallen toalmost zero by 1998. The positive trade effects were sufficient to have ameasurable effect on U.S. sector production and employment because of thelarge share of total sector trade accounted for by Canada.
Canada was the second-largest U.S. trading partner for sector products in1988 and has remained among the top three during every succeeding year. U.S.trade with Canada in sector products increased at an average annual rate of 8.4percent during 1988-2000, reaching $67.0 billion before decreasing21.5 percent during 2001 (table 5-7). This growth rate exceeded the averagegrowth of 7.3 percent for U.S. sector trade with all countries during 1988-2000.U.S. exports of machinery and electronic products to Canada increased 95.2percent to $31.9 billion during 1988-2001, and U.S. imports of sector productsfrom Canada increased 124.3 percent to $20.7 billion during the same period.Canada’s share of total U.S. sector imports fluctuated between 7.0 percent and8.9 percent during 1988-2001 while its share of sector exports fluctuatedbetween 15.7 percent and 20.1 percent of the total with neither showing anapparent trend.
NAFTANAFTA has had at least a moderate effect on U.S. trade in sector products,
although the impact of the factors discussed above, most notably increasedU.S. demand, has been greater. The GSP program already provided duty-freetreatment for most U.S. sector imports from Mexico. The average U.S.trade-weighted tariff on sector imports from Mexico was only 1.2 percent in1993 and had decreased to 0.1 percent by 2001. However, NAFTA permanentlyeliminated tariffs for all sector products, unlike the GSP tariff concessionswhich were dependent on periodic renewal of the program and regular reviewsto determine country and product eligibility. Thus, NAFTA removed much ofthe risk associated with foreign investment in production operations in Mexicothat exported to the United States. It is likely that the Mexican tariffconcessions had a small to moderate positive effect on U.S. exports of sectorproducts because Mexico’s average trade-weighted tariff on sector importsfrom the United States decreased significantly (from 13.6 percent to 2.3percent) during 1991-99,55 and Mexico’s importance as a market for sector
55 Data were not available for 1993 and 2001.
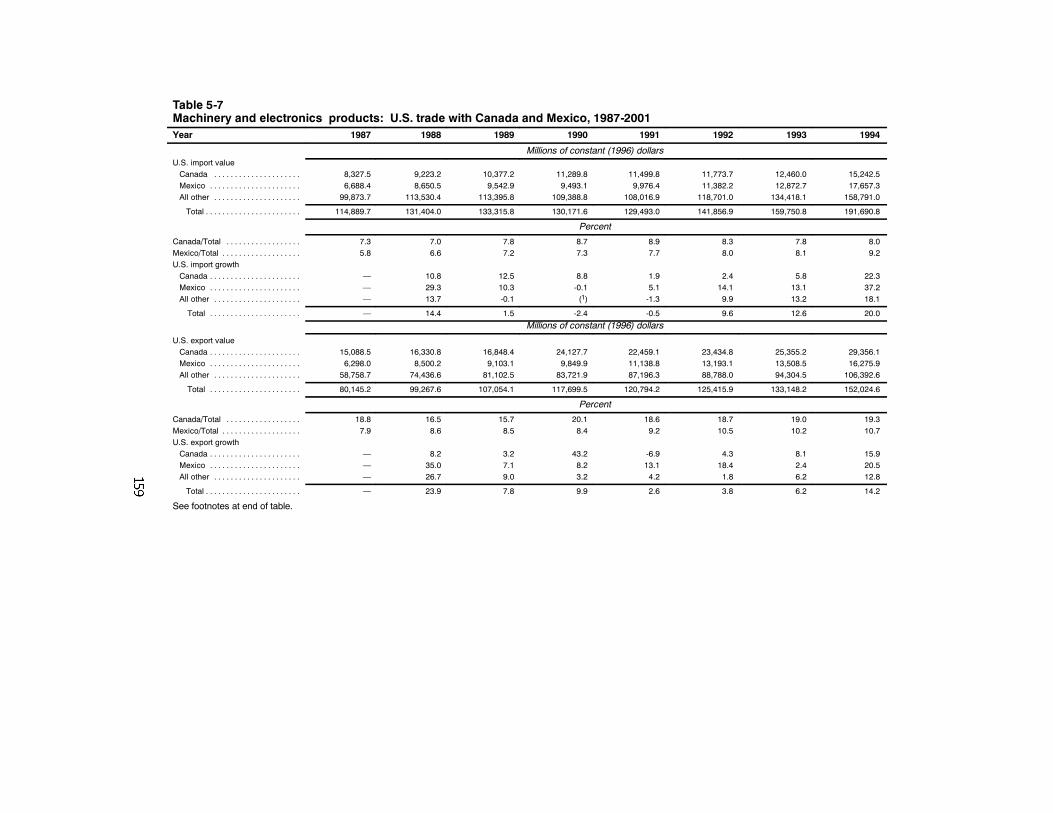
Table 5-7Machinery and electronics products: U.S. trade with Canada and Mexico, 1987-2001Year 1987 1988 1989 1990 1991 1992 1993 1994
Millions of constant (1996) dollarsU.S. import valueCanada . . . . . . . . . . . . . . . . . . . . . 8,327.5 9,223.2 10,377.2 11,289.8 11,499.8 11,773.7 12,460.0 15,242.5Mexico . . . . . . . . . . . . . . . . . . . . . . 6,688.4 8,650.5 9,542.9 9,493.1 9,976.4 11,382.2 12,872.7 17,657.3All other . . . . . . . . . . . . . . . . . . . . . 99,873.7 113,530.4 113,395.8 109,388.8 108,016.9 118,701.0 134,418.1 158,791.0
Total . . . . . . . . . . . . . . . . . . . . . . . 114,889.7 131,404.0 133,315.8 130,171.6 129,493.0 141,856.9 159,750.8 191,690.8
Percent
Canada/Total . . . . . . . . . . . . . . . . . . 7.3 7.0 7.8 8.7 8.9 8.3 7.8 8.0Mexico/Total . . . . . . . . . . . . . . . . . . . 5.8 6.6 7.2 7.3 7.7 8.0 8.1 9.2U.S. import growthCanada . . . . . . . . . . . . . . . . . . . . . . — 10.8 12.5 8.8 1.9 2.4 5.8 22.3Mexico . . . . . . . . . . . . . . . . . . . . . . — 29.3 10.3 -0.1 5.1 14.1 13.1 37.2All other . . . . . . . . . . . . . . . . . . . . . — 13.7 -0.1 (1) -1.3 9.9 13.2 18.1
Total . . . . . . . . . . . . . . . . . . . . . . — 14.4 1.5 -2.4 -0.5 9.6 12.6 20.0
Millions of constant (1996) dollars
U.S. export valueCanada . . . . . . . . . . . . . . . . . . . . . . 15,088.5 16,330.8 16,848.4 24,127.7 22,459.1 23,434.8 25,355.2 29,356.1Mexico . . . . . . . . . . . . . . . . . . . . . . 6,298.0 8,500.2 9,103.1 9,849.9 11,138.8 13,193.1 13,508.5 16,275.9All other . . . . . . . . . . . . . . . . . . . . . 58,758.7 74,436.6 81,102.5 83,721.9 87,196.3 88,788.0 94,304.5 106,392.6
Total . . . . . . . . . . . . . . . . . . . . . . 80,145.2 99,267.6 107,054.1 117,699.5 120,794.2 125,415.9 133,148.2 152,024.6
Percent
Canada/Total . . . . . . . . . . . . . . . . . . 18.8 16.5 15.7 20.1 18.6 18.7 19.0 19.3Mexico/Total . . . . . . . . . . . . . . . . . . . 7.9 8.6 8.5 8.4 9.2 10.5 10.2 10.7U.S. export growthCanada . . . . . . . . . . . . . . . . . . . . . . — 8.2 3.2 43.2 -6.9 4.3 8.1 15.9Mexico . . . . . . . . . . . . . . . . . . . . . . — 35.0 7.1 8.2 13.1 18.4 2.4 20.5All other . . . . . . . . . . . . . . . . . . . . . — 26.7 9.0 3.2 4.2 1.8 6.2 12.8
Total . . . . . . . . . . . . . . . . . . . . . . . — 23.9 7.8 9.9 2.6 3.8 6.2 14.2
See footnotes at end of table.
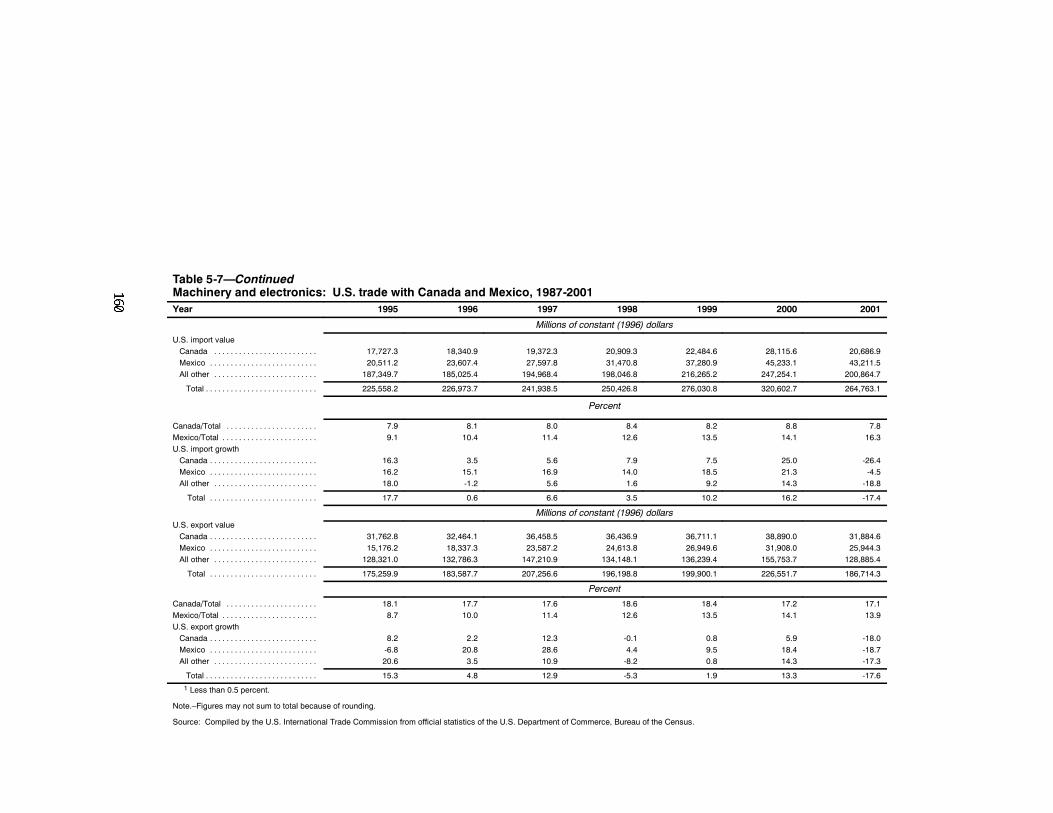
Table 5-7—ContinuedMachinery and electronics: U.S. trade with Canada and Mexico, 1987-2001Year 1995 1996 1997 1998 1999 2000 2001
Millions of constant (1996) dollars
U.S. import valueCanada . . . . . . . . . . . . . . . . . . . . . . . . . 17,727.3 18,340.9 19,372.3 20,909.3 22,484.6 28,115.6 20,686.9Mexico . . . . . . . . . . . . . . . . . . . . . . . . . . 20,511.2 23,607.4 27,597.8 31,470.8 37,280.9 45,233.1 43,211.5All other . . . . . . . . . . . . . . . . . . . . . . . . . 187,349.7 185,025.4 194,968.4 198,046.8 216,265.2 247,254.1 200,864.7
Total . . . . . . . . . . . . . . . . . . . . . . . . . . . 225,558.2 226,973.7 241,938.5 250,426.8 276,030.8 320,602.7 264,763.1
Percent
Canada/Total . . . . . . . . . . . . . . . . . . . . . . 7.9 8.1 8.0 8.4 8.2 8.8 7.8Mexico/Total . . . . . . . . . . . . . . . . . . . . . . . 9.1 10.4 11.4 12.6 13.5 14.1 16.3U.S. import growthCanada . . . . . . . . . . . . . . . . . . . . . . . . . . 16.3 3.5 5.6 7.9 7.5 25.0 -26.4Mexico . . . . . . . . . . . . . . . . . . . . . . . . . . 16.2 15.1 16.9 14.0 18.5 21.3 -4.5All other . . . . . . . . . . . . . . . . . . . . . . . . . 18.0 -1.2 5.6 1.6 9.2 14.3 -18.8
Total . . . . . . . . . . . . . . . . . . . . . . . . . . 17.7 0.6 6.6 3.5 10.2 16.2 -17.4
Millions of constant (1996) dollarsU.S. export valueCanada . . . . . . . . . . . . . . . . . . . . . . . . . . 31,762.8 32,464.1 36,458.5 36,436.9 36,711.1 38,890.0 31,884.6Mexico . . . . . . . . . . . . . . . . . . . . . . . . . . 15,176.2 18,337.3 23,587.2 24,613.8 26,949.6 31,908.0 25,944.3All other . . . . . . . . . . . . . . . . . . . . . . . . . 128,321.0 132,786.3 147,210.9 134,148.1 136,239.4 155,753.7 128,885.4
Total . . . . . . . . . . . . . . . . . . . . . . . . . . 175,259.9 183,587.7 207,256.6 196,198.8 199,900.1 226,551.7 186,714.3
Percent
Canada/Total . . . . . . . . . . . . . . . . . . . . . . 18.1 17.7 17.6 18.6 18.4 17.2 17.1Mexico/Total . . . . . . . . . . . . . . . . . . . . . . . 8.7 10.0 11.4 12.6 13.5 14.1 13.9U.S. export growthCanada . . . . . . . . . . . . . . . . . . . . . . . . . . 8.2 2.2 12.3 -0.1 0.8 5.9 -18.0Mexico . . . . . . . . . . . . . . . . . . . . . . . . . . -6.8 20.8 28.6 4.4 9.5 18.4 -18.7All other . . . . . . . . . . . . . . . . . . . . . . . . . 20.6 3.5 10.9 -8.2 0.8 14.3 -17.3
Total . . . . . . . . . . . . . . . . . . . . . . . . . . . 15.3 4.8 12.9 -5.3 1.9 13.3 -17.6
1 Less than 0.5 percent.
Note.–Figures may not sum to total because of rounding.
Source: Compiled by the U.S. International Trade Commission from official statistics of the U.S. Department of Commerce, Bureau of the Census.
161
products grew. NAFTA further stimulated cross-border investment in thissector by requiring greater consistency and transparency in Mexico’s bankingregulations.
Mexico was the second largest export market and import source for U.S.sector products in 1993, the year before the NAFTA entered into force,accounting for 8.1 percent and 10.2 percent of total sector imports and exports,respectively. By 2001, Mexico’s import share had more than doubled and it hadincreased its share of U.S. sector exports to 13.9 percent. U.S. sector trade withMexico increased at an average annual rate of 14.7 percent during 1994-2000before decreasing by 10.4 percent in 2001.
Uruguay Round
The Uruguay Round Agreements had a slight to moderate effect on sectortrade especially U.S. exports, although most of the increase in U.S. tradefollowing the implementation of the Round can be attributed to factorsdiscussed above. Much of the effect of the Round was due to the InformationTechnology Agreement (ITA) which eliminated tariffs on all informationtechnology products, such as computers, semiconductors, andtelecommunications equipment. Although the agreement entered into force inJuly 1997, the products subject to the ITA here covered by the residualproclamation authority of the Uruguay Round Agreements Act. Prior to theentry into force of the ITA, U.S. tariffs on information technology productswere generally low. However, tariffs for U.S. information technology exports incertain growing markets such as India and Indonesia were 30 percent to 40percent.
Trade-weighted average U.S. tariffs for sector imports from all tradingpartners were only 2.1 percent during 1994 and were reduced to 0.7 percent in1999. Although the Agreement on Government Procurement positively affectedU.S. exports, the high value required for contracts to qualify under thisagreement mitigated the benefits likely to accrue to U.S. producers. In addition,tariff reductions for most telecommunications equipment did not occur becausethe United States made these reductions contingent upon receiving a sufficientnumber of WTO signatories for the Government Procurement Agreement. Itdid not receive the necessary signatures. U.S. tariffs on most electronicsequipment were ultimately eliminated by the Information TechnologyAgreement which entered into force on July 1, 1997.
During 1995-2000, U.S. trade in machinery and electronic productsincreased at an average annual rate of 6.4 percent, reaching $547 billion beforedropping 17 percent in 2001. U.S. sector imports increased by 17 percent andsector exports increased by 7 percent during 1995-2001, causing an alreadynegative trade balance to increase by $28 billion.
162
Views of Interested Parties
National Electrical Manufacturers Association56
The National Electrical Manufacturers Association (NEMA) is the largesttrade association representing the interests of U.S. electrical industrymanufacturers. NEMA has more than 400 member companies, most of whichare small and medium-sized, that manufacture products used in the generation,transmission, distribution, control, and use of electricity.
NEMA supports world-wide elimination of tariffs on electrical, electronic,and medical imaging equipment through WTO zero-for-zero tariff elimination;through regional agreements; and through bilateral trade agreements.
NAFTAApproximately one-half of U.S. exports of NEMA-type products are
destined for Canada and Mexico, and NAFTA has been the motor driving thegrowth of these exports since 1994.
Uruguay Round“The Uruguay Round (UR) did not go far enough in eliminating tariffs in
[NEMA’s] industries.” Many countries refused to sign the UR agreement toeliminate tariffs on medical equipment, and the medical equipment“zero-for-zero” did not cover some critical components and parts of medicaldevices. “High tariffs remain a major barrier” to NEMA’s member sales“outside the EU, NAFTA, and Japan,” “particularly in more advanceddeveloping countries that are rapidly industrializing.” Standards and technicalbarriers remain in the European Union (EU) and Japan which hamper the salesof NEMA members and although tariffs in these countries are still relativelylow they still cost NEMA members millions of dollars.
Agriculture57
OverviewThe United States is the world’s largest producer and exporter of
agricultural products, accounting for 19.5 percent of global agricultural exports
56 Statement by Timothy Richards, General Electric, on behalf of the NationalElectrical Manufacturers Association (NEMA), written submission to the Commission,Mar. 28, 2003.
57 For the purpose of this investigation, agricultural products are composed of SICgroups 01, 02, 20, and 21. Principal U.S. products in this sector include corn, wheat,soybeans, cotton, tobacco, and hay; horticultural products such as fruits, vegetables, and
163
in 1999.58 The U.S. agricultural sector consists of millions of farms andranches producing raw agricultural goods and a much smaller number offood companies that process, package, and market these goods. The foodcompanies tend to be large multinational corporations, whereas much of theraw agricultural produce is grown on family farms.
Technological innovations in farming have led to greater productivity,which is reflected in the ability of fewer farmers to produce more food on lessfarmland, at lower cost to consumers. This is a long term trend, which has ledto the consolidation of U.S. farms as well as a net decline in U.S. farmland.The number of U.S. farms steadily decreased from about 2.3 million to1.9 million during 1978-97 while the average farm increased in size from 449acres to 487 acres. The number of farms decreased, in part, because economiccompetition pushed some farmers out of business while average size increasedas farmers sought to achieve larger economies of scale. This trend also led tohigher productivity through, for example, more capital spending on farmequipment, irrigation, and genetically modified seed and plant varieties.However, the high cost of obtaining these technological innovations and thespecialized skills needed to utilize them meant that smaller, outdated operationscould not compete with larger, updated farms. Increased productivity alongwith increased international trade have resulted in, in general, lower prices forfarm commodities and greater abundance, with consumers spending less, onaverage, for food as a percentage of household income.
The value of sector shipments has remained relatively constant, decliningslightly from $706.2 billion to $701.1 billion during 1978-2000 (table 5-8).Small variations in shipments from year to year were, in large part, the resultof price fluctuations. While overall sector output changed little from 1978 to2001, there were significant changes within the sector. For example, majoragricultural crops such as grains, oilseeds, cotton, and tobacco experiencedfalling prices and a decline in the U.S. share of world production. DecliningU.S. tobacco consumption and increasing production in other countriescontributed to a large decrease in the value of U.S. tobacco production. Incontrast, the value and global share of U.S. vegetable and poultry productionincreased.
The number of hired farm workers increased from approximately 880,000in 1994 to 991,000 in 2001.59 The number of farm workers is difficult toestimate, in part, because much of the work is temporary or part-time andvaries greatly according to the time of year, and work is often done by farmoperators and/or family members. Further, many farm workers are migrant
57—Continuedother garden products; livestock such as poultry, cattle, calves, hogs, sheep, and lambs;and livestock products such as dairy foods, meat and related products, leather, and wool.
58 FAS Online, http://www.fas.usda.gov/cmp/highlights/1998/marketshare.htm.59 These were the only years for which employment data are available. As reported
from official statistics of the USDA, National Agricultural Statistics Service.
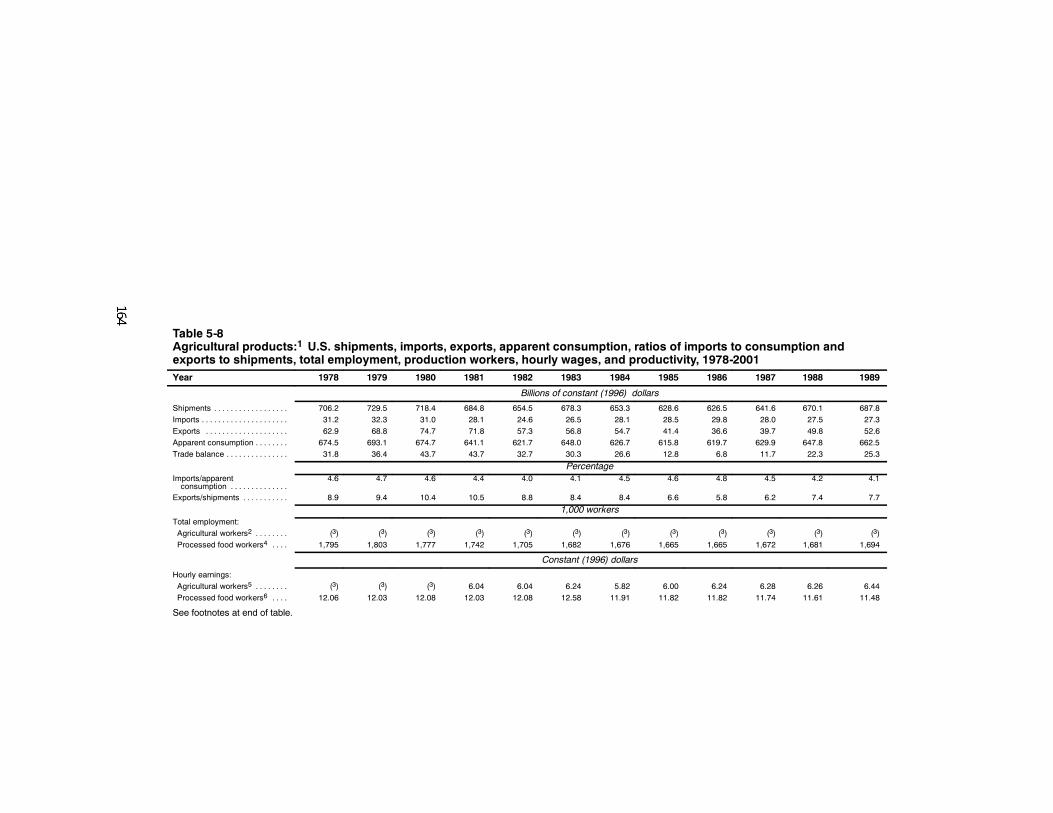
Table 5-8Agricultural products:1 U.S. shipments, imports, exports, apparent consumption, ratios of imports to consumption andexports to shipments, total employment, production workers, hourly wages, and productivity, 1978-2001Year 1978 1979 1980 1981 1982 1983 1984 1985 1986 1987 1988 1989
Billions of constant (1996) dollars
Shipments . . . . . . . . . . . . . . . . . . 706.2 729.5 718.4 684.8 654.5 678.3 653.3 628.6 626.5 641.6 670.1 687.8Imports . . . . . . . . . . . . . . . . . . . . . 31.2 32.3 31.0 28.1 24.6 26.5 28.1 28.5 29.8 28.0 27.5 27.3Exports . . . . . . . . . . . . . . . . . . . . 62.9 68.8 74.7 71.8 57.3 56.8 54.7 41.4 36.6 39.7 49.8 52.6Apparent consumption . . . . . . . . 674.5 693.1 674.7 641.1 621.7 648.0 626.7 615.8 619.7 629.9 647.8 662.5Trade balance . . . . . . . . . . . . . . . 31.8 36.4 43.7 43.7 32.7 30.3 26.6 12.8 6.8 11.7 22.3 25.3
PercentageImports/apparentconsumption . . . . . . . . . . . . . .
4.6 4.7 4.6 4.4 4.0 4.1 4.5 4.6 4.8 4.5 4.2 4.1
Exports/shipments . . . . . . . . . . . 8.9 9.4 10.4 10.5 8.8 8.4 8.4 6.6 5.8 6.2 7.4 7.7
1,000 workersTotal employment:Agricultural workers2 . . . . . . . . (3) (3) (3) (3) (3) (3) (3) (3) (3) (3) (3) (3)Processed food workers4 . . . . 1,795 1,803 1,777 1,742 1,705 1,682 1,676 1,665 1,665 1,672 1,681 1,694
Constant (1996) dollars
Hourly earnings:Agricultural workers5 . . . . . . . . (3) (3) (3) 6.04 6.04 6.24 5.82 6.00 6.24 6.28 6.26 6.44Processed food workers6 . . . . 12.06 12.03 12.08 12.03 12.08 12.58 11.91 11.82 11.82 11.74 11.61 11.48
See footnotes at end of table.
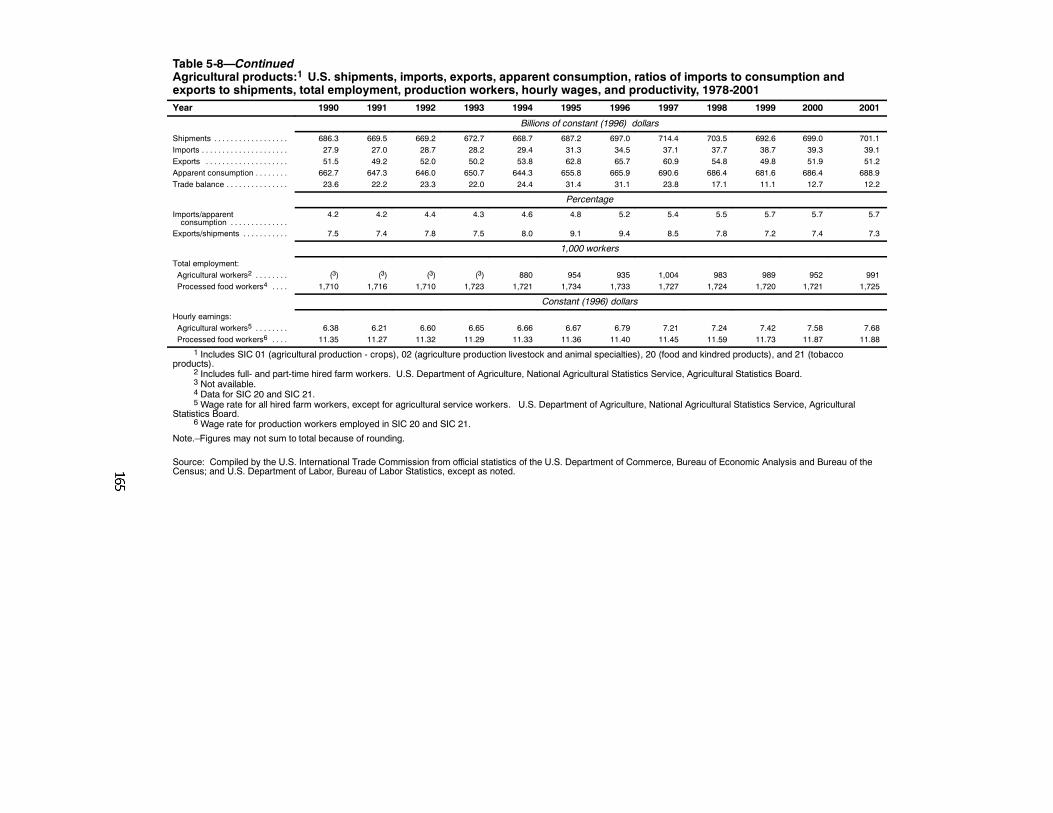
Table 5-8—ContinuedAgricultural products:1 U.S. shipments, imports, exports, apparent consumption, ratios of imports to consumption andexports to shipments, total employment, production workers, hourly wages, and productivity, 1978-2001Year 1990 1991 1992 1993 1994 1995 1996 1997 1998 1999 2000 2001
Billions of constant (1996) dollars
Shipments . . . . . . . . . . . . . . . . . . 686.3 669.5 669.2 672.7 668.7 687.2 697.0 714.4 703.5 692.6 699.0 701.1Imports . . . . . . . . . . . . . . . . . . . . . 27.9 27.0 28.7 28.2 29.4 31.3 34.5 37.1 37.7 38.7 39.3 39.1Exports . . . . . . . . . . . . . . . . . . . . 51.5 49.2 52.0 50.2 53.8 62.8 65.7 60.9 54.8 49.8 51.9 51.2Apparent consumption . . . . . . . . 662.7 647.3 646.0 650.7 644.3 655.8 665.9 690.6 686.4 681.6 686.4 688.9Trade balance . . . . . . . . . . . . . . . 23.6 22.2 23.3 22.0 24.4 31.4 31.1 23.8 17.1 11.1 12.7 12.2
Percentage
Imports/apparentconsumption . . . . . . . . . . . . . .
4.2 4.2 4.4 4.3 4.6 4.8 5.2 5.4 5.5 5.7 5.7 5.7
Exports/shipments . . . . . . . . . . . 7.5 7.4 7.8 7.5 8.0 9.1 9.4 8.5 7.8 7.2 7.4 7.3
1,000 workers
Total employment:Agricultural workers2 . . . . . . . . (3) (3) (3) (3) 880 954 935 1,004 983 989 952 991Processed food workers4 . . . . 1,710 1,716 1,710 1,723 1,721 1,734 1,733 1,727 1,724 1,720 1,721 1,725
Constant (1996) dollars
Hourly earnings:Agricultural workers5 . . . . . . . . 6.38 6.21 6.60 6.65 6.66 6.67 6.79 7.21 7.24 7.42 7.58 7.68Processed food workers6 . . . . 11.35 11.27 11.32 11.29 11.33 11.36 11.40 11.45 11.59 11.73 11.87 11.88
1 Includes SIC 01 (agricultural production - crops), 02 (agriculture production livestock and animal specialties), 20 (food and kindred products), and 21 (tobaccoproducts).
2 Includes full- and part-time hired farm workers. U.S. Department of Agriculture, National Agricultural Statistics Service, Agricultural Statistics Board.3 Not available.4 Data for SIC 20 and SIC 21.5 Wage rate for all hired farm workers, except for agricultural service workers. U.S. Department of Agriculture, National Agricultural Statistics Service, Agricultural
Statistics Board.6 Wage rate for production workers employed in SIC 20 and SIC 21.
Note.–Figures may not sum to total because of rounding.
Source: Compiled by the U.S. International Trade Commission from official statistics of the U.S. Department of Commerce, Bureau of Economic Analysis and Bureau of theCensus; and U.S. Department of Labor, Bureau of Labor Statistics, except as noted.
166
laborers who move from one crop to another. Similarly, packing andprocessing plants may be extremely busy for a few weeks during the harvestseason, but need fewer workers during the remainder of the year. Averagehourly wage rates for hired farm workers has increased steadily, from $6.04in 1981 to $7.68 in 2001 (table 5-8).60
Many growers reported lower commodity prices and increasingly difficultfinancial conditions during 1978-2001.61 Growers received an increasinglysmaller percentage of the retail value of agricultural products while processors,distributors, and marketers received an increasingly larger share. This trendmay indicate a loss of pricing power for growers that sell to corporations andretail establishments, which have become larger and more vertically andhorizontally integrated. In order to gain more pricing power, many growershave joined cooperatives that negotiate prices and share profits with theirgrower members. Farm prices are also influenced by government programs thatvary greatly by crop, but often provide price support, purchase schemes, targetprices, and in the past, export subsidies, or general assistance to farmers. TheExport Enhancement Program (EEP) was announced by USDA on May 15,1985, and is operated under authority of the Agricultural Trade Act of 1978 asamended, the Uruguay Round Agreements Act, and the Federal AgricultureImprovement and Reform Act of 1996.62 Consistent with its export subsidycommitments under the Uruguay Round Agreement on Agriculture, the UnitedStates has established annual ceilings by commodity with respect to exportquantities and budget outlays. A formula known as an Aggregate Measure ofSupport (AMS) was established for eac commodity o measure the total amountof government support, as well as reduction levels.63 The commitment to
60 Ibid.61 Prices at the consumer level do not necessarily reflect the prices received by
farmers. Most of the shipment value for agricultural products is added after the productsleave the farm in the packing, processing, and marketing stages.
62 Other agricultural export assistance programs include the Market Access Program(MAP) which is designed to create, expand, and maintain foreign markets for U.S.agricultural commodities; the Foreign Market Development Program (FMD) whichassists U.S. nonprofit trade organizations in developing and maintaining foreign marketsfor U.S. agricultural programs; the Dairy Export Incentive Program (DEIP) which assistsexporters of U.S. dairy products in meeting prevailing world prices for targeted dairyproducts; the CCC Export Credit Guarantee Programs (GSM) 102/103 which helpsguarantee financing of agricultural sales; the Supplier Credit Guarantee Program (SCGP)which guarantees a portion of payments due from importers; the Quality SamplesProgram (QSP) which assists in providing commodity samples to potential foreignimporters; and the Facility Guarantee Program (FGP) which provides paymentguarantees to facilitate the financing of facilities for U.S. agricultural products inemerging markets.
63 United States domestic support: Deriviation of the 1986-88 base aggregatemeasurement of support (AMS) and the base for reductions, from World TradeOrganization and Economic Research Service. http://www.ers.usda.gov/briefing/FarmPolicy.
167
respect the quantity ceilings became effective July 1, 1995; the commitmentto respect budgetary outlay ceilings became effective October 1, 1995.64
Trade is essential to the U.S. agricultural sector, with revenue from U.S.exports accounting for between 20 and 30 percent of total farm incomebetween 1978 and 2001.65 Lower prices for U.S. products and improvedaccess through trade agreements have permitted U.S. farmers to expand theirshare of foreign markets. However, owing to falling world prices for bulkagricultural commodities, the total value of U.S. exports during this period hasremained relatively stagnant. Historically, bulk commodities–wheat, rice, coarsegrains, oilseeds, cotton, and tobacco–accounted for most U.S. agriculturalexports. However, in the 1990s, as population and incomes rose worldwide,U.S. exports of high-value products (HVP)–meats, poultry, live animals,oilseed meals, oils and oil seeds, fruits, vegetables, and beverages–expandedsteadily in response to demand for more food diversity. Whereas bulkcommodities accounted for over two-thirds of U.S. agricultural exports in1978, by 2000 the HVP share had increased to 65 percent.66
Live animals and meat such as beef, pork, and poultry accounted for about$8 billion of U.S. exports in 2001. The fastest growing U.S. exports during1978-2001 were beverages (including juices and wines), vegetables, andvegetable products. The main destinations for U.S. agricultural exports duringthe period were Canada, China, the EU, Hong Kong, Japan, Mexico, SouthKorea, and Taiwan. These top export destinations have varied little during thelast decade.67
U.S. agricultural exports have exceeded U.S. agricultural imports since thelate 1950s, generating a surplus in U.S. agricultural trade. However, the U.S.agricultural export surplus narrowed from 1978 to 2001 as imports grew andexports declined. Imports during this period increased from $31.2 billion in1978 to $39.1 billion in 2001, while exports declined from $62.9 billion to$52.6 billion, causing a decrease in the trade surplus from $31.8 billion to$13.6 billion. The trade surplus during this period peaked in 1980 and 1981 at$43.7 billion and fell to its lowest level of $6.8 billion in 1986. Apparentconsumption remained relatively stable from 1978 to 2001, rising slightly from$674 billion to $687 billion, in constant 1996 dollars. The import share of U.S.consumption rose slightly from about 4.6 percent to 5.7 percent during thisperiod, while exports as a percentage of U.S. shipments fell slightly, fromabout 8.9 percent to 7.5 percent.
64 From FASonline, http://www.fas.usda.gov/excredits/eep.html, USDA Foreign Ag-ricultural Service, Aug. 9, 2002.
65 It varied from a low of about 20 percent in 1985, to a high of about 30 percent in1980, and was about 25 percent in 2002. USDA/ERS, U.S. Agricultural Trade, from U.S.Agricultural Baseline Projections to 2010, Feb. 2001.
66 USDA/ERS, U.S. Agricultural Trade, from U.S. Agricultural Baseline Projectionsto 2010, Feb. 2001.
67 Ibid.
168
U.S. agricultural imports grew throughout the 1980s and 1990s, in part,because of the appreciation of the dollar versus the currencies of many majortrading partners. Alcoholic beverages, including wine, beer, malt beverages,and distilled sprits, were the largest category of U.S. agricultural imports in2001, totaling nearly $8 billion. Horticultural products such as fruits,vegetables, nuts, and nursery products such as ornamental plants, and includingitems not produced in the United States such as coffee, cocoa, and rubber alsoaccounted for a large percentage of U.S. agricultural imports. Animals andanimal products were another important category of imports. In the last twodecades, U.S. sector import sources varied little and came primarily fromAustralia, Brazil, Canada, Columbia, the EU, Indonesia, and Mexico.68
Effect of Trade Agreements on the SectorWhile the Tokyo Round and the U.S.-Israel FTA had minimal effects on
agricultural products, the U.S.-Canada FTA and NAFTA phased out mostexisting tariffs between Canada, Mexico, and the United States. Each of thefive agreements also addressed a range of additional trade issues in the sector(table 5-9). In addition, the Uruguay Round was the first multilateral round thatrequired most countries to convert existing quantitative restrictions on trade inagriculture into bound tariff rates and tariff-rate quotas, and bound allparticipants to significant phased reductions of tariffs.
However, some of the trade effects of reduced agricultural tariffs may havebeen moderated by other protective measures in the industry. Many nationalgovernments have a long tradition of protecting their domestic growing andprocessing industries from foreign competition and have placed some of themost varied and formidable trade barriers in the agriculture sector. Growerorganizations in many countries wield important political and economic powerwhich help to influence national trade policy in favor of protection.Self-sufficiency in food production has been the goal of many governments asa national security issue. Further, in many parts of the world, the cultivation ofagricultural products such as rice in parts of Asia and wine and grapeproduction in Southern Europe has long been part of the national culture andtradition, and international trade is often perceived as a threat.
Agricultural trade barriers can take many forms because food is subject notonly to tariffs and quotas but to a variety of sanitary and phytosanitarystandards that may vary from country to country. In the past, trade agreementsthat succeeded in lowering tariff rates often led to the appearance of nontariffbarriers (NTBs) such as time-consuming port inspections, unusual sanitarystandards or packaging requirements, shelf-life rules, or food-additive rules thatimpede trade. Later agreements would attempt to address some of thesenontariff barriers.
68 Ibid.
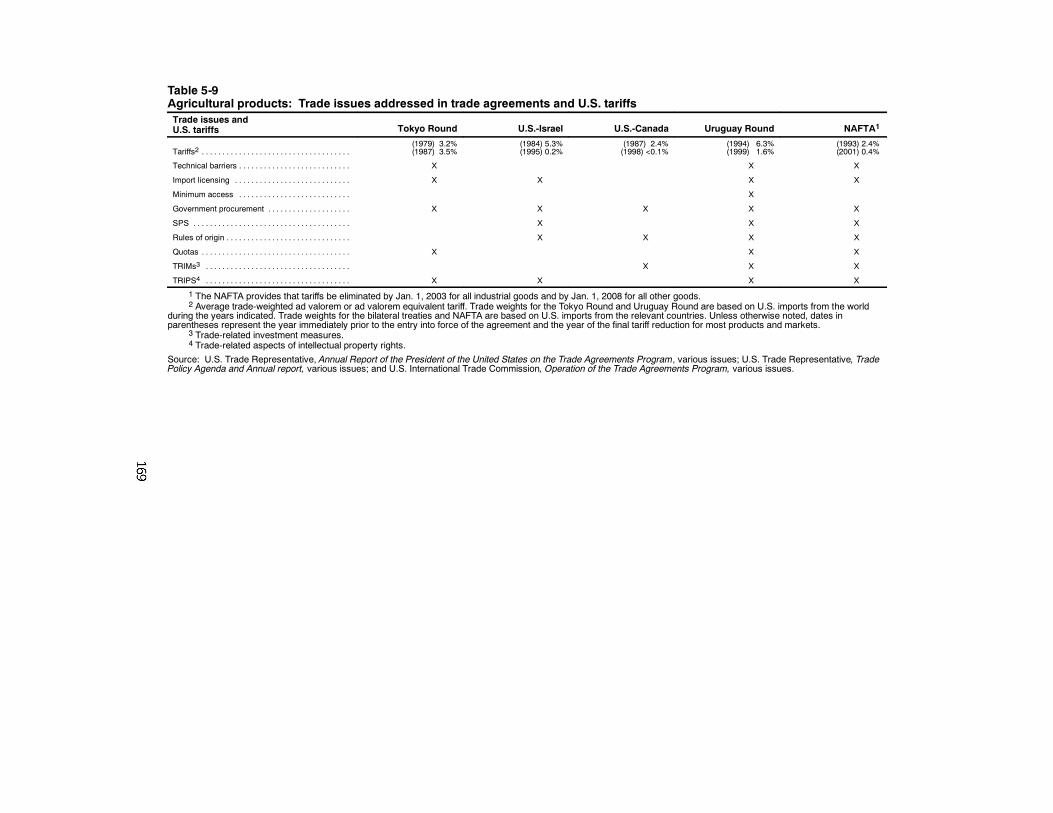
Table 5-9Agricultural products: Trade issues addressed in trade agreements and U.S. tariffsTrade issues andU.S. tariffs Tokyo Round U.S.-Israel U.S.-Canada Uruguay Round NAFTA1
Tariffs2 . . . . . . . . . . . . . . . . . . . . . . . . . . . . . . . . . . . .(1979) 3.2%(1987) 3.5%
(1984) 5.3%(1995) 0.2%
(1987) 2.4%(1998) <0.1%
(1994) 6.3%(1999) 1.6%
(1993) 2.4%(2001) 0.4%
Technical barriers . . . . . . . . . . . . . . . . . . . . . . . . . . . X X X
Import licensing . . . . . . . . . . . . . . . . . . . . . . . . . . . . X X X X
Minimum access . . . . . . . . . . . . . . . . . . . . . . . . . . . X
Government procurement . . . . . . . . . . . . . . . . . . . . X X X X X
SPS . . . . . . . . . . . . . . . . . . . . . . . . . . . . . . . . . . . . . . X X X
Rules of origin . . . . . . . . . . . . . . . . . . . . . . . . . . . . . . X X X X
Quotas . . . . . . . . . . . . . . . . . . . . . . . . . . . . . . . . . . . . X X X
TRIMs3 . . . . . . . . . . . . . . . . . . . . . . . . . . . . . . . . . . . X X X
TRIPS4 . . . . . . . . . . . . . . . . . . . . . . . . . . . . . . . . . . . X X X X
1 The NAFTA provides that tariffs be eliminated by Jan. 1, 2003 for all industrial goods and by Jan. 1, 2008 for all other goods.2 Average trade-weighted ad valorem or ad valorem equivalent tariff. Trade weights for the Tokyo Round and Uruguay Round are based on U.S. imports from the world
during the years indicated. Trade weights for the bilateral treaties and NAFTA are based on U.S. imports from the relevant countries. Unless otherwise noted, dates inparentheses represent the year immediately prior to the entry into force of the agreement and the year of the final tariff reduction for most products and markets.
3 Trade-related investment measures.4 Trade-related aspects of intellectual property rights.
Source: U.S. Trade Representative, Annual Report of the President of the United States on the Trade Agreements Program, various issues; U.S. Trade Representative, TradePolicy Agenda and Annual report, various issues; and U.S. International Trade Commission, Operation of the Trade Agreements Program, various issues.
170
Tokyo RoundBetween 1980, the year of the first stage of the Tokyo Round tariff
reductions, and 2000, total U.S. trade in agricultural products decreased by13.7 percent, as U.S. imports increased by 26.8 percent while U.S. exportsdeclined by 30.5 percent (table 5-8). Imports as a share of U.S. apparentconsumption grew from 4.6 percent in 1978 to 5.6 percent in 2000, while U.S.exports as a share of shipments fell from 8.9 percent to 7.4 percent.
The most important effect of the Tokyo Round on the U.S. agriculturalsector may have been to lay the groundwork for the subsequent URAAdiscussed in more detail at the end of this section. The Tokyo Round had littleeffect on average U.S. tariff rates in agriculture. In fact, U.S. tariffs increasedslightly from 3.2 percent to 3.5 percent during 1979-87. The Tokyo Roundmainly affected manufactured products, and used the “Swiss” formula designedto result in a fairly deep overall reduction in tariffs while cutting high ratesproportionately more than low ones. The same formula was used to reduceagricultural rates during the 1994 GATT Agreement on Agriculture.
As part of the Tokyo Round, the GATT Arrangement Regarding BovineMeat (1980-1994) entered into effect on January 1, 1980. The primaryobjectives of the Arrangement were to promote the expansion, liberalization,and stability of the international meat and livestock market by improving theinternational framework of world trade to the benefit of consumers, producers,importers, and exporters; to encourage greater international cooperation in allaspects affecting trade in bovine meat and live animals; and to secureadditional benefits for the international trade of developing countries in bovinemeat and live animals.
Also a part of the Tokyo Round, the International Dairy Arrangemententered into effect on January 1, 1980. The primary objectives of theArrangement were to advance the expansion and liberalization of world tradein dairy products under as stable as possible market conditions, on the basis ofmutual benefit to exporting and importing countries, and to further economicand social development in developing countries.
The International Dairy Arrangement was concluded in the Tokyo Roundof multilateral trade negotiations in 1979. The Arrangement covered fresh andpreserved milk and cream, butter, cheese and curd and casein with the purposeof expanding and liberalizing world trade in dairy products. The Arrangementestablished minimum export prices for skimmed milk powder, wholemilkpowder, buttermilk powder, anhydrous milk fat, butter, and cheese. It wasreplaced by the International Dairy Agreement when the WTO was establishedon January 1, 1995. Owing to non-participation by some major dairy exportingcountries (including Australia and the United States), the operation of theminimum price regime was untenable. As a result, the Agreement wasterminated as of January 1, 1998.69
69 International Dairy Agreement. Annual Reports from 1995 and 1997.
171
U.S.-Israel FTAThe United States-Israel Free Trade Agreement (FTA) eliminated most
trade barriers between the two countries. However, according to the UnitedStates Trade Representative, substantial barriers remain with regard to Israel’sagricultural sector.70 U.S. agricultural exports to Israel after the agreement roseslightly, from $438.7 million in 1984 to $461.5 million in 2001. During thisperiod, Israel never accounted for more than 1 percent of U.S. agriculturalexports. The U.S. share of Israel’s agricultural imports averaged 38 percent inthe 5 years prior to the agreement and dropped to 29 percent in the following 5years. Bulk commodities dominated U.S. agricultural exports to Israel, with 93percent of the total value prior to the agreement and 87 percent in thefollowing 5-year period.
U.S. agricultural imports from Israel have historically been low, and rosefrom $82.2 million in 1984 to $113.2 million in 2001 (table 5-10). During thisperiod, the share of U.S. agricultural imports that came from Israel remainedunchanged at about 0.3 percent. Two-thirds of total U.S. agricultural importsfrom Israel are consumer-oriented goods such as dairy products, biscuits, andwafers, which grew 44 percent following the FTA, while horticultural importsfrom Israel doubled.71
Although tariffs were significantly reduced, the agreement permitted eachcountry to maintain NTBs for the protection of sensitive agricultural products.Israel maintained levies and fees on a wide range of agricultural products andplaced quotas and bans on others. Such NTBs as well as certain technicalbarriers to trade continue to hamper U.S. access to the Israeli market. On theother hand, the reduction in duties and setting of tariff-rate quotas for nearly100 products has helped increase certain U.S. exports such as frozen fruit andbreakfast cereals to Israel. Israel’s import liberalization programs with othercountries and new trade agreements have diluted U.S. advantages under thebilateral agreement.
The substantial NTBs on agricultural imports in Israel led to the 1996Agreement on Trade in Agricultural Products (ATAP), establishing a programof gradual and steady market access liberalization for food and agriculturalproducts. The ATAP was negotiated, in part, in an effort to reconcile theinconsistencies between the 1985 Agreement and the global trade rules thatresulted from the Uruguay Round. The Uruguay Round and Israel’smembership in the newly formed WTO required the Government to transforminto tariffs all administrative or nontariff barriers to trade, which had beenallowed under the FTA. The ATAP is comprehensive and provides forimmediate and meaningful access for U.S. farm products in the Israeli marketThe agreement reduced duties and established TRQs for nearly 100 U.S.
70 USTR, 2001 National Trade Estimate Report on Foreign Trade Barriers, (USTR,Washington, DC), p. 201.
71 Michael Kurtzig and Daniel Pick, “U.S.-Israel FTA,” in Burfister and Jones (eds.),Regional Trade Agreement and U.S. Agriculture, USDA Agricultural Economics ReportNo. 771 (November 1988).
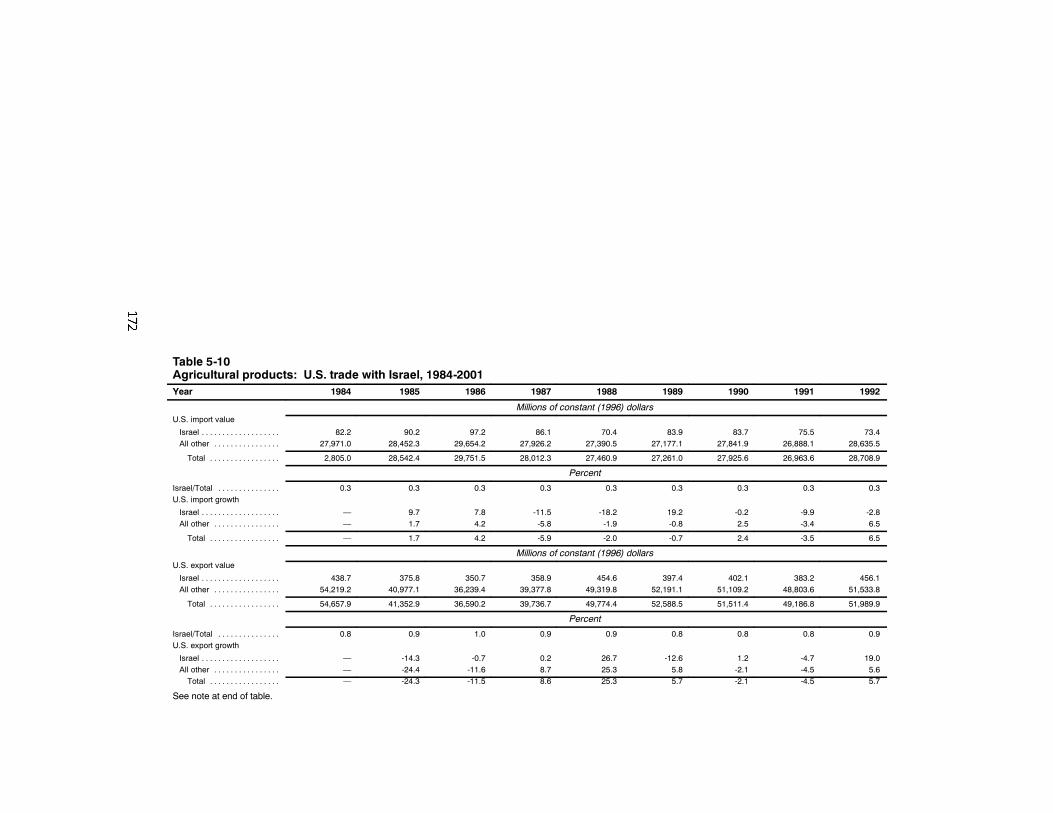
Table 5-10Agricultural products: U.S. trade with Israel, 1984-2001Year 1984 1985 1986 1987 1988 1989 1990 1991 1992
Millions of constant (1996) dollarsU.S. import value
Israel . . . . . . . . . . . . . . . . . . . 82.2 90.2 97.2 86.1 70.4 83.9 83.7 75.5 73.4All other . . . . . . . . . . . . . . . . 27,971.0 28,452.3 29,654.2 27,926.2 27,390.5 27,177.1 27,841.9 26,888.1 28,635.5
Total . . . . . . . . . . . . . . . . . 2,805.0 28,542.4 29,751.5 28,012.3 27,460.9 27,261.0 27,925.6 26,963.6 28,708.9
Percent
Israel/Total . . . . . . . . . . . . . . . 0.3 0.3 0.3 0.3 0.3 0.3 0.3 0.3 0.3U.S. import growth
Israel . . . . . . . . . . . . . . . . . . . — 9.7 7.8 -11.5 -18.2 19.2 -0.2 -9.9 -2.8All other . . . . . . . . . . . . . . . . — 1.7 4.2 -5.8 -1.9 -0.8 2.5 -3.4 6.5
Total . . . . . . . . . . . . . . . . . — 1.7 4.2 -5.9 -2.0 -0.7 2.4 -3.5 6.5
Millions of constant (1996) dollarsU.S. export value
Israel . . . . . . . . . . . . . . . . . . . 438.7 375.8 350.7 358.9 454.6 397.4 402.1 383.2 456.1All other . . . . . . . . . . . . . . . . 54,219.2 40,977.1 36,239.4 39,377.8 49,319.8 52,191.1 51,109.2 48,803.6 51,533.8
Total . . . . . . . . . . . . . . . . . 54,657.9 41,352.9 36,590.2 39,736.7 49,774.4 52,588.5 51,511.4 49,186.8 51,989.9
Percent
Israel/Total . . . . . . . . . . . . . . . 0.8 0.9 1.0 0.9 0.9 0.8 0.8 0.8 0.9U.S. export growth
Israel . . . . . . . . . . . . . . . . . . . — -14.3 -0.7 0.2 26.7 -12.6 1.2 -4.7 19.0All other . . . . . . . . . . . . . . . . — -24.4 -11.6 8.7 25.3 5.8 -2.1 -4.5 5.6Total . . . . . . . . . . . . . . . . . — -24.3 -11.5 8.6 25.3 5.7 -2.1 -4.5 5.7
See note at end of table.
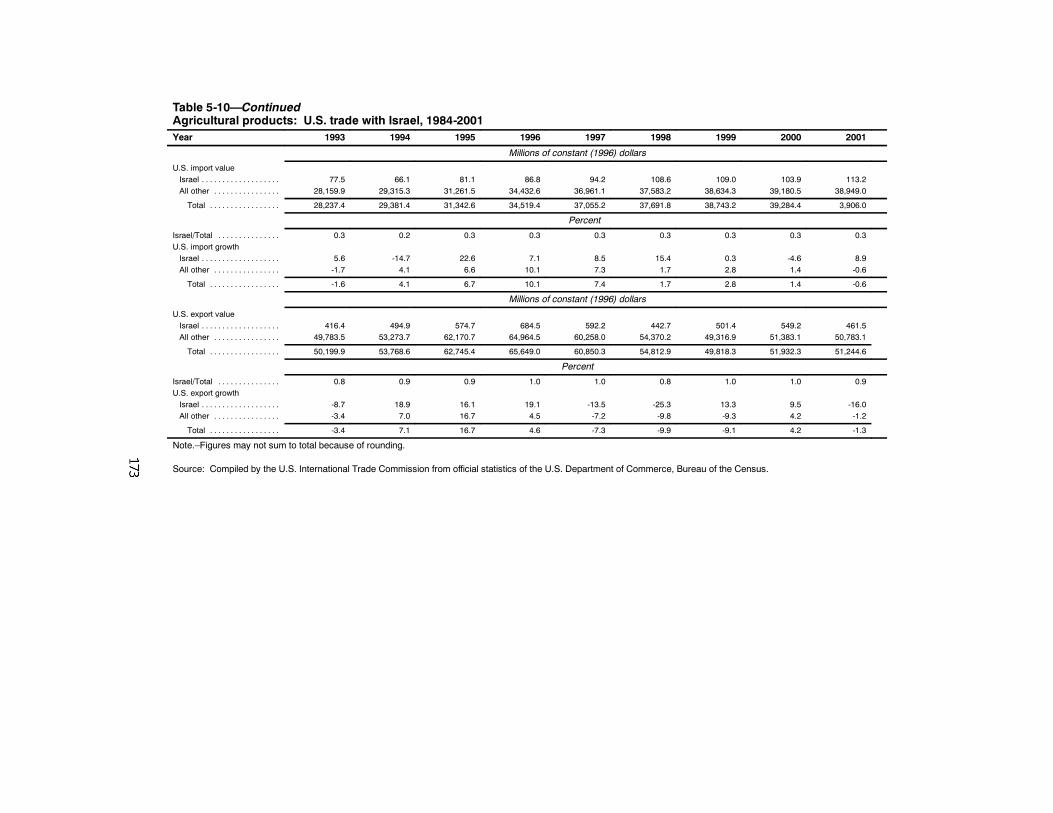
Table 5-10—ContinuedAgricultural products: U.S. trade with Israel, 1984-2001Year 1993 1994 1995 1996 1997 1998 1999 2000 2001
Millions of constant (1996) dollars
U.S. import valueIsrael . . . . . . . . . . . . . . . . . . . 77.5 66.1 81.1 86.8 94.2 108.6 109.0 103.9 113.2All other . . . . . . . . . . . . . . . . 28,159.9 29,315.3 31,261.5 34,432.6 36,961.1 37,583.2 38,634.3 39,180.5 38,949.0
Total . . . . . . . . . . . . . . . . . 28,237.4 29,381.4 31,342.6 34,519.4 37,055.2 37,691.8 38,743.2 39,284.4 3,906.0
Percent
Israel/Total . . . . . . . . . . . . . . . 0.3 0.2 0.3 0.3 0.3 0.3 0.3 0.3 0.3U.S. import growthIsrael . . . . . . . . . . . . . . . . . . . 5.6 -14.7 22.6 7.1 8.5 15.4 0.3 -4.6 8.9All other . . . . . . . . . . . . . . . . -1.7 4.1 6.6 10.1 7.3 1.7 2.8 1.4 -0.6
Total . . . . . . . . . . . . . . . . . -1.6 4.1 6.7 10.1 7.4 1.7 2.8 1.4 -0.6
Millions of constant (1996) dollars
U.S. export valueIsrael . . . . . . . . . . . . . . . . . . . 416.4 494.9 574.7 684.5 592.2 442.7 501.4 549.2 461.5All other . . . . . . . . . . . . . . . . 49,783.5 53,273.7 62,170.7 64,964.5 60,258.0 54,370.2 49,316.9 51,383.1 50,783.1
Total . . . . . . . . . . . . . . . . . 50,199.9 53,768.6 62,745.4 65,649.0 60,850.3 54,812.9 49,818.3 51,932.3 51,244.6
Percent
Israel/Total . . . . . . . . . . . . . . . 0.8 0.9 0.9 1.0 1.0 0.8 1.0 1.0 0.9U.S. export growthIsrael . . . . . . . . . . . . . . . . . . . -8.7 18.9 16.1 19.1 -13.5 -25.3 13.3 9.5 -16.0All other . . . . . . . . . . . . . . . . -3.4 7.0 16.7 4.5 -7.2 -9.8 -9.3 4.2 -1.2
Total . . . . . . . . . . . . . . . . . -3.4 7.1 16.7 4.6 -7.3 -9.9 -9.1 4.2 -1.3
Note.–Figures may not sum to total because of rounding.
Source: Compiled by the U.S. International Trade Commission from official statistics of the U.S. Department of Commerce, Bureau of the Census.
174
products and allowed for the free entry of many other U.S. products. TheATAP was negotiated with a 5 year time frame which lapsed in 2001, afterwhich the two sides committed to seek further improvements. Under ATAP,all U.S. food and agricultural products have access to the Israeli marketunder one of three different categories: unlimited duty-free access; duty-freeTRQs; or preferential tariffs, which are generally set at least 10 percentbelow Israel’s Most-Favored Nation (MFN) rates.
Some of the remaining obstacles to free trade between the United Statesand Israel include product standards such as weights and measures, and kashrut(Kosher) certification. Israel requires that many household products be sold infixed package sizes (e.g., 200, 400, or 500 grams), using metric measures. Thistrade barrier particularly hurts U.S. exports of vegetables, fruits, and pasta. In1994, Israel established the Israeli Kosher Meat Import Law prohibiting allimports of non-kosher meat.
U.S.-Canada FTAU.S. bilateral trade with Canada in agricultural products grew substantially
during the years following the agreement. U.S. agricultural imports fromCanada grew from $3.4 billion in 1987 to $10.0 billion in 2001, while U.S.agricultural exports to Canada during this period grew from $2.4 billion to $7.4billion (table 5-11).
The United States is Canada’s largest supplier of agricultural imports.Fruits, vegetables, and other horticultural products account for about one-halfof U.S. sector exports to Canada (table 5-11). Other important U.S. exports toCanada include livestock products, grains, oilseeds, and sugar products.Leading U.S. sector imports include livestock products, grains, and oilseeds.The United States has become increasingly important for Canadian agriculturalexports, taking over one-third of Canada’s total agricultural exports in 2001.Under the U.S.-Canada FTA (CFTA), the United States and Canada agreed toeliminate most existing tariffs and most nontariff barriers. Quantitativerestrictions such as quotas and licenses were left in place, to be addressed inthe Uruguay Round. The agreement excluded domestic price support programsand border measures for both countries and access at preferential rates toover-TRQ rate lines. However, both pledged to develop mutually advantageousrules and disciplines on subsidies and dumping, both contentious agriculturalissues. The CFTA dispute settlement panel resolved two significant agriculturaltrade disagreements–U.S. countervailing duties on Canadian pork and Canadiandurum wheat pricing. The panel ruled in Canada’s favor in both cases and theUnited States accepted the decisions. The panel, operating bilaterally, wasenvisioned as being more expedient than a GATT panel. The United Statessought to include new provisions in the North American Free Trade Agreement(NAFTA) to address trade-distorting border measures, a major area ofdispute.72
72 USDA/ERS “U.S.--Canada Free Trade Agreement: Trade Disputes andSettlement,” Apr. 1993, , Agriculture Information Bulletin Number 664--1.
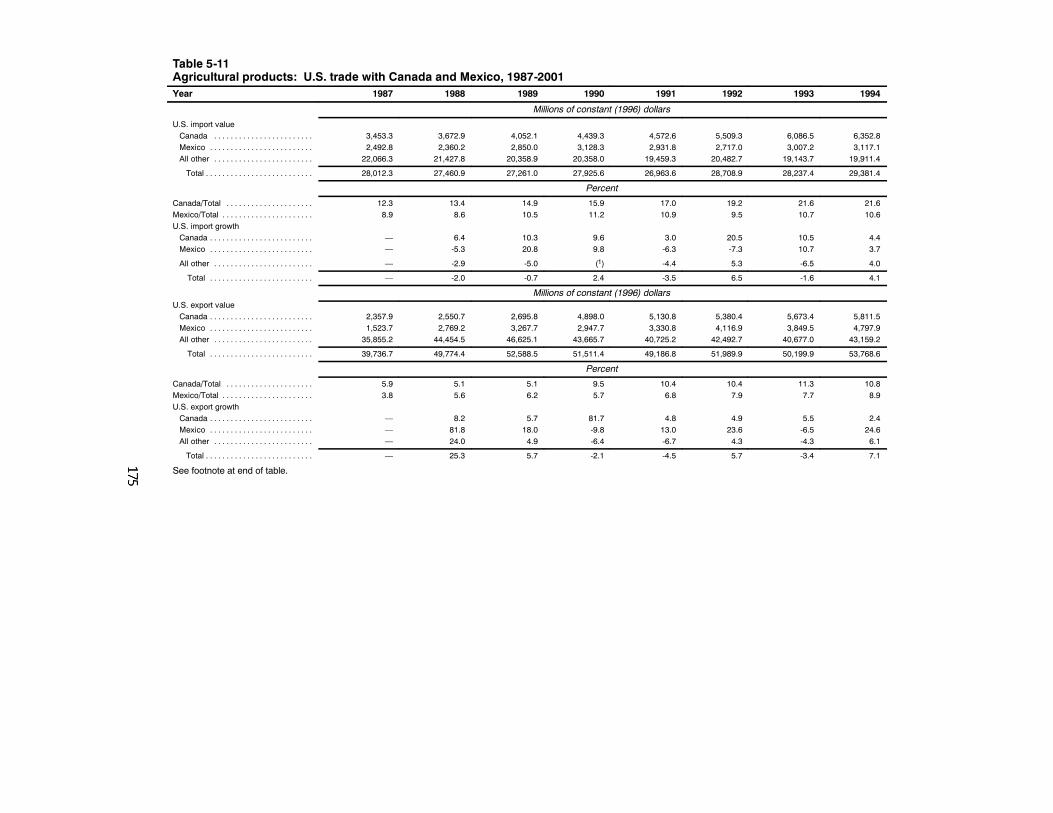
Table 5-11Agricultural products: U.S. trade with Canada and Mexico, 1987-2001Year 1987 1988 1989 1990 1991 1992 1993 1994
Millions of constant (1996) dollars
U.S. import valueCanada . . . . . . . . . . . . . . . . . . . . . . . . 3,453.3 3,672.9 4,052.1 4,439.3 4,572.6 5,509.3 6,086.5 6,352.8Mexico . . . . . . . . . . . . . . . . . . . . . . . . . 2,492.8 2,360.2 2,850.0 3,128.3 2,931.8 2,717.0 3,007.2 3,117.1All other . . . . . . . . . . . . . . . . . . . . . . . . 22,066.3 21,427.8 20,358.9 20,358.0 19,459.3 20,482.7 19,143.7 19,911.4
Total . . . . . . . . . . . . . . . . . . . . . . . . . . 28,012.3 27,460.9 27,261.0 27,925.6 26,963.6 28,708.9 28,237.4 29,381.4
Percent
Canada/Total . . . . . . . . . . . . . . . . . . . . . 12.3 13.4 14.9 15.9 17.0 19.2 21.6 21.6Mexico/Total . . . . . . . . . . . . . . . . . . . . . . 8.9 8.6 10.5 11.2 10.9 9.5 10.7 10.6U.S. import growthCanada . . . . . . . . . . . . . . . . . . . . . . . . . — 6.4 10.3 9.6 3.0 20.5 10.5 4.4Mexico . . . . . . . . . . . . . . . . . . . . . . . . . — -5.3 20.8 9.8 -6.3 -7.3 10.7 3.7
All other . . . . . . . . . . . . . . . . . . . . . . . . — -2.9 -5.0 (1) -4.4 5.3 -6.5 4.0
Total . . . . . . . . . . . . . . . . . . . . . . . . . — -2.0 -0.7 2.4 -3.5 6.5 -1.6 4.1
Millions of constant (1996) dollarsU.S. export valueCanada . . . . . . . . . . . . . . . . . . . . . . . . . 2,357.9 2,550.7 2,695.8 4,898.0 5,130.8 5,380.4 5,673.4 5,811.5Mexico . . . . . . . . . . . . . . . . . . . . . . . . . 1,523.7 2,769.2 3,267.7 2,947.7 3,330.8 4,116.9 3,849.5 4,797.9All other . . . . . . . . . . . . . . . . . . . . . . . . 35,855.2 44,454.5 46,625.1 43,665.7 40,725.2 42,492.7 40,677.0 43,159.2
Total . . . . . . . . . . . . . . . . . . . . . . . . . 39,736.7 49,774.4 52,588.5 51,511.4 49,186.8 51,989.9 50,199.9 53,768.6
Percent
Canada/Total . . . . . . . . . . . . . . . . . . . . . 5.9 5.1 5.1 9.5 10.4 10.4 11.3 10.8Mexico/Total . . . . . . . . . . . . . . . . . . . . . . 3.8 5.6 6.2 5.7 6.8 7.9 7.7 8.9U.S. export growthCanada . . . . . . . . . . . . . . . . . . . . . . . . . — 8.2 5.7 81.7 4.8 4.9 5.5 2.4Mexico . . . . . . . . . . . . . . . . . . . . . . . . . — 81.8 18.0 -9.8 13.0 23.6 -6.5 24.6All other . . . . . . . . . . . . . . . . . . . . . . . . — 24.0 4.9 -6.4 -6.7 4.3 -4.3 6.1
Total . . . . . . . . . . . . . . . . . . . . . . . . . . — 25.3 5.7 -2.1 -4.5 5.7 -3.4 7.1
See footnote at end of table.
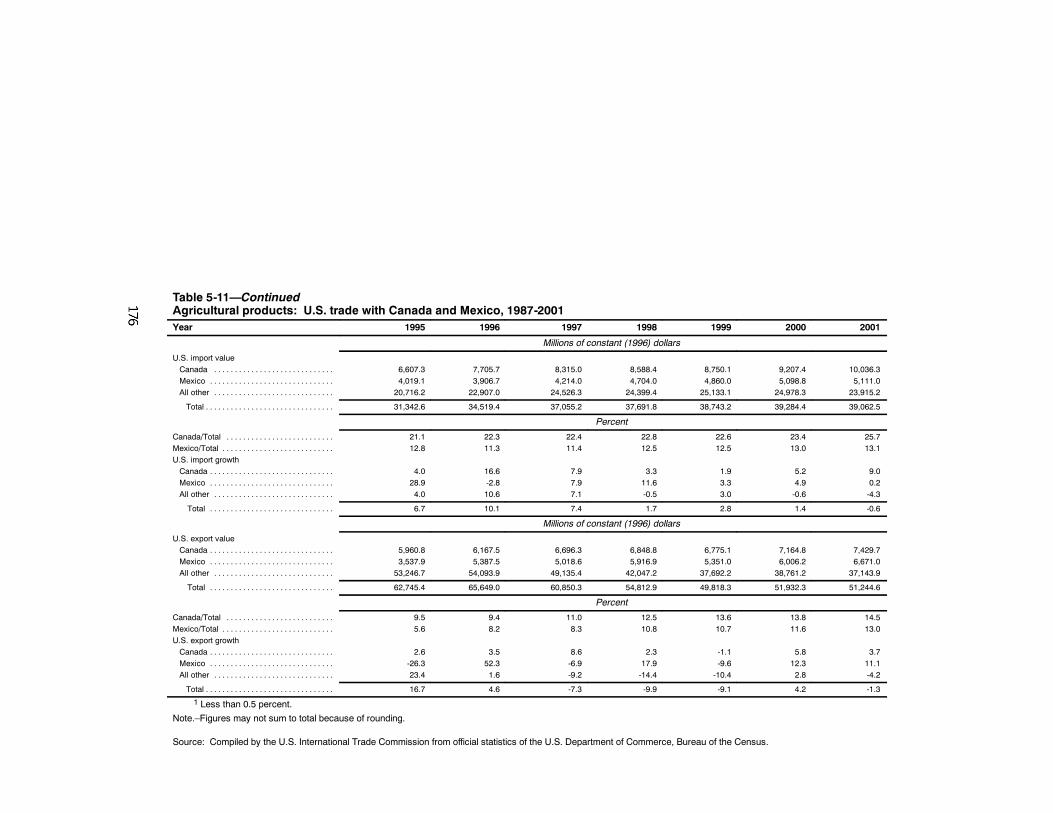
Table 5-11—ContinuedAgricultural products: U.S. trade with Canada and Mexico, 1987-2001Year 1995 1996 1997 1998 1999 2000 2001
Millions of constant (1996) dollars
U.S. import valueCanada . . . . . . . . . . . . . . . . . . . . . . . . . . . . . 6,607.3 7,705.7 8,315.0 8,588.4 8,750.1 9,207.4 10,036.3Mexico . . . . . . . . . . . . . . . . . . . . . . . . . . . . . . 4,019.1 3,906.7 4,214.0 4,704.0 4,860.0 5,098.8 5,111.0All other . . . . . . . . . . . . . . . . . . . . . . . . . . . . . 20,716.2 22,907.0 24,526.3 24,399.4 25,133.1 24,978.3 23,915.2
Total . . . . . . . . . . . . . . . . . . . . . . . . . . . . . . . 31,342.6 34,519.4 37,055.2 37,691.8 38,743.2 39,284.4 39,062.5
Percent
Canada/Total . . . . . . . . . . . . . . . . . . . . . . . . . . 21.1 22.3 22.4 22.8 22.6 23.4 25.7Mexico/Total . . . . . . . . . . . . . . . . . . . . . . . . . . . 12.8 11.3 11.4 12.5 12.5 13.0 13.1U.S. import growthCanada . . . . . . . . . . . . . . . . . . . . . . . . . . . . . . 4.0 16.6 7.9 3.3 1.9 5.2 9.0Mexico . . . . . . . . . . . . . . . . . . . . . . . . . . . . . . 28.9 -2.8 7.9 11.6 3.3 4.9 0.2All other . . . . . . . . . . . . . . . . . . . . . . . . . . . . . 4.0 10.6 7.1 -0.5 3.0 -0.6 -4.3
Total . . . . . . . . . . . . . . . . . . . . . . . . . . . . . . 6.7 10.1 7.4 1.7 2.8 1.4 -0.6
Millions of constant (1996) dollars
U.S. export valueCanada . . . . . . . . . . . . . . . . . . . . . . . . . . . . . . 5,960.8 6,167.5 6,696.3 6,848.8 6,775.1 7,164.8 7,429.7Mexico . . . . . . . . . . . . . . . . . . . . . . . . . . . . . . 3,537.9 5,387.5 5,018.6 5,916.9 5,351.0 6,006.2 6,671.0All other . . . . . . . . . . . . . . . . . . . . . . . . . . . . . 53,246.7 54,093.9 49,135.4 42,047.2 37,692.2 38,761.2 37,143.9
Total . . . . . . . . . . . . . . . . . . . . . . . . . . . . . . 62,745.4 65,649.0 60,850.3 54,812.9 49,818.3 51,932.3 51,244.6
Percent
Canada/Total . . . . . . . . . . . . . . . . . . . . . . . . . . 9.5 9.4 11.0 12.5 13.6 13.8 14.5Mexico/Total . . . . . . . . . . . . . . . . . . . . . . . . . . . 5.6 8.2 8.3 10.8 10.7 11.6 13.0U.S. export growthCanada . . . . . . . . . . . . . . . . . . . . . . . . . . . . . . 2.6 3.5 8.6 2.3 -1.1 5.8 3.7Mexico . . . . . . . . . . . . . . . . . . . . . . . . . . . . . . -26.3 52.3 -6.9 17.9 -9.6 12.3 11.1All other . . . . . . . . . . . . . . . . . . . . . . . . . . . . . 23.4 1.6 -9.2 -14.4 -10.4 2.8 -4.2
Total . . . . . . . . . . . . . . . . . . . . . . . . . . . . . . . 16.7 4.6 -7.3 -9.9 -9.1 4.2 -1.3
1 Less than 0.5 percent.
Note.–Figures may not sum to total because of rounding.
Source: Compiled by the U.S. International Trade Commission from official statistics of the U.S. Department of Commerce, Bureau of the Census.
177
NAFTAU.S. agricultural trade with its NAFTA partners has grown rapidly. U.S.
exports to and imports from its NAFTA partners increased by 48.1 percent and66.6 percent, respectively, during 1993-2001 (table 5-11). The share of bothU.S. agricultural exports to and imports from NAFTA partners continues togrow, as might be expected from preferential access to each other’s markets.U.S. agricultural imports from Canada grew from $3.4 billion in 1987 to$10.0 billion in 2001, while those from Mexico grew from $2.5 billion to $5.1billion during the same period. U.S. agricultural exports to Canada during thisperiod grew from $2.4 billion to $7.4 billion, and those to Mexico rose from$1.5 billion to $6.8 billion. The value of Canadian and Mexican agriculturalexports as shares of total U.S. imports grew from 12.3 percent to 25.7 percent,and from 8.9 percent to 13.1 percent, respectively, while the shares of U.S.agricultural exports accounted for by Canadian and Mexican agriculturalimports rose from 5.9 percent to 15.6 percent, and from 3.8 percent to 13.0percent, respectively.
Although NAFTA contributed to the growth in trade between the 3 NAFTApartners, much of this growth might have occurred without NAFTA as a resultof unusual weather conditions, population growth, changes in exchange rates,and macroeconomic performance. Furthermore, many of the concernsexpressed prior to the agreement about the loss of agricultural employment andenvironmental degradation never materialized. A USDA study showed that formost commodities, NAFTA’s influence is relatively small, generating only asmall increase in the export or import of a particular commodity with eitherCanada or Mexico. For a handful of commodities, NAFTA has had a muchlarger impact, with an increase of trade volume of 15 percent or more that isdirectly attributable to the agreement. This is particularly true for commoditieswhose trade was severely restricted prior to NAFTA. U.S. rice exports toMexico have more than doubled since NAFTA with the reduction of tariffs,while U.S. cotton exports to Mexico and Canada have tripled. U.S. pear andapple exports to Mexico have increased by at least 15 percent. Imports of sugarfrom Mexico have grown considerably as the sugar quota was liberalized, andCanadian potato imports have been boosted by U.S. tariff reductions.73
NAFTA’s agricultural component comprises three separate agreements: theoriginal U.S.-Canada FTA, a U.S.-Mexico component, and a Canada-Mexicocomponent. Some agricultural provisions, including rules on sanitary andphytosanitary provisions, are trilateral. Under NAFTA, most quantitativerestrictions on agricultural trade between the United States and Mexico wereeliminated. Many tariffs were eliminated immediately, with others scheduled tobe phased out over periods of 5 to 15 years. By 2008, all agriculturalprovisions will be implemented, but most became effective by January 1, 2003.
73 Effects of North American Free Trade Agreement on Agriculture and the RuralEconomy, Agriculture and Trade Reports, USDA, Economic Research Service,Publication WRS--02--01, July 2002.
178
The agricultural provisions of the U.S.-Canada FTA were incorporated intoNAFTA. Under these provisions, all tariffs affecting agricultural tradebetween the United States and Canada, with a few exceptions for itemscovered by Uruguay Round tariff-rate quotas (dairy, poultry, eggs, peanutbutter, and sugar products), were removed on January 1, 1998. Mexico andCanada reached a separate bilateral NAFTA agreement on market access foragricultural products. The Mexican-Canadian agreement eliminated mosttariffs either immediately or over 5, 10, or 15 years. Tariffs and TRQsbetween the two countries affecting trade in dairy, poultry, eggs and sugarare also maintained.
Uruguay RoundDuring the Uruguay Round, the negotiating parties agreed to convert all
quantitative restrictions to bound tariffs,74 a process known as ‘tariffication.’The conversion of NTBs (which in addition to quotas included some importprohibitions and discretionary import licensing) to bound tariffs was a keyachievement of the Uruguay Round.
Developed countries agreed to reduce all agricultural tariffs, includingthose resulting from tariffication from their base-period rates,75 by a total of 36percent, with a minimum cut of 15 percent for each tariff. The cuts were totake place in equal installments over 6 years, beginning with the first cut in1995. Developing countries are bound to cut tariffs an average of 24 percentover 10 years. Least-developed countries were not required to reduce theirtariffs. Tariff-rate quotas were established for products previously protected byNTBs with relatively low in-quota tariffs up to a minimum access level.Although the Agriculture Agreement began the process of reducing agriculturaltariffs, protection for agricultural commodities continues to stand out as amajor distorting feature of international trade. For manufactured goods, theindustrial countries’ import-weighted average tariff has been reduced fromabout 40 percent to under 4 percent since 1949; for agricultural goods, incontrast, the simple average for industrial countries’ post-Uruguay Roundbound tariffs is estimated to be 45 percent.76
Some of the key accomplishments of the Uruguay Round were concessionsand commitments from members regarding market access, domestic support
74 Tariffs are considered legally “bound” within GATT/WTO when a country agreesnot to raise them above a certain level, subject to a penalty.
75 For tariffs that were already bound, the base was the current bound rate; forexisting but unbound tariffs, the base was the 1986 tariff rate; and for duties that resultedfrom tariffication of NTBs, the base was the level of protection provided by NTBs duringthe 1986--88 period.
76 John Wainio, Paul Gibson, and Daniel Whitley, “Options for Reducing Ag-ricultural Tariffs,” Background for Agricultural Policy Reform in the WTO: The RoadAhead, USDA, Economic Research Service, 2001, ERS--E01--001.
179
and export subsidies, and the Agreement on Sanitary and PhytosanitaryMeasures. Overall, the results of the negotiations provide a framework forthe long-term reform of agricultural trade and domestic policies.
Views of Interested Parties
Blue Diamond Growers77
Blue Diamond Growers is a nonprofit farmer-owned marketing cooperativethat markets almonds, hazelnuts, macadamia nuts, and pistachios for itsmembers. The almonds are grown exclusively in California and are the largesttree crop in the State. Almonds are the largest valued agricultural export fromCalifornia. Over 75 percent of the world’s supply of almonds is produced inCalifornia.
Tokyo Round and Uruguay RoundBlue Diamond Growers (BDG), and almonds in general, benefitted
significantly from the Tokyo and Uruguay Rounds. These agreements openedmarkets for almonds worldwide. As a result of these two agreements, U.S.almond exports increased by 25 percent to Europe, 1,100 percent to EasternEurope, 300 percent to the Middle East, and 200 percent to Asia during1996-2002.
U.S.-Israel Free Trade AgreementBDG, and almonds in general, benefitted from the United States-Israel Free
Trade Agreement until the agreement was renegotiated in 1995. U.S. almondexports were adversely affected by the 1995 changes which increased duties onU.S. exports of almonds to Israel by a factor of four thereby closing the marketfor U.S. exports. In 1997, a TRQ was applied which allowed limited access ofalmonds to Israel, but was too restrictive to provide meaningful amounts oftrade. BDG believes that if all barriers to trade with Israel were removed,almond exports to Israel would grow from about $10 million in 2002 to about$25 million within five years.
U.S.-Canada Free Trade AgreementBDG, and almonds in general, benefitted significantly from the
U.S.-Canada Free Trade Agreement which enhanced and stabilized marketaccess. The value of U.S. almond exports to Canada grew by 90 percent during1996-2002 reaching $37 million.
77 Susan Brauner, Director of Public Affairs, Blue Diamond Growers, writtensubmission to the Commission, Mar. 27, 2003.
180
NAFTABDG, and almonds in general, benefitted significantly from NAFTA
because it enhanced and stabilized market access. The value of U.S. almondexports to Mexico grew by about 300 percent during 1996-2002, reachingabout $11 million.
Florida Citrus Mutual78
Florida Citrus Mutual (FCM) is a voluntary cooperative association whoseactive membership consists of more than 11,000 Florida growers of citrus forprocessing and fresh consumption. FCM accounts for as much as 80 percent ofall oranges grown in the United States for processing into juice and other citrusproducts. The 6-year staged reduction of U.S. tariffs on orange juice fromWTO-member countries under the URA, and the 15-year staged elimination ofthe U.S. tariff and tariff rate quota on orange juice from Mexico under NAFTAencouraged under-priced imports, which contributed directly to the erosion ofU.S. processing orange prices and grower earnings. FCM believes that thisdamage occurred without any counterbalancing positive effects on U.S. orangejuice exports.
Uruguay RoundThe URA has increased the inflow of under-priced Brazilian orange juice
into the U.S. market with severe negative consequences for the U.S. citrusindustry. Brazil, the world’s largest orange juice producer, was the primarybeneficiary of the United States’ URA commitment to reduce orange juicetariffs by 15 percent. These staged tariff reductions led to the plunging importunit value of Brazilian juice. In 2002, the average value per liter of importsfrom Brazil was 31 percent less than the average during the 5 years prior toURA implementation (1990-1994).
NAFTANAFTA has adversely affected U.S. orange growers by increasing Mexico’s
exports of orange juice to the United States. The United States has committedto a 15 year phase-out schedule for U.S. tariffs on Mexican orange juice. TheUnited States is Mexico’s largest export market for orange juice, and Mexicohas the ability to divert fruit from fresh domestic consumption into orangejuice processing. U.S. imports from Mexico have not risen as rapidly asexpected as a result of NAFTA, primarily owing to droughts and citrus diseasesin Mexico as well as the strong Mexican peso and heavy competition fromBrazil and CBERA-eligible orange juice. However, U.S. imports of frozen
78 Andrew Lavigne, Executive Vice President and CEO, Florida Citrus Mutual andMatthew T. McGrath, Barnes, Richardson & Colburn, on behalf of Florida CitrusMutual, written submission to the Commission, Mar. 31, 2003.
181
concentrated orange juice from Mexico have exceeded the NAFTA TRQ inevery year, except 2001. The primary effect of Mexican imports has been toerode U.S. prices. In 2002, the average price from Mexico was 25 percentless than the average during the 5 years prior to NAFTA implementation(1989-1993).
Florida Tomato Exchange79
The Florida Tomato Exchange (FTE) represents a substantial majority ofthe fresh tomatoes produced in the state of Florida.
During the winter months Florida produces most of the tomatoes growncommercially in the United States. The FTE supports free trade and openmarkets, but only provided such trade is fair. The growers represented by FTEare not subsidized, do not receive price supports, or deficiency payments, loanguarantees, or export credit assistance.
NAFTAMany years prior to passage of NAFTA, FTE presented statements to
Congress, USTR, and USITC that tomatoes were an import-sensitivecommodity and, without meaningful safeguard provisions regarding tomatoimports from Mexico, Florida’s tomato growers would be substantially harmed.NTE’s recommendations for safeguard provisions were not adopted, but ratherother “traditional” safeguard provisions were used. After NAFTA was enactedin 1994, Mexico flooded the U.S. market with fresh tomatoes. When NTEattempted to use the NAFTA safeguard provisions that were intended solely toassist Florida’s tomato and pepper growers, they were unsuccessful. Estimatesof the harm to NTE’s growers totaled approximately $125 million per winterseason, and over $1 billion to date. A major tomato packing house in Floridaclosed its door. The industry estimates that upwards of 10,000 workers inFlorida have lost their jobs as a direct result of NAFTA. The NTE filed anantidumping suit, and in 1995 the U.S. Department of Commerce preliminarilyfound that Mexican producer-exporters dumped tomatoes in the U.S. market. Asuspension agreement was negotiated and a second suspension agreement wasnegotiated by Commerce in December 2002. Although the NAFTA packageincluded transitional assistance for workers displaced by NAFTA, the monetaryand work assistance were deficient and many or most workers did not completethis training and others who followed and would have been eligible, did noteven try. The only relief that was useful to the industry was the long-standingantidumping statute.
79 Reginald L. Brown, Executive Vice President, Florida Tomato Exchange, writtensubmission to the Commission, Feb. 11, 2003.
182
National Milk Producers Federation and U.S. Dairy ExportCouncil80
The National Milk Producers Federation (NMPF) is a national farmcommodity organization that represents dairy farmers. The U.S. Dairy ExportCouncil (USDEC) is a non-profit organization that represents the export tradeinterests of U.S. milk producers, dairy cooperatives, proprietary processors,export traders, and industry suppliers.
Tokyo RoundThe Tokyo Round had only “marginal impact on global agricultural trade”
including dairy products. “Unlike the Uruguay Round, which succeeded it, theTokyo Round left most non-tariff trade barriers, export subsidies, and domesticsupport programs virtually untouched.” Tariffs and other import barriers werenegotiated on the basis of a request/offer approach, which resulted in many ofthe most sensitive products being subjected to minimal access improvements orbeing excluded from the negotiations altogether. The Tokyo Round also led topositive agreements, including the International Dairy Agreement and thecheese quota.
The International Dairy Agreement provided for minimum export prices forsome key dairy products in an attempt to bolster world prices although withinfour years of implementation, the EU developed a substantial domestic dairysurplus and began to export butter at below the minimum agreed prices. Inreaction, the United States withdrew from the Agreement.
“The Tokyo Round agreement on U.S. cheese import quotas helped shieldthe industry from heavily subsidized European dairy imports” but also resultedin higher cheese imports because the United States established quotas aboveprevious import levels. Prior to this agreement, cheeses valued below certainfixed prices were permitted to enter the United States only with an importlicense, which allowed the government to restrict volumes below levels thatwould undermine the dairy price-support program. The Tokyo Roundinstitutionalized the large, subsidized dairy trade from the EU and consequentlya distorted world dairy trade situation overall.
The U.S.-Canada Free Trade AgreementAlthough the U.S.-Canada Free Trade Agreement (CFTA) phased out most
import restrictions and agricultural tariffs over a ten-year period, dairy wasexcluded from these commitments and U.S. dairy exporters have virtually noaccess to the Canadian market. Canada and the United States agreed tomaintain import quotas on dairy and certain other products.
80 Peter Vitaliano, Ph.D., Vice President, Economic Policy and Market Research,National Milk Producers Federation, written submission to the Commission, Mar. 31,2003.
183
NAFTA“NAFTA has had a positive qualitative and quantitative impact on U.S.
dairy producers and processors.” Under NAFTA, all non-tariff barriers toagricultural trade between the United States and Mexico were eliminated, andmost tariffs were eliminated over a ten-year period, including those applying todairy products. Unlike CFTA, NAFTA provides for the phased elimination ofall dairy tariffs between the United States and Mexico. Stringent rules of originwere written into NAFTA in order to ensure that the benefits of preferentialaccess would only accrue to those items produced in North America. Tariffs onall dairy products reduce to zero over a ten-year phase out period, except onskim milk powder exported from the United States to Mexico, which will beeliminated over 15 years.
U.S.-Israel Free Trade AgreementThe U.S.-Israel FTA “has not been beneficial to the U.S. dairy industry.”
Uruguay RoundThe Uruguay Round Agreements (URA) “achieved many of the objectives
for improving disciplines for global agricultural trade that could not beachieved in previous GATT negotiations.” The URA established internationaldiscipline that eased future negotiations although the United States paid aheavy price to accomplish the agreement in the form of tariff disparities amongcountries. “Perhaps the most significant accomplishment of the UR marketaccess agreement in agriculture was the conversion of all non-tariff measuresinto tariffs” including U.S. Section 22 dairy import quotas, EU variable importlevies, and the Canadian and Japanese import licensing systems.
The URA also required countries to reduce agricultural export subsidies by21 percent in volume terms and 36 percent in budgetary outlays whichprimarily affected the EU which, even after the agreement, continues tomaintain about 72 percent of world dairy export subsidies. The export subsidiescommitment left a huge competitive advantage with the EU and helped thembuild a market in the United States at the expense of domestically producedcheese, butter, and milk protein powders.
Further, the URA required all countries to establish ceilings for the amountof support afforded producers through internal support mechanisms. Theagreement left the EU with a “huge competitive advantage” that has “harmedthe U.S. dairy industry.” “On the other hand, expenditures in programs such asthe de minimis clause as well as the green box have assisted the [U.S.] dairyindustry as well as the U.S. agriculture overall.”
184
The Ranchers-Cattlemen Action Legal Fund-UnitedStockgrowers of America81
The Ranchers-Cattlemen Action Legal Fund - United Stockgrowers ofAmerica (R-CALF USA) is a non-profit association that represents thousandsof U.S. cattle producers on issues concerning national and international tradeand marketing. R-CALF USA’s membership consists primarily of cow-calfoperators, cattle backgrounders, and feedlot owners. Its members are located in42 states, and the organization has over 30 local and state cattle associationaffiliates.
U.S.-Canada FTA and NAFTAFor live cattle, there was a significant increase in imports from Canada.
Prior to the USCFTA, imports of Canadian cattle into the United Statesremained flat and averaged 368,000 head per year from 1978 to 1988. In 1989,U.S. imports began a generally strong upward trend with imports during thepast five years averaging over 1,160,000 head annually. Live cattle importsfrom Mexico, on the other hand, have not increased. For the five years prior toNAFTA, imports from Mexico averaged 1,089,379 head annually, but for themost recent five year period averaged only about 938,177 annually. U.S.exports of live cattle to Canada are restricted, but a post-NAFTA agreement,the Northwest Pilot Program, has led to increased exports when certain sanitaryconditions are met. U.S. shipments of live cattle to Canada grew from 40,000head in 1996 to 349,536 head in 2000. U.S. exports of live cattle to Mexicohave generally increased since NAFTA, from 62,683 head in 1994, to 363,887head in 2001.
U.S. imports of beef from Canada increased markedly following theUSCFTA, growing from 81,138 metric tons in 1990 to 335,163 metric tons in2000. During the same time period, U.S. exports of beef to Canada remainedflat, slipping from 90,892 in 1991 to 87,480 metric tons in 2000. U.S. beefexports to Mexico have grown significantly following NAFTA. Since 1995,U.S. exports have risen steadily with export volumes some 2.5 times greaterthan in the years prior to NAFTA, to about 178,749 metric tons, and worthsome $531 million. U.S. beef imports from Mexico have increasedconsiderably since NAFTA, growing from 591,340 kilograms in 1994 to3,412,582 kilograms in 2001, worth about $15 million.
Prior to the USCFTA and NAFTA, U.S. tariffs on imports of Canadian andMexican beef limited access into the U.S. market. However, the U.S. MeatImport Law, which was replaced by a tariff rate quota during the UruguayRound, was even more important in controlling the amount of imported beefentering the U.S. market.
81 Leo R. McDonnell, Jr., President, R--CALF USA, written submission to theCommission, Feb. 14, 2003.
185
Tokyo RoundPrior to the completion of the Tokyo Round, Japan controlled imports of
beef through quotas. During the Tokyo Round, the United States sought alarger allotment within Japan’s quota for higher quality grain-fed beef. Anagreement was reached between the United States and Japan in 1978 and led toincreased access for U.S. beef in the Japanese market.
U.S. Israel Free Trade Area AgreementIn 1985, the United States and Israel signed an FTA calling for the phasing
out of tariffs by 1995. In 1996, the United States and Israel signed theAgreement on Trade in Agricultural Products (ATAP). The ATAP was set toexpire on Dec. 31, 2001. However, it was extended through 2002 with tariffsand tariff rate quotas maintained at 2001 levels. Despite the FTA, exports ofU.S. frozen beef to Israel were, as of 2001, subject to a TRQ of 8815 metrictons, and fresh and chilled U.S. beef was subject to a TRQ of 1,217 metrictons. In-quota imports of these products enter duty-free. U.S. beef exports toIsrael are small totaling only $203,000 in 2001, mostly frozen product. Animportant impediment to U.S. beef exports to Israel is the Israeli Kosher MeatImport Law of 1994, which bans the importation of any meat or meat productthat is not certified as kosher by Israel’s chief rabbinate.
Uruguay RoundThe Uruguay Round promoted U.S. exports of beef to Japan and Korea,
but not the EU. As part of the Uruguay Round, the United States and Japansigned the Beef-Citrus Agreement which phased out Japan’s import quota and25 percent tariff on beef. These were replaced with a 70 percent tariff in 1991,which was reduced to 60 percent in 1992 and 50 percent in 1993. The phasingout of Japan’s quota had a dramatic impact on U.S. exports of beef and offal toJapan, which rose by almost 90 percent by value from 1988 to 1990. Duringthis time, exports by volume rose by 50 percent. The Beef-Citrus Agreement,while not necessarily part of the formal Uruguay Round negotiations, wasnegotiated after the Uruguay Round began. Concessions made by Japan duringUruguay Round continue to benefit the U.S. beef industry. The United States isthe main beef exporter to Japan with 48 percent of Japan’s import market.
The Beef-Citrus Agreement between the United States and Japan served asa model for opening the Korean market to imports of U.S. beef. DuringUruguay Round negotiations, Korea and the United States reached agreementon global access to the Korean beef market. Under the Uruguay RoundAgreement on Agriculture, Korea agreed to increase its minimum imports ofbeef two-fold to 225,000 metric tons by 2000. Imports of beef by Korea wouldbe unrestricted as of 2001, but a tariff of 41.2 percent would be imposed onsuch imports, which would decrease to 40 percent in 2004. The U.S. beefindustry has benefitted from concessions made by Korea during UruguayRound negotiations. In 2001, U.S. exports to Korea constituted 57 percent ofKorea’s beef imports.

186
In contrast to Japan and Korea, the outcome of Uruguay Roundnegotiations with regard to cattle and beef with the EU has not been positivefor U.S. producers. Despite a finding of the WTO that the EU’s ban on theimportation of beef treated with growth promoting hormones violates the SPSAgreement, the EU continues to block shipments of most U.S. beef.Furthermore, while the EU made cuts in subsidies for the cattle and beefindustry as a result of the Uruguay Round, this sector retains stronggovernment support. The EU’s cattle producers remain heavily subsidized, andthe 2002 budget for the EU’s beef sector was approximately $8.2 billion, orabout 17 percent of the EU’s agricultural budget. As part of its Uruguay Roundcommitments, the EU agreed to reduce export subsidies for beef from 1.9billion ECUs in 1995 to 1.3 billion ECUs in 2000. This amounted to a 26percent cut in export subsidies for beef. According to the USDA, exportrefunds provided by the EU in 2000 for beef totaled $750 million. The U.S.live cattle industry, by contrast, receives little government support, and in 2000provided no beef export subsidies to producers.
Chemicals and Allied Products82
OverviewThe United States is one of the world’s largest producers of chemicals and
allied products, along with Japan and the EU. The value of U.S. shipments wasan estimated $623 billion83 in 2001, accounting for approximately 25 percentof the world total (table 5-12).84 In 2001, domestic shipments of basicchemicals85 and pharmaceuticals86 each accounted for approximately 18.0percent of total domestic chemical industry shipments.87 Other industrysubsectors with significant domestic production are the soaps, cleaningcompounds and toilet preparations subsector (9 percent) and the plastics andrubber products subsector (25 percent).88
Of the more than 2,500 companies producing chemicals in the UnitedStates, multinational firms, both U.S. and foreign-based, accounted for the
82 For the purposes of this investigation, chemicals and allied products comprise SICgroups 28 and 30.
83 Current dollars.84 “Finances: Industry Pulled Back Again,” Chemical & Engineering News, June 24,
2002, pp. 44--45.85 NAICS code 3251. Includes basic organic and inorganic chemicals, industrial
gases, dyes and pigments.86 NAICS code 3254.87 “Finances: Industry Pulled Back Again,” Chemical & Engineering News, June 24,
2002, p. 45.88 Ibid.
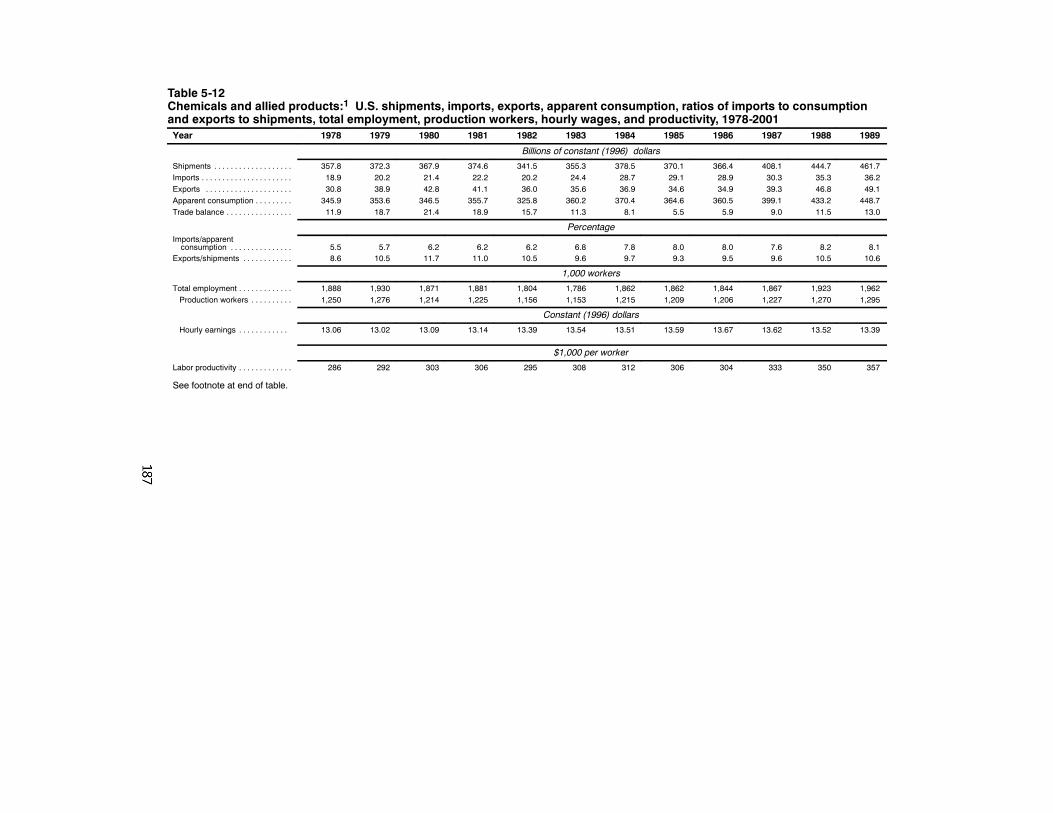
Table 5-12Chemicals and allied products:1 U.S. shipments, imports, exports, apparent consumption, ratios of imports to consumptionand exports to shipments, total employment, production workers, hourly wages, and productivity, 1978-2001Year 1978 1979 1980 1981 1982 1983 1984 1985 1986 1987 1988 1989
Billions of constant (1996) dollars
Shipments . . . . . . . . . . . . . . . . . . . 357.8 372.3 367.9 374.6 341.5 355.3 378.5 370.1 366.4 408.1 444.7 461.7Imports . . . . . . . . . . . . . . . . . . . . . . 18.9 20.2 21.4 22.2 20.2 24.4 28.7 29.1 28.9 30.3 35.3 36.2Exports . . . . . . . . . . . . . . . . . . . . . 30.8 38.9 42.8 41.1 36.0 35.6 36.9 34.6 34.9 39.3 46.8 49.1Apparent consumption . . . . . . . . . 345.9 353.6 346.5 355.7 325.8 360.2 370.4 364.6 360.5 399.1 433.2 448.7Trade balance . . . . . . . . . . . . . . . . 11.9 18.7 21.4 18.9 15.7 11.3 8.1 5.5 5.9 9.0 11.5 13.0
PercentageImports/apparentconsumption . . . . . . . . . . . . . . . 5.5 5.7 6.2 6.2 6.2 6.8 7.8 8.0 8.0 7.6 8.2 8.1
Exports/shipments . . . . . . . . . . . . 8.6 10.5 11.7 11.0 10.5 9.6 9.7 9.3 9.5 9.6 10.5 10.6
1,000 workers
Total employment . . . . . . . . . . . . . 1,888 1,930 1,871 1,881 1,804 1,786 1,862 1,862 1,844 1,867 1,923 1,962Production workers . . . . . . . . . . 1,250 1,276 1,214 1,225 1,156 1,153 1,215 1,209 1,206 1,227 1,270 1,295
Constant (1996) dollars
Hourly earnings . . . . . . . . . . . . 13.06 13.02 13.09 13.14 13.39 13.54 13.51 13.59 13.67 13.62 13.52 13.39
$1,000 per worker
Labor productivity . . . . . . . . . . . . . 286 292 303 306 295 308 312 306 304 333 350 357
See footnote at end of table.
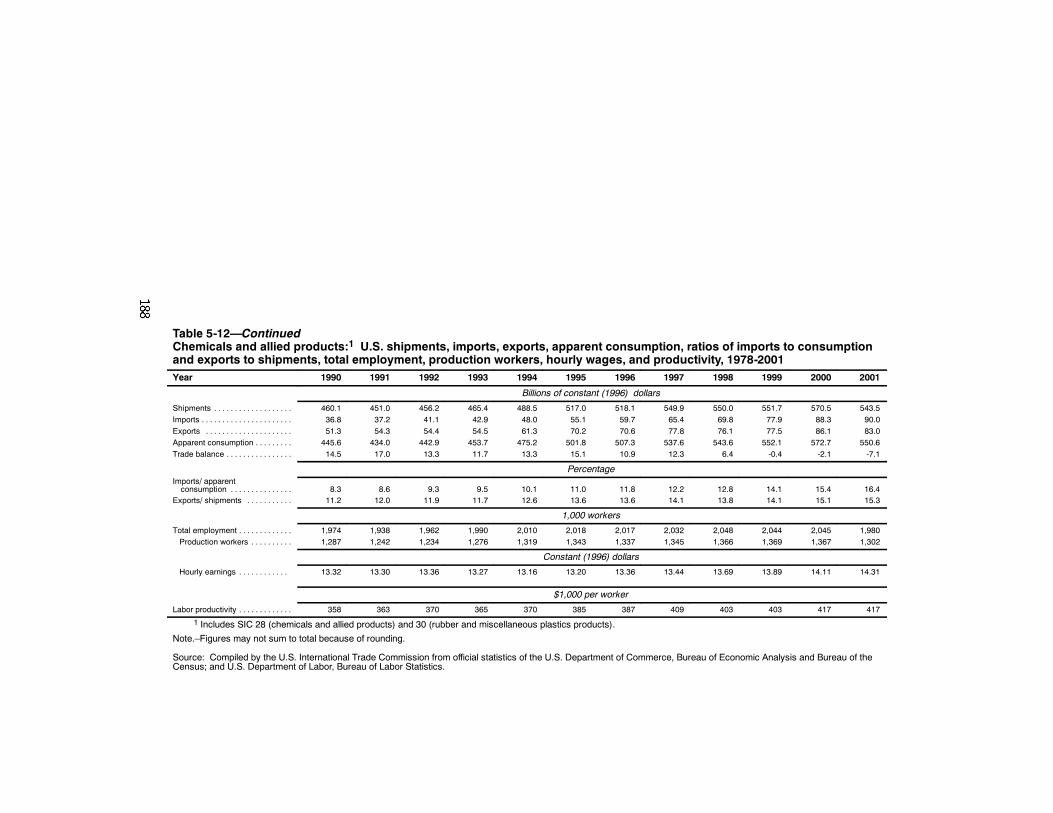
Table 5-12—ContinuedChemicals and allied products:1 U.S. shipments, imports, exports, apparent consumption, ratios of imports to consumptionand exports to shipments, total employment, production workers, hourly wages, and productivity, 1978-2001Year 1990 1991 1992 1993 1994 1995 1996 1997 1998 1999 2000 2001
Billions of constant (1996) dollars
Shipments . . . . . . . . . . . . . . . . . . . 460.1 451.0 456.2 465.4 488.5 517.0 518.1 549.9 550.0 551.7 570.5 543.5Imports . . . . . . . . . . . . . . . . . . . . . . 36.8 37.2 41.1 42.9 48.0 55.1 59.7 65.4 69.8 77.9 88.3 90.0Exports . . . . . . . . . . . . . . . . . . . . . 51.3 54.3 54.4 54.5 61.3 70.2 70.6 77.8 76.1 77.5 86.1 83.0Apparent consumption . . . . . . . . . 445.6 434.0 442.9 453.7 475.2 501.8 507.3 537.6 543.6 552.1 572.7 550.6Trade balance . . . . . . . . . . . . . . . . 14.5 17.0 13.3 11.7 13.3 15.1 10.9 12.3 6.4 -0.4 -2.1 -7.1
PercentageImports/ apparentconsumption . . . . . . . . . . . . . . . 8.3 8.6 9.3 9.5 10.1 11.0 11.8 12.2 12.8 14.1 15.4 16.4
Exports/ shipments . . . . . . . . . . . 11.2 12.0 11.9 11.7 12.6 13.6 13.6 14.1 13.8 14.1 15.1 15.3
1,000 workers
Total employment . . . . . . . . . . . . . 1,974 1,938 1,962 1,990 2,010 2,018 2,017 2,032 2,048 2,044 2,045 1,980Production workers . . . . . . . . . . 1,287 1,242 1,234 1,276 1,319 1,343 1,337 1,345 1,366 1,369 1,367 1,302
Constant (1996) dollars
Hourly earnings . . . . . . . . . . . . 13.32 13.30 13.36 13.27 13.16 13.20 13.36 13.44 13.69 13.89 14.11 14.31
$1,000 per worker
Labor productivity . . . . . . . . . . . . . 358 363 370 365 370 385 387 409 403 403 417 417
1 Includes SIC 28 (chemicals and allied products) and 30 (rubber and miscellaneous plastics products).
Note.–Figures may not sum to total because of rounding.
Source: Compiled by the U.S. International Trade Commission from official statistics of the U.S. Department of Commerce, Bureau of Economic Analysis and Bureau of theCensus; and U.S. Department of Labor, Bureau of Labor Statistics.
189
majority of production. These major producers are extremely diversified,producing a broad spectrum of products. Typically, they are also verticallyintegrated throughout most of the chemical production scheme, from theproduction of building-block chemicals through chemical intermediates tofinal products. Of the 50 largest chemical-producing firms worldwide, 17 areU.S.-based, and approximately 18 others have active chemical plants in theUnited States.89 Additionally, there are many specialized firms that produce avery limited range of products, and depend on larger diversified firms fortheir raw materials.
Chemical production90 closely parallels overall U.S. manufacturing outputover the period 1978-2001.91 Shipments of the chemicals and allied productsindustry increased from $358 billion (in constant 1996 dollars) in 1978 tonearly $571 billion in 2000. In 2001, the recession coupled with an excess ofinventoried materials caused shipments to decline to $543 billion.92 The trendsin apparent consumption closely echo the patterns of domestic production,although the ratio of imports to consumption increased from 5.5 percent in1978 to 16.4 percent in 2001. Apparent consumption increased from $346billion to $551 billion in 2001, an increase of more than 59 percent. U.S.production continued to supply the overwhelming majority of demand from thedomestic market for chemicals, plastics, pharmaceuticals, and rubber products.
U.S. exports of chemicals and allied products steadily increased along withU.S. production in recent years and accounted for 15.3 percent of U.S.shipments in 2001 as compared to 8.6 percent in 1998. The composition ofU.S. exports closely mirrors U.S. production. The industry is a major supplierof chemical raw materials and intermediates, as well as finished chemicalproducts to many foreign markets. Generally, the majority of U.S. chemicaltrade involves inter-company transfers or trade between associated firms. Assuch, the patterns of trade remains fairly steady from year-to-year.
Employment in the U.S. chemicals and allied products industry increasedslightly from 1.9 million workers in 1978 to 2.0 million in 2000, before
89 “Global Top 50,” Chemical & Engineering News, July 23, 2001, pp. 23--27.90 Industrial production indices published by the American Chemical Society in the
journal Chemical & Engineering News. “Facts & Figures,” Chemical & EngineeringNews, June 10, 1985, p. 27; “Facts & Figures,” Chemical & Engineering News, June 23,1997, p. 41; and “Facts & Figures,” Chemical & Engineering News, June 24, 2002, p.61.
91 Exceptions include instances that arose from rapidly increasing or decreasingfeedstock (and natural gas) prices or changes in the availability of feedstock materials,particularly during the late 1970s.
92 “At Last, Chemical Earnings Rise,” Chemical & Engineering News, Aug. 19,2002, p. 19.
190
decreasing by 3.2 percent in 2001.93 Labor productivity over the 1978-2001period increased considerably, as a result of technical improvements. Theindustry made considerable efforts several times during this period torestructure and re-engineer production pathways to remove bottlenecks thathad previously impaired productivity. Most of these efforts occurred as adirect result of unexpected stresses on the domestic industry.
U.S. chemical sector wages remain higher than the average for overall U.S.manufacturing, and increased during 1978-2001, from $13.06 per hour to$14.31 per hour. In 1982, workers in the chemicals and allied product sectorearned wages 17 percent higher than the average for overall U.S.manufacturing, and in 2001 chemicals and allied products industry workersearned wages more than 25 percent higher.94
The chemical sector has continuously worked to increase efficiencies ofproduction, remaining mindful of the painful rationalizations of the late 1970sand early 1980s. At the present time, the large multinational producers thatdominate the U.S. industry have significant competitive advantages due to theirsize and structure, which provide economies of scale and easier access tocapital.
According to various industry analysts,95 the U.S. chemical industry hasbecome less competitive in recent years. Cost differentials for major feedstockmaterials are the major disadvantage of the U.S. industry vis-à-vis petroleum-and gas-rich nations with developed and developing chemical industries,particularly those in East Asia and the Middle East. Expensive domesticenvironmental regulations also place an additional cost burden on U.S.producers, as well as producers in the EU and Japan.96 Rising worldwidefeedstock costs since 2000, declining world product demand, increasing foreignchemical production capacity, and the strong dollar have made it increasinglydifficult for U.S. chemical producers to compete in U.S. and foreign markets.The result has been a significant downward pressure on U.S. chemical industryearnings.97 This temporary industry weakness and the strength of the dollar hasmade the U.S. market more attractive to foreign producers.98
93 Employment data obtained from Bureau of Labor Statistics database; based onSIC code 28, chemicals and allied products, retrieved fromhttp://data.bls.gov/cgi--bin/dsrv on Aug. 14, 2002 and fromhttp://146.142.4.24/cgi--bin/surveymost, on May 24, 2001 and “Employment: Cuts Con-tinued Trend,” Chemical & Engineering News, June 24, 2002, pp. 66--67.
94 “Employment: Cuts Continued Trend,” Chemical & Engineering News, June 24,2002, p. 66--67.
95 “World Chemical Outlook,” Chemical & Engineering News, Dec. 17, 2001, p. 26.96 Ibid.97 Ibid., pp. 26--28.98 Ibid., pp. 26.
191
Domestic production capacity for primary petrochemicals expanded duringthe late 1990s to meet expected downstream growth. When downstream growthfell short of expectations, serious oversupplies of certain key chemical buildingblocks, particularly ethylene, resulted and some domestic firms were forced toshut down operating facilities that were becoming non-competitive.99Continued overseas capacity expansions in Saudi Arabia, China, and Singaporealso added significantly to world production capacity. As a result, U.S. industrycapacity utilization continued to decline through the end of 2001.
The pharmaceutical industry was the fastest growing chemicals subsectorduring 1978-2001. U.S. pharmaceutical shipments during 1978-2000 increased222 percent to $85.4 billion in 2000 before declining to $80.8 billion in2001.100 This growth resulted from several factors, including the passage ofmajor trade agreements, advancements in medical knowledge, and increasedstandards of living. For the United States, growth occurred in both domesticand overseas sales (through international trade or overseas subsidiaries).101Historically, the U.S. pharmaceutical industry has been composed of largemultinational companies headquartered in Europe, the United States, and Japan.In the last 20 years there have been multiple mergers of companiesheadquartered in different countries, i.e. the mergers of Glaxo (UnitedKingdom) and Smith Kline (United States).102 In addition, virtually allresearch-based pharmaceutical companies have production facilities locatedthroughout the world that manufacture active ingredients and/or finishedproducts. Generic producers have also become a major influence in thepharmaceutical industry both domestically and throughout the rest of the world.By increasing price competition, generic producers have had a significant effecton domestic and global pharmaceutical markets.
The pharmaceutical industry also has been subject to structural change,differing international regulations, and industrial policies that have affectedproduction, sales, trade and profits. In addition, the rapid increase in medicalresearch and development during this period has resulted in a number of newand very profitable products, which are protected by multi-year patents. Thisprofitability is enhanced by the fact that these products are not sold directly tothe consumer, but rather are prescribed by a physician, with insured patientspaying only a portion of the cost. Finally, the United States, relative to most
99 “2001 Chemical Industry Review,” Chemical & Engineering News, Dec. 24,2001, pp. 13--17.
100 In constant 1996 dollars, compiled from official statistics of the BEA.101 Data collected by the Pharmaceutical Research and Manufacturers of America
show that domestic sales and overseas sales by domestic companies (in current dollars)increased 908 percent from $16 billion in 1978 to $149 billion in 2000.
102 “Business Concentrates,” Chemical & Engineering News, Mar. 18, 2002, pp.12--13 and “Pfizer Captures Pharmacia,” Chemical & Engineering News, July 22, 2002,p. 9.
192
other countries, has very few direct price controls, giving companies theopportunity to charge higher prices.103 Under such circumstances, tariffreductions have not been shown to be a major influence on pharmaceuticalprices.
Effect of Trade Agreements on the SectorAlthough the 5 major trade agreements that are the subject of this
investigation have had a significant effect on this sector, trade patterns wereaffected to a far greater extent by other factors, both economic andtechnological in nature. Among these factors are continued product and processinnovations and development in both the industrial segment and thecommercial segment of the sector. Such innovations during the past 20 yearssignificantly improved U.S. competitiveness by allowing the chemicalproduction process to become much more efficient. Constant innovation in thesector which allowed for a broadening of product usage, particularly in the areaof plastics and other synthetic composite materials provided for growth throughreplacement of such “traditional” materials as metals and glass. Table 5-13presents trade issues addressed by the subject trade agreements that wererelevent to the sector.
Tokyo RoundDuring 1980-2001, total trade in the chemicals and allied products sector
increased at an average annual rate of 4.9 percent, exceeding the 3.5 percentoverall rate for all manufacturing sectors. Imports of sector products increasedat a rate exceeding 7.0 percent, reaching $90 billion in 2001. In contrast,exports increased at a rate of only 3.2 percent, reaching $83 billion in 2001,creating a sectoral trade deficit during 1999-2001 after maintaining a surplusthroughout 1978-98. Overall, the trade surplus reached its highest level ($21.4billion) in 1980, and fluctuated somewhat erratically downward during the restof 1981-2001. Much of the variation and fluctuation seen in both the importand export statistics for this period is derived from pricing changes for sectorgoods.104
The effect of the Tokyo Round on the U.S. chemical and allied productssector likely was less significant than other factors influencing the sector.Increased domestic industrial efficiencies resulting from the need to compete ina rapidly changing world chemical market, and technological innovationsthroughout the sector, particularly during the late 1980s and early 1990s, had amuch more pronounced effect on sector trade and output.
103 This environment is changing, as the government and group health companiesare developing policies to reduce drug prices.
104 This resulted from irregular changes in the cost of many of the industry sector’sprimary inputs, related to changes in the price of energy materials such as crudepetroleum and natural gas.
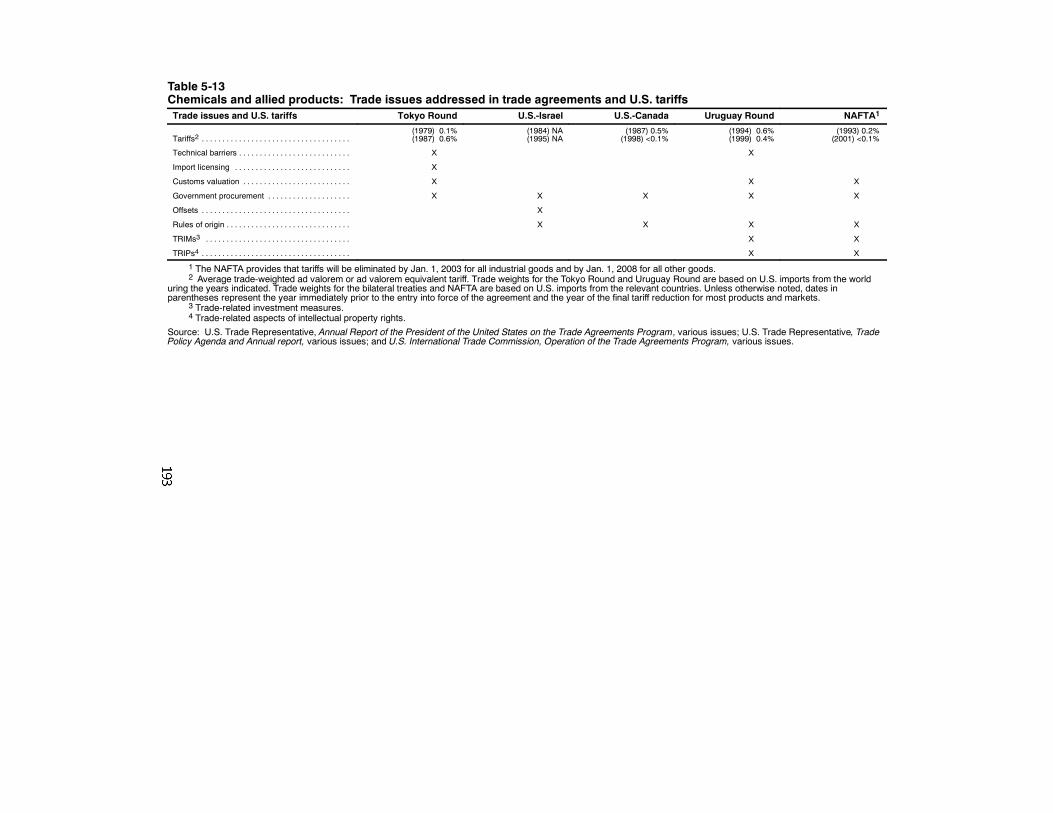
Table 5-13Chemicals and allied products: Trade issues addressed in trade agreements and U.S. tariffsTrade issues and U.S. tariffs Tokyo Round U.S.-Israel U.S.-Canada Uruguay Round NAFTA1
Tariffs2 . . . . . . . . . . . . . . . . . . . . . . . . . . . . . . . . . . . .(1979) 0.1%(1987) 0.6%
(1984) NA(1995) NA
(1987) 0.5%(1998) <0.1%
(1994) 0.6%(1999) 0.4%
(1993) 0.2%(2001) <0.1%
Technical barriers . . . . . . . . . . . . . . . . . . . . . . . . . . . X X
Import licensing . . . . . . . . . . . . . . . . . . . . . . . . . . . . X
Customs valuation . . . . . . . . . . . . . . . . . . . . . . . . . . X X X
Government procurement . . . . . . . . . . . . . . . . . . . . X X X X X
Offsets . . . . . . . . . . . . . . . . . . . . . . . . . . . . . . . . . . . . X
Rules of origin . . . . . . . . . . . . . . . . . . . . . . . . . . . . . . X X X X
TRIMs3 . . . . . . . . . . . . . . . . . . . . . . . . . . . . . . . . . . . X X
TRIPs4 . . . . . . . . . . . . . . . . . . . . . . . . . . . . . . . . . . . . X X
1 The NAFTA provides that tariffs will be eliminated by Jan. 1, 2003 for all industrial goods and by Jan. 1, 2008 for all other goods.2 Average trade-weighted ad valorem or ad valorem equivalent tariff. Trade weights for the Tokyo Round and Uruguay Round are based on U.S. imports from the world
uring the years indicated. Trade weights for the bilateral treaties and NAFTA are based on U.S. imports from the relevant countries. Unless otherwise noted, dates inparentheses represent the year immediately prior to the entry into force of the agreement and the year of the final tariff reduction for most products and markets.
3 Trade-related investment measures.4 Trade-related aspects of intellectual property rights.
Source: U.S. Trade Representative, Annual Report of the President of the United States on the Trade Agreements Program, various issues; U.S. Trade Representative, TradePolicy Agenda and Annual report, various issues; and U.S. International Trade Commission, Operation of the Trade Agreements Program, various issues.
194
U.S.-Israel FTA105
There was little or no impact on overall U.S. trade of chemicals and alliedproducts as a result of the U.S.-Israel FTA. Although total trade with Israel inthis sector increased at an average annual rate of 10.5 percent during1984-2001, exceeding the 5.9 percent rate for the overall sector, Israelaccounted for less than 0.9 percent of sector trade in 2001. Much of theincrease in trade resulted from growth in Israeli demand and significant growthin Israel’s chemical sector, particularly in pharmaceuticals. For example, during1989-2001, U.S. imports of pharmaceutical preparations106 increased from$479,000 to more than $502 million, accounting for almost one-half of the$1.1 billion of U.S. sectoral imports from Israel in 2001 (table 5-14).
The U.S.-Canada FTAThere was, at most, a modest impact on total U.S. trade of chemicals and
allied products as a result of the U.S.-Canada FTA. Total trade with Canada inthis sector increased at an average annual rate of 9.3 percent during 1987-2001,exceeding the 5.9 percent rate for the overall sector. U.S. sectoral imports fromCanada increased from $5.4 billion in 1987 to $20.8 billion in 2001,representing an average annual rate of growth of 10.1 percent, while sectoralU.S. exports to Canada increased at an average annual rate of 9.6 percent,reaching $18.7 billion in 2000, before declining to $17.6 billion in 2001 (table5-15). Although cross-border trade of plastics107 and industrial organicchemicals108 used by the chemical sector increased modestly, much of thegrowth in trade in the chemicals sector is due to increases in the unit values oftraded pharmaceuticals, among the fastest growing industries within the sector.
NAFTAThere was, at most, a modest impact on trade of chemicals and allied
products as a result of the NAFTA. U.S. sector trade with Canada and Mexicoincreased at an average annual rate of 9.3 percent growth during 1994-2000,before declining by 2.5 percent during 2000-2001. Total sector imports fromCanada and Mexico increased by 85.3 percent during 1994-2001 and total U.S.sector exports to Canada and Mexico increased by 53.0 percent. During theperiod, U.S. sectoral imports from sources other than Canada and Mexico roseby 88 percent, while U.S. sectoral exports to markets other than Canada andMexico increased by 29 percent suggesting a measurable positive effect onU.S. sector exports to Mexico.
105 The U.S.--Israel FTA was signed in 1985 and was fully implemented on Jan. 1,1995.
106 SIC classification 2834.107 SIC classification 2821.108 SIC classification 2869.
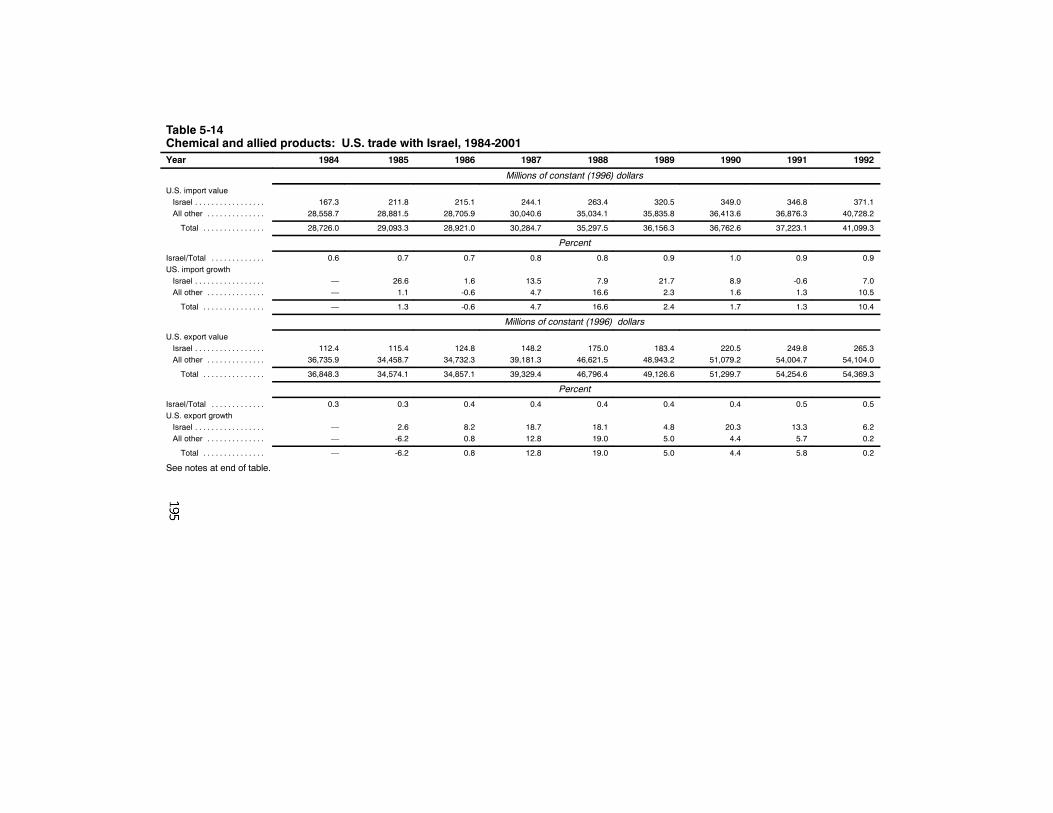
Table 5-14Chemical and allied products: U.S. trade with Israel, 1984-2001Year 1984 1985 1986 1987 1988 1989 1990 1991 1992
Millions of constant (1996) dollars
U.S. import valueIsrael . . . . . . . . . . . . . . . . . 167.3 211.8 215.1 244.1 263.4 320.5 349.0 346.8 371.1All other . . . . . . . . . . . . . . 28,558.7 28,881.5 28,705.9 30,040.6 35,034.1 35,835.8 36,413.6 36,876.3 40,728.2
Total . . . . . . . . . . . . . . . 28,726.0 29,093.3 28,921.0 30,284.7 35,297.5 36,156.3 36,762.6 37,223.1 41,099.3
Percent
Israel/Total . . . . . . . . . . . . . 0.6 0.7 0.7 0.8 0.8 0.9 1.0 0.9 0.9US. import growthIsrael . . . . . . . . . . . . . . . . . — 26.6 1.6 13.5 7.9 21.7 8.9 -0.6 7.0All other . . . . . . . . . . . . . . — 1.1 -0.6 4.7 16.6 2.3 1.6 1.3 10.5
Total . . . . . . . . . . . . . . . — 1.3 -0.6 4.7 16.6 2.4 1.7 1.3 10.4
Millions of constant (1996) dollars
U.S. export valueIsrael . . . . . . . . . . . . . . . . . 112.4 115.4 124.8 148.2 175.0 183.4 220.5 249.8 265.3All other . . . . . . . . . . . . . . 36,735.9 34,458.7 34,732.3 39,181.3 46,621.5 48,943.2 51,079.2 54,004.7 54,104.0
Total . . . . . . . . . . . . . . . 36,848.3 34,574.1 34,857.1 39,329.4 46,796.4 49,126.6 51,299.7 54,254.6 54,369.3
Percent
Israel/Total . . . . . . . . . . . . . 0.3 0.3 0.4 0.4 0.4 0.4 0.4 0.5 0.5U.S. export growthIsrael . . . . . . . . . . . . . . . . . — 2.6 8.2 18.7 18.1 4.8 20.3 13.3 6.2All other . . . . . . . . . . . . . . — -6.2 0.8 12.8 19.0 5.0 4.4 5.7 0.2
Total . . . . . . . . . . . . . . . — -6.2 0.8 12.8 19.0 5.0 4.4 5.8 0.2
See notes at end of table.
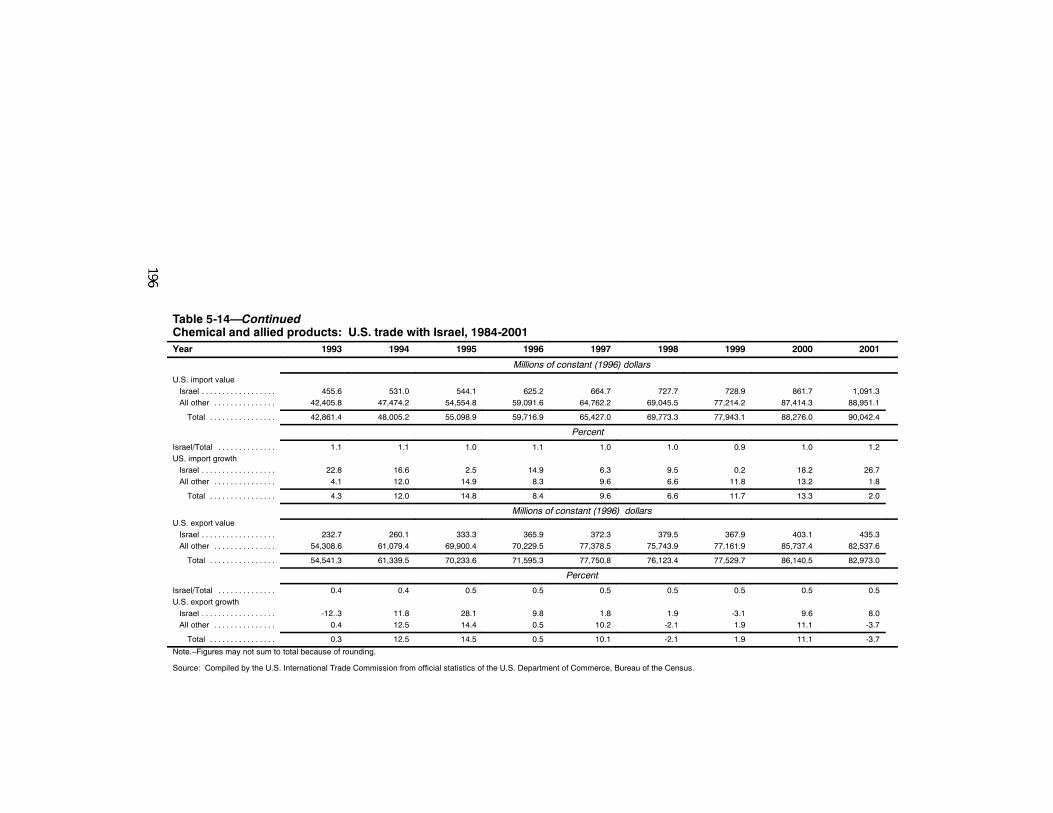
Table 5-14—ContinuedChemical and allied products: U.S. trade with Israel, 1984-2001Year 1993 1994 1995 1996 1997 1998 1999 2000 2001
Millions of constant (1996) dollars
U.S. import valueIsrael . . . . . . . . . . . . . . . . . . 455.6 531.0 544.1 625.2 664.7 727.7 728.9 861.7 1,091.3All other . . . . . . . . . . . . . . . 42,405.8 47,474.2 54,554.8 59,091.6 64,762.2 69,045.5 77,214.2 87,414.3 88,951.1
Total . . . . . . . . . . . . . . . . 42,861.4 48,005.2 55,098.9 59,716.9 65,427.0 69,773.3 77,943.1 88,276.0 90,042.4
Percent
Israel/Total . . . . . . . . . . . . . . 1.1 1.1 1.0 1.1 1.0 1.0 0.9 1.0 1.2US. import growthIsrael . . . . . . . . . . . . . . . . . . 22.8 16.6 2.5 14.9 6.3 9.5 0.2 18.2 26.7All other . . . . . . . . . . . . . . . 4.1 12.0 14.9 8.3 9.6 6.6 11.8 13.2 1.8
Total . . . . . . . . . . . . . . . . 4.3 12.0 14.8 8.4 9.6 6.6 11.7 13.3 2.0
Millions of constant (1996) dollarsU.S. export valueIsrael . . . . . . . . . . . . . . . . . . 232.7 260.1 333.3 365.9 372.3 379.5 367.9 403.1 435.3All other . . . . . . . . . . . . . . . 54,308.6 61,079.4 69,900.4 70,229.5 77,378.5 75,743.9 77,161.9 85,737.4 82,537.6
Total . . . . . . . . . . . . . . . . 54,541.3 61,339.5 70,233.6 71,595.3 77,750.8 76,123.4 77,529.7 86,140.5 82,973.0
Percent
Israel/Total . . . . . . . . . . . . . . 0.4 0.4 0.5 0.5 0.5 0.5 0.5 0.5 0.5U.S. export growthIsrael . . . . . . . . . . . . . . . . . . -12..3 11.8 28.1 9.8 1.8 1.9 -3.1 9.6 8.0All other . . . . . . . . . . . . . . . 0.4 12.5 14.4 0.5 10.2 -2.1 1.9 11.1 -3.7
Total . . . . . . . . . . . . . . . . 0.3 12.5 14.5 0.5 10.1 -2.1 1.9 11.1 -3.7
Note.–Figures may not sum to total because of rounding.
Source: Compiled by the U.S. International Trade Commission from official statistics of the U.S. Department of Commerce, Bureau of the Census.
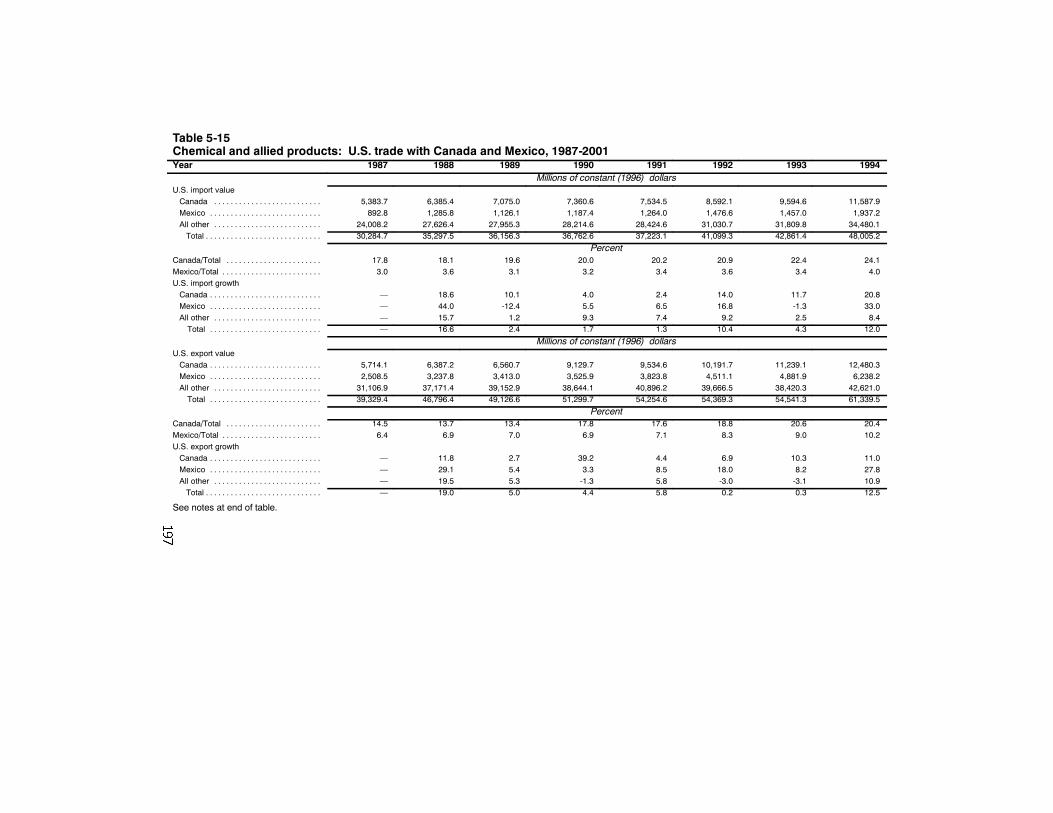
Table 5-15Chemical and allied products: U.S. trade with Canada and Mexico, 1987-2001Year 1987 1988 1989 1990 1991 1992 1993 1994
Millions of constant (1996) dollarsU.S. import valueCanada . . . . . . . . . . . . . . . . . . . . . . . . . . 5,383.7 6,385.4 7,075.0 7,360.6 7,534.5 8,592.1 9,594.6 11,587.9Mexico . . . . . . . . . . . . . . . . . . . . . . . . . . . 892.8 1,285.8 1,126.1 1,187.4 1,264.0 1,476.6 1,457.0 1,937.2All other . . . . . . . . . . . . . . . . . . . . . . . . . . 24,008.2 27,626.4 27,955.3 28,214.6 28,424.6 31,030.7 31,809.8 34,480.1Total . . . . . . . . . . . . . . . . . . . . . . . . . . . . 30,284.7 35,297.5 36,156.3 36,762.6 37,223.1 41,099.3 42,861.4 48,005.2
PercentCanada/Total . . . . . . . . . . . . . . . . . . . . . . . 17.8 18.1 19.6 20.0 20.2 20.9 22.4 24.1Mexico/Total . . . . . . . . . . . . . . . . . . . . . . . . 3.0 3.6 3.1 3.2 3.4 3.6 3.4 4.0U.S. import growthCanada . . . . . . . . . . . . . . . . . . . . . . . . . . . — 18.6 10.1 4.0 2.4 14.0 11.7 20.8Mexico . . . . . . . . . . . . . . . . . . . . . . . . . . . — 44.0 -12.4 5.5 6.5 16.8 -1.3 33.0All other . . . . . . . . . . . . . . . . . . . . . . . . . . — 15.7 1.2 9.3 7.4 9.2 2.5 8.4Total . . . . . . . . . . . . . . . . . . . . . . . . . . . — 16.6 2.4 1.7 1.3 10.4 4.3 12.0
Millions of constant (1996) dollarsU.S. export valueCanada . . . . . . . . . . . . . . . . . . . . . . . . . . . 5,714.1 6,387.2 6,560.7 9,129.7 9,534.6 10,191.7 11,239.1 12,480.3Mexico . . . . . . . . . . . . . . . . . . . . . . . . . . . 2,508.5 3,237.8 3,413.0 3,525.9 3,823.8 4,511.1 4,881.9 6,238.2All other . . . . . . . . . . . . . . . . . . . . . . . . . . 31,106.9 37,171.4 39,152.9 38,644.1 40,896.2 39,666.5 38,420.3 42,621.0Total . . . . . . . . . . . . . . . . . . . . . . . . . . . 39,329.4 46,796.4 49,126.6 51,299.7 54,254.6 54,369.3 54,541.3 61,339.5
PercentCanada/Total . . . . . . . . . . . . . . . . . . . . . . . 14.5 13.7 13.4 17.8 17.6 18.8 20.6 20.4Mexico/Total . . . . . . . . . . . . . . . . . . . . . . . . 6.4 6.9 7.0 6.9 7.1 8.3 9.0 10.2U.S. export growthCanada . . . . . . . . . . . . . . . . . . . . . . . . . . . — 11.8 2.7 39.2 4.4 6.9 10.3 11.0Mexico . . . . . . . . . . . . . . . . . . . . . . . . . . . — 29.1 5.4 3.3 8.5 18.0 8.2 27.8All other . . . . . . . . . . . . . . . . . . . . . . . . . . — 19.5 5.3 -1.3 5.8 -3.0 -3.1 10.9Total . . . . . . . . . . . . . . . . . . . . . . . . . . . . — 19.0 5.0 4.4 5.8 0.2 0.3 12.5
See notes at end of table.
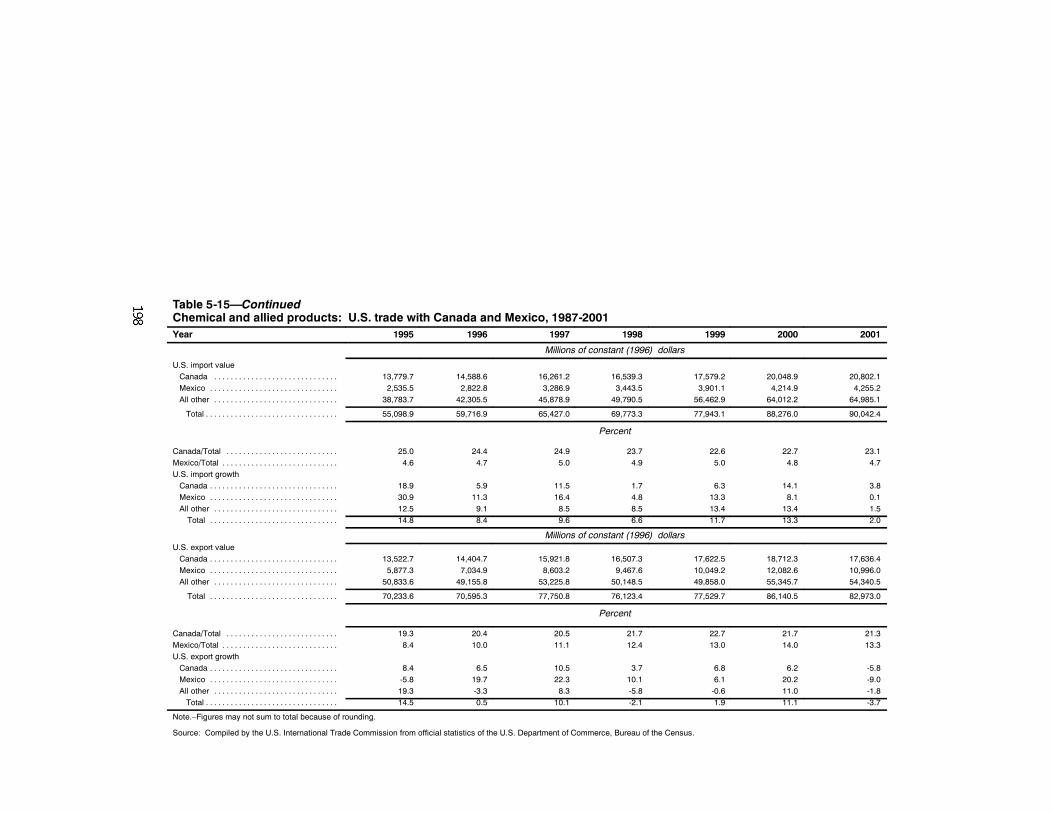
Table 5-15—ContinuedChemical and allied products: U.S. trade with Canada and Mexico, 1987-2001Year 1995 1996 1997 1998 1999 2000 2001
Millions of constant (1996) dollars
U.S. import valueCanada . . . . . . . . . . . . . . . . . . . . . . . . . . . . . . 13,779.7 14,588.6 16,261.2 16,539.3 17,579.2 20,048.9 20,802.1Mexico . . . . . . . . . . . . . . . . . . . . . . . . . . . . . . . 2,535.5 2,822.8 3,286.9 3,443.5 3,901.1 4,214.9 4,255.2All other . . . . . . . . . . . . . . . . . . . . . . . . . . . . . . 38,783.7 42,305.5 45,878.9 49,790.5 56,462.9 64,012.2 64,985.1
Total . . . . . . . . . . . . . . . . . . . . . . . . . . . . . . . . 55,098.9 59,716.9 65,427.0 69,773.3 77,943.1 88,276.0 90,042.4
Percent
Canada/Total . . . . . . . . . . . . . . . . . . . . . . . . . . . 25.0 24.4 24.9 23.7 22.6 22.7 23.1Mexico/Total . . . . . . . . . . . . . . . . . . . . . . . . . . . . 4.6 4.7 5.0 4.9 5.0 4.8 4.7U.S. import growthCanada . . . . . . . . . . . . . . . . . . . . . . . . . . . . . . . 18.9 5.9 11.5 1.7 6.3 14.1 3.8Mexico . . . . . . . . . . . . . . . . . . . . . . . . . . . . . . . 30.9 11.3 16.4 4.8 13.3 8.1 0.1All other . . . . . . . . . . . . . . . . . . . . . . . . . . . . . . 12.5 9.1 8.5 8.5 13.4 13.4 1.5Total . . . . . . . . . . . . . . . . . . . . . . . . . . . . . . . 14.8 8.4 9.6 6.6 11.7 13.3 2.0
Millions of constant (1996) dollarsU.S. export valueCanada . . . . . . . . . . . . . . . . . . . . . . . . . . . . . . . 13,522.7 14,404.7 15,921.8 16,507.3 17,622.5 18,712.3 17,636.4Mexico . . . . . . . . . . . . . . . . . . . . . . . . . . . . . . . 5,877.3 7,034.9 8,603.2 9,467.6 10,049.2 12,082.6 10,996.0All other . . . . . . . . . . . . . . . . . . . . . . . . . . . . . . 50,833.6 49,155.8 53,225.8 50,148.5 49,858.0 55,345.7 54,340.5
Total . . . . . . . . . . . . . . . . . . . . . . . . . . . . . . . 70,233.6 70,595.3 77,750.8 76,123.4 77,529.7 86,140.5 82,973.0
Percent
Canada/Total . . . . . . . . . . . . . . . . . . . . . . . . . . . 19.3 20.4 20.5 21.7 22.7 21.7 21.3Mexico/Total . . . . . . . . . . . . . . . . . . . . . . . . . . . . 8.4 10.0 11.1 12.4 13.0 14.0 13.3U.S. export growthCanada . . . . . . . . . . . . . . . . . . . . . . . . . . . . . . . 8.4 6.5 10.5 3.7 6.8 6.2 -5.8Mexico . . . . . . . . . . . . . . . . . . . . . . . . . . . . . . . -5.8 19.7 22.3 10.1 6.1 20.2 -9.0All other . . . . . . . . . . . . . . . . . . . . . . . . . . . . . . 19.3 -3.3 8.3 -5.8 -0.6 11.0 -1.8Total . . . . . . . . . . . . . . . . . . . . . . . . . . . . . . . . 14.5 0.5 10.1 -2.1 1.9 11.1 -3.7
Note.–Figures may not sum to total because of rounding.
Source: Compiled by the U.S. International Trade Commission from official statistics of the U.S. Department of Commerce, Bureau of the Census.
199
Uruguay RoundDuring 1995-2001, total U.S. trade in the chemicals and allied products
sector increased at an average annual rate of 5.6 percent, exceeding the3.9 percent rate of growth in the manufacturing sector. Import growth exceeded8.5 percent, reaching $90 billion in 2001, while export growth averaged3.0 percent, reaching $86.1 billion in 2000, before declining to $83 billion in2001. The sector trade balance began declining in 1995, and became negativefor the first time in 1999. The decline in the U.S. sector trade balance canlargely be attributed to changing international trade patterns, increasingcompetition from firms locating overseas, and the decreasing competitivenessof the U.S. industry.
However, there have been some significant effects of the URA on anindustry level within this sector. In particular, the U.S. pharmaceutical industrywas affected by the Uruguay Round Elimination of Duties on Pharmaceuticalsand the TRIPS Agreement. When the Uruguay Round Agreements (URA) wentinto effect on January 1, 1995, 17 countries (eventually increasing to 21)agreed to eliminate tariffs on approximately 7,000 finished and intermediatepharmaceutical products.109 The average pre-URA rates for pharmaceuticalproducts eliminated under the zero for zero110 agreement were 5.89 percent forthe EU, 4.73 percent for Japan, and 4.23 percent for the United States.111
Because the costs of developing new pharmaceuticals are substantial andthe enforcement of patent rights is an important element in recouping costs, theTRIPS agreement likely has had a positive influence on the growth of theindustry. In particular, the TRIPS agreement extends U.S. patents onpharmaceutical (and other) products, patented since the treaty was ratified,from 17 to 20 years.112
Additionally, during the period under consideration, some countries haveunilaterally introduced commercial policies to stimulate economicdevelopment. As chemical synthesis of pharmaceutical products is often amulti-step process, with different steps potentially taking place in different
109 They are currently listed in the Pharmaceutical Appendix to the HarmonizedTariff Schedules (HTS). Basically, the general (NTR) tariffs were eliminated on allfinished pharmaceutical products listed in chapter 30, and active ingredients listed inchapter 29 under the sub--headings 2936, 2937, 2939, and 2941. Background informationis found in USITC, inv. No. 332--402, Advice Concerning the Addition of CertainPharmaceutical Products and Chemical Intermediates to the Pharmaceutical Appendix tothe Harmonized Tariff Schedule of the United States, Apr. 1999.
110 See USITC, inv. No. 332--402, Advice Concerning the Addition of CertainPharmaceutical Products and Chemical Intermediates to the Pharmaceutical Appendix tothe Harmonized Tariff Schedule of the United States, Apr. 1999.
111 David Michels and Elizabeth Nesbitt, “The Uruguay Round Elimination ofDuties on Pharmaceuticals: Developments in the 2 Years Since Implementation,”Industry Trade and Technology Review, Oct. 1997, pp. 1--12.
112 Post--hearing submission of the Generic Pharmaceutical Association.
200
countries, the elimination of tariffs among participating countries shouldincrease the efficiency with which pharmaceutical goods are produced.However, beginning in the 1990s, Ireland introduced a regime of lowcorporate tax rates with the intention of attracting high-tech companies tomanufacture in Ireland. With this tax structure and companies’ use of transferpricing incentives, Ireland soon became a major producer and exporter ofpharmaceutical products.113 Irish exports of pharmaceutical products to theUnited States increased from $635 million in 1995 to almost $12 billion in2001.114
Views of Interested Parties
Generic Pharmaceutical Association115
The Generic Pharmaceutical Association (GPA) represents more than 140companies that manufacture and support the generic pharmaceutical industryand whose membership accounts for more than 90 percent of generic drugsdispensed in the United States.
GPA supports the need for both pharmaceutical innovation and thepreservation of intellectual property rights, as provided for in the tradenegotiations conducted over the last two decades. The association notes,however, that their membership is uniquely impacted by the agreements onintellectual property, and as a consequence, increased oversight is required toinsure that its interests are appropriately addressed.
Under the Uruguay Round, the TRIPS agreement established a patent termof 20 years, for products patented after June 7, 1995. This agreement obligedthe United States to lengthen patent terms from 17 years to 20 years, thereby,increasing the time during which the consumer is denied access to lower-pricedpharmaceuticals. GPA cited a 1995 study that calculated “(t)he annual genericsavings lost by American consumers due to delayed generic entry will rangefrom $200 million in some years to $500 million in other years.”116 This studyalso calculated that the U.S. Government could lose $1.25 billion over the twoyears following the publication’s release, based on purchases for Medicaid,Medicare, the Veteran’s Administration, and the Department of Defense.
113 Clay Boswell and Feliza Mirasol, “Sourcing Pharmaceutical Manufacturing fromOffshore Facilities,” Chemical Marketing Reporter, Oct. 25, 1999, p. 28.
114 U.S. International Trade Commission, Shifts in U.S. Merchandise Trade, variousyears.
115 Kathleen D. Jaeger, R.Ph., J.D, President & CEO, Generic PharmaceuticalAssociation, written submission to the Commission, Feb. 14, 2003.
116 Stephen W. Schondelmeyer, “Economic Impact of GATT Patent on CurrentlyMarketed Drugs,” PRIME Institute, College of Pharmacy, University , Mar. 1995.
201
Pharmaceutical Research and Manufacturers of America117
The Pharmaceutical Research and Manufacturers of America (PhRMA) isthe national association representing the U.S. research-based pharmaceuticalindustry.
PhRMA is highly supportive of each of the subject trade agreements andPhRMA members have reaped enormous benefits from these trade agreementswhich have opened up foreign markets to U.S. exports. The industry benefittedgreatly from the improved intellectual property protection, reduced technicalbarriers to trade, and “the zero for zero” initiative of the United States thateliminated duties on many active ingredients and intermediates.
While the U.S. industry has fared well with these treaties, not all tradeagreements were created equal. The most acceptable agreement would be onethat provides intellectual property protection comparable to that found in theUnited States, whereas the TRIPS agreement established only a minimum levelof protection for intellectual property protection. More recent multinational andbilateral agreements have improved the protection for intellectual propertyrights that was initiated in the TRIPS agreement and extended and clarified inthe NAFTA. For example, the U.S.-Jordan FTA provided for improved dataprotection, allowed biotech products to be patentable, limited compulsorylicensing, and extended the patent period to allow for time lost because ofregulatory delays.
Other elements of the trade agreements have also been quite beneficial. TheWTO Agreement on Technical Barriers to Trade extended the work of theTokyo Round. The plurilateral Agreement on Government Procurement limitedthe ability of government procurement practices to create artificial barriers totrade. The Agreement on Government Standards reduced the ability ofcountries to use regulations, standards, and testing and certification proceduresas tools to restrict trade. The association supports measures that such as thoseembodied in the U.S.-Jordan FTA that protect the pharmaceutical industry fromparallel imports, a practice in which products are sold at a lower price in onecountry (usually a poor country) and then resold at a higher price, by a thirdparty, in another country (usually a richer country).
117 Andrew W. Shoyer, USITC hearing testimony on behalf of the PharmaceuticalResearch and Manufacturers of America, Jan. 14, 2003.
202
Mineral and Metal Products118
OverviewThe United States is a major producer and consumer of mineral and metal
products.119 This sector is composed of five subsectors (in decreasing shipmentorder for 2001): fabricated metal products except machinery and transportationequipment (fabricated metal products); primary metals; stone, clay, glass, andconcrete products (structural minerals); nonmetallic minerals, except fuels(nonmetallic minerals); and metallic ores/concentrates.120 Fabricated metalproducts and primary metals together represented roughly 80 percent of totalsector output in terms of value throughout the period. Structural mineralsrepresented most of the remaining output, with combined shipments of metallicores and concentrates and nonmetallic minerals representing only about 5percent of sector output. Competitive changes during 1978-2001 have been theresult of rapidly expanding foreign production most evident in primary metalsand metallic ores and concentrates subsectors. Therefore, the remainder of thissection focuses on these particular subsectors.
The primary metals and metallic ores/concentrates subsectors are heavilyconcentrated as typically a handful of producers account for most production in
118 For the purposes of this investigation, mineral and metal products comprise SICgroups 10, 14, 32, 33, and 34.
119 Reliable data on world output and the U.S. position relative to other countries forthe diverse collection of products in this sector are not available. Such information isavailable for specific products/product groups. In 2001, U.S. raw steel production rankedthird globally; unwrought aluminum, third; refined copper, second; gold, second; glass,first; and cement, third.
120 In macroeconomic definitions, fabricated metal products, primary metals, andstructural minerals are manufactured products; nonmetallic minerals and metallicores/concentrates are mined products. Fabricated metal products include, for example,steel beams, fasteners, cutlery, hand tools, metal cans, plumbing fixtures, springs, etc.Primary metals include ferrous (e.g., steel and related steel alloy metals) and nonferrous(e.g., aluminum, copper, precious metals) metal and metal alloys in unwrought (basic,unfabricated shapes such as an ingot or cathode) and wrought forms (semifabricatedshapes such as bare wire, sheet, strip, pipe/tube) that are typically used as inputs for theproduction of fabricated metal products. Structural minerals include cement, dimensionalstone (such as granite shaped for buildings), and glass windshields. Nonmetallic mineralsinclude sand, gravel, uncut dimensional stone, etc. which typically are used as inputs forstructural minerals. Metallic ores/concentrates include iron, copper, zinc, and leadores/concentrates that are typically used as inputs for primary metal products.
203
each industry or broad industry segment,121 the most notable exception beingthe steel industry, which is characterized by a large number of producers.The level of integration between these industries and industry segments is notextensive, although it is common for some industries to produce other metalsas byproducts. Primary metal producers are typically integrated with domesticupstream metallic ore/concentrate operations. Exceptions include certainmetals, such as aluminum, for which the United States lacks naturalresources and imports metallic concentrates to feed the correspondingdomestic primary metal operations. Companies that produce metal/metalalloys from mined materials are typically separate entities from companiesthat produce such products from recycled materials. The notable example isthe steel segment, which is composed of integrated producers thatmanufacture steel primarily from iron ore and separate secondary producersthat manufacture steel from scrap. In certain industries, such as copper,unwrought and wrought producers are typically separate companies. Mostcompanies in these subsectors have a national orientation, although certainU.S.-based companies own foreign aluminum, copper, gold, and to a lesserextent, steel operations. Foreign-based companies own certain U.S. operationsthat produce steel, copper, and gold products
U.S. shipments of mineral and metal products fluctuated downward during1978-2001, by 18 percent to an estimated $470 billion in 2001 (table 5-16).122The overall decline in the value of shipments was led by a 40 percent decreasefor primary metal products to $145 billion, largely due to reduced prices. Interms of quantity, there was a small but steady increase in shipments of mostprimary metal products, with fluctuations related to general economicconditions such as an energy crisis and shifts in the dollar exchange rate.However, prices have generally decreased in both nominal and real terms formost metals since the 1980s. This is largely a result of surging production inless developed countries.123
U.S. steel124 shipments declined sharply in value from $148.5 billion to$70.8 billion, 52 percent, during 1978-2001 while quantities shipped increasedby 1 percent to 109,463 metric tons, but not before dropping by 35 percent to alow of 67,866 in 1982. Most of the decline occurred during 1978-82, when the
121 Major industries include steel, aluminum, copper, gold, silver, lead, zinc.Industries are further segmented by type of processing (unwrought versus wrought) andby type of feed material (mined versus recycled).
122 Annual production totals are overstated as they were derived by summingproduction for each subsector, which results in the double counting of input materials.
123 National Research Council, Competitiveness of the U.S. Minerals and MetalsIndustry (Washington, D.C.: National Academy Press, 1990), p. 13.
124 Steel is defined here as Standard Industrial Classification (SIC) industry 331,blast furnace and basic steel products, and SIC 332, iron and steel foundries.
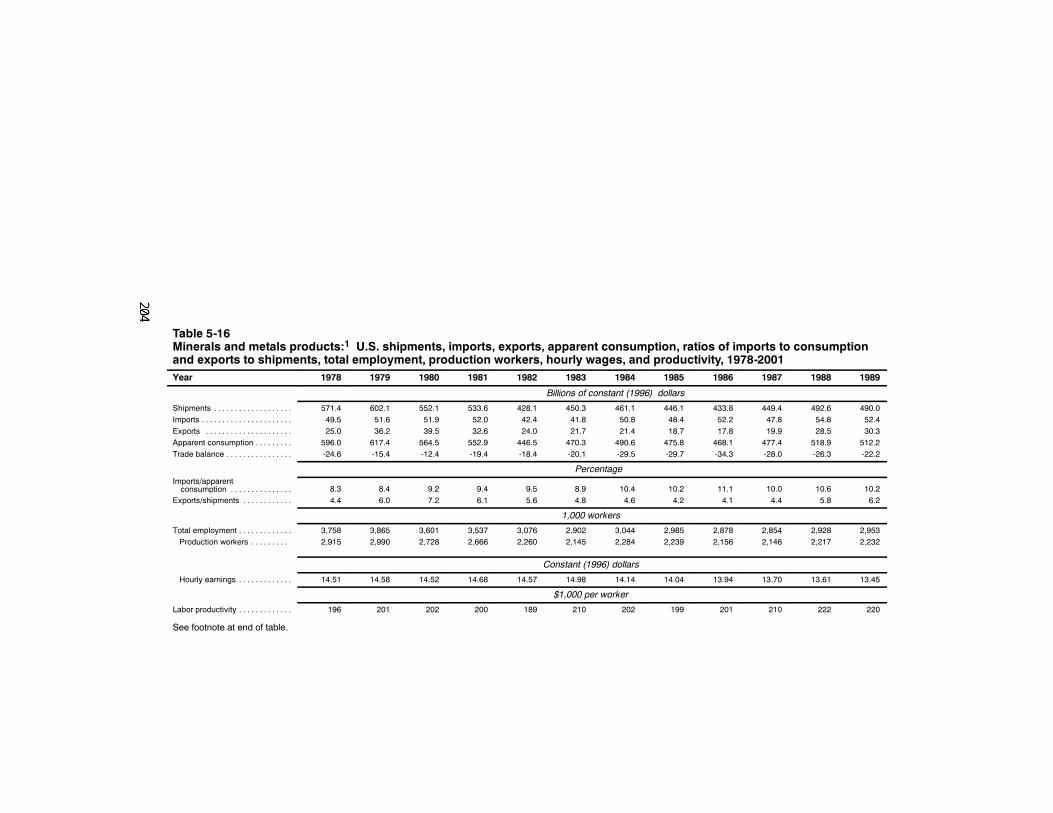
Table 5-16Minerals and metals products:1 U.S. shipments, imports, exports, apparent consumption, ratios of imports to consumptionand exports to shipments, total employment, production workers, hourly wages, and productivity, 1978-2001Year 1978 1979 1980 1981 1982 1983 1984 1985 1986 1987 1988 1989
Billions of constant (1996) dollars
Shipments . . . . . . . . . . . . . . . . . . . 571.4 602.1 552.1 533.6 428.1 450.3 461.1 446.1 433.8 449.4 492.6 490.0Imports . . . . . . . . . . . . . . . . . . . . . . 49.5 51.6 51.9 52.0 42.4 41.8 50.8 48.4 52.2 47.8 54.8 52.4Exports . . . . . . . . . . . . . . . . . . . . . 25.0 36.2 39.5 32.6 24.0 21.7 21.4 18.7 17.8 19.9 28.5 30.3Apparent consumption . . . . . . . . . 596.0 617.4 564.5 552.9 446.5 470.3 490.6 475.8 468.1 477.4 518.9 512.2Trade balance . . . . . . . . . . . . . . . . -24.6 -15.4 -12.4 -19.4 -18.4 -20.1 -29.5 -29.7 -34.3 -28.0 -26.3 -22.2
PercentageImports/apparentconsumption . . . . . . . . . . . . . . . 8.3 8.4 9.2 9.4 9.5 8.9 10.4 10.2 11.1 10.0 10.6 10.2
Exports/shipments . . . . . . . . . . . . 4.4 6.0 7.2 6.1 5.6 4.8 4.6 4.2 4.1 4.4 5.8 6.2
1,000 workers
Total employment . . . . . . . . . . . . . 3,758 3,865 3,601 3,537 3,076 2,902 3,044 2,985 2,878 2,854 2,928 2,953Production workers . . . . . . . . . 2,915 2,990 2,728 2,666 2,260 2,145 2,284 2,239 2,156 2,146 2,217 2,232
Constant (1996) dollars
Hourly earnings . . . . . . . . . . . . . 14.51 14.58 14.52 14.68 14.57 14.98 14.14 14.04 13.94 13.70 13.61 13.45
$1,000 per worker
Labor productivity . . . . . . . . . . . . . 196 201 202 200 189 210 202 199 201 210 222 220
See footnote at end of table.
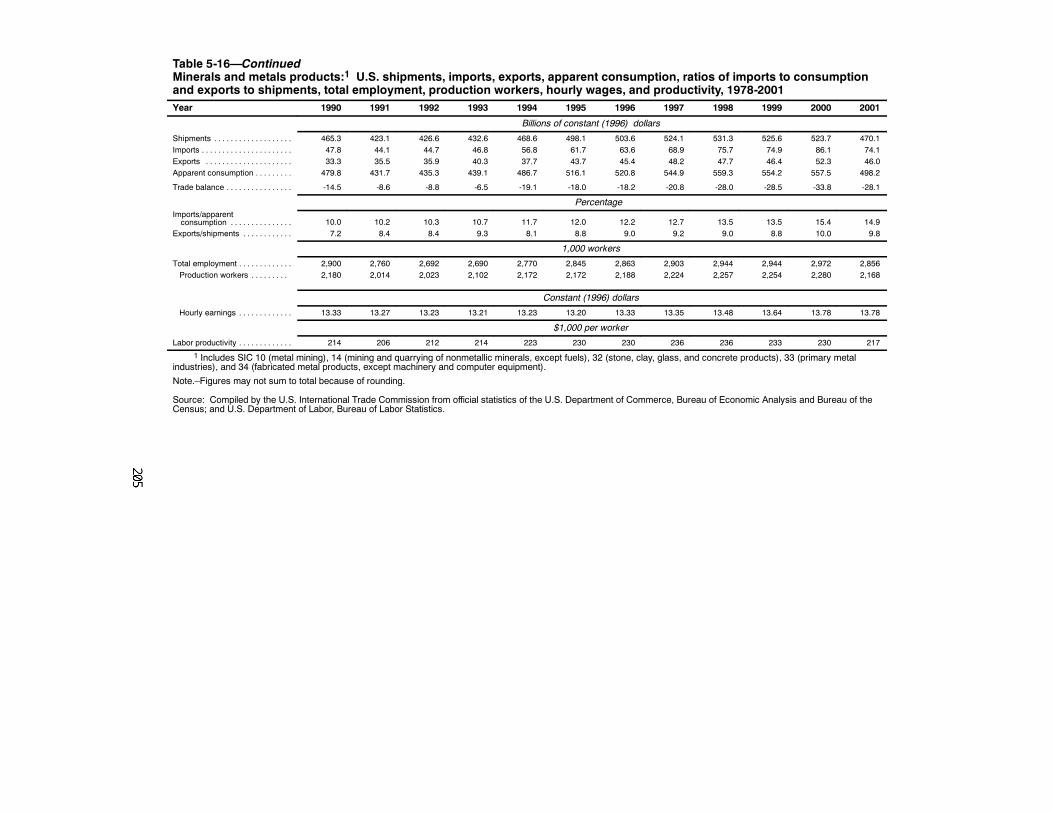
Table 5-16—ContinuedMinerals and metals products:1 U.S. shipments, imports, exports, apparent consumption, ratios of imports to consumptionand exports to shipments, total employment, production workers, hourly wages, and productivity, 1978-2001Year 1990 1991 1992 1993 1994 1995 1996 1997 1998 1999 2000 2001
Billions of constant (1996) dollars
Shipments . . . . . . . . . . . . . . . . . . . 465.3 423.1 426.6 432.6 468.6 498.1 503.6 524.1 531.3 525.6 523.7 470.1Imports . . . . . . . . . . . . . . . . . . . . . . 47.8 44.1 44.7 46.8 56.8 61.7 63.6 68.9 75.7 74.9 86.1 74.1Exports . . . . . . . . . . . . . . . . . . . . . 33.3 35.5 35.9 40.3 37.7 43.7 45.4 48.2 47.7 46.4 52.3 46.0Apparent consumption . . . . . . . . . 479.8 431.7 435.3 439.1 486.7 516.1 520.8 544.9 559.3 554.2 557.5 498.2
Trade balance . . . . . . . . . . . . . . . . -14.5 -8.6 -8.8 -6.5 -19.1 -18.0 -18.2 -20.8 -28.0 -28.5 -33.8 -28.1
PercentageImports/apparentconsumption . . . . . . . . . . . . . . . 10.0 10.2 10.3 10.7 11.7 12.0 12.2 12.7 13.5 13.5 15.4 14.9
Exports/shipments . . . . . . . . . . . . 7.2 8.4 8.4 9.3 8.1 8.8 9.0 9.2 9.0 8.8 10.0 9.8
1,000 workers
Total employment . . . . . . . . . . . . . 2,900 2,760 2,692 2,690 2,770 2,845 2,863 2,903 2,944 2,944 2,972 2,856Production workers . . . . . . . . . 2,180 2,014 2,023 2,102 2,172 2,172 2,188 2,224 2,257 2,254 2,280 2,168
Constant (1996) dollars
Hourly earnings . . . . . . . . . . . . . 13.33 13.27 13.23 13.21 13.23 13.20 13.33 13.35 13.48 13.64 13.78 13.78
$1,000 per worker
Labor productivity . . . . . . . . . . . . . 214 206 212 214 223 230 230 236 236 233 230 217
1 Includes SIC 10 (metal mining), 14 (mining and quarrying of nonmetallic minerals, except fuels), 32 (stone, clay, glass, and concrete products), 33 (primary metalindustries), and 34 (fabricated metal products, except machinery and computer equipment).
Note.–Figures may not sum to total because of rounding.
Source: Compiled by the U.S. International Trade Commission from official statistics of the U.S. Department of Commerce, Bureau of Economic Analysis and Bureau of theCensus; and U.S. Department of Labor, Bureau of Labor Statistics.
206
value of shipments fell by almost 43 percent to $85.1 billion. During1982-86, U.S. steel producers, primarily integrated producers of flat-rolledsteel, reportedly lost $12 billion and approximately 25 companies filed forbankruptcy.125 U.S. steel consumption during this period stagnated, importsrose, prices declined, and U.S. capacity utilization was low. Also, in the early1980s, the appreciating value of the U.S. dollar further enhanced thecompetitiveness of foreign steel producers. From 1982 through 2001, thevalue of U.S. steel sector shipments declined by another 17 percent while thequantity shipped increased by 61 percent.
Despite producing higher quantities of primary metal products, the U.S.share of world metals production declined during 1978-2001.126 U.S. primarymetal operations have had to compete with lower cost foreign operations,especially those in less developed countries that typically have higher qualitynatural resources, lower labor costs, more favorable mining investmentrequirements,127 and in many cases lower environmental compliance costs.128In some cases, U.S. producers began importing certain products they previouslyproduced domestically. For example, beginning in the early 1990s, the U.S.steel industry produced a significant portion of steel mill products fromimported semifinished steel129 to take advantage of lower-cost steel productioncapabilities in other countries, including Australia, Brazil, Mexico, and Russia.Semifinished steel imports were used in about 6 percent of U.S. steelproduction in 2001.
During 1978-2001, apparent consumption of mineral and metal productsfluctuated downward by 16 percent to $498.2 billion, reflecting generaleconomic trends and price reductions for most primary metals and relatedproducts. Contrasting the overall decline in the value of U.S. shipments of thesector, U.S. imports of mineral and metal products increased by 50 percent to$74.1 billion during 1978-2001. Imports of fabricated metal products led thegrowth, increasing by 204 percent to $23 billion in 2001.
125 Thomas R. Howell, William A. Noellert, Jesse G. Kreier, and Alan WilliamWolff, Steel and the State: Government Intervention and Steel’s Structural Crisis,(Boulder, CO: Westview Press 1988), pp. 501 and 503.
126 National Research Council, Competitiveness of the U.S. Minerals and MetalsIndustry, p. 2.
127 Many developing countries have reformed their mining laws to make them morefavorable to foreign mining investments by loosening exploration regulations, reducingcorporate tax rates, and streamlining permit processing. See U.S. Department ofCommerce, “Metals and Industrial Minerals Mining,” U.S. Industry and Trade Outlook1998 (New York City: McGraw--Hill Trade, Nov. 1997), p. 1--1.
128 Although environmental regulations are more common worldwide, developingcountries tend to have insufficient resources for strict government enforcement of theseregulations. Ibid.
129 Solid forms that must be further processed by steel mills before sale toconsuming industries.
207
In conjunction with decreasing shipments and increasing imports, sectoremployment dropped by 902,000 (24 percent) during 1978-2001 (table 5-16).Employment in the steel industry declined from 561,000 employees in 1978 to224,000 in 2000 (latest year available), a decrease of 60 percent. At the sametime, steel and nonferrous metals industries made large investments inlabor-saving technologies that increased overall labor productivity by11 percent.130 Hourly earnings for the overall sector decreased by 5 percentfollowing mine and plant consolidations and wage concessions.131
The U.S. competitive position for primary metals and metallicores/concentrates started to deteriorate significantly during the late 1970s/early1980s as foreign production, especially in less developed countries, began togrow quickly.132 Ownership, investment, and tax incentives133 as well as theprospect of utilizing low-cost labor and rich natural resources has attractedinvestment and spurred the development of metal industries in these countries.Foreign production of steel in developing countries increased significantly,even in countries with limited steel-making raw materials. This occurredmostly as a result of government policies that stimulated the creation of adomestic steel industry because it was considered an essential component ofdevelopment. Increased production contributed to real price declines for mostmetals and metal products, which were further exacerbated by overproductionby the less developed countries to counter price decreases.134
During the same period, U.S. Government regulations concerning metalproduction may have added to the competitive disadvantages faced by U.S.operations. According to industry sources, increasingly strict environmentalregulations with regard to emissions and remediation of discontinuedoperations added significant costs to U.S. operations.135 In addition,development of new mining operations has been hindered by attempts during
130 The steel industry’s cost reduction efforts maintained constant--dollarproductivity despite a decline in real steel prices. Productivity per worker in 2001 wasalmost unchanged from that in 1987, at about $218,000 per employee.
131 National Research Council, Competitiveness of the U.S. Minerals and MetalsIndustry, p. 19.
132 For example, Chile’s copper mine production (in terms of the amount of copperin the mined material) increased from less than 1.3 million metric tons in the early 1980sto over 4.7 million metric tons in 2001.
133 “Metals and Industrial Minerals Mining,” U.S. Industry and Trade Outlook 1998,p. 1--1.
134 Competitiveness of the U.S. Minerals and Metals Industry, pp. 12--13.135 As a frame of reference, the estimated cost of complying with federal
environmental regulations was 10 percent of the price of each metal in 1990(Competitiveness of the U.S. Minerals and Metals Industry, p. 14). Remediation for onediscontinued U.S. mine site reportedly cost $65 million. See Alistair MacDonald,Talmac Consulting, Industry in Transition: A Profile of the North American MiningSector (Winnipeg, Canada: International Institute for Sustainable Development, 2002),p. 94.
208
the last decade to revise the 1872 Mining Law, which governs access topublic lands for metallic ore/concentrate operations. Although the Law hasnot been changed,136 uncertainty regarding possible revisions in ownershipand royalty provisions have likely discouraged the development of U.S.mining operations.137 Exploration activity for untapped metal ore depositshas declined steadily, and few new operations have been instituted since themid-1990s.
Further, U.S. labor costs for metals production were among the highest inthe world and a strong dollar during the period gave imported products acompetitive advantage by lowering the relative price of foreign-producedmetals in the U.S. market.138 In particular, the strong-dollar policies of theearly 1980s resulted in a surge of steel imports.139 Beginning in 1985, ashighlighted by the Plaza Agreement of September 1985,140 the U.S. dollar wasmanaged at a more competitive level and steel imports eased, although thedollar continued to strengthen during the 1990s. Other costs, especially legacycosts associated with employee pension and medical insurance liabilities for theU.S. steel industry, have also contributed to high labor costs.141
136 The Mining Law of 1872, which deals with land tenure, has not been changed,however, U.S. federal government administrations have implemented and revisedregulatory actions to administer mining activities of public lands. See Industry inTransition: A Profile of the North American Mining Sector, p. 71 and Marc Humphriesand Carol Hardy Vincent, Congressional Research Service, “IB89130: Mining onFederal Lands,” found athttp://www.NCSEonline,org/NLE/CRSr...cfm?&CFID=8027258&CFTOKEN=66301521,retrieved May 28, 2003, pp. 1--2.
137 New cost increases to the U.S. mining industry without offsetting cost reductionsin other areas may make U.S. deposits uneconomical compared with those in nations thatare rewriting their mining laws to attract mining investment, particularly developingcountries. See Humphries and Vincent, “IB89130: Mining on Federal Lands,” p. 5. and“Metals and Industrial Minerals Mining,” U.S. Industry and Trade Outlook 1998, p. 1--1.
138 Competitiveness of the U.S. Minerals and Metals Industry, pp. 14--15.139 USITC, U.S. Global Competitiveness: Steel Sheet and Strip Industry (inv. No.
332--231), USITC Pub. 2050, Jan. 1988, pp. 11--127.140 The Plaza Agreement of September 1985 was an effort to coordinate policy in
the major industrialized economies—France, Germany, Japan, United Kingdom, and theUnited States—that included manipulating foreign exchange markets. See Geoffrey P.Miller, “The Role of a Central Bank in a Bubble Economy,” found athttp://www.gold--eagle.com/editorials/cscb002.html, retrieved Nov. 5, 2002.
141 USITC, Information obtained in the Investigation (Carbon and Alloy Steel Flat,Long, and Tubular Products), vol. 2 of Steel (inv. No. TA--201--73), USITC Pub. 3479,Dec. 2001, pp. Overview--31 to Overview--35.
209
To encourage more efficient operating conditions, the U.S. metals industryreduced production capacity by closing high-cost plants and rationalizingoperations (including consolidation of producers in many metal industries);disposed of non-core interests and focused assets on metal production toachieve cost reductions through economies of scale; reduced managementrequirements; and increased financial resources for new, more efficienttechnologies. Certain metal industries further specialized production byseparating types of operations such as unwrought and wrought to focusexpertise on each phase of production. Labor cost reductions were achievedthrough layoffs, wage reductions, and by broadening the scope of many unionjobs to increase personnel flexibility.142
To further improve production efficiency, U.S. producers have aggressivelyadopted new technologies in the production of metallic ores and primarymetals. Automated computer-based control systems have been integrated intothe production system for better quality control. There have been severaladvances in the production process to improve efficiencies (reduce energyrequirements, increase productivity) and lower environmental effects. Copperand gold producers greatly expanded their use of leaching143 techniques, whichprovided a cost effective means of extracting desired metals from low-gradeores. Leaching was developed prior to 1980 but put into extensive commercialuse during 1980-2001.
The U.S. steel industry has adopted key cost-saving technologies, includingbasic-oxygen and electric furnace steelmaking, which replaced the energyintensive open hearth process, and continuous casting of semifinished forms,which offered significant labor, capital, and energy savings.144 The adoption ofthese technologies by the U.S. industry started before 1978145 and wasessentially completed in 1991.146 Minimill production of flat-rolled steelproducts, using thin-slab casting, was also commercialized during thisperiod.147 This technology reduces economies of scale for flat-rolled steelproduction and significantly reduces the capital investment required per unit ofoutput.
During 1978-2001, U.S. imports of sector products were subjected tonumerous antidumping and countervailing duty orders issued for primarymetals, including steel products, brass sheet/strip, unwrought magnesium, andtungsten ore concentrates. In addition, the United States implemented a numberof actions during the period in response to petitions by steel companies seekingrelief from the effects of imports under antidumping, countervailing duty, or
142 Competitiveness of the U.S. Minerals and Metals Industry, p. 19.143 Leaching is the extraction of desired metal from ore by selectively dissolving it
in a suitable, usually chemical, solution.144 USITC, Steel, vol. 2, p. Overview--20.145 Basic--oxygen steelmaking and continuous casting were also being installed in
new steelmaking facilities in developing countries and elsewhere prior to the 1980s.146 USITC, Steel, vol. 2, p. Overview--20.147 Ibid.
210
safeguard statutes. Specific programs included specialty steel quotas(1976-80),148 a trigger price mechanism (“TPM”) (1978-82),149 U.S.-E.C.steel voluntary restraint agreements (“VRA”) (1982-84),150 specialty steelmeasures (1983-84),151 and the extended VRA program (1984-92).152 Areview of each program and its impact on the steel industry follows at theend of this overview.
Global competitive conditions have spurred consolidation among producersand the closure of high-cost operations in the United States and otherindustrialized nations. Many of these producers have invested in metalproduction in developing countries with large resources of metal ores as well aslower labor and energy costs. Host countries for these off-shore operationscombine lower-cost operating advantages with advanced technology to producesteel at highly competitive prices.
Effect of Trade Agreements on the SectorThe five trade agreements subject to this investigation had little impact on
the U.S. mineral and metal products sector relative to other factors such as thecompetitive problems discussed above, decreased real metal prices, increasedproduction sharing, and increased U.S. consumption of imported products thathad no tariffs during 1980-2001. Macroeconomic factors also contributedsignificantly to sector trade including exchange rate fluctuations, generaleconomic fluctuations, and the economic crises in Mexico (1995) and Asia
148 In June 1976 the President imposed quotas on imports of stainless steel and toolsteel products on a regional or, in the case of the larger suppliers, a country--by--countrybasis. USITC, U.S. Global Competitiveness: Steel Sheet and Strip Industry (inv. No.332--231), USITC Pub. 2050, Jan. 1988, p. 11--120.
149 In exchange for the agreement of U.S. steel companies to withdraw a number ofantidumping petitions against Japanese and EU steel exporters, the Administrationimplemented the TPM, a system based on reference prices. Ibid., p. 11--123.
150 The Voluntary Restraint Agreement limited EC exports of steel mill productsaccounting for about 64 percent of EC exports in 1982 to fixed percentages of the U.S.market for the products. In return, the U.S. steel companies withdrew antidumpingcomplaints against the European producers. Ibid., p. 11--127.
151 The specialty steel measures were a four--year program of import reliefconsisting of increased duties on stainless steel sheet, strip and plate, and quotas onstainless steel bar and wire and certain tool steel products. Ibid., p. 11--29.
152 The extended VRAs with the EC (also known as the nine--point U.S.Government policy for the steel industry), and eventually 16 other countries, limited U.S.imports of various steel mill products. Ibid., p. 11--130 and USITC, Steel IndustryAnnual Report On Competitive Conditions in the Steel Industry and Industry Efforts toAdjust and Modernize (inv. No. 332--289), USITC Pub. 2436, Sept. 1991, p. 1--1.
211
(1998).153 The relevance of each trade agreement’s impact on this industrysector is discussed below.
Tokyo RoundThe Tokyo Round likely had a minimal effect on sector trade. The average
U.S. tariffs on sector imports were relatively low before the agreement (table5-17) as they were for major foreign markets, including Japan and theEuropean Community.154 Although reduced U.S. tariff rates facilitated importgrowth, the change in trade was also a result of the deteriorating competitiveposition of U.S. industries, declining real metal prices during the 1980s, andthe appreciation of the U.S. dollar. These developments are revealed in thesteady decline of exports during the early 1980s compared with relativelystable imports and consumption (table 5-16).
From 1980 (the year of the first stage of Tokyo Round tariff reductions) to2000, U.S. total trade (imports plus exports) in sector products increased at anaverage annual rate of 2.1 percent to $138 billion although significantyear-to-year fluctuations occurred, then dropped by 13 percent in 2001. Thissector trend generally matched trends in the U.S. economy as a whole, withdownturns occurring during the early 1980s, 1990s, and the year 2000. U.S.exports of sector goods increased by 16 percent to $46 billion during1980-2001 while imports increased by 43 percent to $74 billion, causing thetrade deficit to more than double (table 5-16). International trade became anincreasingly important factor for this sector as the ratio of exports to shipmentsincreased by about 3 percentage points to 9.8 percent during 1980-2001 andimports to apparent consumption increased by 6 percentage points to 15percent.
U.S.-Israel FTAThe U.S.-Israel FTA (FTA) had a moderate effect on sector trade with
Israel, particularly for U.S. exports, but an insignificant effect on total sector
153 These crises contributed to lower world consumption and lower or stagnatingmetal prices. Consumption of sector products strongly correlates to performance of acountry’s economy, especially building construction, automobile, and machineryproduction.
154 However, there was a relatively large disparity between U.S. and Canadian tariffson each others products before and after the Tokyo Agreement. Before the Agreement,Canada’s average base rate on U.S. sector products was 10 percent versus the U.S.comparable rate of 3 percent on Canadian products. After the agreement, Canadianconcession rates on U.S. products averaged 6 percent compared with U.S. concessionrates of 2 percent on Canadian products. See “Twenty--Fourth Annual Report of thePresident of the United States on the Trade Agreements Program: 1979,” ch. in TheTrade Agreements Program of the United States: Annual Reports of the President,1957--1985, compiled by Bernard D. Reams Jr., vol. 3, (Buffalo, NY: William S. Hein &Company, Inc., 1989) p. 54--58.
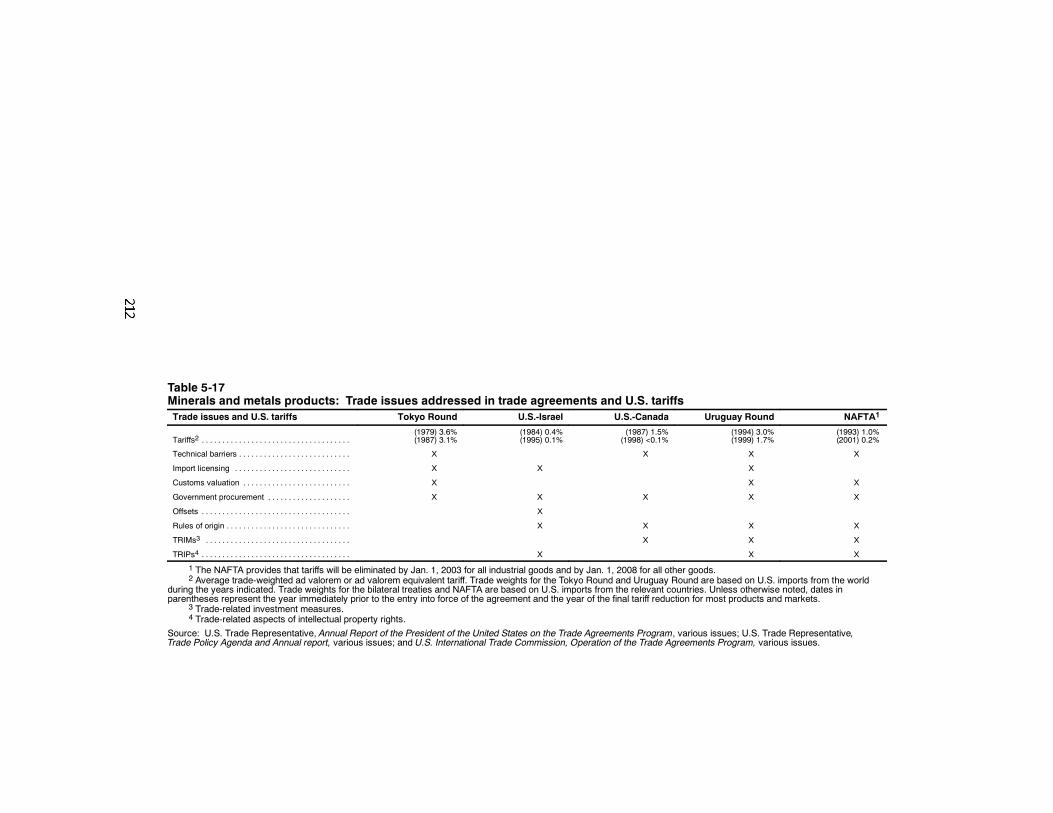
Table 5-17Minerals and metals products: Trade issues addressed in trade agreements and U.S. tariffsTrade issues and U.S. tariffs Tokyo Round U.S.-Israel U.S.-Canada Uruguay Round NAFTA1
Tariffs2 . . . . . . . . . . . . . . . . . . . . . . . . . . . . . . . . . . . .(1979) 3.6%(1987) 3.1%
(1984) 0.4%(1995) 0.1%
(1987) 1.5%(1998) <0.1%
(1994) 3.0%(1999) 1.7%
(1993) 1.0%(2001) 0.2%
Technical barriers . . . . . . . . . . . . . . . . . . . . . . . . . . . X X X X
Import licensing . . . . . . . . . . . . . . . . . . . . . . . . . . . . X X X
Customs valuation . . . . . . . . . . . . . . . . . . . . . . . . . . X X X
Government procurement . . . . . . . . . . . . . . . . . . . . X X X X X
Offsets . . . . . . . . . . . . . . . . . . . . . . . . . . . . . . . . . . . . X
Rules of origin . . . . . . . . . . . . . . . . . . . . . . . . . . . . . . X X X X
TRIMs3 . . . . . . . . . . . . . . . . . . . . . . . . . . . . . . . . . . . X X X
TRIPs4 . . . . . . . . . . . . . . . . . . . . . . . . . . . . . . . . . . . . X X X
1 The NAFTA provides that tariffs will be eliminated by Jan. 1, 2003 for all industrial goods and by Jan. 1, 2008 for all other goods.2 Average trade-weighted ad valorem or ad valorem equivalent tariff. Trade weights for the Tokyo Round and Uruguay Round are based on U.S. imports from the world
during the years indicated. Trade weights for the bilateral treaties and NAFTA are based on U.S. imports from the relevant countries. Unless otherwise noted, dates inparentheses represent the year immediately prior to the entry into force of the agreement and the year of the final tariff reduction for most products and markets.
3 Trade-related investment measures.4 Trade-related aspects of intellectual property rights.
Source: U.S. Trade Representative, Annual Report of the President of the United States on the Trade Agreements Program, various issues; U.S. Trade Representative,Trade Policy Agenda and Annual report, various issues; and U.S. International Trade Commission, Operation of the Trade Agreements Program, various issues.
213
trade and the industry because Israel only accounted for about 1 percent ofexports and less than 0.5 percent of imports for U.S. mineral and metalproducts during 1985-2001 (table 5-18). The U.S.-Israel FTA eliminated theindustrial product preferential trade agreement with the European Community(EC) that created severe tariff disparity on U.S. products compared withthose from Europe.155 In contrast to U.S. exports, the agreement is not likelyto have had as significant an effect on U.S. imports from Israel because theaverage U.S. tariffs on sector imports were already less than one-half percent(table 5-17).
During 1985-2001, U.S. total trade with Israel in mineral and metalproducts increased at an average annual rate of 3 percent, to about $646million, compared with a 3.7 percent rate for all countries (table 5-18). U.S.exports of sector products to Israel more than doubled to $407 million whileU.S. imports from Israel increased by 9 percent to about $239 million. U.S.exports to and imports from Israel increased for all five subsectors comprisingmineral and metal products during 1989 (earliest year specific product dataavailable) through 2001. Arms and ammunition were the fastest growingexports and imports, which accounted for a range of 20-43 percent of totalsector trade with Israel.156 However, the agreement did not apply to arms andammunition, goods for which both countries already exempted from tariffs ifthey were imported with the Governments’ authorization for militarypurposes.157 In contrast, total trade in steel fell slightly from $25.5 million in1989 to $24.7 million in 2001, but ranged from a low of $16.6 million to ahigh of $34.1 million during this period.
U.S.-Canada FTAThe U.S.-Canada FTA had a minimal effect on sector trade. Instead,
production sharing was probably the more important reason for trade growth.The Agreement also likely contributed to an increase in integration betweenU.S. and Canadian industries which may have further contribute to increasedtrade between the countries. Prior to the implementation of this treaty, Canadadid have a British preferential tariff (BPT) that placed U.S. products at a
155 U.S. Trade Representative (USTR), “U.S.--Israel Free Trade Agreement,” AnnualReport of the President of the United States on the Trade Agreements Program1984--1985, issue 28, Feb. 1986, p. 97.
156 U.S. exports of arms and ammunition to Israel fluctuated upward for a238--percent increase to $194 million in 2001, with ranges from a low of almost $39million in 1994 and a high of $244 million in 1998. During the same time frame, U.S.imports from Israel fluctuated upward for a 204--percent increase to $59 million, withranges from a low of almost $10 million in 1997 to the high of $59 million in 2001.
157 See Bulletin International Des Douanes (Israel 1975--1976), 8th ed., No. 41(Brussels: International Customs Tariffs Bureau, 1975), p. 181 and United StatesInternational Trade Commission, Tariff Schedules of the United States Annotated 1980,sch. 8, part 3, item 832.00, p. 753.
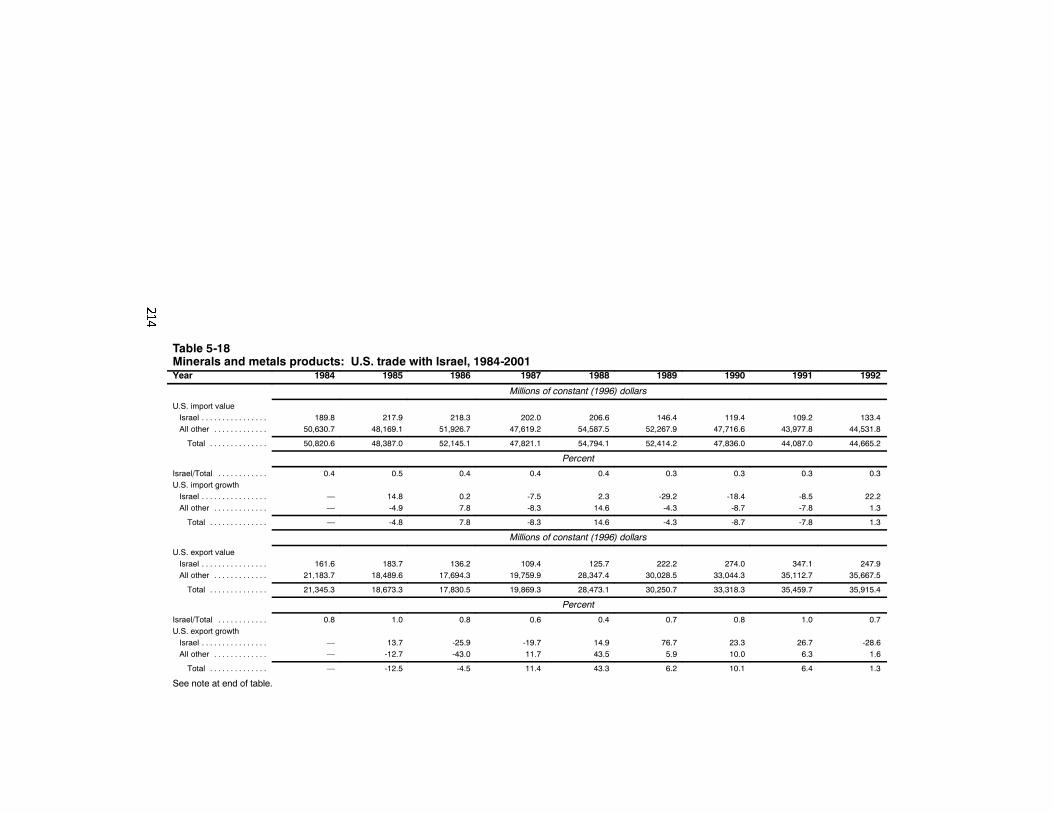
Table 5-18Minerals and metals products: U.S. trade with Israel, 1984-2001Year 1984 1985 1986 1987 1988 1989 1990 1991 1992
Millions of constant (1996) dollars
U.S. import valueIsrael . . . . . . . . . . . . . . . . 189.8 217.9 218.3 202.0 206.6 146.4 119.4 109.2 133.4All other . . . . . . . . . . . . . 50,630.7 48,169.1 51,926.7 47,619.2 54,587.5 52,267.9 47,716.6 43,977.8 44,531.8
Total . . . . . . . . . . . . . . 50,820.6 48,387.0 52,145.1 47,821.1 54,794.1 52,414.2 47,836.0 44,087.0 44,665.2
Percent
Israel/Total . . . . . . . . . . . . 0.4 0.5 0.4 0.4 0.4 0.3 0.3 0.3 0.3U.S. import growthIsrael . . . . . . . . . . . . . . . . — 14.8 0.2 -7.5 2.3 -29.2 -18.4 -8.5 22.2All other . . . . . . . . . . . . . — -4.9 7.8 -8.3 14.6 -4.3 -8.7 -7.8 1.3
Total . . . . . . . . . . . . . . — -4.8 7.8 -8.3 14.6 -4.3 -8.7 -7.8 1.3
Millions of constant (1996) dollars
U.S. export valueIsrael . . . . . . . . . . . . . . . . 161.6 183.7 136.2 109.4 125.7 222.2 274.0 347.1 247.9All other . . . . . . . . . . . . . 21,183.7 18,489.6 17,694.3 19,759.9 28,347.4 30,028.5 33,044.3 35,112.7 35,667.5
Total . . . . . . . . . . . . . . 21,345.3 18,673.3 17,830.5 19,869.3 28,473.1 30,250.7 33,318.3 35,459.7 35,915.4
Percent
Israel/Total . . . . . . . . . . . . 0.8 1.0 0.8 0.6 0.4 0.7 0.8 1.0 0.7U.S. export growthIsrael . . . . . . . . . . . . . . . . — 13.7 -25.9 -19.7 14.9 76.7 23.3 26.7 -28.6All other . . . . . . . . . . . . . — -12.7 -43.0 11.7 43.5 5.9 10.0 6.3 1.6
Total . . . . . . . . . . . . . . — -12.5 -4.5 11.4 43.3 6.2 10.1 6.4 1.3
See note at end of table.
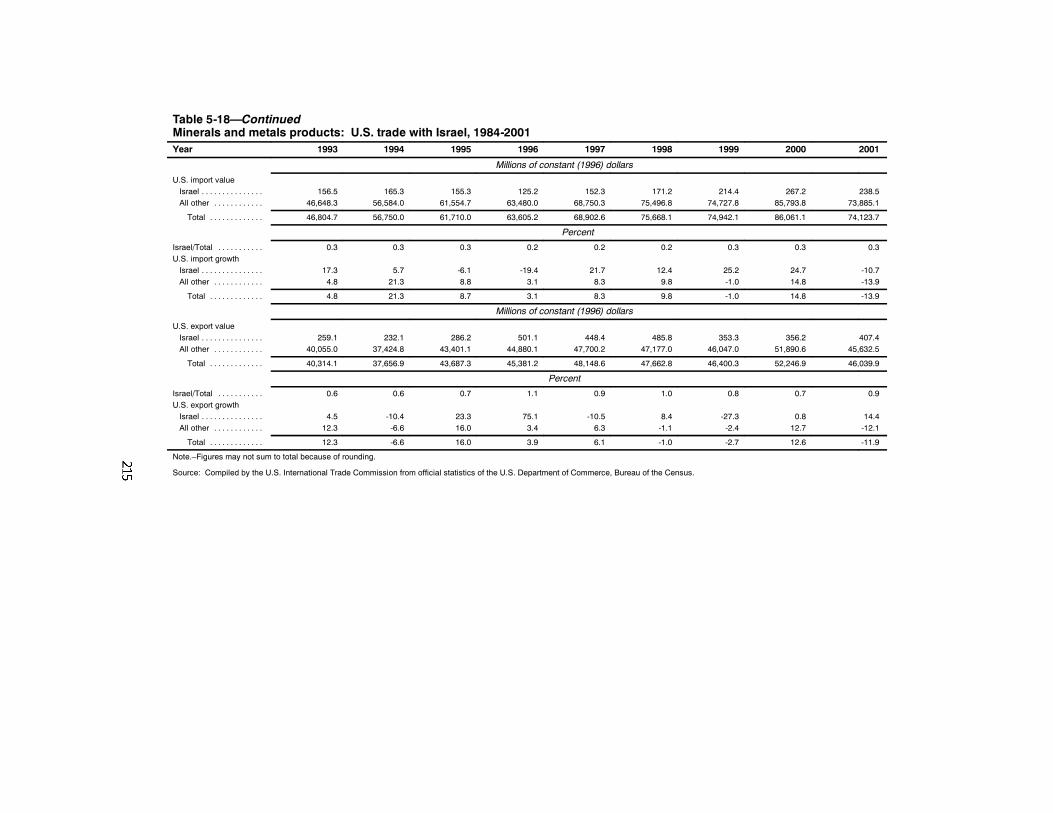
Table 5-18—ContinuedMinerals and metals products: U.S. trade with Israel, 1984-2001Year 1993 1994 1995 1996 1997 1998 1999 2000 2001
Millions of constant (1996) dollars
U.S. import valueIsrael . . . . . . . . . . . . . . . 156.5 165.3 155.3 125.2 152.3 171.2 214.4 267.2 238.5All other . . . . . . . . . . . . 46,648.3 56,584.0 61,554.7 63,480.0 68,750.3 75,496.8 74,727.8 85,793.8 73,885.1
Total . . . . . . . . . . . . . 46,804.7 56,750.0 61,710.0 63,605.2 68,902.6 75,668.1 74,942.1 86,061.1 74,123.7
Percent
Israel/Total . . . . . . . . . . . 0.3 0.3 0.3 0.2 0.2 0.2 0.3 0.3 0.3U.S. import growthIsrael . . . . . . . . . . . . . . . 17.3 5.7 -6.1 -19.4 21.7 12.4 25.2 24.7 -10.7All other . . . . . . . . . . . . 4.8 21.3 8.8 3.1 8.3 9.8 -1.0 14.8 -13.9
Total . . . . . . . . . . . . . 4.8 21.3 8.7 3.1 8.3 9.8 -1.0 14.8 -13.9
Millions of constant (1996) dollars
U.S. export valueIsrael . . . . . . . . . . . . . . . 259.1 232.1 286.2 501.1 448.4 485.8 353.3 356.2 407.4All other . . . . . . . . . . . . 40,055.0 37,424.8 43,401.1 44,880.1 47,700.2 47,177.0 46,047.0 51,890.6 45,632.5
Total . . . . . . . . . . . . . 40,314.1 37,656.9 43,687.3 45,381.2 48,148.6 47,662.8 46,400.3 52,246.9 46,039.9
Percent
Israel/Total . . . . . . . . . . . 0.6 0.6 0.7 1.1 0.9 1.0 0.8 0.7 0.9U.S. export growthIsrael . . . . . . . . . . . . . . . 4.5 -10.4 23.3 75.1 -10.5 8.4 -27.3 0.8 14.4All other . . . . . . . . . . . . 12.3 -6.6 16.0 3.4 6.3 -1.1 -2.4 12.7 -12.1
Total . . . . . . . . . . . . . 12.3 -6.6 16.0 3.9 6.1 -1.0 -2.7 12.6 -11.9
Note.–Figures may not sum to total because of rounding.
Source: Compiled by the U.S. International Trade Commission from official statistics of the U.S. Department of Commerce, Bureau of the Census.
216
disadvantage compared with those imported from the United Kingdom.158
The U.S.-Canada FTA would have eliminated the disparity by January 1998with the bilateral tariff phase-out between the two countries.159 Average U.S.tariffs on sector imports were relatively low at 1.5 percent before theagreement (table 5-19); following the Tokyo Round, Canadian tariffs onsector imports ranged from 2.0 to 10 percent ad valorem.160
During 1988-2001, U.S. total trade with Canada in mineral and metalproducts grew at an average annual rate of 2.9 percent, to $31 billion (table5-19). Canada has been the single largest U.S. trading partner in this sectorsince 1987, just prior to the agreement taking affect, accounting for 25 to28 percent of U.S. total sector trade. U.S. exports of sector products to Canadaincreased by 80 percent to almost $14.6 billion, most of which was accountedfor by iron and steel and fabricated articles of iron or steel followed byvalves161 (used primarily to control the flow of liquids, gases, and solidsthrough piping systems).162 U.S. exports to Canada of iron and steel andfabricated products of iron or steel each doubled in 1990 from the previousyear to $1.1 billion and $1.6 billion, respectively.163 Despite fluctuations,neither product group dropped below the 1990 export value, and iron and steelexports doubled to $2 billion while fabricated products of iron or steel rose to
158 See Bulletin International Des Douanes (Canada 1985--1986), 17th ed., No. 57(Brussels: International Customs Tariffs Bureau, 1975).
159 USTR, 2001 National Trade Estimate Report on Foreign Trade Barriers(Washington: GPO, 2001), p. 30.
160 “Twenty--Fourth Annual Report of the President of the United States on theTrade Agreements Program: 1979,” The Trade Agreements Program of the UnitedStates: Annual Reports of the President, 1957--1985, pp. 54--55.
161 The United States has long been the world’s largest single producer of valves andsimilar devices, and Canada has been a major export market since before the tradeagreement, accounting for approximately one--fourth of U.S. valve exports in 1983. SeeUSITC, Summary of Trade and Tariff Information: Taps, Cocks, Valves, and SimilarDevices and Parts, USITC Pub. 841, Oct. 1984, pp. 14--19.
162 Markets for these products cover a broad spectrum of industries includingshipbuilding and repair, petroleum refining, petrochemicals, pulp and paper, water andsewage treatment facilities, processed food and beverages, and power generation.
163 Although Canada is reported to be the world’s largest exporter of minerals andmetals, it accounts for less than 1 percent of the world’s pig iron and raw steelproduction, relying on imports to supplement its requirements. For production data, seeU.S. Department of the Interior, U.S. Geological Survey, The Mineral Industry ofCanada (2001), by Alfredo C. Gurmendi, Table 1: Production of mineral commodities,found at http://minerals.usgs.gov/minerals/pubs/country/2001/camyb01.pdf, retrievedMar. 14, 2003 and U.S. Department of the Interior, U.S. Geological Survey, MineralCommodity Summaries: Iron and Steel 2001, p. 2, found athttp://minerals.usgs.gov/minerals/pubs/commodity/iron_&_steel/350302.pdf, retrievedMar. 14, 2003.
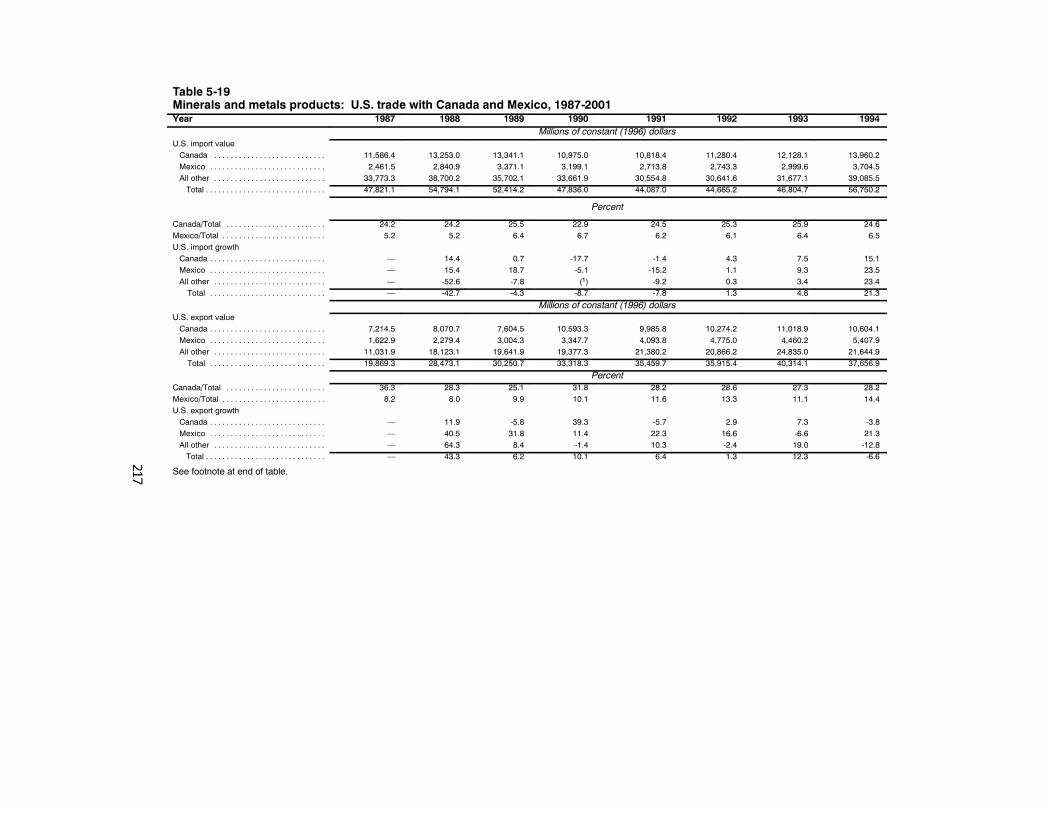
Table 5-19Minerals and metals products: U.S. trade with Canada and Mexico, 1987-2001Year 1987 1988 1989 1990 1991 1992 1993 1994
Millions of constant (1996) dollarsU.S. import valueCanada . . . . . . . . . . . . . . . . . . . . . . . . . . . 11,586.4 13,253.0 13,341.1 10,975.0 10,818.4 11,280.4 12,128.1 13,960.2Mexico . . . . . . . . . . . . . . . . . . . . . . . . . . . . 2,461.5 2,840.9 3,371.1 3,199.1 2,713.8 2,743.3 2,999.6 3,704.5All other . . . . . . . . . . . . . . . . . . . . . . . . . . . 33,773.3 38,700.2 35,702.1 33,661.9 30,554.8 30,641.6 31,677.1 39,085.5Total . . . . . . . . . . . . . . . . . . . . . . . . . . . . . 47,821.1 54,794.1 52,414.2 47,836.0 44,087.0 44,665.2 46,804.7 56,750.2
Percent
Canada/Total . . . . . . . . . . . . . . . . . . . . . . . . 24.2 24.2 25.5 22.9 24.5 25.3 25.9 24.6Mexico/Total . . . . . . . . . . . . . . . . . . . . . . . . . 5.2 5.2 6.4 6.7 6.2 6.1 6.4 6.5U.S. import growthCanada . . . . . . . . . . . . . . . . . . . . . . . . . . . . — 14.4 0.7 -17.7 -1.4 4.3 7.5 15.1Mexico . . . . . . . . . . . . . . . . . . . . . . . . . . . . — 15.4 18.7 -5.1 -15.2 1.1 9.3 23.5All other . . . . . . . . . . . . . . . . . . . . . . . . . . . — -52.6 -7.8 (1) -9.2 0.3 3.4 23.4Total . . . . . . . . . . . . . . . . . . . . . . . . . . . . — -42.7 -4.3 -8.7 -7.8 1.3 4.8 21.3
Millions of constant (1996) dollarsU.S. export valueCanada . . . . . . . . . . . . . . . . . . . . . . . . . . . . 7,214.5 8,070.7 7,604.5 10,593.3 9,985.8 10,274.2 11,018.9 10,604.1Mexico . . . . . . . . . . . . . . . . . . . . . . . . . . . . 1,622.9 2,279.4 3,004.3 3,347.7 4,093.8 4,775.0 4,460.2 5,407.9All other . . . . . . . . . . . . . . . . . . . . . . . . . . . 11,031.9 18,123.1 19,641.9 19,377.3 21,380.2 20,866.2 24,835.0 21,644.9Total . . . . . . . . . . . . . . . . . . . . . . . . . . . . 19,869.3 28,473.1 30,250.7 33,318.3 35,459.7 35,915.4 40,314.1 37,656.9
PercentCanada/Total . . . . . . . . . . . . . . . . . . . . . . . . 36.3 28.3 25.1 31.8 28.2 28.6 27.3 28.2Mexico/Total . . . . . . . . . . . . . . . . . . . . . . . . . 8.2 8.0 9.9 10.1 11.6 13.3 11.1 14.4U.S. export growthCanada . . . . . . . . . . . . . . . . . . . . . . . . . . . . — 11.9 -5.8 39.3 -5.7 2.9 7.3 -3.8Mexico . . . . . . . . . . . . . . . . . . . . . . . . . . . . — 40.5 31.8 11.4 22.3 16.6 -6.6 21.3All other . . . . . . . . . . . . . . . . . . . . . . . . . . . — 64.3 8.4 -1.4 10.3 -2.4 19.0 -12.8Total . . . . . . . . . . . . . . . . . . . . . . . . . . . . . — 43.3 6.2 10.1 6.4 1.3 12.3 -6.6
See footnote at end of table.
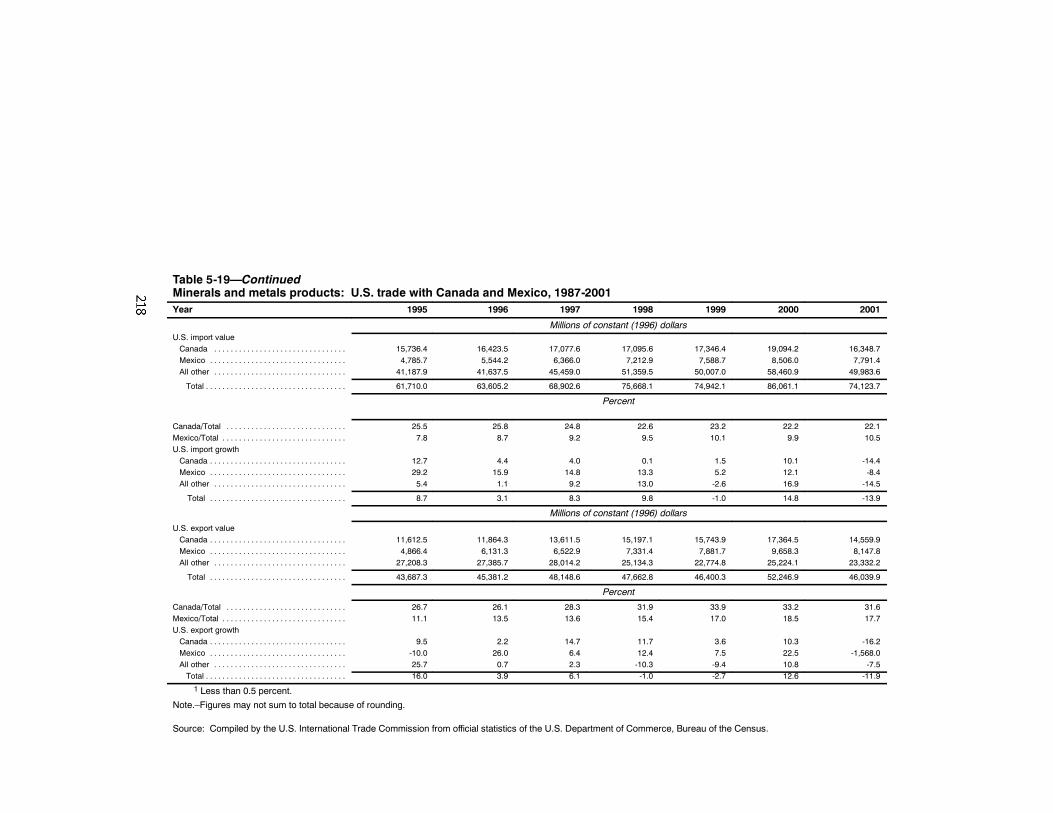
Table 5-19—ContinuedMinerals and metals products: U.S. trade with Canada and Mexico, 1987-2001Year 1995 1996 1997 1998 1999 2000 2001
Millions of constant (1996) dollarsU.S. import valueCanada . . . . . . . . . . . . . . . . . . . . . . . . . . . . . . . . 15,736.4 16,423.5 17,077.6 17,095.6 17,346.4 19,094.2 16,348.7Mexico . . . . . . . . . . . . . . . . . . . . . . . . . . . . . . . . . 4,785.7 5,544.2 6,366.0 7,212.9 7,588.7 8,506.0 7,791.4All other . . . . . . . . . . . . . . . . . . . . . . . . . . . . . . . . 41,187.9 41,637.5 45,459.0 51,359.5 50,007.0 58,460.9 49,983.6
Total . . . . . . . . . . . . . . . . . . . . . . . . . . . . . . . . . . 61,710.0 63,605.2 68,902.6 75,668.1 74,942.1 86,061.1 74,123.7
Percent
Canada/Total . . . . . . . . . . . . . . . . . . . . . . . . . . . . . 25.5 25.8 24.8 22.6 23.2 22.2 22.1Mexico/Total . . . . . . . . . . . . . . . . . . . . . . . . . . . . . . 7.8 8.7 9.2 9.5 10.1 9.9 10.5U.S. import growthCanada . . . . . . . . . . . . . . . . . . . . . . . . . . . . . . . . . 12.7 4.4 4.0 0.1 1.5 10.1 -14.4Mexico . . . . . . . . . . . . . . . . . . . . . . . . . . . . . . . . . 29.2 15.9 14.8 13.3 5.2 12.1 -8.4All other . . . . . . . . . . . . . . . . . . . . . . . . . . . . . . . . 5.4 1.1 9.2 13.0 -2.6 16.9 -14.5
Total . . . . . . . . . . . . . . . . . . . . . . . . . . . . . . . . . 8.7 3.1 8.3 9.8 -1.0 14.8 -13.9
Millions of constant (1996) dollars
U.S. export valueCanada . . . . . . . . . . . . . . . . . . . . . . . . . . . . . . . . . 11,612.5 11,864.3 13,611.5 15,197.1 15,743.9 17,364.5 14,559.9Mexico . . . . . . . . . . . . . . . . . . . . . . . . . . . . . . . . . 4,866.4 6,131.3 6,522.9 7,331.4 7,881.7 9,658.3 8,147.8All other . . . . . . . . . . . . . . . . . . . . . . . . . . . . . . . . 27,208.3 27,385.7 28,014.2 25,134.3 22,774.8 25,224.1 23,332.2
Total . . . . . . . . . . . . . . . . . . . . . . . . . . . . . . . . . 43,687.3 45,381.2 48,148.6 47,662.8 46,400.3 52,246.9 46,039.9
Percent
Canada/Total . . . . . . . . . . . . . . . . . . . . . . . . . . . . . 26.7 26.1 28.3 31.9 33.9 33.2 31.6Mexico/Total . . . . . . . . . . . . . . . . . . . . . . . . . . . . . . 11.1 13.5 13.6 15.4 17.0 18.5 17.7U.S. export growthCanada . . . . . . . . . . . . . . . . . . . . . . . . . . . . . . . . . 9.5 2.2 14.7 11.7 3.6 10.3 -16.2Mexico . . . . . . . . . . . . . . . . . . . . . . . . . . . . . . . . . -10.0 26.0 6.4 12.4 7.5 22.5 -1,568.0All other . . . . . . . . . . . . . . . . . . . . . . . . . . . . . . . . 25.7 0.7 2.3 -10.3 -9.4 10.8 -7.5Total . . . . . . . . . . . . . . . . . . . . . . . . . . . . . . . . . . 16.0 3.9 6.1 -1.0 -2.7 12.6 -11.9
1 Less than 0.5 percent.
Note.–Figures may not sum to total because of rounding.
Source: Compiled by the U.S. International Trade Commission from official statistics of the U.S. Department of Commerce, Bureau of the Census.
219
almost $4 billion in 2001. At the same time, U.S. imports from Canadaincreased by 23 percent to $16.3 billion, of which aluminum and fabricatedarticles of iron and steel accounted for most of the growth.164
NAFTAThe NAFTA likely had a minimal effect on sector trade. However, other
factors like production sharing, the Maquiladora Program,165 and the pesodevaluation of 1996 were probably more important reasons for trade growth.Although NAFTA resulted in the phase-out of Mexico’s relatively high10-15 percent ad valorem tariff rates for most sector products, Mexico is arelatively small consumer for most sector products. By comparison, the averageU.S. tariffs on sector products were relatively low at 1 percent ad valorembefore the agreement. The foreign investment protection and governmentprocurement elements of this agreement likely have affected U.S. sectorexports. Opportunities increased for U.S. firms to sell tubular oil goods to thegovernment-owned Mexican petroleum industry and for U.S. steel distributorsto invest in Mexico.
During 1994-2001, U.S. total trade in sector products with NAFTA partnersMexico and Canada combined grew at an average annual rate of 4.8 percent, toalmost $47 billion, compared with a rate of 3.5 percent for sector trade with allcountries.166 In 1994, Mexico displaced Japan as the second largest U.S. tradepartner for this sector. Since then, Mexico and Canada together have accountedfor 35-40 percent of U.S. total trade. U.S. exports of sector products to Mexicoand Canada increased by 42 percent to about $23 billion,167 of which
164 Mineral and Metal Products showing the largest trade growth, aluminum andiron and steel, have been major components of U.S./Canada production sharingoperations since before implementation of this agreement. See USITC, Imports UnderItems 806.30 and 807.00 of the Tariff Schedules of the United States, 1982--1985, (inv.No. 332--237), USITC Pub. 1920, Dec. 1986, pp. 3--2 to 3--4, 4--10, and F--2 to F--3.
165 An increasing share of imports from production--sharing operations enter theUnited States under duty--free provisions of NAFTA rather than under theproduction--sharing provisions of the U.S. Harmonized Tariff Schedule, Chapter 98,particularly with the elimination of the customs merchandise processing fee on July 1,1999. See USITC, “Note,” Production Sharing: Use of U.S. Components and Materialsin Foreign Assembly Operations, 1994--1997 (U.S. Imports Under theProduction--Sharing Provisions of Harmonized Tariff Schedule Chapter 98), (inv No.332--237), USITC Pub. 3146, Dec. 1998.
166 U.S. total trade with Mexico alone expanded at an average annual rate of 8.6percent to $16.4 billion while that with Canada expanded by 3.4 percent to $31.9 billion.
167 During 1994--2001, exports to Mexico increased by 57 percent to $8.6 billionand that to Canada increased by 38 percent to $15.5 billion.
220
fabricated iron or steel metal products accounted for most of the growth toCanada. The leading exports to Mexico were insulated electric conductorsalong with iron and steel and fabricated articles of iron or steel. U.S. importsfrom both countries increased by 37 percent, to $24 billion.168 The growth ofimports from Mexico tended to span a wide variety of mineral and metalproducts led by insulated electric conductors, valves, and fabricated articlesof iron or steel.169 As with the U.S.-Canada FTA, aluminum and fabricatedarticles of iron or steel accounted for most of the import growth fromCanada.
Uruguay RoundThe Uruguay Round Agreement likely had a minimal effect on sector trade.
The movement of U.S. manufacturing to developing countries with morecompetitive production costs as discussed in the overview, and the bilateralagreements between the United States, Canada, and Mexico most likely had thegreatest impact on trade through 2001.170 Nontariff barriers that continue to bea significant impediment to the steel industry are trade-distorting subsidies,which are being addressed in, among other places, the Organization forEconomic Co-Operation and Development (OECD).171
During 1995-2001, U.S. total trade in mineral and metal products grew atan average annual rate of 2.2 percent to $120 billion. U.S. exports increased by5 percent to $46 billion in 2001 and imports increased by 20 percent to $74billion (table 5-16). A wide range of sector products comprised this growth, ofwhich fabricated articles of iron and steel led the rise in exports.Platinum-group metals (PGM) and fabricated iron or steel products were theoverwhelming product leaders in import growth, each recording an increase ofjust over $3 billion. However, unlike most fabricated iron or steel products,PGMs entered the United States duty-free before the enactment of thisagreement.172 Globalization and growing competition in developing countries
168 During 1994--2001, imports from Mexico increased by 110 percent to $7.8billion and imports from Canada increased by 17 percent to $16.3 billion.
169 Mineral and Metal Products showing the largest trade growth, insulated electricconductors and valves, are major products of U.S./Mexico production sharing operations.See Production Sharing: Use of U.S. Components and Materials in Foreign AssemblyOperations, 1994--1997, pp. 3--39 to 3--53.
170 Canada and Mexico have been the dominant U.S. trading partners during theperiod.
171 OECD, OECD High Level Meeting on Steel: Progress Made on CuttingSubsidies, Overcapacity, Dec. 19, 2002, found athttp://www.oecd.org/oecd/pages/document/print_template/0,3371,EN--document--39--nondirector..., retrieved Mar. 7, 2003.
172 The increase in PGM imports was due primarily to the sustained demand of theautomotive and electronic industries for the product’s unique catalytic and electricalproperties. Having only one PGM mining operation, the United States is almost totallydependent on import sources, primarily from South Africa and Russia.
221
led to some shifting among top U.S. trading partners for this sector. AlthoughCanada and Japan dominated U.S. trade before enactment of this UruguayRound Agreement, Japan’s relative importance was overshadowed by Mexicoin 1994 and again by China in 2001. Together, these four countries–Canada,Mexico, China, and Japan–173 accounted for 52 percent of sector total tradein 2001, a 4 percentage point increase since 1995.
Views of Interested Parties
American Restaurant China Council174
The American Restaurant China Council (ARCC) is a trade association thatrepresents a substantial majority of U.S. Commercial Chinaware production.175The ARCC member companies are Buffalo China, Inc., The Hall ChinaCompany, and The Homer-Laughlin China Company.
Tokyo and Uruguay RoundsThe Tokyo and Uruguay Round tariff reductions led to large surges of
low-priced imports that eroded U.S. market share for commercial chinaware.Following the Tokyo Round tariff reduction on commercial chinaware from48-percent to 35-percent, product imports increased more than eightfold tonearly five million dozens during 1979-1994. These imports captured asubstantial share of the U.S. market, resulting in either the transfer or shutdown of a number of U.S. manufacturers operations and the loss of hundredsof American jobs. Imports continued to increase during the Uruguay Roundtariff reduction staging to over 6.8 million dozens by year end 2000, droppingto 5.8 million dozens in 2001 due to the U.S. economic slowdown. This flowof U.S. imports is not offset by significant U.S. export opportunities duelargely to high tariff rates overseas, onerous testing and certificationrequirements, and national preferences to buy domestic production, particularlyin Europe.
The U.S. Government has historically recognized that commercialchinaware is an import sensitive product by limiting the industry’s tariffreduction requirements during the Tokyo Round and by granting a 10-year
173 Listed in decreasing order of value of total trade with the United States in 2001.174 Susan Esserman and Melanie Schneck, Steptoe & Johnson, LLP on behalf of the
American Restaurant China Council, written submission to the Commission, February14, 2003.
175 Commercial chinaware (HTS 6911.10.10 and HTS 6912.00.20) is “especiallydesigned for use by hotels, restaurants, and other commercial establishments andinstitutions that require stronger, thicker, more durable and more sanitary chinaware.”
222
staged reduction in the Uruguay Round.176 During this time, the industrymade significant capital improvement investments to lower production costsand increase efficiency in an effort to ensure its future competitiveness.However, the commercial chinaware market remains intensely price sensitiveand any future tariff elimination or accelerated tariff reduction would threatenthe U.S. industry’s survival. ARCC also states that maintaining import tariffsfor commercial chinaware would have no discernible effect on consumers(restaurants and hotels) because it is generally recognized that the cost ofchinaware represents an insignificant part of their (the consumers’) operatingcosts.
Nucor Corporation and TXI Chaparral Steel177Nucor Corporation (Nucor) and TXI Chaparral Steel (Chaparral) are two of
the largest steel producers in the United States. Nucor produces a variety offlat-rolled and long products and Chaparral produces only long products,including beams, hot-rolled bar, and rebar.
NAFTA and the URA have provided foreign exporters and investorsgreater access to the U.S. market, but reciprocating benefits for U.S. exportersand investors have not reached full potential. Nucor and Chaparral contend thatmany developing countries maintain high import tariffs on products such assteel even though their producers are in a position to effectively “competeinternationally without protection.” These producers have the advantage of aprotected home market from which to penetrate other markets, particularly theUnited States. Further, most developed countries have made it more difficult, ifnot impossible, for U.S. producers to enter their markets by replacing hightariffs with non-tariff barriers, including the use of restrictive technicalstandards and by tolerating anti-competitive practices by local industries. Untilthese nontariff barriers are effectively addressed, the U.S. industry willcontinue to reap far less advantage from trade agreements than intended.
NAFTA has given rise to the “circumvention of antidumping orders.”Structural steel beams from Japan and Korea are being transshipped throughCanada to circumvent antidumping orders in the United States.178 Although
176 The U.S. Government limited the tariff reduction to no more than 25 percent ofthe original tariff during the Tokyo Round. Ten--year staged reductions were alsoprovided under NAFTA, and more recently the U.S.--Jordan Free Trade Agreement.Also, the U.S. Government refused to review petitions to include commercial chinawareto the Generalized System of Preference during the 1984, 1986, 1987, 1990, 1991 and1992 review exercises.
177 Alan H. Price and John R. Shane, Wiley Rein and Fielding LLP, on behalf ofNucor Corporation and TXI Chaparral Steel written submission to the Commission, Mar.31, 2003.
178 The antidumping orders specifically cover merchandise that has been drilled,punched, notched, painted, coated, or clad and include products classified under theHarmonized Tariff Schedule numbers 7216.32, 7216.33, 7216.50--7216.99,7228.70.3040, and 7228.70.6000.
223
there is no production of beams in Canada, U.S. imports of product fromCanada were valued at $2.3 million and $2.1 million in 2001 and 2002,respectively. This is a two-fold problem that provides the means andincentive for foreign producers and exporters to circumvent such U.S. dutyorders by transshipping subject merchandise through Canada and Mexico.First, NAFTA does not provide for common enforcement of antidumping andcountervailing duty orders. Second, there are NAFTA rules for establishingNAFTA origin for merchandise, but there is no mechanism “for ensuring thatthe country of origin merchandise imported into one NAFTA country is notaltered before the merchandise is re-exported to another NAFTA country.”Nucor and Chaparral recommend amending NAFTA to correct theseproblems without relinquishing the current practice of allowing NAFTAmembers to impose antidumping/countervailing duties on imports from otherNAFTA members.
Specialty Steel Industry of North America179
Specialty Steel Industry of North America (SSINA) is an associationrepresenting virtually all North American specialty steel producers. Specialtysteels are high technology, high value stainless and other specialty alloyproducts.
The objectives of the subject trade agreements–opening markets andadopting trade laws that ensure free and fair trade between these markets,including the zero for zero gradual phase-out of tariffs on steel products underthe Uruguay Round Agreements–have not been met for U.S. manufacturingindustries, including SSINA.
Tokyo RoundThe Tokyo Round Agreements were a major step in determining
international dumping and subsidy rules, and U.S. implementation of thisagreement afforded domestic specialty steel producers the opportunity to seekeffective redress against unfair trade practices.
Uruguay RoundThe Tokyo Round trade laws governing dumping and subsidization have
been significantly modified and weakened to the detriment of U.S.manufacturing industries by subsequent Uruguay Round Agreements and bythe World Trade Organization (WTO) Dispute Settlement Body’s interpretationof the agreements. URA modifications have resulted in a noticeable reduction
179 David A. Hartquist and Kathleen W. Cannon, Collier Shannon Scott, PLLC, onbehalf of the Specialty Steel Industry of North America (SSINA), written submission tothe Commission, Mar. 31, 2003.
224
in dumping margins, permissible subsidy practices formerly prohibited, andearly termination of certain orders under sunset review. Further, the WTODispute Settlement Body has used the settlement process to legislate andmake decisions on issues not agreed to by GATT Contracting Parties duringthe Uruguay Round negotiations, which overturn U.S. laws as well as manylong-established practices and methodologies. The U.S. Congress andAdministration should not permit further weakening of the laws addressingunfair trade practices as proposed in the current Doha Round of Negotiationsby a group of countries calling themselves by the misleading name ofFriends of Antidumping.
Tile Council of America, Inc.180The Tile Council of America, Inc. (TCA) is an association comprising over
40 manufacturers of ceramic tiles and related products that manufacture over50 percent of the ceramic tile produced in the United States.
Despite a tripling in U.S. demand for ceramic tile since the Tokyo Round,the cumulative impact of the five trade agreements under study in thisinvestigation have contributed to the precarious condition of the U.S. ceramictile industry. The tariff reduction provisions of these agreements, particularlythe Uruguay Round Agreement and NAFTA have encouraged large quantitiesof low-priced imports and are a major factor in the severe erosion of the U.S.industry’s market share. Between 1979, the year before the Tokyo Roundagreements entered into force, and the third quarter of 2002, import penetrationfor ceramic tile increased by 31 percentage points in terms of quantity to arecord high of 77 percent. Since 1995, following the enactment of the UruguayRound Agreement and NAFTA, U.S. consumption of ceramic tile increased by46 percent and increased imports have captured 100 percent of this growth.The growth in import penetration is largely due to price-cutting by bothtraditional and newer import sources, as demonstrated by an 18-percentdecrease in the average unit value of glazed ceramic tile imports.
Longer term staged reductions for tariffs on ceramic tile were negotiatedunder the Uruguay Round Agreement and NAFTA, in part, to provide U.S.manufacturers a period of time to make significant competitive investments inan effort to differentiate their products and minimize competition withlow-priced commodity grade imports. The TCA now questions the viability andlikely payback of these investments in light of ever increasing low-pricedimports that have suppressed prices to the point of driving many U.S.producers out of business. They report that during 2001-2002, four U.S.producers have gone out of business and two additional plants have closed. TheU.S. ceramic tile council would be seriously prejudiced by further tariffreductions or concessions and should, therefore, be excluded from such futuretrade negotiations.
180 Juliana M. Cofrancesco and John F. Bruce, Howrey, Simon, Arnold, and Whiteon behalf of the Tile Council of America, Inc. (TCA) written submission to theCommission, Feb. 14, 2003.
225
Western Economic Analysis Center181
Lower U.S. tariffs across the board have “adversely affected” the U.S.“basic copper industry by lowering the price to domestic users of importedcopper,” but they also helped to reduce U.S. production costs by “lowering thecosts of imported supplies and equipment used by domestic copper miningfirms.” Other government policies, both foreign and domestic, have had agreater negative impact on the industry than lower tariffs. For example,financial inducements to overseas investment and measures that have madecheaper capital available to competing foreign copper producers had a muchmore significant and harmful impact on domestic producers than any relaxingof trade barriers because they provided no advantageous offset for the domesticindustry. The compliance deadlines imposed by regulatory agencies required anumber of producers to take on large amounts of debt financing, which forcedcertain economically viable operations out of business.
The competitiveness of the domestic copper industry has been furthereroded by Federal regulatory policies that create wilderness areas, whichprecluded the commercial use of economically viable copper deposits, andpollution controls that require large capital investments. Further, the lack of aneffective antitrust policy to enforce existing legislation has resulted in a rash ofmergers and acquisitions of copper producers by non-copper producers after1976 that seriously weakened the domestic industry. More recently, foreigncorporate and financial interests in U.S. production facilities have been allowedto make U.S. production decisions that do not necessarily benefit U.S. capital,labor, or consumer interests.
Transportation Equipment182
OverviewThe United States is the world’s leading single-country producer and
consumer of transportation equipment. In particular, the United States is aglobal leader in the production of motor vehicles and related equipment,commercial and military aircraft, and guided missiles and space vehicles.Motor vehicles and related equipment accounted for between 56.1 and71.0 percent of the value of U.S. transportation equipment shipments during1978-2001, and aircraft and parts accounted for between 15.9 and 28.1 percent
181 George F. Leaming, Director, Western Economic Analysis Center, writtensubmission to the Commission, Mar. 31, 2003.
182 For the purposes of this investigation, transportation equipment comprises SIC37, which includes motor vehicles and motor vehicle equipment; aircraft and parts; shipand boat building and repairing; railroad equipment; motorcycles, bicycles, and parts;guided missiles and space vehicles and parts; and other miscellaneous transportationequipment.
226
(table 5-20).183 Throughout the period, the guided missiles and spacevehicles subsector vied with the ship and boat building and repair subsectorfor third place. The United States is not a global leader in the shipbuildingor railroad subsectors. The U.S. shipbuilding sector accounted for less than1 percent of global shipments in 2001,184 and no passenger railcars wereproduced in the United States. Freight cars are largely traded among the U.S.and Canadian subsidiaries of U.S. companies. The motorcycle and bicyclesubsectors are very small parts of the U.S. transportation equipment sector.185
The United States is a leading world producer of heavyweight motorcycles,with the U.S. motorcycle industry enjoying worldwide brand recognition.However, the industry is currently facing capacity constraints. Most massmerchandise bicycle production has moved overseas.186
The U.S. transportation equipment industry is composed of thousands ofmanufacturers. Typically, in subsectors such as motor vehicles and aircraft, theU.S. industry is quite concentrated, while the industries supplying parts to thesesectors comprise thousands of firms of varying sizes. Many of the largecompanies in the transportation equipment sector are multinationals thatproduce and source globally. Most of the transportation equipment sectors havegrown since the implementation of the Tokyo Round, while changingsignificantly in response to trends in globalization, restructuring, legislation,and intense international competition.
The competitiveness of the U.S. transportation equipment industry issupported by significant investment in research and development, sophisticatedmanufacturing capabilities, and an educated and technically skilled workforce.Strong domestic demand for transportation equipment products, coupled withintense foreign competition in the U.S. market, has also contributed to thecompetitiveness of the U.S. industry. Some transportation equipment sectors,most notably the automotive industry, have engaged in production-sharingarrangements involving lower wage countries such as Mexico. Further, theoutsourcing of major components to suppliers who offer modules withcompletely installed systems has become prevalent in the automotive andaircraft sectors.
Overall, shipments for the transportation equipment sector fluctuated during1978-2001, with sustained periods of growth during 1982-89, 1991-95, and1996-99. Sector shipments increased at an average annual rate of just 1 percentduring the period and were 25.3 percent higher in 2001 than in 1978. Labor
183 Because of the dominance of these two subsectors, much of the subsequentdiscussion will focus on these industries, as noted.
184 Maritime Business Strategies LLC, “Shipbuilding Statistics,” found athttp://www.coltoncompany.com/shipbldg/statistics/world.htm, retrieved Aug. 15, 2002.
185 The United States is an important producer of pleasure boats; however, this is avery small part of the transportation equipment sector.
186 U.S. Department of Commerce, ITA, U.S. Industry and Trade Outlook (NewYork: The McGraw--Hill Companies, 2000), pp. 39--15 to 39--19.
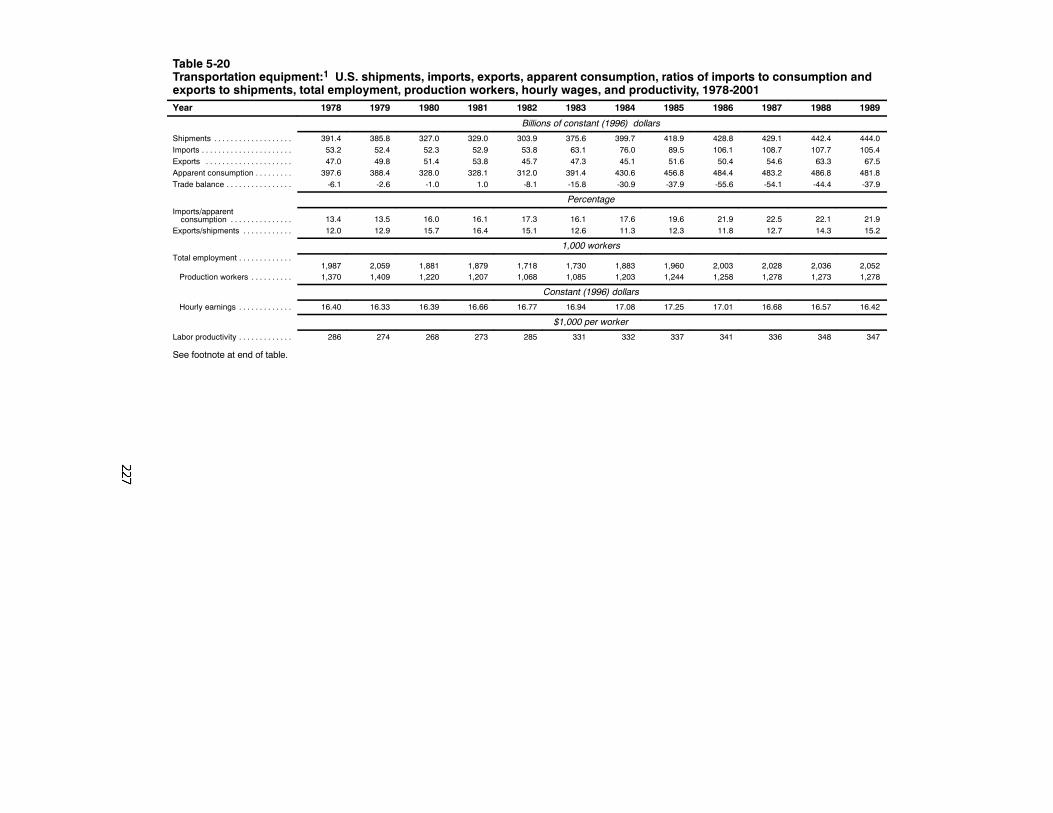
Table 5-20Transportation equipment:1 U.S. shipments, imports, exports, apparent consumption, ratios of imports to consumption andexports to shipments, total employment, production workers, hourly wages, and productivity, 1978-2001Year 1978 1979 1980 1981 1982 1983 1984 1985 1986 1987 1988 1989
Billions of constant (1996) dollars
Shipments . . . . . . . . . . . . . . . . . . . 391.4 385.8 327.0 329.0 303.9 375.6 399.7 418.9 428.8 429.1 442.4 444.0Imports . . . . . . . . . . . . . . . . . . . . . . 53.2 52.4 52.3 52.9 53.8 63.1 76.0 89.5 106.1 108.7 107.7 105.4Exports . . . . . . . . . . . . . . . . . . . . . 47.0 49.8 51.4 53.8 45.7 47.3 45.1 51.6 50.4 54.6 63.3 67.5Apparent consumption . . . . . . . . . 397.6 388.4 328.0 328.1 312.0 391.4 430.6 456.8 484.4 483.2 486.8 481.8Trade balance . . . . . . . . . . . . . . . . -6.1 -2.6 -1.0 1.0 -8.1 -15.8 -30.9 -37.9 -55.6 -54.1 -44.4 -37.9
PercentageImports/apparentconsumption . . . . . . . . . . . . . . . 13.4 13.5 16.0 16.1 17.3 16.1 17.6 19.6 21.9 22.5 22.1 21.9
Exports/shipments . . . . . . . . . . . . 12.0 12.9 15.7 16.4 15.1 12.6 11.3 12.3 11.8 12.7 14.3 15.2
1,000 workersTotal employment . . . . . . . . . . . . .
1,987 2,059 1,881 1,879 1,718 1,730 1,883 1,960 2,003 2,028 2,036 2,052Production workers . . . . . . . . . . 1,370 1,409 1,220 1,207 1,068 1,085 1,203 1,244 1,258 1,278 1,273 1,278
Constant (1996) dollars
Hourly earnings . . . . . . . . . . . . . 16.40 16.33 16.39 16.66 16.77 16.94 17.08 17.25 17.01 16.68 16.57 16.42
$1,000 per worker
Labor productivity . . . . . . . . . . . . . 286 274 268 273 285 331 332 337 341 336 348 347
See footnote at end of table.
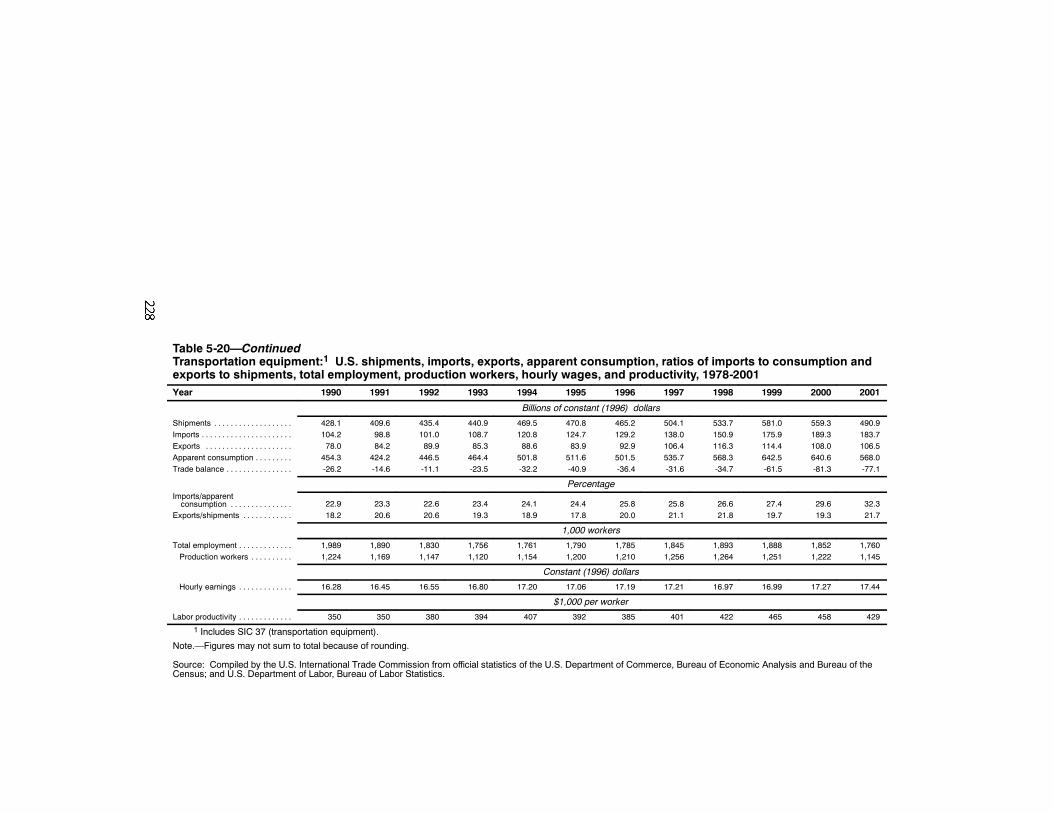
Table 5-20—ContinuedTransportation equipment:1 U.S. shipments, imports, exports, apparent consumption, ratios of imports to consumption andexports to shipments, total employment, production workers, hourly wages, and productivity, 1978-2001Year 1990 1991 1992 1993 1994 1995 1996 1997 1998 1999 2000 2001
Billions of constant (1996) dollars
Shipments . . . . . . . . . . . . . . . . . . . 428.1 409.6 435.4 440.9 469.5 470.8 465.2 504.1 533.7 581.0 559.3 490.9Imports . . . . . . . . . . . . . . . . . . . . . . 104.2 98.8 101.0 108.7 120.8 124.7 129.2 138.0 150.9 175.9 189.3 183.7Exports . . . . . . . . . . . . . . . . . . . . . 78.0 84.2 89.9 85.3 88.6 83.9 92.9 106.4 116.3 114.4 108.0 106.5Apparent consumption . . . . . . . . . 454.3 424.2 446.5 464.4 501.8 511.6 501.5 535.7 568.3 642.5 640.6 568.0Trade balance . . . . . . . . . . . . . . . . -26.2 -14.6 -11.1 -23.5 -32.2 -40.9 -36.4 -31.6 -34.7 -61.5 -81.3 -77.1
PercentageImports/apparentconsumption . . . . . . . . . . . . . . . 22.9 23.3 22.6 23.4 24.1 24.4 25.8 25.8 26.6 27.4 29.6 32.3
Exports/shipments . . . . . . . . . . . . 18.2 20.6 20.6 19.3 18.9 17.8 20.0 21.1 21.8 19.7 19.3 21.7
1,000 workers
Total employment . . . . . . . . . . . . . 1,989 1,890 1,830 1,756 1,761 1,790 1,785 1,845 1,893 1,888 1,852 1,760Production workers . . . . . . . . . . 1,224 1,169 1,147 1,120 1,154 1,200 1,210 1,256 1,264 1,251 1,222 1,145
Constant (1996) dollars
Hourly earnings . . . . . . . . . . . . . 16.28 16.45 16.55 16.80 17.20 17.06 17.19 17.21 16.97 16.99 17.27 17.44
$1,000 per worker
Labor productivity . . . . . . . . . . . . . 350 350 380 394 407 392 385 401 422 465 458 429
1 Includes SIC 37 (transportation equipment).
Note.—Figures may not sum to total because of rounding.
Source: Compiled by the U.S. International Trade Commission from official statistics of the U.S. Department of Commerce, Bureau of Economic Analysis and Bureau of theCensus; and U.S. Department of Labor, Bureau of Labor Statistics.
229
productivity for the sector followed a similar trend, with sustained growthduring 1980-86, 1989-94, and 1996-99. The average annual increase forproductivity during the period was 1.8 percent. Employment fluctuated during1978-2001; total employment hit a period low in 1982 at 1,718,000, andpeaked in 1989 at 2,052,000 workers. Most of the industries in thetransportation equipment sector are largely unionized. Overall, employmentdecreased by 11.4 percent during 1978-2001, which corresponds to the25.4-percent increase in the value of shipments and the resulting 50.0-percentimprovement in productivity. Hourly wage rates fluctuated during 1978-2001,with protracted periods of growth during 1979-85 and 1990-94. For theperiod, hourly wage rates rose by $1.04 (6.3 percent) to $17.44 in 2001.
The automotive industry, the lead transportation equipment subsector interms of shipments and trade, is global. U.S.-headquartered andforeign-headquartered automakers and partsmakers produce vehicles andcomponents all over the world. Owing to its strong international presence, theU.S. motor vehicle sector is not heavily reliant on exports. Local productionstrategies have developed for a variety of reasons, including trade barriers inforeign markets, wage rates, and enhanced ability to respond to local consumerpreferences.187 In addition, U.S. automakers in recent years have endeavored toimprove their competitiveness in certain markets and round out their productofferings through joint ventures and equity tie-ups.
The U.S. auto industry has consolidated somewhat during the period.Chrysler’s acquisition of American Motors Corp. in 1987 reduced the numberof U.S.-based automakers to three–General Motors Corp. (GM), Ford MotorCo., and Chrysler Corp. Subsequently, Chrysler itself became a subsidiary ofDaimlerChrysler of Germany in 1998. The supplier segment of the industry hasalso consolidated considerably. Efforts to increase efficiency led to a reductionin the degree of vertical integration in the U.S. motor vehicle industry,evidenced by the divestiture by GM and Ford of their in-house parts operationsin May 1999 and June 2000, respectively. Traditionally, major motor vehicleproducers have used vertical integration to coordinate the complicated processof designing and building motor vehicles. Today, most major motor vehicleproducers worldwide, particularly those in the car and light truck segments,still produce most of their own engines, transmissions, and body stampings.For other components, motor vehicle producers rely on anywhere from severalhundred to several thousand suppliers.
The U.S. industry has made extensive use of production-sharing operations,and the entire North American industry has become highly integrated. Theclose integration of the U.S. and Canadian auto industries was greatly furthered
187 For more information on nontariff barriers, see Office of Automotive Affairs,U.S. Department of Commerce, “World Motor Vehicle Import Requirements,” Aug.2001, found at http://www.ita.doc.gov/td/auto/impreq.html.
230
by the 1965 U.S.-Canada Automotive Products Trade Agreement (APTA).188
The APTA established a “conditional free-trade zone” between the UnitedStates and Canada for motor vehicles and original equipment parts, withspecified local content and other requirements. This integration has resultedin significant production rationalization, intra-industry trade, and trade inintermediate goods. Also in 1965, the Mexican Congress approved the BorderIndustrialization Program, or Maquiladora Program, allowing duty-free entryof components and materials used to assemble vehicles and parts for exportmarkets. Subsequently, NAFTA liberalized trade and investment rules,thereby encouraging the rationalization of production and contributing to thecompetitiveness of the North American automotive industry.
A number of U.S. Government regulations in the automotive sector shapedthe industry during 1978-2001. The most prominent of these includeregulations on fuel economy stemming from the 1973-74 oil embargo andenergy supply crisis, and the Clean Air Act of 1970,189 which gave theEnvironmental Protection Agency (EPA) broad authority to regulate motorvehicle emissions. Vehicle emissions are being further reduced by provisions ofthe 1990 Clean Air Act Amendments,190 and several States have mandatedemissions standards more stringent than those enforced by the EPA.Regulations regarding safety and labeling also played a role in the developmentof the industry during the period. Safety and fuel economy regulations havedriven U.S. motor vehicle industry research and development,191 enhancing theU.S. auto industry’s ability to compete with imported vehicles, particularly withrespect to fuel economy. Regulations requiring passenger motor vehiclesmanufacturers to label their vehicles with domestic and foreign contentinformation enable consumers to take country-of-origin information intoaccount in deciding which vehicle to purchase. To the extent to whichautomakers believe that country of origin is important to U.S. consumers,labeling regulations may encourage the use of U.S. and Canadian inputs.
During 1978-2001, the U.S.-based auto industry lost domestic market shareto foreign–most notably Japanese–brands. In 1978, traditional U.S. automakersGM, Ford, Chrysler, and American Motors accounted for approximately 84percent of retail sales of passenger cars and light trucks;192 in 2001, GM, Ford,and Chrysler vehicles accounted for approximately 65 percent of retail sales.193
188 17 UST 1372, TIAS No. 6093. For more information, see Dennis DesRosiers,“Auto Pact II,” DesRosiers Automotive Reports, vol. 15, Issue 3, Feb. 28, 2001, found athttp://www.desrosiers.ca, retrieved Mar. 28, 2002.
189 P.L. 91--604, Dec. 31, 1970, 84 Stat. 1676.190 P.L. 101--549, Nov. 15, 1990, 104 Stat. 2399.191 For more information, see the Alliance of Automobile Manufacturers’ website, at
http://www.autoalliance.org/.192 Ward’s Communications, e--mail communication to USITC staff, Oct. 28, 2002.193 Ibid.
231
The oil crisis in the 1970s had a major effect on import penetration in theU.S. passenger vehicle market. Small, fuel-efficient Japanese vehicles morethan doubled their share of the U.S. market; from 12 percent in 1975 to 27percent in 1980. U.S. automakers lost billions of dollars during this period, andlayoffs were in the hundreds of thousands. On April 30, 1981, the U.S. andJapanese Governments announced a voluntary restraint agreement (VRA) onJapanese exports of passenger vehicles to the United States. While the U.S.Government did not request an extension of the agreement in 1985, theJapanese Government voluntarily continued the program, with limitadjustments, until 1994. The VRA provided an impetus for Japaneseautomakers to establish a manufacturing presence in the United States, becauseJapanese vehicles manufactured in the United States were exempt from theVRA.194 The first Japanese plant–Honda’s facility in Marysville, OH–wasestablished in 1982; by 2001, there were 9 plants (two are joint ventures withU.S. automakers) producing 2.4 million vehicles in the United States, with anadditional 6 Japanese plants producing 2.2 million engines in the United States.Total Japanese automotive employment in the United States in 2001 reached48,000.195 According to the Japanese Automobile Manufacturers Association,64 percent of the vehicles sold in the United States by Japanese automakers in2001 were produced in North America, up from 12 percent in 1986.196 Twelveyears after Japanese automakers began assembling vehicles in the UnitedStates, European automaker BMW opened a U.S. plant in South Carolina,followed by Mercedes-Benz in Alabama in 1997.
In 1995, the United States and Japan signed the U.S.-Japan Agreement onAutos and Auto Parts.197 As part of the agreement, the Government of Japanmade commitments in three important areas: improving market access forforeign motor vehicles; eliminating regulations that limit U.S. auto parts salesin Japan; and enhancing sales opportunities for U.S. original equipment partsproducers with Japanese automakers in the United States and Japan.Subsequent bilateral consultations yielded commitments in other areas byJapan. Although acknowledging some progress over the life of the Agreement,the United States expressed concern that the overall market access objectives ofthe Agreement were not met, noting decreases in U.S. exports of vehicles and
194 Localized production allows Japanese automakers to remain responsive to U.S.market developments, alleviate potential trade friction, and dramatically reducetransportation costs. For more information, see Political Economy Research Center,“Voluntary export restraints on automobiles,” PERC Reports---Tangents, Sept. 1999,found at http://www.perc.org/publications/percreports/tang_sept1999.html.
195 Japan Automobile Manufacturers Association, “Japan’s Automobile Manufac-turers: Global Companies Meeting New Challenges with Advanced Technologies,”found at http://www.jama.org, retrieved Oct. 29, 2002.
196 Ibid.197 International Legal Materials, Nov. 1995; 34 ILM 1372.
232
parts to Japan.198 The United States stated that, the weak Japanese economynotwithstanding, more could be done to improve access and competition inthe Japanese market.199 The Agreement expired without a continuance orreplacement at the end of 2000.200
The other important subsector in the transportation equipment sectorencompasses aircraft and parts. The competitive position of the U.S. civilaerospace sector declined during 1978-2001. While general aviation aircraftshipments increased during the 1990s, U.S. market share for large civil aircraft(LCA) and helicopter shipments has declined. Military aircraft have also beenshipped in fewer numbers, while shipments of space vehicles have increased.While there were three U.S. manufacturers producing LCA at the beginning ofthe period, Boeing, McDonnell Douglas, and Lockheed, there was only one in2001; Boeing merged with McDonnell Douglas in 1997, and Lockheed stoppedmanufacturing LCA in 1985. Likewise, five U.S. companies manufacturingfighter aircraft in 1978 were reduced to two by 2001. There has been aconsiderable rise in foreign competition in the helicopter and LCA sectorsduring the period.
The U.S. aircraft parts industry has also changed, as its principal customers(airframe manufacturers) seek new methods of cost reduction. New businesspractices have been adopted in reaction to customer demand; most notably, risksharing has been more widely adopted in contract negotiations. The rise of risksharing among aircraft manufacturers and their suppliers has led toconsolidation of the supplier base, which has helped suppliers acquire thecritical financial mass necessary to meet new contract demands while retainingthe ability to stay in business over the long haul. Similar to the auto industry,aircraft suppliers are increasingly taking on supply chain managementresponsibilities, including systems integration and the coordination of moduleassembly.201
There have been a number of important regulatory changes during theperiod that have affected the aerospace sector. In 1978, the U.S. Congresspassed the Airline Deregulation Act,202 which incrementally eliminated theCivil Aeronautics Board’s control over the allocation of air routes amongairlines and the regulation of airfares. The effect of this deregulation was
198 Office of the United States Trade Representative press release, “U.S. and JapanComplete Annual Review of Automotive Framework Agreement, U.S. Emphasizes Needfor Improved Market Access and Competition in Japan,” Nov. 29, 2000.
199 Ibid.200 On Oct. 18, 2001, the Governments of Japan and the United States announced
that they would form a bilateral Automotive Consultative Group that would meetannually.
201 For more information, please see USITC, Competitive Assessment of the U.S.Large Civil Aircraft Aerostructures Industry, inv. No. 332--414, USITC Pub. 3433, June2001.
202 P.L. 95--504, Oct. 24, 1978, 49 U.S. Code Sec. 1301, 1301 nt., 1302 et. seq.
233
manifold; for airlines, competition from existing and new companies becamefierce, passenger traffic boomed, and fares decreased. For airframemanufacturers, demand for aircraft increased steadily. The General AviationRevitalization Act (GARA),203 enacted in August 1994, provided tortreform204 and, in the view of many industry observers, much needed relief tothe industry.205 By the early 1990s, the general aviation sector of the aircraftindustry reportedly had lost over 100,000 jobs and production had declinedby 95 percent, and the lack of legal liability limits were a major contributingfactor to the industry’s decline.206 Since the enactment of GARA, generalaviation aircraft production in the United States has increased every year.
The 1992 U.S.-EU Agreement on Trade in Large Civil Aircraft207 limitsdirect and indirect government assistance to industry. This Agreement aimed tolevel the playing field for competition between the United States and Europe inthe sale of LCA208 by limiting the support that governments can provide forthe development, production, and sale of such aircraft209– support that can givecompanies a competitive advantage in domestic and international markets. TheAgreement entered into force on July 17, 1992 and has no expiration date.
Effect of Trade Agreements on the SectorConsidering the dominance of motor vehicles and related equipment in this
sector, NAFTA had the most obvious direct effect on the U.S. transportationequipment industry. However, much of the growth in production and trade thathas taken place in the U.S. transportation equipment industry since 1980 can beattributed to factors other than the five trade agreements that are the subject ofthis investigation. These factors include strong growth in demand, changes in
203 P.L. 103-298, Aug. 17, 1994, U.S. Code Sec. 40101 nt., P.L. 105-102, Nov. 20,1997, 49 U.S. Code Sec 40101 nt.
204 Liability Reform Coalition, Liability Reform Coalition Newsletter, Mar. 2000,found at http://www.walrc.org/Newsletters/newsletter03.html, retrieved Dec. 12, 2002.
205 For example, see National Business Aircraft Association press release, “NBAAExpresses Optimism For Enactment Of General Aviation Revitalization Act -- Glickman,Hansen And Kassebaum Commended For Tireless Efforts/Leadership,” June 24, 1994,found at http://web.nbaa.org/public/news/pr/1994/19940624--023.php and Civil JusticeAssociation of California press release,“Legal Reform Brings Remarkable Recovery toFresno--area General Aviation,” Feb. 15, 1996, found athttp://www.cjac.org/news/021596a.html, both accessed on July 30, 2003.
206 Ibid.207 EU Council Decision 92/496/EEC, OJ L 301, Oct. 17, 1992, p. 31.208 These aircraft are defined as having 100 or more passenger seats or weighing
more than 15,000 kg.209 For more information on this agreement, see USITC, Global Competitiveness of
U.S. Advanced--Technology Manufacturing Industries: Large Civil Aircraft, inv. No.332--332, USITC Pub. 2667, Aug. 1993, app. F.
234
industry structure and production strategies, and production-sharingarrangements. The Auto Pact has also had a major carry-through impact onthe transportation equipment industry during the period.
Although the subject trade agreements are not the primary factors drivingthe expansion of the motor vehicle sector, they have contributed to thatexpansion. Further, they have contributed substantially to the expansion oftransportation equipment industries other than motor vehicles and relatedequipment (i.e., aircraft and parts; ship and boat building and repair; railroadequipment; motorcycles, bicycles, and parts; guided missiles and space vehiclesand parts; and other miscellaneous transportation equipment). Of the fiveagreements, the Tokyo and Uruguay Rounds had the most profound effect onthese industries as a group, particularly with respect to U.S. exports. Table 5-21presents trade issues addressed by the subject trade agreements that wererelevant to the sector. Without the Tokyo and Uruguay Rounds, U.S. exports ofnon-automotive transportation equipment likely would have been measurablylower, while the additional removal of NAFTA, CFTA, and U.S.-Israel FTAwould yield little additional change in U.S. exports. Over the period underconsideration, the most significant increase in U.S. non-automotivetransportation equipment exports, by value and by percentage change, was inaerospace equipment (civil and military aircraft, spacecraft, and parts); suchexports increased by over $40 billion, or by well over 1,000 percent.
Tokyo RoundBetween 1980 (the year of the first stage of the Tokyo Round tariff
reductions) and 2001, total U.S. trade in transportation equipment increased atan average annual rate of 5.1 percent, reaching $290.2 billion. Total tradeincreased in every year except for 1982, 1995, and 2001. With the exception of1981, the United States has consistently run a trade deficit in transportationequipment. The $1-billion deficit in 1980 grew to $77.1 billion by 2001.
U.S. imports of transportation equipment increased from $52.3 billion to$183.7 billion during 1980-2001, an average annual increase of 6.2 percent.Sector imports slightly more than doubled during 1980-87, decreased during1988-91, and then increased 81.9 percent during 1992-2001. U.S. exports oftransportation equipment also rose during the period, albeit at a slower rate.U.S. exports of transportation equipment increased from $51.4 billion to $106.5billion during 1980-2001, an average annual increase of 3.8 percent. However,the trend in U.S. exports of transportation equipment was erratic, with exportsdeclining in 1982, 1984, 1986, 1993, 1995, and 1999-2001.
International trade became increasingly important during the 1980-2001period as the sector became more globalized. Moreover, production sharingoperations in the automotive sector, particularly in Mexico, expanded, and theintegration of the North American automotive industry, accelerated by NAFTA,also increased sector trade. Imports as a share of U.S. apparent consumptionincreased from 16.0 percent to 32.7 percent, while exports as a share ofshipments increased from 15.7 percent to 22.9 percent.
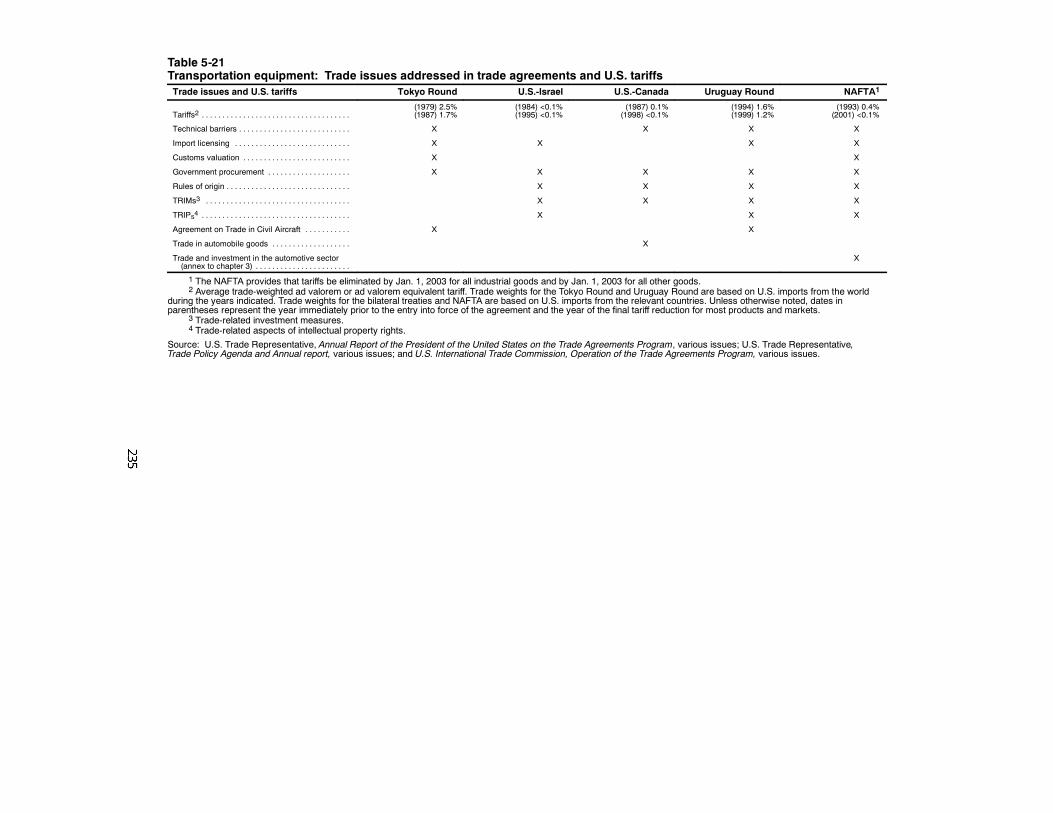
Table 5-21Transportation equipment: Trade issues addressed in trade agreements and U.S. tariffsTrade issues and U.S. tariffs Tokyo Round U.S.-Israel U.S.-Canada Uruguay Round NAFTA1
Tariffs2 . . . . . . . . . . . . . . . . . . . . . . . . . . . . . . . . . . . .(1979) 2.5%(1987) 1.7%
(1984) <0.1%(1995) <0.1%
(1987) 0.1%(1998) <0.1%
(1994) 1.6%(1999) 1.2%
(1993) 0.4%(2001) <0.1%
Technical barriers . . . . . . . . . . . . . . . . . . . . . . . . . . . X X X X
Import licensing . . . . . . . . . . . . . . . . . . . . . . . . . . . . X X X X
Customs valuation . . . . . . . . . . . . . . . . . . . . . . . . . . X X
Government procurement . . . . . . . . . . . . . . . . . . . . X X X X X
Rules of origin . . . . . . . . . . . . . . . . . . . . . . . . . . . . . . X X X X
TRIMs3 . . . . . . . . . . . . . . . . . . . . . . . . . . . . . . . . . . . X X X X
TRIPS4 . . . . . . . . . . . . . . . . . . . . . . . . . . . . . . . . . . . . X X X
Agreement on Trade in Civil Aircraft . . . . . . . . . . . X X
Trade in automobile goods . . . . . . . . . . . . . . . . . . . X
Trade and investment in the automotive sector(annex to chapter 3) . . . . . . . . . . . . . . . . . . . . . . .
X
1 The NAFTA provides that tariffs be eliminated by Jan. 1, 2003 for all industrial goods and by Jan. 1, 2003 for all other goods.2 Average trade-weighted ad valorem or ad valorem equivalent tariff. Trade weights for the Tokyo Round and Uruguay Round are based on U.S. imports from the world
during the years indicated. Trade weights for the bilateral treaties and NAFTA are based on U.S. imports from the relevant countries. Unless otherwise noted, dates inparentheses represent the year immediately prior to the entry into force of the agreement and the year of the final tariff reduction for most products and markets.
3 Trade-related investment measures.4 Trade-related aspects of intellectual property rights.
Source: U.S. Trade Representative, Annual Report of the President of the United States on the Trade Agreements Program, various issues; U.S. Trade Representative,Trade Policy Agenda and Annual report, various issues; and U.S. International Trade Commission, Operation of the Trade Agreements Program, various issues.
236
The effect of the Tokyo Round on the U.S. motor vehicle and partsindustry was modest, while the effect on other transportation equipment wasmore significant. U.S. tariffs on sector products were generally alreadyrelatively low prior to the agreement (table 5-37),210 and tariffs on theseproducts in many major foreign markets were generally also low.211 Theincreases in total transportation equipment trade during this period can beattributed to market factors212 as well as to Tokyo Round trade liberalization.
The plurilateral Agreement on Trade in Civil Aircraft (ATCA) was one ofthe most important components of the Tokyo Round for the sector. The ATCAprovided for the elimination of customs duties on civil aircraft and most partsand equipment of such aircraft, and also provided for the reduction orelimination of a number of nontariff measures, such as governmental subsidies,government-directed procurement, technical barriers, and import and exportlicensing requirements. However, certain ATCA provisions were eitherambiguous or lacking in sufficient specificity to ensure full internationalcompliance.213
For military aircraft, the Tokyo Round did reduce U.S. and major tradingpartner tariffs, but these were generally waived anyway. Moreover, governmentprocurement was identified as one of the greatest restrictions on trade inmilitary aircraft. However, the Tokyo Round agreement on governmentprocurement had little impact on this subsector for a number of reasons. First,the agreement was only binding between countries that chose to sign; second,the agreement allowed signatories to determine the products and servicescovered; third, the agreement only covered purchases over a certain monetary
210 One notable exception is the 25--percent U.S. tariff on most trucks, whichremains in effect.
211 U.S. motor vehicle exports to Canada, the leading market, were already largelyfree of duty as a result of the APTA, and Japan eliminated its tariffs on most motorvehicles unilaterally in 1978. The EEC did not make Tokyo Round tariff concessions onmost motor vehicles. Some market access gains were likely made as a result of tariffreductions in the motor vehicle parts sector. With respect to aircraft and parts, the otherleading transportation equipment subsector, import tariffs on commercial and militaryaircraft in major markets, which could be sizeable in some markets, were generallywaived because the importance of these aircraft in terms of economic health and nationalsecurity.
212 For example, in the aircraft industry, factors such as quality, financing, offsets,and delivery date are overwhelmingly more important to production and trade patternsthan multilateral trade agreements.
213 U.S. International Trade Commission, Agreements Being Negotiated at theMultilateral Trade Negotiations on Geneva, MTN Studies 6, Part 4, inv. No. 332--101(Washington, DC: U.S. GPO, 1979); and U.S. industry officials, interviews by USITCstaff, Dec. 18, 1992 and Feb. 18, 1993, in connection with USITC, GlobalCompetitiveness of U.S. Advanced--Technology Manufacturing Industries: Large CivilAircraft, inv. No. 332--332, USITC Pub. 2667, Aug. 1993, p. F--2.
237
value; fourth, developing signatory countries were permitted to negotiateoffsets; and fifth, the agreement did not cover actions taken in the interest ofnational security.214 As a result, signatories generally have not applied theagreement on government procurement to a large percentage of their defensepurchases.215 In the motor vehicles sector, significant foreign policy measuressuch as taxes based on engine size and complicated distribution systems werenot addressed; however, foreign tariff reduction commitments made bycertain major markets were beneficial to the U.S. motor vehicle partsindustry.216 For “railroad equipment and miscellaneous transportationequipment” (transportation equipment other than automotive and aerospace),the EC’s tariff concession on U.S. exports amounted to a 2.5 percentagepoint reduction on the applied rate, Canada’s reduction was 3.6 percentagepoints on the applied rate, and Japan’s reduction was 2.1 percentage points onthe applied rate.217
U.S.-Israel FTA218
Total U.S. trade with Israel in transportation equipment increased at anaverage annual rate of 6.0 percent during 1985-2001, reaching $1.7 billion.Trade with Israel changed very little, increasing from 0.5 percent of total U.S.trade in transportation equipment to 0.6 percent during the same period. U.S.exports of sector products to Israel increased by 137.3 percent to $1.2 billionduring 1985-2001, while U.S. imports from Israel increased by 184.4 percent to$499 million (table 5-22).
When the U.S.-Israel FTA was negotiated, the trade-weighted U.S. tariffrate on transportation equipment imports from Israel was less than one percentad valorem. The aircraft and parts subsector accounts for the largest share ofU.S. transportation equipment imports from and exports to Israel; most of thistrade is in civil products as opposed to military ones. U.S. exports of motorvehicles and parts to Israel increased substantially during the 1990s.
214 U.S. House of Representatives, Committee on Government Reform andOversight, “Foreign Offset Demands in Defense and Civil Aerospace Transactions,”Minority Staff Report, Oct. 23, 1998, p. 20.
215 Ibid.216 USITC, Agreements Being Negotiated at the Multilateral Trade Negotiations on
Geneva, MTN Studies 6, Part 5, Industry/Agriculture Sector Analysis, inv. No. 332--101(Washington, DC: U.S. GPO, 1979).
217 Office of the United States Trade Representative, Twenty--Fourth Annual ReportOf the President Of the United states On the Trade Agreements Program, 1979, p. 59.
218 The U.S.--Israel FTA was signed in 1985 and was fully implemented on Jan. 1,1995.
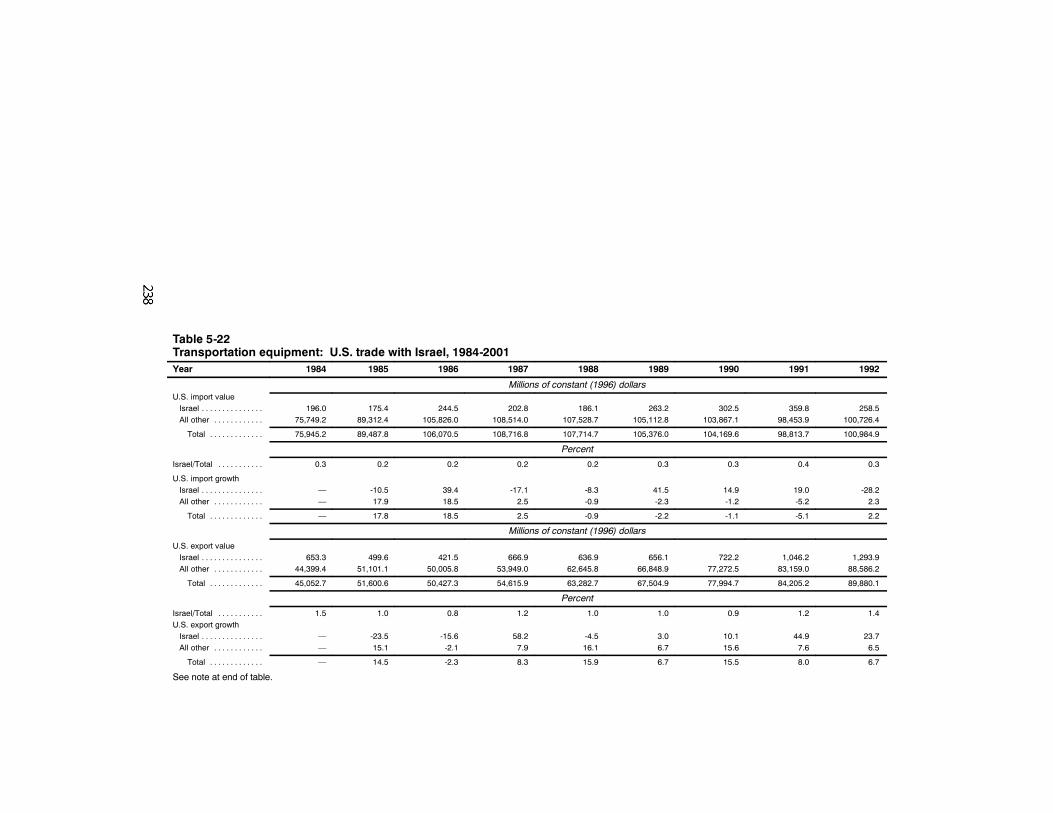
Table 5-22Transportation equipment: U.S. trade with Israel, 1984-2001Year 1984 1985 1986 1987 1988 1989 1990 1991 1992
Millions of constant (1996) dollarsU.S. import valueIsrael . . . . . . . . . . . . . . . 196.0 175.4 244.5 202.8 186.1 263.2 302.5 359.8 258.5All other . . . . . . . . . . . . 75,749.2 89,312.4 105,826.0 108,514.0 107,528.7 105,112.8 103,867.1 98,453.9 100,726.4
Total . . . . . . . . . . . . . 75,945.2 89,487.8 106,070.5 108,716.8 107,714.7 105,376.0 104,169.6 98,813.7 100,984.9
Percent
Israel/Total . . . . . . . . . . . 0.3 0.2 0.2 0.2 0.2 0.3 0.3 0.4 0.3
U.S. import growthIsrael . . . . . . . . . . . . . . . — -10.5 39.4 -17.1 -8.3 41.5 14.9 19.0 -28.2All other . . . . . . . . . . . . — 17.9 18.5 2.5 -0.9 -2.3 -1.2 -5.2 2.3
Total . . . . . . . . . . . . . — 17.8 18.5 2.5 -0.9 -2.2 -1.1 -5.1 2.2
Millions of constant (1996) dollars
U.S. export valueIsrael . . . . . . . . . . . . . . . 653.3 499.6 421.5 666.9 636.9 656.1 722.2 1,046.2 1,293.9All other . . . . . . . . . . . . 44,399.4 51,101.1 50,005.8 53,949.0 62,645.8 66,848.9 77,272.5 83,159.0 88,586.2
Total . . . . . . . . . . . . . 45,052.7 51,600.6 50,427.3 54,615.9 63,282.7 67,504.9 77,994.7 84,205.2 89,880.1
Percent
Israel/Total . . . . . . . . . . . 1.5 1.0 0.8 1.2 1.0 1.0 0.9 1.2 1.4U.S. export growthIsrael . . . . . . . . . . . . . . . — -23.5 -15.6 58.2 -4.5 3.0 10.1 44.9 23.7All other . . . . . . . . . . . . — 15.1 -2.1 7.9 16.1 6.7 15.6 7.6 6.5
Total . . . . . . . . . . . . . — 14.5 -2.3 8.3 15.9 6.7 15.5 8.0 6.7
See note at end of table.
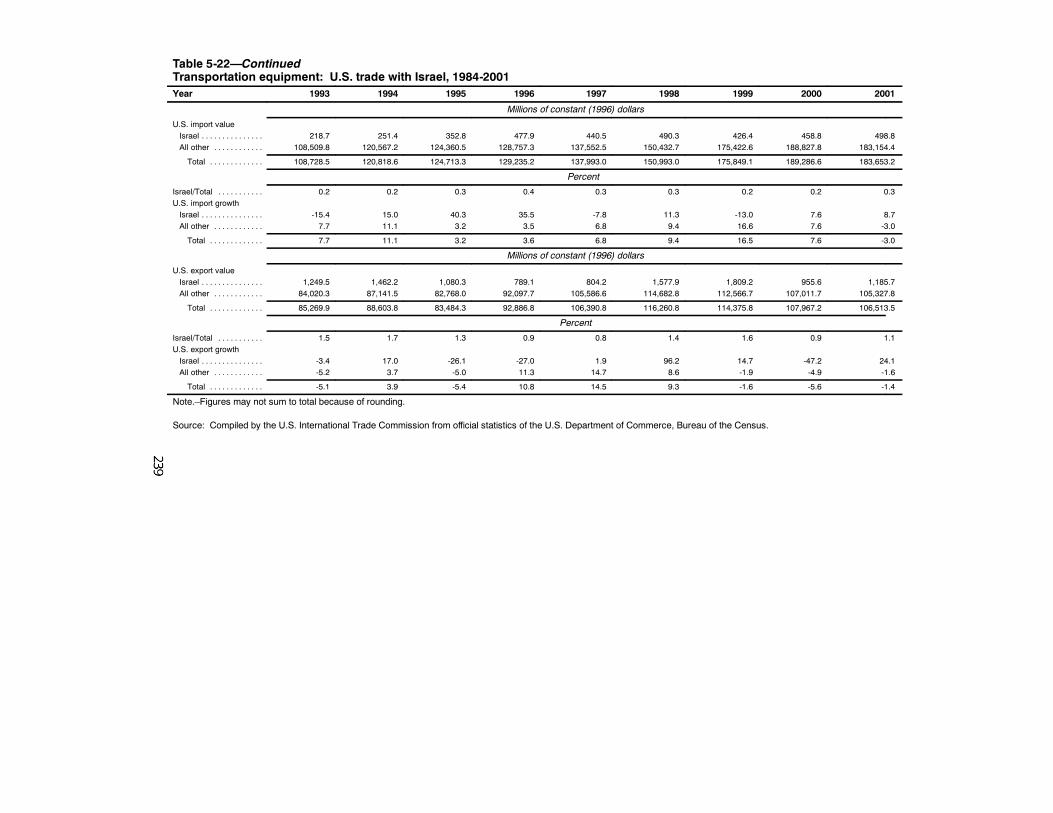
Table 5-22—ContinuedTransportation equipment: U.S. trade with Israel, 1984-2001Year 1993 1994 1995 1996 1997 1998 1999 2000 2001
Millions of constant (1996) dollars
U.S. import valueIsrael . . . . . . . . . . . . . . . 218.7 251.4 352.8 477.9 440.5 490.3 426.4 458.8 498.8All other . . . . . . . . . . . . 108,509.8 120,567.2 124,360.5 128,757.3 137,552.5 150,432.7 175,422.6 188,827.8 183,154.4
Total . . . . . . . . . . . . . 108,728.5 120,818.6 124,713.3 129,235.2 137,993.0 150,993.0 175,849.1 189,286.6 183,653.2
Percent
Israel/Total . . . . . . . . . . . 0.2 0.2 0.3 0.4 0.3 0.3 0.2 0.2 0.3U.S. import growthIsrael . . . . . . . . . . . . . . . -15.4 15.0 40.3 35.5 -7.8 11.3 -13.0 7.6 8.7All other . . . . . . . . . . . . 7.7 11.1 3.2 3.5 6.8 9.4 16.6 7.6 -3.0
Total . . . . . . . . . . . . . 7.7 11.1 3.2 3.6 6.8 9.4 16.5 7.6 -3.0
Millions of constant (1996) dollars
U.S. export valueIsrael . . . . . . . . . . . . . . . 1,249.5 1,462.2 1,080.3 789.1 804.2 1,577.9 1,809.2 955.6 1,185.7All other . . . . . . . . . . . . 84,020.3 87,141.5 82,768.0 92,097.7 105,586.6 114,682.8 112,566.7 107,011.7 105,327.8
Total . . . . . . . . . . . . . 85,269.9 88,603.8 83,484.3 92,886.8 106,390.8 116,260.8 114,375.8 107,967.2 106,513.5
Percent
Israel/Total . . . . . . . . . . . 1.5 1.7 1.3 0.9 0.8 1.4 1.6 0.9 1.1U.S. export growthIsrael . . . . . . . . . . . . . . . -3.4 17.0 -26.1 -27.0 1.9 96.2 14.7 -47.2 24.1All other . . . . . . . . . . . . -5.2 3.7 -5.0 11.3 14.7 8.6 -1.9 -4.9 -1.6
Total . . . . . . . . . . . . . -5.1 3.9 -5.4 10.8 14.5 9.3 -1.6 -5.6 -1.4
Note.–Figures may not sum to total because of rounding.
Source: Compiled by the U.S. International Trade Commission from official statistics of the U.S. Department of Commerce, Bureau of the Census.
240
U.S.-Canada FTAU.S. trade with Canada in transportation equipment increased at an average
annual rate of 3.5 percent during 1988-2001, reaching $89.8 billion (table5-23). Total U.S. trade with Canada in transportation equipment increased atapproximately the same average annual rate as total U.S. sector trade with therest of the world. U.S. exports of transportation equipment to Canada increased51 percent to $33.4 billion during 1988-2001, while U.S. imports of sectorproducts from Canada increased 59.2 percent to $56.4 billion. Canada replacedJapan as the leading source of U.S. sector imports in 1992 and remained thelargest supplier through 2001.
As the overwhelming portion of total transportation equipment importsfrom Canada and Japan is accounted for by motor vehicles and motor vehicleparts, the shift to Canada as the leading import source can be explained by theincreased integration of the U.S. and Canadian automotive industries that beganin 1965 with the APTA,219 as well as a stabilization of U.S. imports fromJapan during the late 1980s and early 1990s as Japanese automakers increasedtheir production in the United States. Therefore, it is likely that theU.S.-Canada FTA had a minor effect on U.S. transportation equipment sectortrade and production.
NAFTAU.S. sector trade with NAFTA partners rose steadily after NAFTA entered
into force in 1994, before declining slightly in 2000 and 2001 for Canada, andin 2001 for Mexico. These declines were a result of market factors such aschanges in automotive demand and production strategies. Total trade withCanada increased at an average annual rate of 2.8 percent during 1994-2001,below the average rate for the rest of the world (5.8 percent), while total tradewith Mexico increased at an average annual rate of 13.8 percent during theperiod.
The impact of NAFTA on U.S. trade in transportation equipment has beensignificant largely because of the importance of Canada and Mexico as U.S.trading partners. Much of the increase in sector trade between the threecountries can be attributed to increased integration of the automotive industriesand markets throughout the continent and to production sharing operations ofU.S. automotive firms in Mexico. On implementation of NAFTA, Mexicoimmediately eliminated or reduced significant trade restrictions; for example,Mexico eliminated its trade balancing requirement, lowered its local contentrequirement, and eliminated import quotas on new cars and light trucks (quotasfor heavy trucks and buses were eliminated in January 1998). These actions,along with the elimination of Mexican tariffs of up to 20 percent, increasedU.S.-Mexican total trade in the automotive sector.220
219 The APTA was made largely redundant by the U.S.--Canada FTA, which was inturn superseded by the NAFTA in 1994.
220 Office of the United States Trade Representative, Study on the Operation andEffects of the North American FTA (Washington, DC: 1997), pp. 45--51.
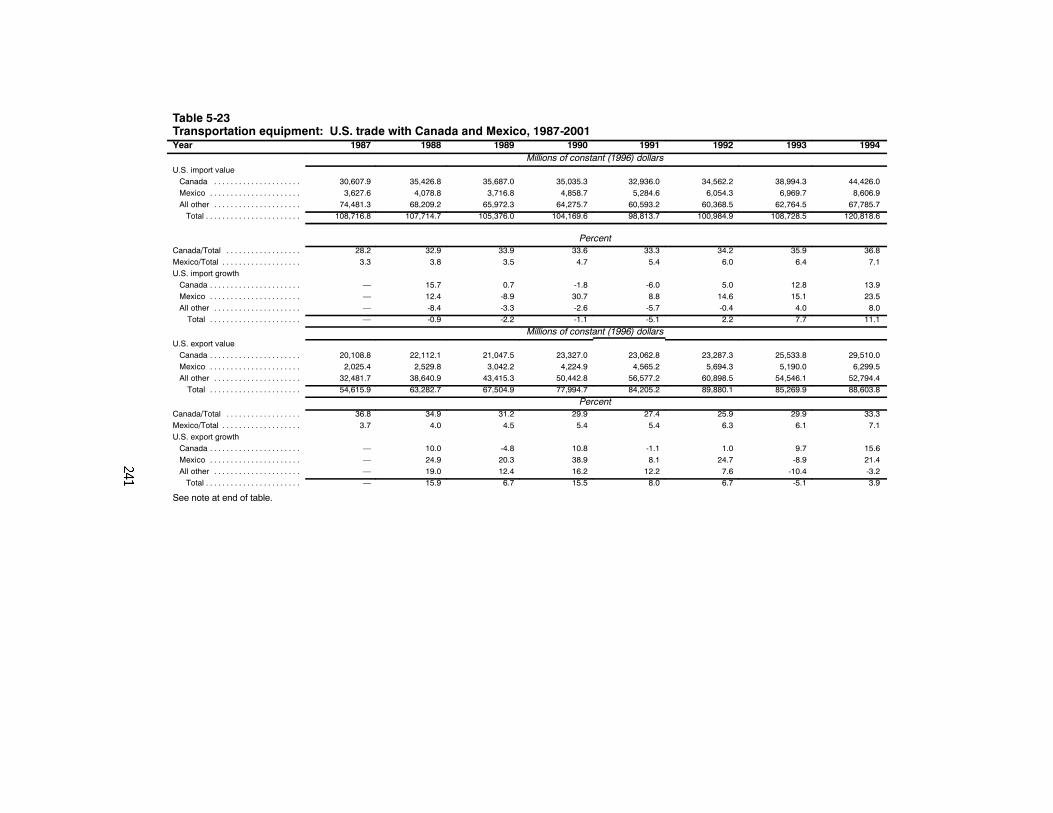
Table 5-23Transportation equipment: U.S. trade with Canada and Mexico, 1987-2001Year 1987 1988 1989 1990 1991 1992 1993 1994
Millions of constant (1996) dollarsU.S. import valueCanada . . . . . . . . . . . . . . . . . . . . . 30,607.9 35,426.8 35,687.0 35,035.3 32,936.0 34,562.2 38,994.3 44,426.0Mexico . . . . . . . . . . . . . . . . . . . . . . 3,627.6 4,078.8 3,716.8 4,858.7 5,284.6 6,054.3 6,969.7 8,606.9All other . . . . . . . . . . . . . . . . . . . . . 74,481.3 68,209.2 65,972.3 64,275.7 60,593.2 60,368.5 62,764.5 67,785.7Total . . . . . . . . . . . . . . . . . . . . . . . 108,716.8 107,714.7 105,376.0 104,169.6 98,813.7 100,984.9 108,728.5 120,818.6
PercentCanada/Total . . . . . . . . . . . . . . . . . . 28.2 32.9 33.9 33.6 33.3 34.2 35.9 36.8Mexico/Total . . . . . . . . . . . . . . . . . . . 3.3 3.8 3.5 4.7 5.4 6.0 6.4 7.1U.S. import growthCanada . . . . . . . . . . . . . . . . . . . . . . — 15.7 0.7 -1.8 -6.0 5.0 12.8 13.9Mexico . . . . . . . . . . . . . . . . . . . . . . — 12.4 -8.9 30.7 8.8 14.6 15.1 23.5All other . . . . . . . . . . . . . . . . . . . . . — -8.4 -3.3 -2.6 -5.7 -0.4 4.0 8.0Total . . . . . . . . . . . . . . . . . . . . . . — -0.9 -2.2 -1.1 -5.1 2.2 7.7 11.1
Millions of constant (1996) dollarsU.S. export valueCanada . . . . . . . . . . . . . . . . . . . . . . 20,108.8 22,112.1 21,047.5 23,327.0 23,062.8 23,287.3 25,533.8 29,510.0Mexico . . . . . . . . . . . . . . . . . . . . . . 2,025.4 2,529.8 3,042.2 4,224.9 4,565.2 5,694.3 5,190.0 6,299.5All other . . . . . . . . . . . . . . . . . . . . . 32,481.7 38,640.9 43,415.3 50,442.8 56,577.2 60,898.5 54,546.1 52,794.4Total . . . . . . . . . . . . . . . . . . . . . . 54,615.9 63,282.7 67,504.9 77,994.7 84,205.2 89,880.1 85,269.9 88,603.8
PercentCanada/Total . . . . . . . . . . . . . . . . . . 36.8 34.9 31.2 29.9 27.4 25.9 29.9 33.3Mexico/Total . . . . . . . . . . . . . . . . . . . 3.7 4.0 4.5 5.4 5.4 6.3 6.1 7.1U.S. export growthCanada . . . . . . . . . . . . . . . . . . . . . . — 10.0 -4.8 10.8 -1.1 1.0 9.7 15.6Mexico . . . . . . . . . . . . . . . . . . . . . . — 24.9 20.3 38.9 8.1 24.7 -8.9 21.4All other . . . . . . . . . . . . . . . . . . . . . — 19.0 12.4 16.2 12.2 7.6 -10.4 -3.2Total . . . . . . . . . . . . . . . . . . . . . . . — 15.9 6.7 15.5 8.0 6.7 -5.1 3.9
See note at end of table.
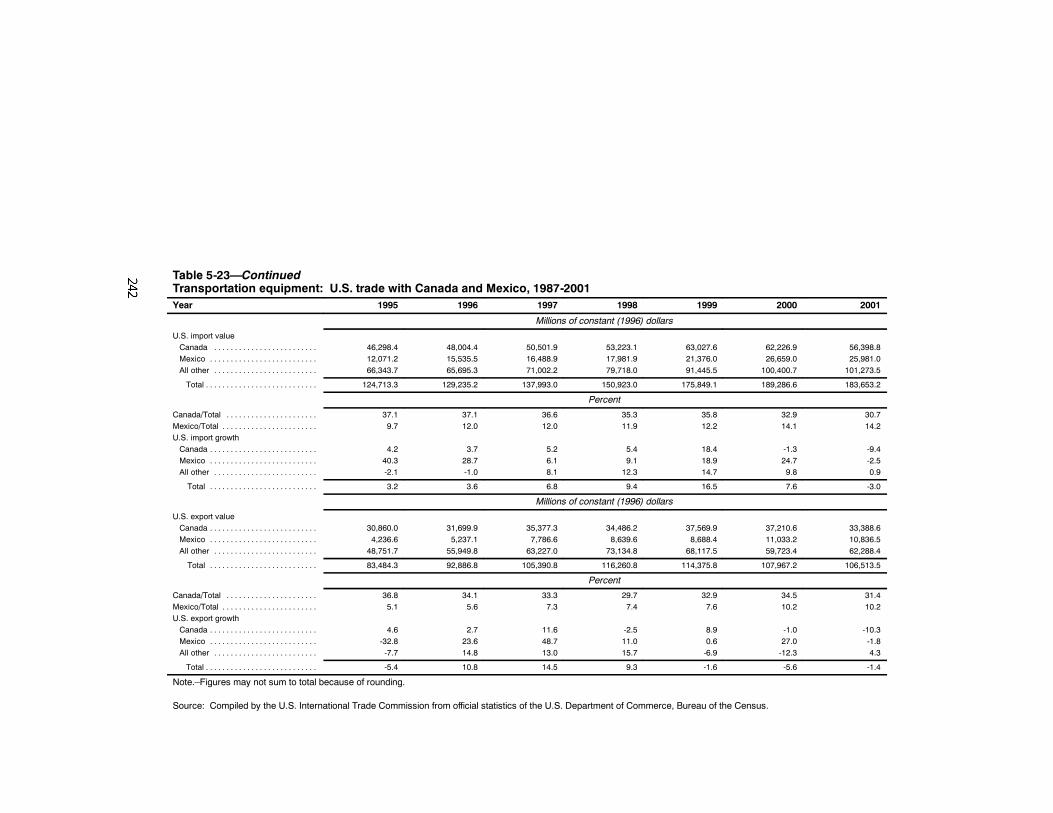
Table 5-23—ContinuedTransportation equipment: U.S. trade with Canada and Mexico, 1987-2001Year 1995 1996 1997 1998 1999 2000 2001
Millions of constant (1996) dollars
U.S. import valueCanada . . . . . . . . . . . . . . . . . . . . . . . . . 46,298.4 48,004.4 50,501.9 53,223.1 63,027.6 62,226.9 56,398.8Mexico . . . . . . . . . . . . . . . . . . . . . . . . . . 12,071.2 15,535.5 16,488.9 17,981.9 21,376.0 26,659.0 25,981.0All other . . . . . . . . . . . . . . . . . . . . . . . . . 66,343.7 65,695.3 71,002.2 79,718.0 91,445.5 100,400.7 101,273.5
Total . . . . . . . . . . . . . . . . . . . . . . . . . . . 124,713.3 129,235.2 137,993.0 150,923.0 175,849.1 189,286.6 183,653.2
Percent
Canada/Total . . . . . . . . . . . . . . . . . . . . . . 37.1 37.1 36.6 35.3 35.8 32.9 30.7Mexico/Total . . . . . . . . . . . . . . . . . . . . . . . 9.7 12.0 12.0 11.9 12.2 14.1 14.2U.S. import growthCanada . . . . . . . . . . . . . . . . . . . . . . . . . . 4.2 3.7 5.2 5.4 18.4 -1.3 -9.4Mexico . . . . . . . . . . . . . . . . . . . . . . . . . . 40.3 28.7 6.1 9.1 18.9 24.7 -2.5All other . . . . . . . . . . . . . . . . . . . . . . . . . -2.1 -1.0 8.1 12.3 14.7 9.8 0.9
Total . . . . . . . . . . . . . . . . . . . . . . . . . . 3.2 3.6 6.8 9.4 16.5 7.6 -3.0
Millions of constant (1996) dollars
U.S. export valueCanada . . . . . . . . . . . . . . . . . . . . . . . . . . 30,860.0 31,699.9 35,377.3 34,486.2 37,569.9 37,210.6 33,388.6Mexico . . . . . . . . . . . . . . . . . . . . . . . . . . 4,236.6 5,237.1 7,786.6 8,639.6 8,688.4 11,033.2 10,836.5All other . . . . . . . . . . . . . . . . . . . . . . . . . 48,751.7 55,949.8 63,227.0 73,134.8 68,117.5 59,723.4 62,288.4
Total . . . . . . . . . . . . . . . . . . . . . . . . . . 83,484.3 92,886.8 105,390.8 116,260.8 114,375.8 107,967.2 106,513.5
Percent
Canada/Total . . . . . . . . . . . . . . . . . . . . . . 36.8 34.1 33.3 29.7 32.9 34.5 31.4Mexico/Total . . . . . . . . . . . . . . . . . . . . . . . 5.1 5.6 7.3 7.4 7.6 10.2 10.2U.S. export growthCanada . . . . . . . . . . . . . . . . . . . . . . . . . . 4.6 2.7 11.6 -2.5 8.9 -1.0 -10.3Mexico . . . . . . . . . . . . . . . . . . . . . . . . . . -32.8 23.6 48.7 11.0 0.6 27.0 -1.8All other . . . . . . . . . . . . . . . . . . . . . . . . . -7.7 14.8 13.0 15.7 -6.9 -12.3 4.3
Total . . . . . . . . . . . . . . . . . . . . . . . . . . . -5.4 10.8 14.5 9.3 -1.6 -5.6 -1.4
Note.–Figures may not sum to total because of rounding.
Source: Compiled by the U.S. International Trade Commission from official statistics of the U.S. Department of Commerce, Bureau of the Census.
243
Uruguay RoundDuring 1995-2001, U.S. trade in transportation equipment increased at an
average annual rate of 5.7 percent, reaching $290.2 billion. Imports oftransportation equipment increased by 47.3 percent during this period to $184billion, while exports of such goods increased by 27.6 percent to $107 billion.U.S. shipments also grew throughout 1995-2001, increasing by 4.3 percent to$491 billion.
While Canada and Japan have consistently been the leading two sources ofU.S. transportation equipment imports, Mexico made significant strides duringthis period, becoming the third-leading import source in 1995. Other countriesthat have been among the leading suppliers of U.S. transportation equipmentimports are Germany, France, and the United Kingdom. Sector imports areoverwhelmingly (at least 80 percent) accounted for by motor vehicles andmotor vehicle parts. On the other hand, motor vehicles and parts and aircraftand parts vie for first and second place each year as the leading sector export.The leading export market for transportation equipment has consistently beenCanada, accounting for approximately one-third of total U.S. exports of theseproducts. Mexico rose to replace Japan as the second-leading market in 1998.Subsequently, Japan was surpassed by the United Kingdom and Germany tofinish 2001 as the fifth-leading market for U.S. transportation equipmentexports.
The overall worldwide Uruguay Round percentage point reduction for U.S.“Transport Equipment” exports was 3.5.221 However, much of the increase inU.S. trade following implementation of the Uruguay Round can be attributed tofactors such as expanding markets in the United States and overseas, as well asfurther globalization of the automotive industry–specifically, increasedintegration of the North American automotive industry. Tariff reductionsnegotiated under the Uruguay Round were largely inconsequential in the motorvehicle subsector, as most trade with Canada and Japan was already duty free,and the EU did not make significant duty reduction commitments.222
With respect to motor vehicle parts, the majority of subsector trade waswith Canada and Mexico, and already free of duty or subject to reduced duties.
221 This calculation excludes countries participating in free trade agreements withthe United States at that time, and also excludes certain products such as automotiveengines. Based on J. Michael Finger, Merlinda D. Ingco, and Ulrich Reincke, TheUruguay Round: Statistics on Tariff Concessions Given and Received (Washington, DC:The World Bank, 1996).
222 USITC, Potential Impact on the U.S. Economy and Industries of the GATTUruguay Round Agreements, inv. No. 332--353, USITC Pub. 2790, June 1994, pp. VI--5to VI--7.
244
The URA negotiations attempted to harmonize developed-country tariffs at 2percent ad valorem; this goal was largely met in the EU, but was lesssuccessfully negotiated in Latin America and Asia. Japan, however, did agreeto bind its tariffs at zero, and Australia, Korea, and Singapore agreed toreduce tariffs to 2 percent. Besides tariff concessions, which seem to havehad a limited effect on U.S. production and trade, the agreements on TRIMs,TRIPs, rules of origin, and to a lesser extent, safeguards, were positiveoutcomes for the U.S. motor vehicle parts industry.223
In the civil aircraft and parts subsector, trade was already largely free ofduty; duty reductions negotiated under the URA were minimal. The agreementon subsidy and countervailing measures theoretically allowed the U.S. civilaerospace industry to accept, without risk of international action, direct U.S.Government support of research and development. In effect, however, the resultof this URA provision was minimal.224
Forest and Fishery Products225
OverviewThe United States is the world’s largest producer of forest products and the
fifth-largest producer of fishery products. The forest products subsectorconsists of two industries; wood products, and paper and allied products. U.S.production of wood products in 2001 reached 632 million cubic meters, orabout 17 percent of the world’s total, more than twice the output of the nextlargest producer, China.226 U.S. production of paper and allied products in2001 reached 177 million metric tons, or about 29 percent of the world’s total,more than twice the output of the next largest producer, also China. U.S.production of fishery products in 2001 reached 4.31 million metric tons, orabout 4 percent of the world’s total, behind China, India, Japan, and Peru (table5-24).227 Canada produces a similar mix of both forest and fishery products,and is a major competitor in the U.S. market, as well as in major foreignmarkets such as Japan and the EU. The U.S. forest and fishery products
223 Motor and Equipment Manufacturers Association, official submission to USITCin connection with USITC, Potential Impact on the U.S. Economy and Industries of theGATT Uruguay Round Agreements, Vol. I, inv. No. 332--353, USITC Pub. 2790, June1994, p.VI--11.
224 Ibid, pp. VI--13 to VI--15.225 For the purposes of this investigation, forest and fishery products comprise SIC
groups 08, 09, 24, 26, and 27. Processed seafood products are not included here; they areincluded in the discussion of agriculture elsewhere in this report.
226 Food and Agriculture Organization of the United Nations.227 Food and Agriculture Organization of the United Nations, and the
U.S. Department of Commerce.
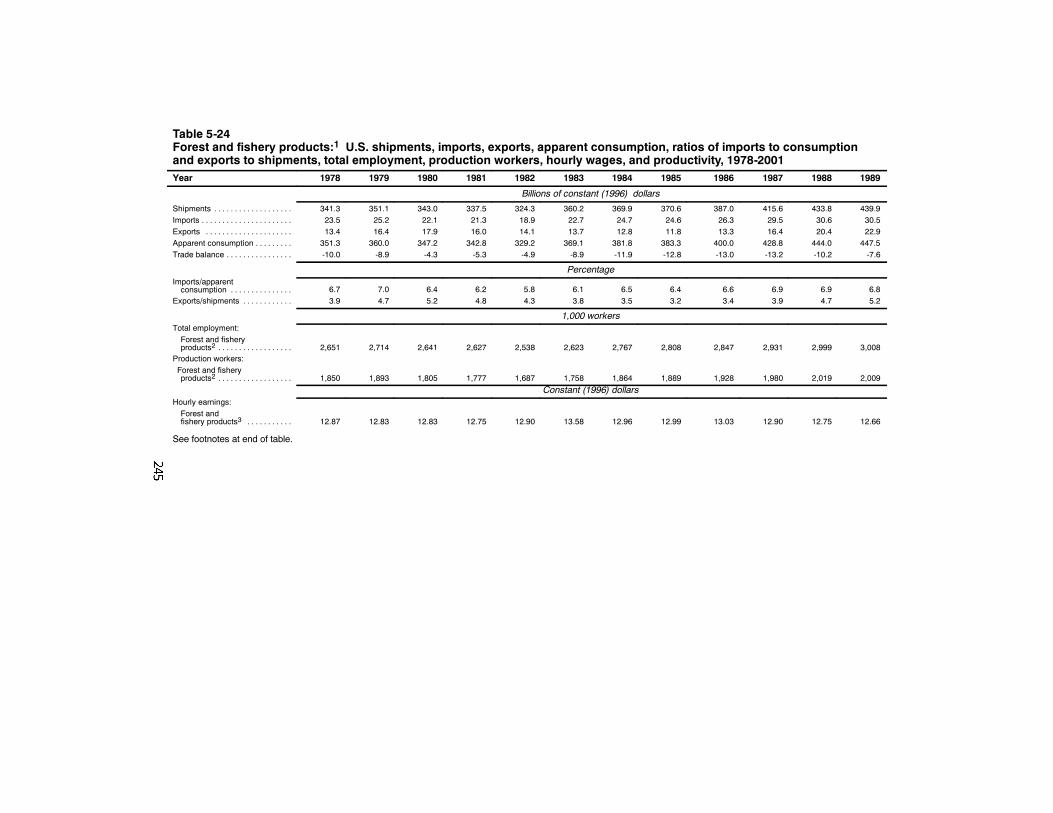
Table 5-24Forest and fishery products:1 U.S. shipments, imports, exports, apparent consumption, ratios of imports to consumptionand exports to shipments, total employment, production workers, hourly wages, and productivity, 1978-2001Year 1978 1979 1980 1981 1982 1983 1984 1985 1986 1987 1988 1989
Billions of constant (1996) dollars
Shipments . . . . . . . . . . . . . . . . . . . 341.3 351.1 343.0 337.5 324.3 360.2 369.9 370.6 387.0 415.6 433.8 439.9Imports . . . . . . . . . . . . . . . . . . . . . . 23.5 25.2 22.1 21.3 18.9 22.7 24.7 24.6 26.3 29.5 30.6 30.5Exports . . . . . . . . . . . . . . . . . . . . . 13.4 16.4 17.9 16.0 14.1 13.7 12.8 11.8 13.3 16.4 20.4 22.9Apparent consumption . . . . . . . . . 351.3 360.0 347.2 342.8 329.2 369.1 381.8 383.3 400.0 428.8 444.0 447.5Trade balance . . . . . . . . . . . . . . . . -10.0 -8.9 -4.3 -5.3 -4.9 -8.9 -11.9 -12.8 -13.0 -13.2 -10.2 -7.6
PercentageImports/apparentconsumption . . . . . . . . . . . . . . . 6.7 7.0 6.4 6.2 5.8 6.1 6.5 6.4 6.6 6.9 6.9 6.8
Exports/shipments . . . . . . . . . . . . 3.9 4.7 5.2 4.8 4.3 3.8 3.5 3.2 3.4 3.9 4.7 5.2
1,000 workersTotal employment:Forest and fisheryproducts2 . . . . . . . . . . . . . . . . . . 2,651 2,714 2,641 2,627 2,538 2,623 2,767 2,808 2,847 2,931 2,999 3,008
Production workers:Forest and fisheryproducts2 . . . . . . . . . . . . . . . . . . 1,850 1,893 1,805 1,777 1,687 1,758 1,864 1,889 1,928 1,980 2,019 2,009
Constant (1996) dollarsHourly earnings:Forest andfishery products3 . . . . . . . . . . . 12.87 12.83 12.83 12.75 12.90 13.58 12.96 12.99 13.03 12.90 12.75 12.66
See footnotes at end of table.
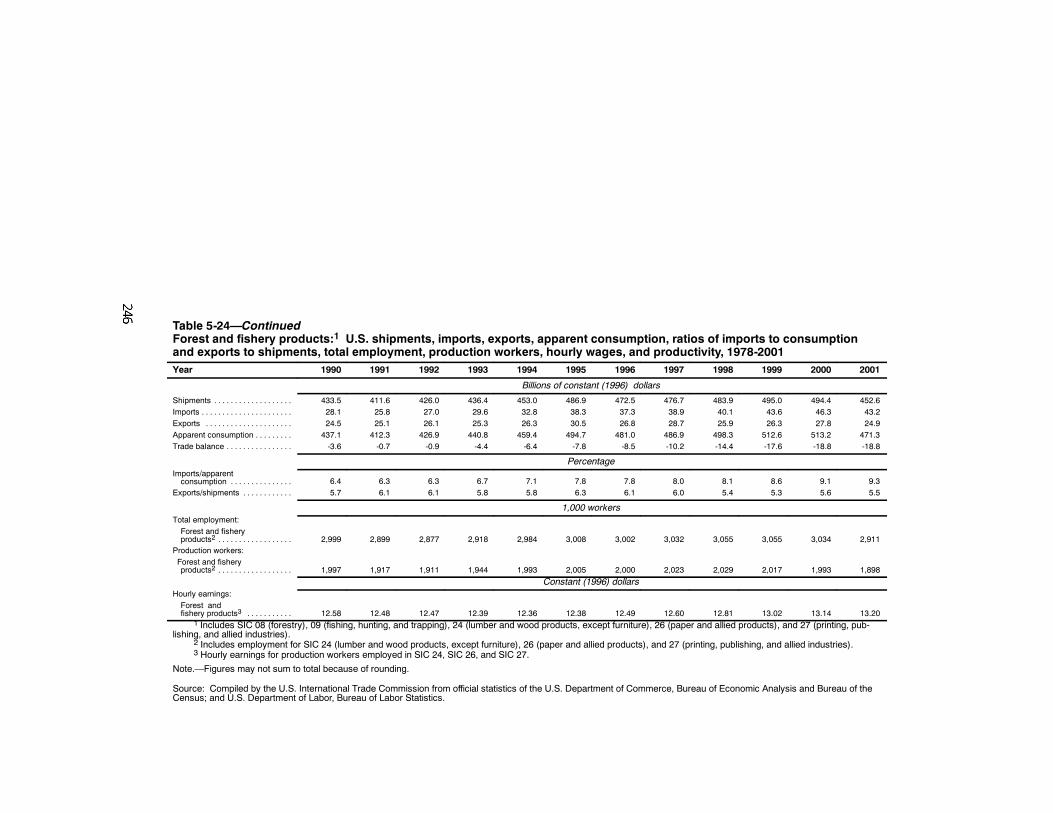
Table 5-24—ContinuedForest and fishery products:1 U.S. shipments, imports, exports, apparent consumption, ratios of imports to consumptionand exports to shipments, total employment, production workers, hourly wages, and productivity, 1978-2001Year 1990 1991 1992 1993 1994 1995 1996 1997 1998 1999 2000 2001
Billions of constant (1996) dollars
Shipments . . . . . . . . . . . . . . . . . . . 433.5 411.6 426.0 436.4 453.0 486.9 472.5 476.7 483.9 495.0 494.4 452.6Imports . . . . . . . . . . . . . . . . . . . . . . 28.1 25.8 27.0 29.6 32.8 38.3 37.3 38.9 40.1 43.6 46.3 43.2Exports . . . . . . . . . . . . . . . . . . . . . 24.5 25.1 26.1 25.3 26.3 30.5 26.8 28.7 25.9 26.3 27.8 24.9Apparent consumption . . . . . . . . . 437.1 412.3 426.9 440.8 459.4 494.7 481.0 486.9 498.3 512.6 513.2 471.3Trade balance . . . . . . . . . . . . . . . . -3.6 -0.7 -0.9 -4.4 -6.4 -7.8 -8.5 -10.2 -14.4 -17.6 -18.8 -18.8
PercentageImports/apparentconsumption . . . . . . . . . . . . . . . 6.4 6.3 6.3 6.7 7.1 7.8 7.8 8.0 8.1 8.6 9.1 9.3
Exports/shipments . . . . . . . . . . . . 5.7 6.1 6.1 5.8 5.8 6.3 6.1 6.0 5.4 5.3 5.6 5.5
1,000 workersTotal employment:Forest and fisheryproducts2 . . . . . . . . . . . . . . . . . . 2,999 2,899 2,877 2,918 2,984 3,008 3,002 3,032 3,055 3,055 3,034 2,911
Production workers:Forest and fisheryproducts2 . . . . . . . . . . . . . . . . . . 1,997 1,917 1,911 1,944 1,993 2,005 2,000 2,023 2,029 2,017 1,993 1,898
Constant (1996) dollarsHourly earnings:Forest andfishery products3 . . . . . . . . . . . 12.58 12.48 12.47 12.39 12.36 12.38 12.49 12.60 12.81 13.02 13.14 13.20
1 Includes SIC 08 (forestry), 09 (fishing, hunting, and trapping), 24 (lumber and wood products, except furniture), 26 (paper and allied products), and 27 (printing, pub-lishing, and allied industries).
2 Includes employment for SIC 24 (lumber and wood products, except furniture), 26 (paper and allied products), and 27 (printing, publishing, and allied industries).3 Hourly earnings for production workers employed in SIC 24, SIC 26, and SIC 27.
Note.—Figures may not sum to total because of rounding.
Source: Compiled by the U.S. International Trade Commission from official statistics of the U.S. Department of Commerce, Bureau of Economic Analysis and Bureau of theCensus; and U.S. Department of Labor, Bureau of Labor Statistics.
247
industries both have access to significant quantities of natural resources,state-of-the-art technology, and a large domestic market for high-value goods.The U.S. forest and fishery products subsectors focus mainly on the domesticmarket. U.S. exports of high-value products are small but growing.
The forest products subsector produces an array of goods, including lightlyprocessed products such as firewood; industrial products such as plywood,containerboard, and paper; and high-value consumer products such asstationery and scented tissue. The wide range of products reflects the greatvariety of hardwood and softwood trees available to the industry from variousU.S. regions. The subsector consists primarily of large, vertically integratedfirms that produce both paper and wood products. Many paper products, forexample, are made by paper mills that process their own raw material frompulpwood and residual chips from the wood products subsector. Production ofwood products is typically integrated from the harvest of trees, to thedistribution of lumber products to retailers. Although a number of firmsproduce and distribute nationwide, they generally do not invest internationally,with the exception of significant cross-border investment with Canada.
In recent decades, recycling of paper products has become an importantpart of the industry in the United States: 25 percent or more of all paperproducts are recycled.228 This has enabled the industry to supply growingdemand for paper without requiring proportionate amounts of new forestresources. Most technological development in the past two decades in thissector has been in the production of paper and allied products.
The fishery products subsector produces a wide range of seafoods andother products. Important products include shrimp, tuna, and salmon, as well asindustrial products such as fish meal (used in animal feeds) and fish oil (usedin paints and other industrial uses). The U.S. industry has a distinct advantageover its foreign rivals in its proximity to the domestic market, which is animportant consideration for a perishable product such as seafood. However, theU.S. industry may be disadvantaged by labor costs and environmental controlslimiting the industrial development of some coastal areas.229
The fishery products subsector as defined in this investigation is composedof two broad industries, harvesting and aquaculture (fish farming). Commercialfish harvesting takes place along all U.S. coasts, on the high seas, and infreshwater bodies such as the Great Lakes. This subsector is highlydisaggregated, consisting of thousands of firms most of which operate a singlevessel. However, the size of these enterprises varies widely, from small inshorecraft costing a few hundred dollars, to huge ocean-going vessels requiring aninvestment in excess of $20 million. The appropriate scale and technology forthe enterprise generally depends on the type of fish targeted. The principal
228 USITC, Industry & Trade Summary: Wood Pulp and Waste Paper, USITC Pub.3490 Feb. 2002, pp. 22--25.
229 USITC staff interview with fishery industry officials, June 2003.
248
equipment needed to harvest certain species of clams are tongs andwaterproof boots, while most species of tuna require vessels capable ofcarrying a helicopter and sufficient fuel to traverse entire oceans.
U.S. shipments of forest and fishery products increased from $341 billionin 1978 to $453 billion in 2001 (33 percent), fluctuating during this periodfrom a low of $324 billion in 1982 to a high of $495 billion in 1999. Peaks andtroughs during this period were generally attributable to overall conditions inthe U.S. economy; the wood products sector, in particular, mirrors the highlyvolatile housing and construction industries. U.S. sector exports approximatelydoubled between 1978 and 2001, reaching $25 billion, although as a share ofproduction they have remained relatively steady, at 5 to 6 percent of productionvalue. Imports grew during the period both in absolute terms and as a share ofapparent consumption, from 6.4 percent, or $28 billion, in 1990, to more than 9percent, or $46 billion, by 2000. Apparent consumption has outpacedproduction, especially in recent years, rising by 17 percent to $513 billionduring 1990-2000.
Trade is an important component of the market for many forest products.Trade in certain products has been the subject of disputes – perhaps mostnotably the softwood lumber issue with Canada. In 1996, Canada and theUnited States negotiated the Softwood Lumber Agreement (SLA) that providedfor a quota agreement between the two countries. However, the SLA expired in2001, and shortly thereafter the U.S. softwood products industry filed petitionsunder U.S. antidumping and countervailing duty statutes.230
Employment in the wood and paper products industries (fishingemployment is not currently available) grew from 1.6 million workers in 1978to a peak of 2.0 million workers in 1998, before declining to 1.9 millionworkers in 2001. The decline from the peak levels of the late 1990s has beenespecially pronounced in the paper and printing subsectors, where recentrecessionary impacts have combined with a longer-run trend toward industryconsolidation and overseas migration. The wood products industry isparticularly vulnerable to recessions; employment in mobile home constructionand the production of home furnishings (such as kitchen cabinets), woodpallets, and shipping containers are especially volatile.
Hourly earnings, however, have been sustained throughout the period byhigh rates of labor productivity growth. Output per worker grew from less than
230 See, e.g., Softwood Lumber from Canada, inv. No. 701--TA--312, USITC Pub.2469, Dec. 1991, pp. A--3 to A--6. The MOU was signed on Dec. 30, 1986, prior toCommerce’s final determination in the countervailing--duty investigation that year.Under this agreement, Canada agreed to charge an export tax to offset benefits accruingto its lumber producers and exporters. However, on Sept. 9, 1991, Canada ended theexport tax, leading to the above--cited investigation (which was self--initiated by theDepartment of Commerce). At the same time, USTR initiated a section 301investigation. Both actions were terminated following bilateral discussions.
249
$190,000 in the 1970s to nearly $220,000 by 1990, and almost $250,000 by2000. As a result, inflation-adjusted earnings per worker grew from $12.64 to$13.18 per hour during 1990-2000.
Both the forest and fishery products industries have access tostate-of-the-art technology, which helps sustain U.S. industry competitivenessin the face of rivals with lower labor costs, such as in Asia and Latin America.In addition, proximity to the domestic market is important in subsectors such asprinting and publishing, especially for periodicals such as newspapers.However, efficiency has been hampered by government regulations coveringsuch areas as pollution control. By one estimate, pollution abatement costs forthe pulp and paper industry are nearly five times the U.S. manufacturingaverage.231 According to the same source, every one-percent increase inspending on pollution abatement decreases productivity by five percent.
Globalization has led to expansion by U.S. firms mainly in the printing andpublishing industries, where satellite communication enables the transmissionof text and data to multiple production locations virtually simultaneously. Inaddition to the significant U.S.-Canada cross-border investment noted above,there has been increased U.S. industry investment in various Asian economiesto take advantage of expanding markets there for newspapers and otherpublications.232
Effect of Trade Agreements on the SectorThe five trade agreements that are the subject of this investigation have had
little direct effect on U.S. production and trade in the forestry and fisheriessector. This is because the principal area of sector concern addressed by suchagreements has been tariffs, and U.S. tariffs in this sector have historically beenvery low (below 2 percent ad valorem) (table 5-25). During the period coveredby this investigation, production grew by an average of 1.8 percent annually, apace maintained fairly steadily throughout the period. The average annualgrowth rate for both imports and exports showed no clear trend during theperiod despite modest declines in tariffs. U.S. import trends depend mainly onmacroeconomic activity that affects housing starts and other variables. Exportperformance is affected less by foreign trade barriers than by macroeconomicconditions abroad (such as the Asian financial crisis) and the value of the U.S.dollar.
231 U.S. Department of Commerce, Bureau of the Census, “Measuring theProductivity Impact of Pollution Abatement,” SB93--13, Nov. 1993; cited in USITC,Industry & Trade Summary: Wood Pulp and Waste Paper, USITC Pub. 3490, Feb. 2002,p. 11.
232 USITC, Industry & Trade Summary: Newsprint, USITC Pub. 3355 (Sept. 2002),p. 8.
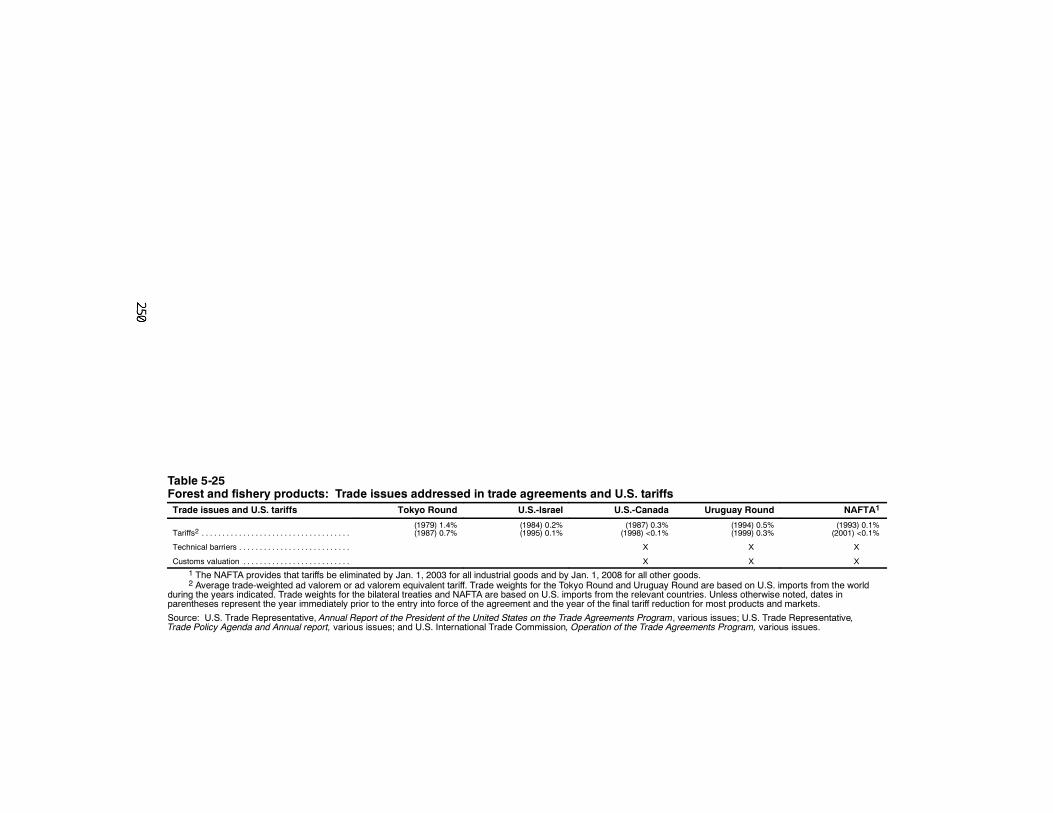
Table 5-25Forest and fishery products: Trade issues addressed in trade agreements and U.S. tariffsTrade issues and U.S. tariffs Tokyo Round U.S.-Israel U.S.-Canada Uruguay Round NAFTA1
Tariffs2 . . . . . . . . . . . . . . . . . . . . . . . . . . . . . . . . . . . .(1979) 1.4%(1987) 0.7%
(1984) 0.2%(1995) 0.1%
(1987) 0.3%(1998) <0.1%
(1994) 0.5%(1999) 0.3%
(1993) 0.1%(2001) <0.1%
Technical barriers . . . . . . . . . . . . . . . . . . . . . . . . . . . X X X
Customs valuation . . . . . . . . . . . . . . . . . . . . . . . . . . X X X1 The NAFTA provides that tariffs be eliminated by Jan. 1, 2003 for all industrial goods and by Jan. 1, 2008 for all other goods.2 Average trade-weighted ad valorem or ad valorem equivalent tariff. Trade weights for the Tokyo Round and Uruguay Round are based on U.S. imports from the world
during the years indicated. Trade weights for the bilateral treaties and NAFTA are based on U.S. imports from the relevant countries. Unless otherwise noted, dates inparentheses represent the year immediately prior to the entry into force of the agreement and the year of the final tariff reduction for most products and markets.
Source: U.S. Trade Representative, Annual Report of the President of the United States on the Trade Agreements Program, various issues; U.S. Trade Representative,Trade Policy Agenda and Annual report, various issues; and U.S. International Trade Commission, Operation of the Trade Agreements Program, various issues.
251
Tokyo RoundBetween 1980, when the Tokyo Round Agreements entered into effect, and
2000, U.S. industry shipments in this sector grew by 1.8 percent annually to$494 billion, and then decreased by 8.5 percent in 2001. U.S. imports in thissector grew by 3 percent annually, from $22.1 billion in 1980 to $43.6 billionin 2001. The low long-run average, however, hides some large annual increases(more than ten percent in 1984, 1987, 1994, and 1995) and decreases (morethan ten percent in 1980 and 1982). U.S. sector exports during this period grewby 2.7 percent annually, from $17.9 billion in 1980 to $25.8 billion in 2001.Large annual increases (in excess of ten percent) occurred in 1986-89 and1995. Large decreases occurred in 1981-82 and 2001. In general, trends in thissector closely follow general macroeconomic conditions, because the sector isclosely tied to major industries such as housing and other construction, whichare strongly affected by the overall level of economic activity.
The Tokyo Round had the effect of lowering U.S. tariffs in this sector froman average 1.4 percent ad valorem in 1979, to 0.7 percent in 1989, when theU.S.-Canada trade agreement took effect. During this period, sector shipmentsrose by 2.2 percent annually, imports by 2.5 percent annually, and exports by0.7 percent annually. This period was marked by a sharp recession in 1981-82,which dramatically slowed both imports and exports, as well as generalindustry production. As forest product tariffs have been reduced over the last30 years, nontariff barriers have become more prevalent. Types of nontariffbarriers include regulatory restrictions (building codes and standards),certification programs (nongovernment product standards), governmentintervention (forestland ownership and industry assistance), and exportrestrictions (taxes, quotas, and bans). Although the Tokyo Round addressedmany nontariff issues, the softwood lumber dispute233 has a much greaterimpact on U.S.-Canada trade in sector products.
U.S.-Israel FTASector trade with Israel grew significantly between 1985, the initial year of
the agreement, and 2001. Total exports grew by nearly $50 million, or 84percent, from $57.1 million in 1985 to $104.9 million in 2001. Total importsgrew by $35 million, or 200 percent, from $17.6 million in 1985 to$52.7 million in 2001 (table 5-26).
However, it is unlikely that the trade agreement contributed significantly tothis growth. The average U.S. tariff on sector imports from Israel was only 0.2percent ad valorem prior to the agreement, and 0.1 percent after itsimplementation. Israel’s tariff treatment for sector exports declined by asimilarly small amount. As a share of total U.S. exports in this sector, exports
233 See, e.g., USITC, Softwood Lumber from Canada, inv. No. 701--TA--197(Prelim.), USITC Pub. 1320, Nov. 1982; Softwood Lumber from Canada, inv. No.701--TA--274 (Prelim.), USITC Pub. 1874, July 1986.
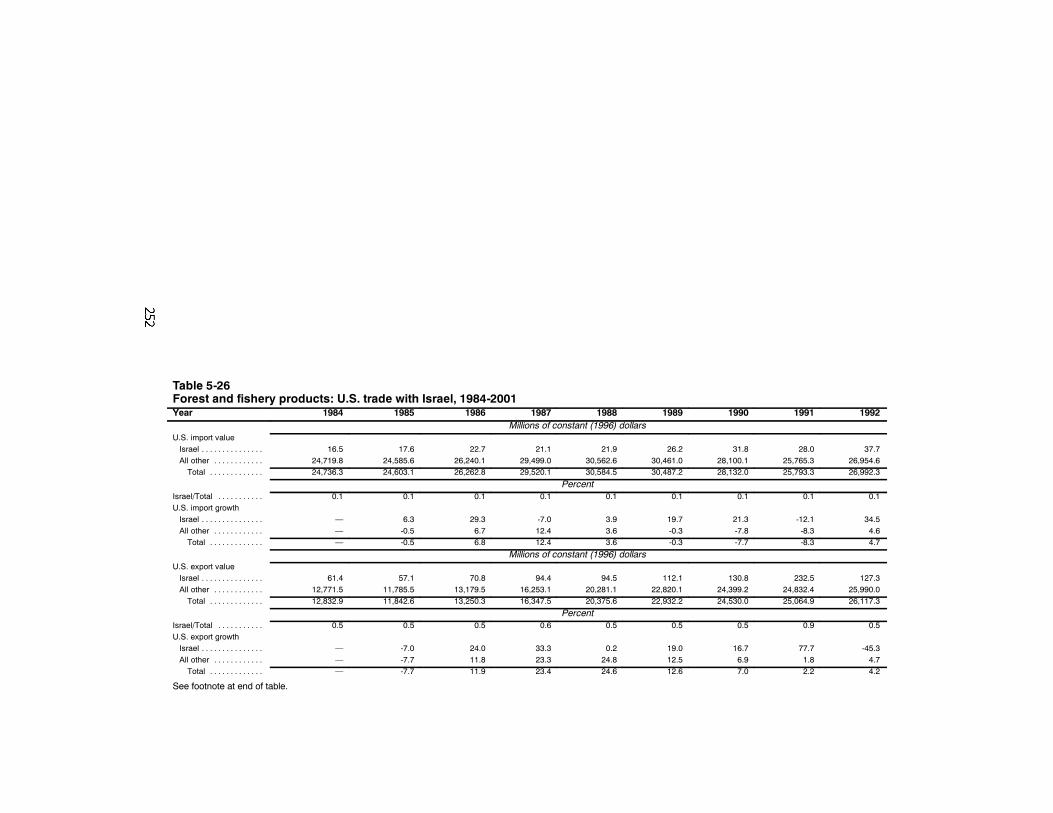
Table 5-26Forest and fishery products: U.S. trade with Israel, 1984-2001Year 1984 1985 1986 1987 1988 1989 1990 1991 1992
Millions of constant (1996) dollarsU.S. import valueIsrael . . . . . . . . . . . . . . . 16.5 17.6 22.7 21.1 21.9 26.2 31.8 28.0 37.7All other . . . . . . . . . . . . 24,719.8 24,585.6 26,240.1 29,499.0 30,562.6 30,461.0 28,100.1 25,765.3 26,954.6Total . . . . . . . . . . . . . 24,736.3 24,603.1 26,262.8 29,520.1 30,584.5 30,487.2 28,132.0 25,793.3 26,992.3
PercentIsrael/Total . . . . . . . . . . . 0.1 0.1 0.1 0.1 0.1 0.1 0.1 0.1 0.1U.S. import growthIsrael . . . . . . . . . . . . . . . — 6.3 29.3 -7.0 3.9 19.7 21.3 -12.1 34.5All other . . . . . . . . . . . . — -0.5 6.7 12.4 3.6 -0.3 -7.8 -8.3 4.6Total . . . . . . . . . . . . . — -0.5 6.8 12.4 3.6 -0.3 -7.7 -8.3 4.7
Millions of constant (1996) dollarsU.S. export valueIsrael . . . . . . . . . . . . . . . 61.4 57.1 70.8 94.4 94.5 112.1 130.8 232.5 127.3All other . . . . . . . . . . . . 12,771.5 11,785.5 13,179.5 16,253.1 20,281.1 22,820.1 24,399.2 24,832.4 25,990.0Total . . . . . . . . . . . . . 12,832.9 11,842.6 13,250.3 16,347.5 20,375.6 22,932.2 24,530.0 25,064.9 26,117.3
PercentIsrael/Total . . . . . . . . . . . 0.5 0.5 0.5 0.6 0.5 0.5 0.5 0.9 0.5U.S. export growthIsrael . . . . . . . . . . . . . . . — -7.0 24.0 33.3 0.2 19.0 16.7 77.7 -45.3All other . . . . . . . . . . . . — -7.7 11.8 23.3 24.8 12.5 6.9 1.8 4.7Total . . . . . . . . . . . . . — -7.7 11.9 23.4 24.6 12.6 7.0 2.2 4.2
See footnote at end of table.
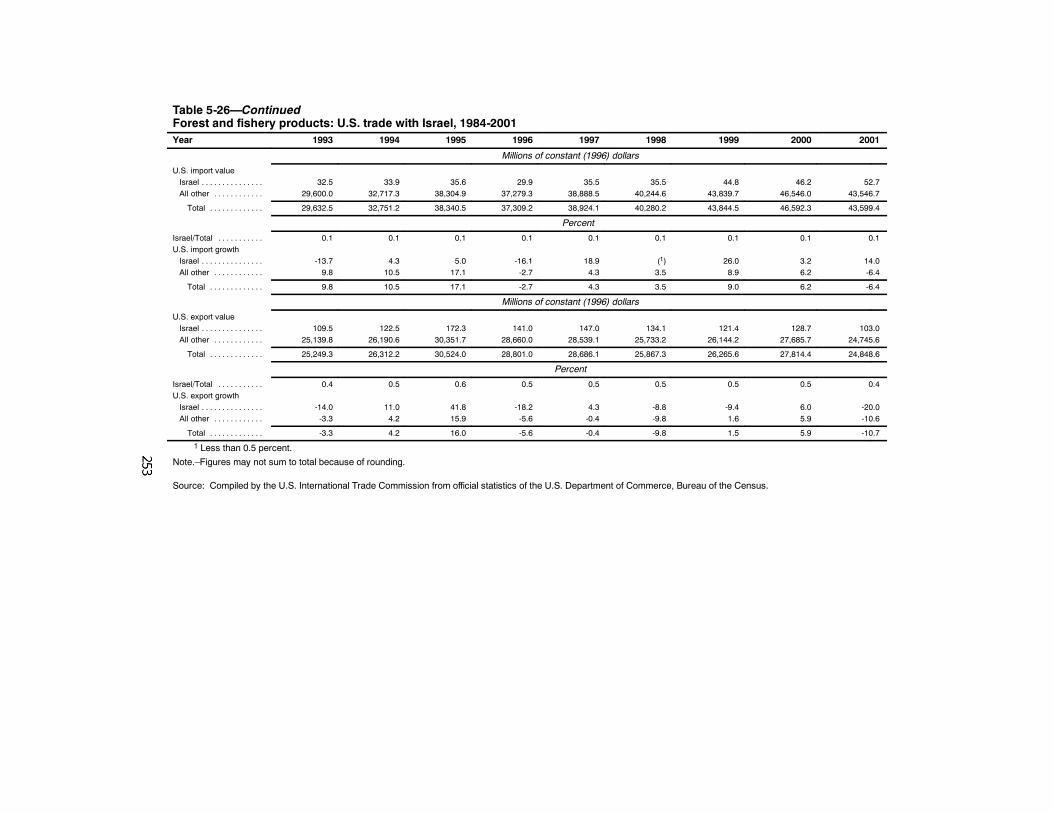
Table 5-26—ContinuedForest and fishery products: U.S. trade with Israel, 1984-2001Year 1993 1994 1995 1996 1997 1998 1999 2000 2001
Millions of constant (1996) dollars
U.S. import valueIsrael . . . . . . . . . . . . . . . 32.5 33.9 35.6 29.9 35.5 35.5 44.8 46.2 52.7All other . . . . . . . . . . . . 29,600.0 32,717.3 38,304.9 37,279.3 38,888.5 40,244.6 43,839.7 46,546.0 43,546.7
Total . . . . . . . . . . . . . 29,632.5 32,751.2 38,340.5 37,309.2 38,924.1 40,280.2 43,844.5 46,592.3 43,599.4
Percent
Israel/Total . . . . . . . . . . . 0.1 0.1 0.1 0.1 0.1 0.1 0.1 0.1 0.1U.S. import growthIsrael . . . . . . . . . . . . . . . -13.7 4.3 5.0 -16.1 18.9 (1) 26.0 3.2 14.0All other . . . . . . . . . . . . 9.8 10.5 17.1 -2.7 4.3 3.5 8.9 6.2 -6.4
Total . . . . . . . . . . . . . 9.8 10.5 17.1 -2.7 4.3 3.5 9.0 6.2 -6.4
Millions of constant (1996) dollars
U.S. export valueIsrael . . . . . . . . . . . . . . . 109.5 122.5 172.3 141.0 147.0 134.1 121.4 128.7 103.0All other . . . . . . . . . . . . 25,139.8 26,190.6 30,351.7 28,660.0 28,539.1 25,733.2 26,144.2 27,685.7 24,745.6
Total . . . . . . . . . . . . . 25,249.3 26,312.2 30,524.0 28,801.0 28,686.1 25,867.3 26,265.6 27,814.4 24,848.6
Percent
Israel/Total . . . . . . . . . . . 0.4 0.5 0.6 0.5 0.5 0.5 0.5 0.5 0.4U.S. export growthIsrael . . . . . . . . . . . . . . . -14.0 11.0 41.8 -18.2 4.3 -8.8 -9.4 6.0 -20.0All other . . . . . . . . . . . . -3.3 4.2 15.9 -5.6 -0.4 -9.8 1.6 5.9 -10.6
Total . . . . . . . . . . . . . -3.3 4.2 16.0 -5.6 -0.4 -9.8 1.5 5.9 -10.7
1 Less than 0.5 percent.
Note.–Figures may not sum to total because of rounding.
Source: Compiled by the U.S. International Trade Commission from official statistics of the U.S. Department of Commerce, Bureau of the Census.
254
to Israel remained small, rising from less than 0.1 percent in 1985 to 0.1percent in 2001 As a share of total U.S. imports in this sector, imports fromIsrael also remained small, and in fact fell from 0.5 percent in 1985 to 0.4percent in 2001.
U.S.-Canada FTABetween 1989 and 2001, U.S.-Canada trade in the forestry and fisheries
sector grew by almost $25 billion, or 213 percent, from $11.7 billion in 1989 to$36.6 million in 2001 (table 5-27). Sector exports to Canada more thandoubled, from $3.2 billion to $7.4 billion, while imports almost tripled, from$8.4 billion to $28.8 billion during the same period. As a share of total U.S.sector exports, Canada grew from 14 percent in 1989 to 30 percent in 2001. Oftotal U.S. sector imports, Canada’s share grew from 28 percent in 1989 to 66percent in 2001. In both cases, much of the growth took place prior to 1995,the first year of NAFTA (see below).
This agreement, like the others examined herein, has had a minimal impacton this sector. U.S. tariffs on imports from Canada were already low (0.3percent) prior to the agreement and are less than 0.1 percent today. The largestnon-demand-related factor affecting U.S.-Canada trade in this sector probablywas the Softwood Lumber Agreement, which, along with an earlierMemorandum of Understanding negotiated by the two countries, was intendedto resolve a series of unfair trade complaints by the U.S. industry.234
NAFTAFrom 1994 to 2001, U.S. sector trade with its NAFTA partners nearly
doubled, from $25.9 billion in the former year to $48.5 billion in the latter.U.S. imports from NAFTA partners grew by $20.0 billion, to $37.2 billion by2001, while exports to NAFTA partners rose by $2.6 billion, to $11.3 billion,leaving a trade deficit of nearly $26 billion in 2001. As a share of total U.S.sector imports, NAFTA partners supplied 85 percent in 2001, up from 53percent in 1994. As a share of total U.S. sector exports, NAFTA partners’markets accounted for 44 percent in 2001, up from 32 percent in 1994.
NAFTA’s provisions affecting this sector fall mainly in the categories oftariffs, technical barriers, and customs valuation. However, none of these had
234 See, e.g., Softwood Lumber from Canada, inv. No. 701--TA--312, USITC Pub.2469, Dec. 1991, pp. A--3 to A--6. The MOU was signed on Dec. 30, 1986, prior toCommerce’s final determination in the countervailing--duty investigation that year.Under this agreement, Canada agreed to charge an export tax to offset benefits accruingto its lumber producers and exporters. However, on Sept. 9, 1991, Canada ended theexport tax, leading to the above--cited investigation (which was self--initiated by theDepartment of Commerce). At the same time, USTR initiated a section 301investigation. Both actions were terminated following bilateral discussions.
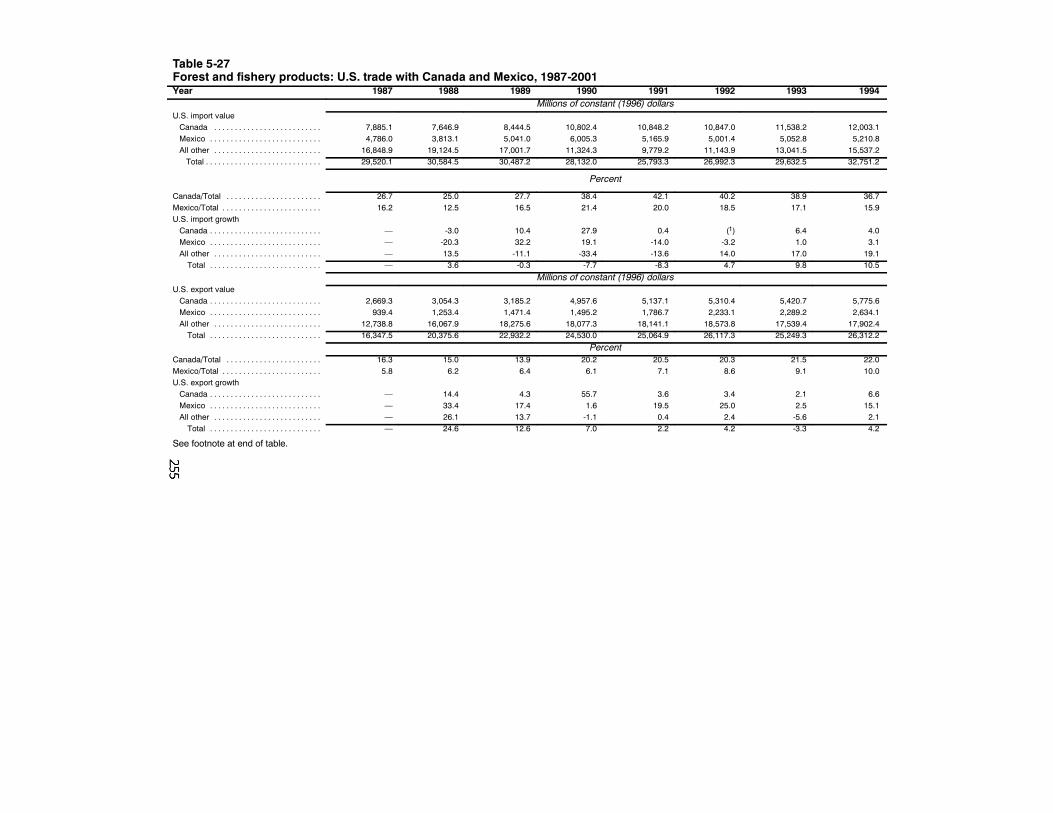
Table 5-27Forest and fishery products: U.S. trade with Canada and Mexico, 1987-2001Year 1987 1988 1989 1990 1991 1992 1993 1994
Millions of constant (1996) dollarsU.S. import valueCanada . . . . . . . . . . . . . . . . . . . . . . . . . . 7,885.1 7,646.9 8,444.5 10,802.4 10,848.2 10,847.0 11,538.2 12,003.1Mexico . . . . . . . . . . . . . . . . . . . . . . . . . . . 4,786.0 3,813.1 5,041.0 6,005.3 5,165.9 5,001.4 5,052.8 5,210.8All other . . . . . . . . . . . . . . . . . . . . . . . . . . 16,848.9 19,124.5 17,001.7 11,324.3 9,779.2 11,143.9 13,041.5 15,537.2Total . . . . . . . . . . . . . . . . . . . . . . . . . . . . 29,520.1 30,584.5 30,487.2 28,132.0 25,793.3 26,992.3 29,632.5 32,751.2
Percent
Canada/Total . . . . . . . . . . . . . . . . . . . . . . . 26.7 25.0 27.7 38.4 42.1 40.2 38.9 36.7Mexico/Total . . . . . . . . . . . . . . . . . . . . . . . . 16.2 12.5 16.5 21.4 20.0 18.5 17.1 15.9U.S. import growthCanada . . . . . . . . . . . . . . . . . . . . . . . . . . . — -3.0 10.4 27.9 0.4 (1) 6.4 4.0Mexico . . . . . . . . . . . . . . . . . . . . . . . . . . . — -20.3 32.2 19.1 -14.0 -3.2 1.0 3.1All other . . . . . . . . . . . . . . . . . . . . . . . . . . — 13.5 -11.1 -33.4 -13.6 14.0 17.0 19.1Total . . . . . . . . . . . . . . . . . . . . . . . . . . . — 3.6 -0.3 -7.7 -8.3 4.7 9.8 10.5
Millions of constant (1996) dollarsU.S. export valueCanada . . . . . . . . . . . . . . . . . . . . . . . . . . . 2,669.3 3,054.3 3,185.2 4,957.6 5,137.1 5,310.4 5,420.7 5,775.6Mexico . . . . . . . . . . . . . . . . . . . . . . . . . . . 939.4 1,253.4 1,471.4 1,495.2 1,786.7 2,233.1 2,289.2 2,634.1All other . . . . . . . . . . . . . . . . . . . . . . . . . . 12,738.8 16,067.9 18,275.6 18,077.3 18,141.1 18,573.8 17,539.4 17,902.4Total . . . . . . . . . . . . . . . . . . . . . . . . . . . 16,347.5 20,375.6 22,932.2 24,530.0 25,064.9 26,117.3 25,249.3 26,312.2
PercentCanada/Total . . . . . . . . . . . . . . . . . . . . . . . 16.3 15.0 13.9 20.2 20.5 20.3 21.5 22.0Mexico/Total . . . . . . . . . . . . . . . . . . . . . . . . 5.8 6.2 6.4 6.1 7.1 8.6 9.1 10.0U.S. export growthCanada . . . . . . . . . . . . . . . . . . . . . . . . . . . — 14.4 4.3 55.7 3.6 3.4 2.1 6.6Mexico . . . . . . . . . . . . . . . . . . . . . . . . . . . — 33.4 17.4 1.6 19.5 25.0 2.5 15.1All other . . . . . . . . . . . . . . . . . . . . . . . . . . — 26.1 13.7 -1.1 0.4 2.4 -5.6 2.1Total . . . . . . . . . . . . . . . . . . . . . . . . . . . — 24.6 12.6 7.0 2.2 4.2 -3.3 4.2
See footnote at end of table.
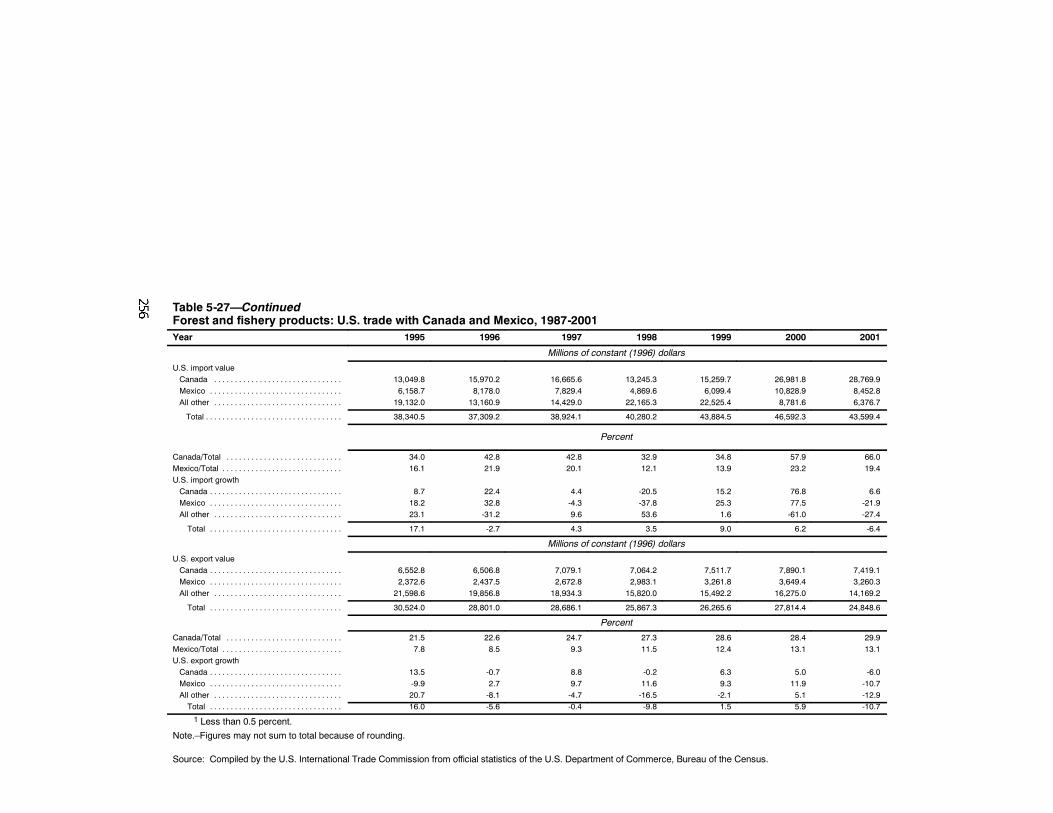
Table 5-27—ContinuedForest and fishery products: U.S. trade with Canada and Mexico, 1987-2001Year 1995 1996 1997 1998 1999 2000 2001
Millions of constant (1996) dollars
U.S. import valueCanada . . . . . . . . . . . . . . . . . . . . . . . . . . . . . . . 13,049.8 15,970.2 16,665.6 13,245.3 15,259.7 26,981.8 28,769.9Mexico . . . . . . . . . . . . . . . . . . . . . . . . . . . . . . . . 6,158.7 8,178.0 7,829.4 4,869.6 6,099.4 10,828.9 8,452.8All other . . . . . . . . . . . . . . . . . . . . . . . . . . . . . . . 19,132.0 13,160.9 14,429.0 22,165.3 22,525.4 8,781.6 6,376.7
Total . . . . . . . . . . . . . . . . . . . . . . . . . . . . . . . . . 38,340.5 37,309.2 38,924.1 40,280.2 43,884.5 46,592.3 43,599.4
Percent
Canada/Total . . . . . . . . . . . . . . . . . . . . . . . . . . . . 34.0 42.8 42.8 32.9 34.8 57.9 66.0Mexico/Total . . . . . . . . . . . . . . . . . . . . . . . . . . . . . 16.1 21.9 20.1 12.1 13.9 23.2 19.4U.S. import growthCanada . . . . . . . . . . . . . . . . . . . . . . . . . . . . . . . . 8.7 22.4 4.4 -20.5 15.2 76.8 6.6Mexico . . . . . . . . . . . . . . . . . . . . . . . . . . . . . . . . 18.2 32.8 -4.3 -37.8 25.3 77.5 -21.9All other . . . . . . . . . . . . . . . . . . . . . . . . . . . . . . . 23.1 -31.2 9.6 53.6 1.6 -61.0 -27.4
Total . . . . . . . . . . . . . . . . . . . . . . . . . . . . . . . . 17.1 -2.7 4.3 3.5 9.0 6.2 -6.4
Millions of constant (1996) dollars
U.S. export valueCanada . . . . . . . . . . . . . . . . . . . . . . . . . . . . . . . . 6,552.8 6,506.8 7,079.1 7,064.2 7,511.7 7,890.1 7,419.1Mexico . . . . . . . . . . . . . . . . . . . . . . . . . . . . . . . . 2,372.6 2,437.5 2,672.8 2,983.1 3,261.8 3,649.4 3,260.3All other . . . . . . . . . . . . . . . . . . . . . . . . . . . . . . . 21,598.6 19,856.8 18,934.3 15,820.0 15,492.2 16,275.0 14,169.2
Total . . . . . . . . . . . . . . . . . . . . . . . . . . . . . . . . 30,524.0 28,801.0 28,686.1 25,867.3 26,265.6 27,814.4 24,848.6
Percent
Canada/Total . . . . . . . . . . . . . . . . . . . . . . . . . . . . 21.5 22.6 24.7 27.3 28.6 28.4 29.9Mexico/Total . . . . . . . . . . . . . . . . . . . . . . . . . . . . . 7.8 8.5 9.3 11.5 12.4 13.1 13.1U.S. export growthCanada . . . . . . . . . . . . . . . . . . . . . . . . . . . . . . . . 13.5 -0.7 8.8 -0.2 6.3 5.0 -6.0Mexico . . . . . . . . . . . . . . . . . . . . . . . . . . . . . . . . -9.9 2.7 9.7 11.6 9.3 11.9 -10.7All other . . . . . . . . . . . . . . . . . . . . . . . . . . . . . . . 20.7 -8.1 -4.7 -16.5 -2.1 5.1 -12.9Total . . . . . . . . . . . . . . . . . . . . . . . . . . . . . . . . 16.0 -5.6 -0.4 -9.8 1.5 5.9 -10.7
1 Less than 0.5 percent.
Note.–Figures may not sum to total because of rounding.
Source: Compiled by the U.S. International Trade Commission from official statistics of the U.S. Department of Commerce, Bureau of the Census.
257
much real effect on U.S. trade with NAFTA partners. U.S. tariffs on NAFTAimports in this sector averaged 0.1 percent ad valorem before the agreementand less than 0.1 percent after. About 75 percent of NAFTA trade in thissector is between the United States and Canada, where, as noted above, tradedisputes have been addressed in other fora besides NAFTA.
Uruguay RoundU.S. trade in the forestry and fishery products sector increased from $69.3
billion in 1995, the year the Uruguay Round Agreements were implemented, to$75 billion in 2000, before returning to its 1995 level in 2001. Sector importsduring this period grew from $38.3 billion in 1995 to a record $46.6 billion in2000, before falling to $43.6 billion in 2001. Sector exports during the sameperiod fell from $31.0 billion in 1995 to $28.8 billion in 2000, and further to$25.8 billion in 2001. Industry shipments rose from $486.9 billion in 1995 to$494.4 billion in 2000, an increase of $7.5 billion, or 2 percent. They thendropped to $452.6 billion in 2001.
The Uruguay Round Agreements addressed a variety of issues, includingtariffs, which as noted above were already quite low. The average U.S. tariff inthis sector was 0.5 percent ad valorem prior to the Agreements and 0.3 percentby 1999. Other issues addressed in the round included antidumping andsubsidies rules, technical barriers, and customs valuation, among other topics.However, none of these appear to have had any appreciable effects on thissector. Rather, the greatest impacts on U.S. production and trade come aboutfrom macroeconomic events such as recessions and currency fluctuations. TheAsian financial crisis, for example, or the 1981 and 2001 U.S. recessions, alongwith the recent strong U.S. dollar (especially vis-à-vis currencies of majorcompeting sector exporters) most likely have had much greater influence onU.S. trade in this sector than the Uruguay Round Agreements.235
Views of Interested Parties
American Forest & Paper Association236
American Forest and Paper Association (AF&PA) is the national tradeassociation of the forest, pulp, paper, paperboard, and wood products industry.In its view, tariffs are the principal factor impairing the competitiveness of the
235 This is also because the Agreements had no connection to the Softwood LumberAgreement or any other bilateral negotiations on that issue.
236 Jacob Handelsman, Senior Director, International Trade, and Elizabeth Ward,Executive Director, Wood Products International, American Forest & Paper Association,written submission to the Commission, Mar. 31, 2003.
258
U.S. forest products industry, and it believes that “no progress has been madeon multilateral tariff elimination in the wood products sector and only partialprogress has been achieved in the paper sector.” Regional FTAs to which theUnited States is not a party have only exacerbated the competitivenessproblem by shutting out the U.S. industry from those markets. Besides tariffs,foreign sanitary and phytosanitary (SPS) measures and producer subsides alsocreate significant U.S. competitive disadvantages for this sector. In general,U.S. exports have fallen in recent years, according to the AF&PA, because ofthe downturn in the Japanese housing market, the strong U.S. dollar, andother macroeconomic factors.
Tokyo and Uruguay RoundsThese Rounds led to declines or elimination of U.S. tariffs in this sector
without corresponding cuts by trading partners, “locking in” a U.S. competitivedisadvantage. In particular, the failure to achieve “zero-for-zero” cuts in woodproducts tariffs with Japan has put the U.S. industry at a disadvantage.Developing countries also have not liberalized their markets or industries, tothe detriment of the U.S. industry. Subsidies in both developing and developedeconomies abroad continue to create competition for U.S. exports. SPSdisciplines negotiated in the Uruguay Round are important to the industry andAF&PA opposes any attempt to evade such disciplines, such as attempts by theEU to block U.S. trade with SPS measures based on other than scientificgrounds.
NAFTAMexico is an important market for U.S. wood products, because there is
limited domestic production in Mexico. However, the lengthy staging-in periodfor Mexican tariff reduction has limited U.S. exports below what they mightotherwise have been. The strong dollar vis-a-vis competing exporters inlow-cost countries has also hurt U.S. export potential in Mexico. On the otherhand, U.S. paper product exports to Mexico have been “thriving.”
United States Tuna Foundation237
The United States Tuna Foundation (USTF) is a trade associationrepresenting all U.S. canned tuna processors and tuna boat owners. USTF hasconsistently opposed inclusion of canned tuna in the trade agreementsexamined in this report. USTF notes that several ITC reports have describedthe “import sensitive” nature of the product, as well as the decline of the U.S.industry due to imports.
237 Randi Parks Thomas, United States Tuna Foundation, written submission to theCommission, Mar. 31, 2003.
259
During the period under review, the canning sector has shrunk from 14establishments to four, and employment has declined from more than 26,000 toslightly more than 6,000 in 2002. All but one mainland-based establishmenthave closed, and only three remain in American Samoa and Puerto Rico. In theharvesting sector, the number of boats and employment thereon have similarlydeclined. During the last ten years, imports of canned tuna have risen by 10percent and imports of frozen tuna (which, along with frozen tuna delivered byharvesting vessels, is used by canners to make canned tuna) have risen by 67percent.
USTF notes that tariffs on canned tuna imports in other large marketsremain high, for example, the tariff is 24 percent ad valorem in the EU. Mostimports into both the United States and the EU come from low-wage countriesthat, in many cases, already have duty preferences (e.g., GSP, ATPA), andfurther declines in U.S. tariff protection for the industry would further weakenthe economic health of the canners and boats.
Energy and Fuels238The United States is a major world producer and consumer of energy and
fuels as well as a large net importer. The United States accounts for only 9percent of the world’s production but 26 percent of the world’s consumption ofcrude petroleum; 24 percent of production and 26 percent of consumption ofrefined petroleum products; 22 percent of production and 26 percent ofconsumption of natural gas; and 21 percent of both production andconsumption of coal (table 5-28).239
The major economic, technological, and regulatory forces affecting thissector are highly interdependent. As demand for petroleum and the availabilityof low-cost supplies fluctuated during the past two decades, investment inexploration and drilling services also fluctuated widely. The world crudepetroleum industry essentially recovers and distributes a finite, non-renewableresource. Exploration and drilling is directly tied to the per-barrel price ofcrude petroleum. As the price of crude petroleum increases, so does explorationand drilling. Conversely, if the price is low, drilling in certain areas ceases.
The U.S. industries producing energy and fuels are the world’s leaders inresearch and development of the sophisticated, high-tech processes andequipment used to explore for and produce the products in this sector.Technological innovations in the sector tend to concentrate on improving therecovery of material from already discovered resources. Many of the U.S.petroleum companies have developed expertise in this area and have applied itin the development of reserves in other areas of the world. Specific
238 For the purposes of this investigation, the energy and fuels sector is composed ofSICs 12, 13, and 29, which include the production of coal, crude petroleum, natural gas,and refined petroleum products.
239 Based on official statistics of the U.S. Department of Energy.
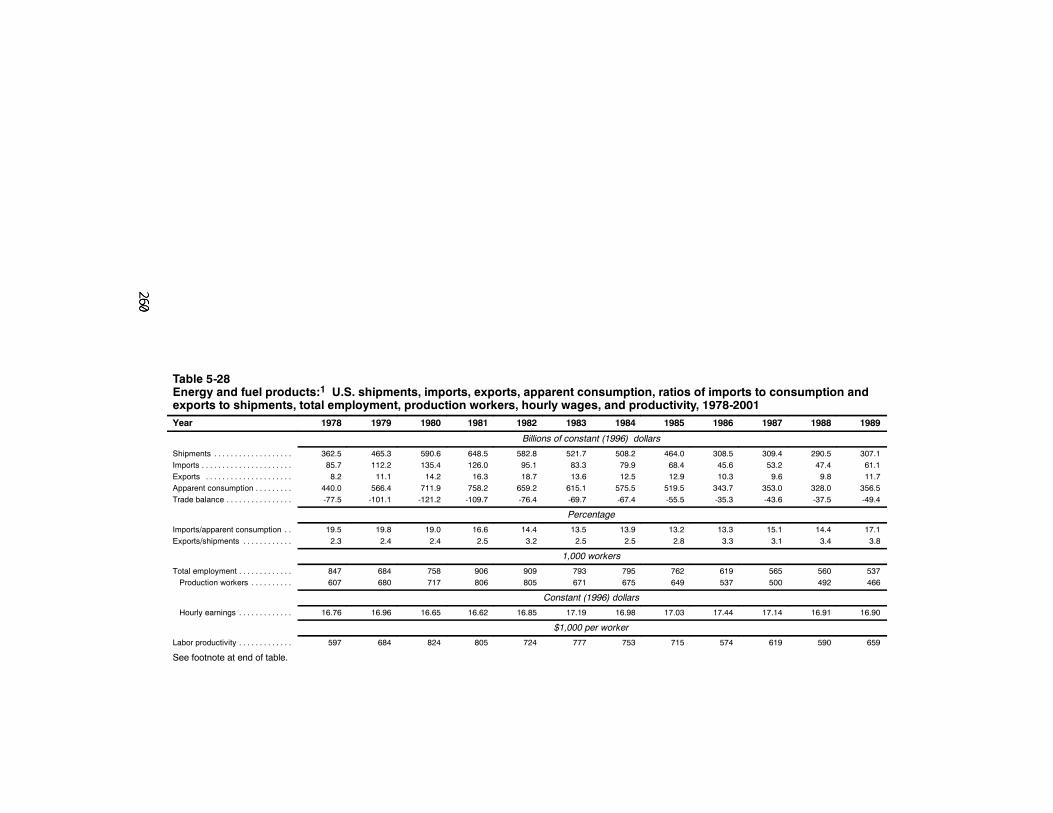
Table 5-28Energy and fuel products:1 U.S. shipments, imports, exports, apparent consumption, ratios of imports to consumption andexports to shipments, total employment, production workers, hourly wages, and productivity, 1978-2001Year 1978 1979 1980 1981 1982 1983 1984 1985 1986 1987 1988 1989
Billions of constant (1996) dollars
Shipments . . . . . . . . . . . . . . . . . . . 362.5 465.3 590.6 648.5 582.8 521.7 508.2 464.0 308.5 309.4 290.5 307.1Imports . . . . . . . . . . . . . . . . . . . . . . 85.7 112.2 135.4 126.0 95.1 83.3 79.9 68.4 45.6 53.2 47.4 61.1Exports . . . . . . . . . . . . . . . . . . . . . 8.2 11.1 14.2 16.3 18.7 13.6 12.5 12.9 10.3 9.6 9.8 11.7Apparent consumption . . . . . . . . . 440.0 566.4 711.9 758.2 659.2 615.1 575.5 519.5 343.7 353.0 328.0 356.5Trade balance . . . . . . . . . . . . . . . . -77.5 -101.1 -121.2 -109.7 -76.4 -69.7 -67.4 -55.5 -35.3 -43.6 -37.5 -49.4
Percentage
Imports/apparent consumption . . 19.5 19.8 19.0 16.6 14.4 13.5 13.9 13.2 13.3 15.1 14.4 17.1Exports/shipments . . . . . . . . . . . . 2.3 2.4 2.4 2.5 3.2 2.5 2.5 2.8 3.3 3.1 3.4 3.8
1,000 workers
Total employment . . . . . . . . . . . . . 847 684 758 906 909 793 795 762 619 565 560 537Production workers . . . . . . . . . . 607 680 717 806 805 671 675 649 537 500 492 466
Constant (1996) dollars
Hourly earnings . . . . . . . . . . . . . 16.76 16.96 16.65 16.62 16.85 17.19 16.98 17.03 17.44 17.14 16.91 16.90
$1,000 per worker
Labor productivity . . . . . . . . . . . . . 597 684 824 805 724 777 753 715 574 619 590 659
See footnote at end of table.
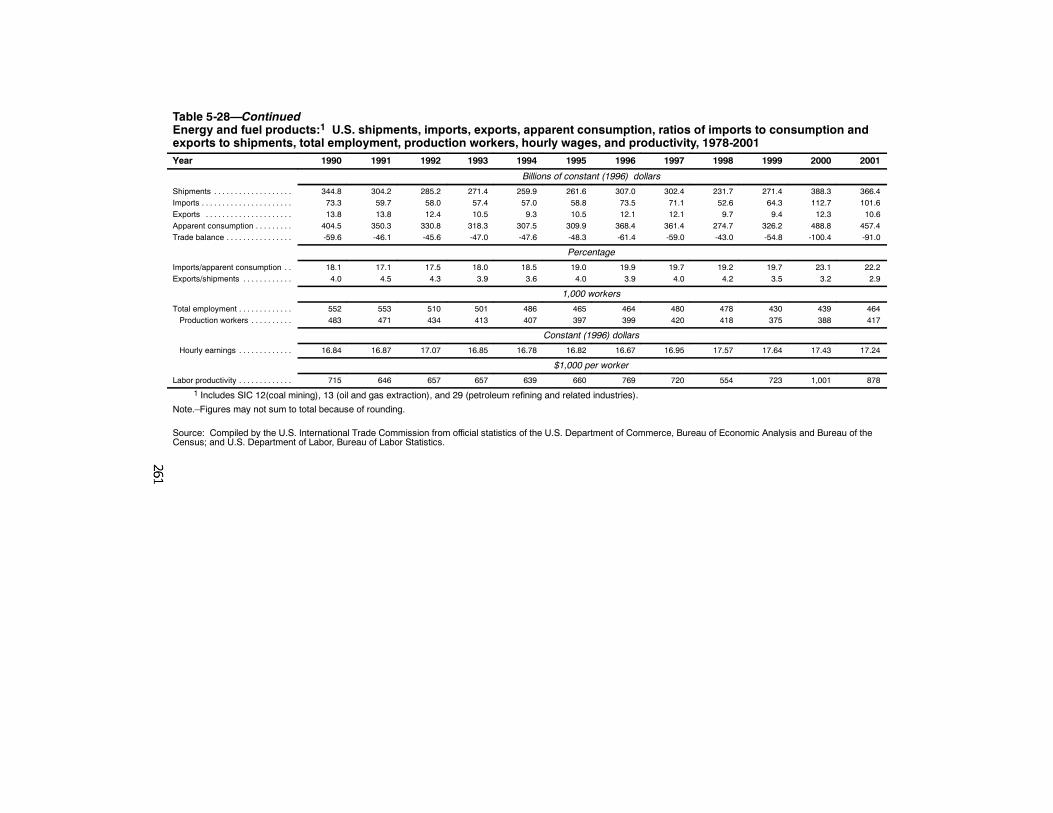
Table 5-28—ContinuedEnergy and fuel products:1 U.S. shipments, imports, exports, apparent consumption, ratios of imports to consumption andexports to shipments, total employment, production workers, hourly wages, and productivity, 1978-2001Year 1990 1991 1992 1993 1994 1995 1996 1997 1998 1999 2000 2001
Billions of constant (1996) dollars
Shipments . . . . . . . . . . . . . . . . . . . 344.8 304.2 285.2 271.4 259.9 261.6 307.0 302.4 231.7 271.4 388.3 366.4Imports . . . . . . . . . . . . . . . . . . . . . . 73.3 59.7 58.0 57.4 57.0 58.8 73.5 71.1 52.6 64.3 112.7 101.6Exports . . . . . . . . . . . . . . . . . . . . . 13.8 13.8 12.4 10.5 9.3 10.5 12.1 12.1 9.7 9.4 12.3 10.6Apparent consumption . . . . . . . . . 404.5 350.3 330.8 318.3 307.5 309.9 368.4 361.4 274.7 326.2 488.8 457.4Trade balance . . . . . . . . . . . . . . . . -59.6 -46.1 -45.6 -47.0 -47.6 -48.3 -61.4 -59.0 -43.0 -54.8 -100.4 -91.0
Percentage
Imports/apparent consumption . . 18.1 17.1 17.5 18.0 18.5 19.0 19.9 19.7 19.2 19.7 23.1 22.2Exports/shipments . . . . . . . . . . . . 4.0 4.5 4.3 3.9 3.6 4.0 3.9 4.0 4.2 3.5 3.2 2.9
1,000 workers
Total employment . . . . . . . . . . . . . 552 553 510 501 486 465 464 480 478 430 439 464Production workers . . . . . . . . . . 483 471 434 413 407 397 399 420 418 375 388 417
Constant (1996) dollars
Hourly earnings . . . . . . . . . . . . . 16.84 16.87 17.07 16.85 16.78 16.82 16.67 16.95 17.57 17.64 17.43 17.24
$1,000 per worker
Labor productivity . . . . . . . . . . . . . 715 646 657 657 639 660 769 720 554 723 1,001 878
1 Includes SIC 12(coal mining), 13 (oil and gas extraction), and 29 (petroleum refining and related industries).
Note.–Figures may not sum to total because of rounding.
Source: Compiled by the U.S. International Trade Commission from official statistics of the U.S. Department of Commerce, Bureau of Economic Analysis and Bureau of theCensus; and U.S. Department of Labor, Bureau of Labor Statistics.
262
developments, such as horizontal drilling and the injection of certainchemicals into wells, have increased considerably the amount of material thatcan be recovered from wells that were at one time considered to be dry. Inaddition, the United States maintains a sophisticated transportation systemconsisting of pipelines, barges, railroads, and trucks to move product frompoints of production to consuming areas.
There are about 19,000 to 20,000 companies involved in the production ofenergy and fuels in the United States. Many are small companies thatindividually and collectively account for relatively small shares of total U.S.production of crude petroleum, refined petroleum products, natural gas, andcoal. There are also many large, multinational companies in the United Statesthat are involved in both foreign production and importing into the UnitedStates. Most of these companies are also involved in refining andpetrochemical production. Approximately 50 of the largest companies accountfor about 80 percent of total U.S. sector production. Employment in the U.S.energy and fuels sector, which fluctuated during 1978-2001, decreased from847,000 workers in 1978 to 464,000 in 2001, mainly due to the declines inworld prices for crude petroleum, technological advances, and the closure ofstripper wells.240
The value of U.S. shipments of energy and fuels fluctuated erratically from$362.5 billion in 1978 to $366.4 billion in 2001, peaking at $648.5 billion in1981 and reaching a low of $231.7 billion in 1998. Crude petroleum accountsfor an average of 13 percent of the value of shipments for the sector; refinedpetroleum products accounts for 38 percent; natural gas accounts for39 percent; and coal accounts for 10 percent. However, the price of crudepetroleum, which influences the quantity of production and shipments of theseproducts, fluctuated during 1978-2001 from a low of $9.00 per barrel in 1978to a high of $28.26 per barrel in 2000 (in constant 1996 dollars).241
U.S. production of crude petroleum declined from 8.7 million barrels perday (b/d) in 1978 to 5.8 b/d in 2001 as a result of many factors, most notablydeclining world crude petroleum prices in the mid-1980s that resulted in thereduced profitability of certain high cost U.S. stripper wells, many of whichwere shut down. U.S. production declined each year during the period,reaching its lowest point in 2000 and 2001. Natural gas production during theperiod remained relatively stable at about 19.1 trillion cubic feet. Prices fornatural gas generally mirror crude petroleum prices—over 90 percent of U.S.natural gas production is associated242 with the production of crude petroleum.
240 A stripper well is one which produces such small volumes of crude petroleumthat the gross income provides only a small margin of profit or, in some cases, does noteven cover the actual cost of production.
241 Based on official statistics of the U.S. Department of Energy.242 Associated natural gas occurs in the form of a gas cap in a crude petroleum well.
The natural gas is separated from the crude petroleum at the wellhead and shipped viapipelines to natural gas processing plants.
263
Natural gas prices (per thousand cubic feet), fluctuated from a low of $0.91in 1978 to a high of $4.12 in 2001. Wellhead prices of natural gas increasedsignificantly in 2001, primarily because the supply in California wasinadequate to meet the demand of industrial users.243 U.S. production ofrefined petroleum products, which accounts for an average of about 85 to 90percent of domestic consumption, increased from 18.8 million barrels per day(b/d) in 1978 to 19.6 million b/d in 2001. U.S. petroleum refineries, whichare designed to operate at 85 percent capacity utilization, are currentlyoperating at more than 95 percent, a level that cannot be sustainedindefinitely. U.S. production of coal increased from 670 million short tons in1978 to 1.1 billion short tons in 2001, based on increased demand.244
The United States is a major world importer of energy and fuels. In termsof quantity, the United States accounts for an average of 24 percent of the totalworld’s imports of crude petroleum, which have accounted for more than 50percent of domestic consumption since the mid 1990s. U.S. imports of crudepetroleum increased from 6.4 million b/d in 1978 to 9.8 million b/d in 2001.Also, since the mid 1990s, the United States has accounted for an average of17 percent of total world imports of natural gas,245 13 percent for refinedpetroleum products, and 2 percent for coal. U.S. imports of natural gasincreased from 966 billion cubic feet in 1978 to 4.0 trillion cubic feet in 2001and imports of refined petroleum products fluctuated but remained relativelystable, increasing overall from 2.0 million b/d in 1978 to 2.5 million b/d in2001. The United States is not a net importer of coal; however, U.S. importsincreased from 2.9 million short tons in 1978 to 19.8 million short tons in2001, most of which were imports of coke from China.
Except for coal, the United States is not a major exporter of energy andfuels, accounting for a minimal share of total world exports. The United Stateshas abundant coal reserves and is the world’s third largest supplier of coalbehind Australia and South Africa. The United States accounts for an averageof 11 percent of the world’s total coal exports. U.S. exports of crude petroleumaccount for less than 0.5 percent of total world exports, natural gas accountsfor 0.8 percent, and refined petroleum products account for less than 5 percent.U.S. exports of crude petroleum are prohibited, except as approved by the
243 On Mar. 26, 2003, the Federal Energy Regulatory Commission (FERC)announced that its investigation into the California energy crisis found widespreadmanipulation of natural gas and electricity prices and supplies in California.
244 Based on official statistics of the U.S. Department of Energy.245 Natural gas is most efficiently and least expensively transported in its gaseous
state via pipeline, thus limiting import sources and export markets to those connected tothe intricate and sophisticated U.S. pipeline system, primarily Canada and, to a lesserextent, Mexico. While the United States has the capability to liquify and transportliquified natural gas (LNG) via tanker from ports on both the East and West Coast, manyforeign markets do not have LNG receiving terminals, which are highly sophisticatedand extremely expensive to build and maintain.
264
Government.246 Canada has been the only consistent market for U.S. exportsof crude petroleum as part of a commercial exchange agreement. U.S.exports of crude petroleum ranged from a high of 287,000 b/d in 1980 to alow of 20,000 b/d in 2001. The U.S. market consumes an average of98 percent of the total U.S. production of refined petroleum products. U.S.exports of refined petroleum products increased from 204,000 b/d in 1978 to951,000 b/d in 2001. Approximately 99 percent of U.S. exports of naturalgas are shipped via pipeline in a gaseous state; exports of natural gas rangedfrom a low of 49 billion cubic feet in 1980 to a high of 364 billion cubicfeet in 2001. U.S. exports of coal ranged from a low of 40.7 million shorttons in 1978 to a high of 112.5 million short tons in 1981.
Effect of Trade Agreements on the SectorThe five trade agreements that are the subject of this investigation have had
little, if any, direct effect on U.S. production and trade in this sector. Of theproducts covered in this sector, both natural gas and coal were already dutyfree, and duty rates for crude petroleum and refined petroleum products werealready very low, averaging less than 1 percent ad valorem prior to the TokyoRound. In addition, the duty rates for refined petroleum products are bound inthe GATT. Table 5-29 presents trade issues addressed by the subject tradeagreements that were relevant to the sector.
The primary driving force in the supply and demand of energy and fuels isthe per barrel price of crude petroleum. The crude petroleum market is globalwith prices that are closely linked. U.S. crude petroleum prices are almostidentical to those in other producing and consuming nations, indicating thatprices are determined by world demand and supply. During 1978-2001, crudepetroleum price fluctuations were not generally affected by trade agreementsbut were largely driven by market events.
The many unrelated events occurred that shocked prices during 1998illustrate how market forces affect the sector. During the first quarter of 1998,Asia entered into a period of economic crisis and, after two years of fairlysteady growth in demand for crude petroleum, world demand fell by 500,000b/d, causing price drops of $3 to $5 per barrel. Compounding the Asianeconomic crisis was the abnormally warm winter in the United States, Europe,and Asia. As a result, by May, supply outpaced demand, stocks began to build,
246 U.S. exports are restricted to: (1) crude petroleum derived from fields under theState waters of Alaska’s Cook Inlet; (2) Alaskan North Slope (ANS) crude; (3) certaindomestically produced crude destined to Canada as part of a commercial exchangeagreement; (4) production shipped from U.S. territories; and (5) small shipments ofCalifornia crude to Pacific Rim countries. U.S. exports of crude petroleum account forless than 0.5 percent of total U.S. production and less than 2 percent of Cook Inlet andANS crude petroleum production.
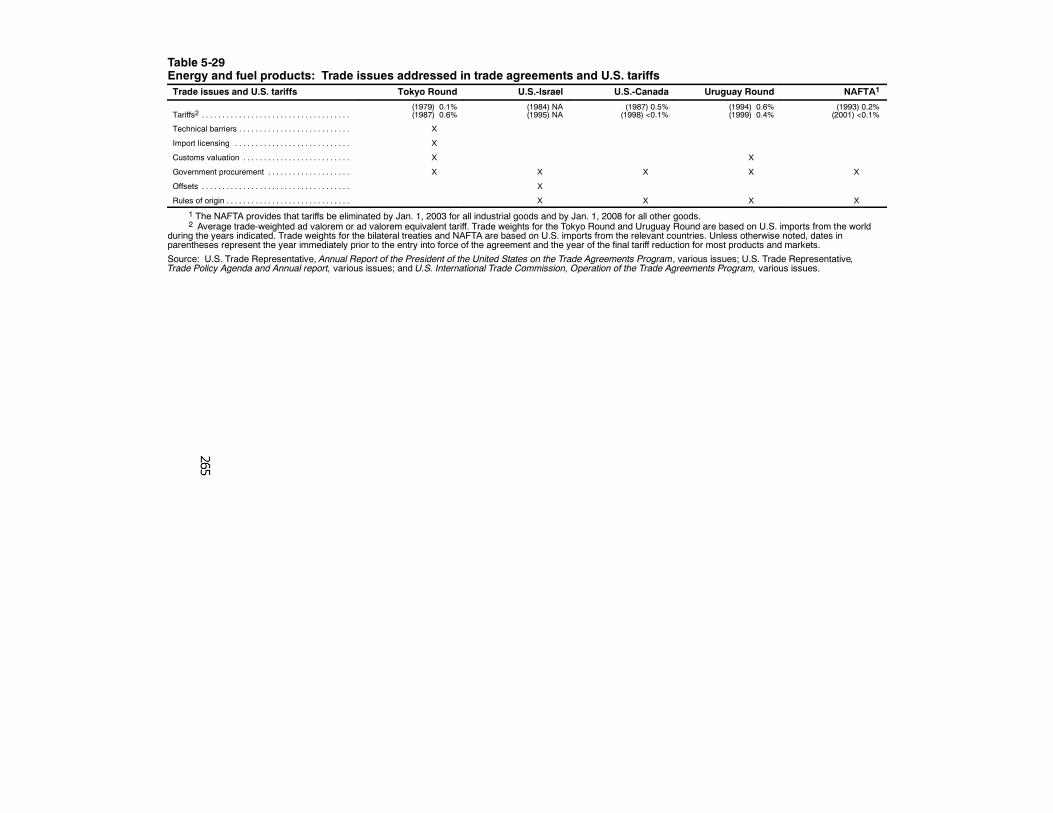
Table 5-29Energy and fuel products: Trade issues addressed in trade agreements and U.S. tariffsTrade issues and U.S. tariffs Tokyo Round U.S.-Israel U.S.-Canada Uruguay Round NAFTA1
Tariffs2 . . . . . . . . . . . . . . . . . . . . . . . . . . . . . . . . . . . .(1979) 0.1%(1987) 0.6%
(1984) NA(1995) NA
(1987) 0.5%(1998) <0.1%
(1994) 0.6%(1999) 0.4%
(1993) 0.2%(2001) <0.1%
Technical barriers . . . . . . . . . . . . . . . . . . . . . . . . . . . X
Import licensing . . . . . . . . . . . . . . . . . . . . . . . . . . . . X
Customs valuation . . . . . . . . . . . . . . . . . . . . . . . . . . X X
Government procurement . . . . . . . . . . . . . . . . . . . . X X X X X
Offsets . . . . . . . . . . . . . . . . . . . . . . . . . . . . . . . . . . . . X
Rules of origin . . . . . . . . . . . . . . . . . . . . . . . . . . . . . . X X X X
1 The NAFTA provides that tariffs be eliminated by Jan. 1, 2003 for all industrial goods and by Jan. 1, 2008 for all other goods.2 Average trade-weighted ad valorem or ad valorem equivalent tariff. Trade weights for the Tokyo Round and Uruguay Round are based on U.S. imports from the world
during the years indicated. Trade weights for the bilateral treaties and NAFTA are based on U.S. imports from the relevant countries. Unless otherwise noted, dates inparentheses represent the year immediately prior to the entry into force of the agreement and the year of the final tariff reduction for most products and markets.
Source: U.S. Trade Representative, Annual Report of the President of the United States on the Trade Agreements Program, various issues; U.S. Trade Representative,Trade Policy Agenda and Annual report, various issues; and U.S. International Trade Commission, Operation of the Trade Agreements Program, various issues.
266
and prices declined by approximately $6 per barrel.247 Prices had returned toan average of $15 per barrel by August when Russia increased crudepetroleum exports to the world market in an effort to earn dollars and offsetlosses from the depreciating ruble. At the same time, the Chinesegovernment, in an effort to preserve hard currency and encourage economicgrowth, drastically reduced fourth quarter imports.248 These events in Russiaand China had the effect of increasing supply by 600,000 to 800,000 b/d. Inaddition, the United Nations allowed Iraq to export $2 billion of crudepetroleum every six months for humanitarian reasons, which resulted inadditional price declines.249 All trade agreements enacted during 1978-2001were overshadowed by events such as those occurring during 1998, whichdetermined price and demand for energy and fuels. There was little or nodirect impact on petroleum trade as a result of the Tokyo Round and theU.S.-Israel FTA. Rates of duty for crude petroleum and refined petroleumproducts were already very low prior to the entry into force of theseagreements. In addition, Israel accounted for a very small share of totalsector trade (table 5-30).
U.S.-Canada FTAThere was little or no direct impact on petroleum trade as a result of the
United States-Canada FTA. Under the United States-Canada FTA, Canadaremained the only market for U.S. exports of crude petroleum under acommercial exchange agreement approved by the U.S. Government, wherebyU.S. exports of crude are exchanged for imports of refined petroleum products.In addition, a sophisticated pipeline system connects the United States andCanada. Many of the large multinational petroleum companies in the UnitedStates also maintain operations in Canada, frequently shipping feedstocks andproducts between their plants in the two countries.
NAFTATable 5-31 provides data on U.S. sector trade with Canada and Mexico.
There was little or no direct impact on petroleum trade as a result of theNAFTA, which reduced duty rates to free in 2003. The NAFTA reaffirmed theprovisions of the U.S.-Canada FTA in terms of petroleum (crude petroleum andrefined petroleum products). The United States is Mexico’s major tradingpartner, accounting for 60 percent of Mexico’s exports of crude petroleum. TheUnited States is the major source of Mexico’s imports of refined petroleumproducts; Mexico’s nine operating refineries cannot meet domestic demand forrefined petroleum products. Mexican trade with Canada in petroleum is
247 Based on official statistics of the U.S. Department of Energy.248 Industry representative, interview with USITC staff, Nov. 20, 2002.249 Industry representative, interview with USITC staff, Nov. 20, 2002.
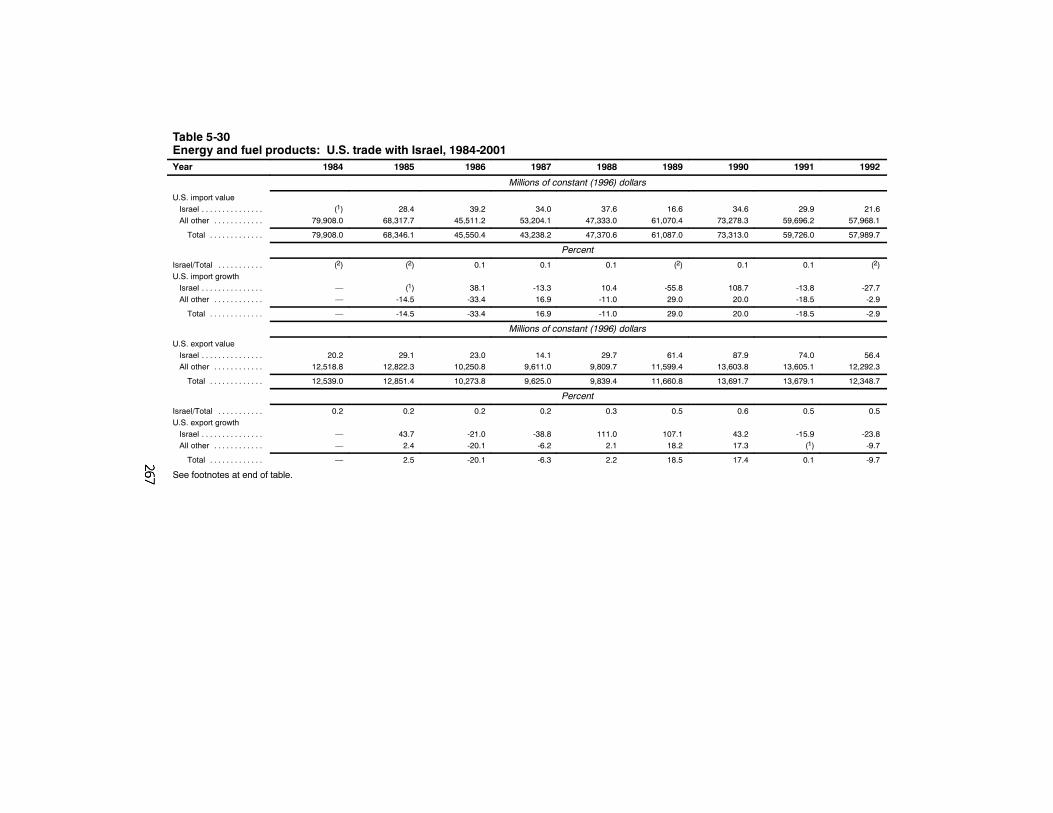
Table 5-30Energy and fuel products: U.S. trade with Israel, 1984-2001Year 1984 1985 1986 1987 1988 1989 1990 1991 1992
Millions of constant (1996) dollars
U.S. import valueIsrael . . . . . . . . . . . . . . . (1) 28.4 39.2 34.0 37.6 16.6 34.6 29.9 21.6All other . . . . . . . . . . . . 79,908.0 68,317.7 45,511.2 53,204.1 47,333.0 61,070.4 73,278.3 59,696.2 57,968.1
Total . . . . . . . . . . . . . 79,908.0 68,346.1 45,550.4 43,238.2 47,370.6 61,087.0 73,313.0 59,726.0 57,989.7
Percent
Israel/Total . . . . . . . . . . . (2) (2) 0.1 0.1 0.1 (2) 0.1 0.1 (2)U.S. import growthIsrael . . . . . . . . . . . . . . . — (1) 38.1 -13.3 10.4 -55.8 108.7 -13.8 -27.7All other . . . . . . . . . . . . — -14.5 -33.4 16.9 -11.0 29.0 20.0 -18.5 -2.9
Total . . . . . . . . . . . . . — -14.5 -33.4 16.9 -11.0 29.0 20.0 -18.5 -2.9
Millions of constant (1996) dollars
U.S. export valueIsrael . . . . . . . . . . . . . . . 20.2 29.1 23.0 14.1 29.7 61.4 87.9 74.0 56.4All other . . . . . . . . . . . . 12,518.8 12,822.3 10,250.8 9,611.0 9,809.7 11,599.4 13,603.8 13,605.1 12,292.3
Total . . . . . . . . . . . . . 12,539.0 12,851.4 10,273.8 9,625.0 9,839.4 11,660.8 13,691.7 13,679.1 12,348.7
Percent
Israel/Total . . . . . . . . . . . 0.2 0.2 0.2 0.2 0.3 0.5 0.6 0.5 0.5U.S. export growthIsrael . . . . . . . . . . . . . . . — 43.7 -21.0 -38.8 111.0 107.1 43.2 -15.9 -23.8All other . . . . . . . . . . . . — 2.4 -20.1 -6.2 2.1 18.2 17.3 (1) -9.7
Total . . . . . . . . . . . . . — 2.5 -20.1 -6.3 2.2 18.5 17.4 0.1 -9.7
See footnotes at end of table.
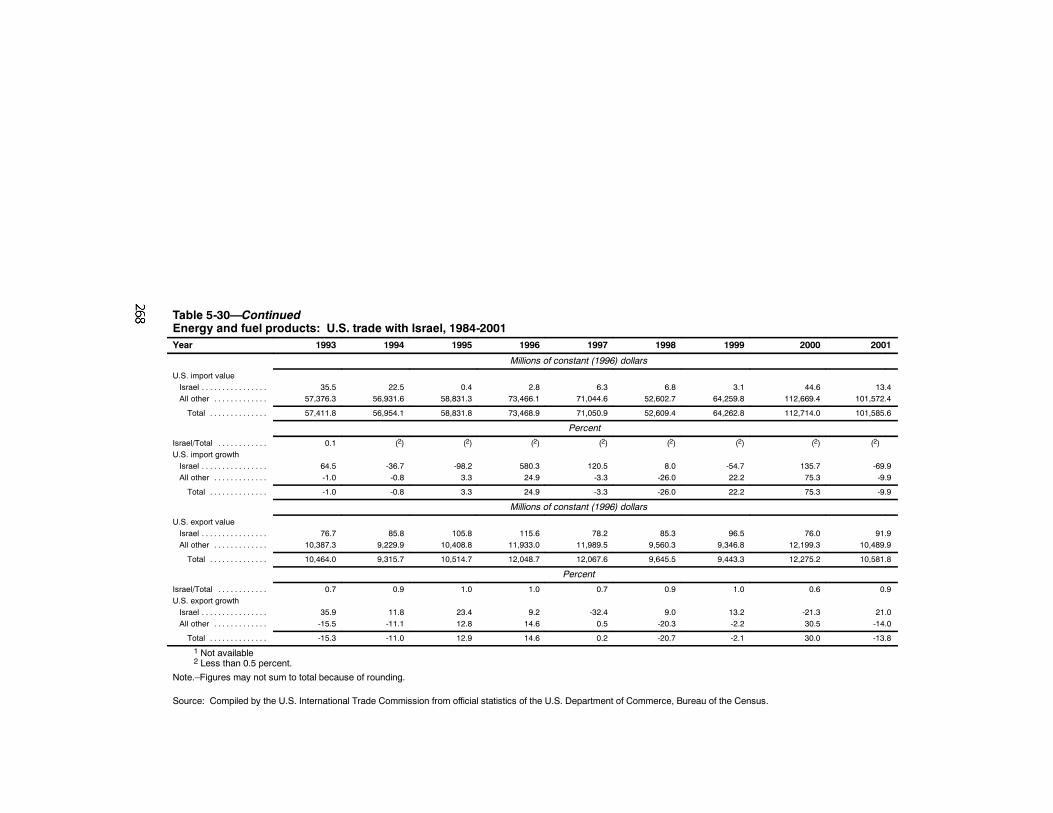
Table 5-30—ContinuedEnergy and fuel products: U.S. trade with Israel, 1984-2001Year 1993 1994 1995 1996 1997 1998 1999 2000 2001
Millions of constant (1996) dollars
U.S. import valueIsrael . . . . . . . . . . . . . . . . 35.5 22.5 0.4 2.8 6.3 6.8 3.1 44.6 13.4All other . . . . . . . . . . . . . 57,376.3 56,931.6 58,831.3 73,466.1 71,044.6 52,602.7 64,259.8 112,669.4 101,572.4
Total . . . . . . . . . . . . . . 57,411.8 56,954.1 58,831.8 73,468.9 71,050.9 52,609.4 64,262.8 112,714.0 101,585.6
Percent
Israel/Total . . . . . . . . . . . . 0.1 (2) (2) (2) (2) (2) (2) (2) (2)U.S. import growthIsrael . . . . . . . . . . . . . . . . 64.5 -36.7 -98.2 580.3 120.5 8.0 -54.7 135.7 -69.9All other . . . . . . . . . . . . . -1.0 -0.8 3.3 24.9 -3.3 -26.0 22.2 75.3 -9.9
Total . . . . . . . . . . . . . . -1.0 -0.8 3.3 24.9 -3.3 -26.0 22.2 75.3 -9.9
Millions of constant (1996) dollars
U.S. export valueIsrael . . . . . . . . . . . . . . . . 76.7 85.8 105.8 115.6 78.2 85.3 96.5 76.0 91.9All other . . . . . . . . . . . . . 10,387.3 9,229.9 10,408.8 11,933.0 11,989.5 9,560.3 9,346.8 12,199.3 10,489.9
Total . . . . . . . . . . . . . . 10,464.0 9,315.7 10,514.7 12,048.7 12,067.6 9,645.5 9,443.3 12,275.2 10,581.8
Percent
Israel/Total . . . . . . . . . . . . 0.7 0.9 1.0 1.0 0.7 0.9 1.0 0.6 0.9U.S. export growthIsrael . . . . . . . . . . . . . . . . 35.9 11.8 23.4 9.2 -32.4 9.0 13.2 -21.3 21.0All other . . . . . . . . . . . . . -15.5 -11.1 12.8 14.6 0.5 -20.3 -2.2 30.5 -14.0
Total . . . . . . . . . . . . . . -15.3 -11.0 12.9 14.6 0.2 -20.7 -2.1 30.0 -13.8
1 Not available2 Less than 0.5 percent.
Note.–Figures may not sum to total because of rounding.
Source: Compiled by the U.S. International Trade Commission from official statistics of the U.S. Department of Commerce, Bureau of the Census.
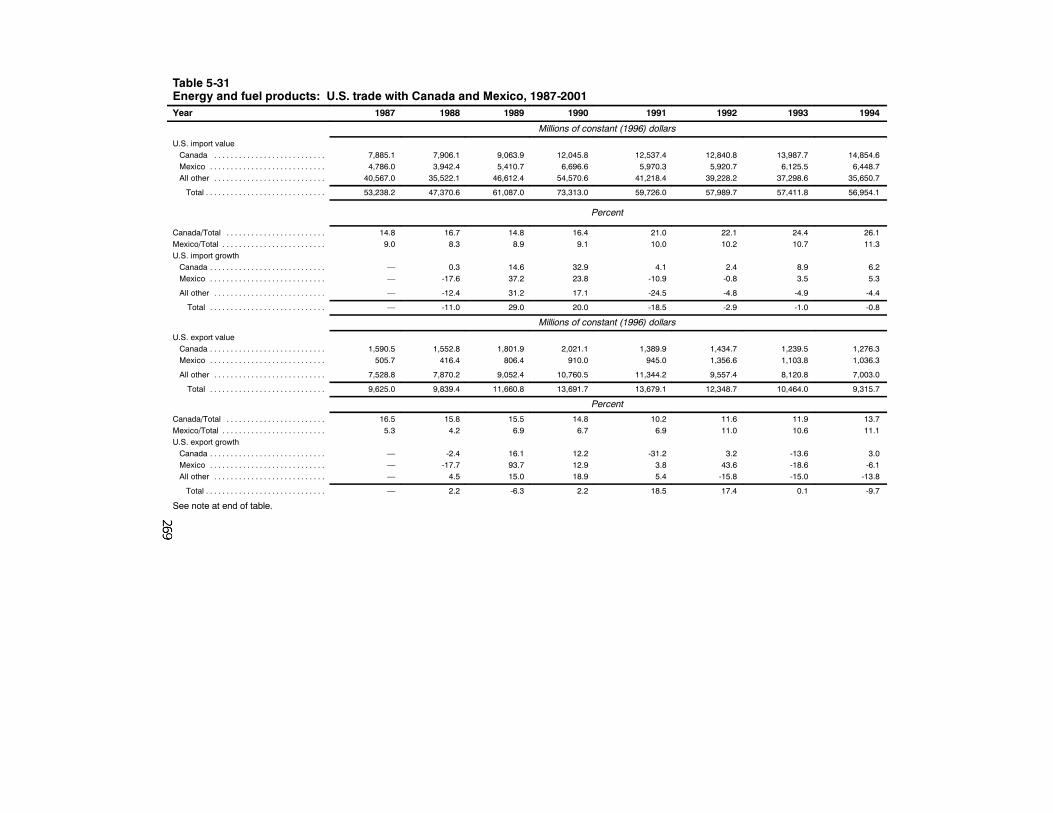
Table 5-31Energy and fuel products: U.S. trade with Canada and Mexico, 1987-2001Year 1987 1988 1989 1990 1991 1992 1993 1994
Millions of constant (1996) dollars
U.S. import valueCanada . . . . . . . . . . . . . . . . . . . . . . . . . . . 7,885.1 7,906.1 9,063.9 12,045.8 12,537.4 12,840.8 13,987.7 14,854.6Mexico . . . . . . . . . . . . . . . . . . . . . . . . . . . . 4,786.0 3,942.4 5,410.7 6,696.6 5,970.3 5,920.7 6,125.5 6,448.7All other . . . . . . . . . . . . . . . . . . . . . . . . . . . 40,567.0 35,522.1 46,612.4 54,570.6 41,218.4 39,228.2 37,298.6 35,650.7
Total . . . . . . . . . . . . . . . . . . . . . . . . . . . . . 53,238.2 47,370.6 61,087.0 73,313.0 59,726.0 57,989.7 57,411.8 56,954.1
Percent
Canada/Total . . . . . . . . . . . . . . . . . . . . . . . . 14.8 16.7 14.8 16.4 21.0 22.1 24.4 26.1Mexico/Total . . . . . . . . . . . . . . . . . . . . . . . . . 9.0 8.3 8.9 9.1 10.0 10.2 10.7 11.3U.S. import growthCanada . . . . . . . . . . . . . . . . . . . . . . . . . . . . — 0.3 14.6 32.9 4.1 2.4 8.9 6.2Mexico . . . . . . . . . . . . . . . . . . . . . . . . . . . . — -17.6 37.2 23.8 -10.9 -0.8 3.5 5.3
All other . . . . . . . . . . . . . . . . . . . . . . . . . . . — -12.4 31.2 17.1 -24.5 -4.8 -4.9 -4.4
Total . . . . . . . . . . . . . . . . . . . . . . . . . . . . — -11.0 29.0 20.0 -18.5 -2.9 -1.0 -0.8
Millions of constant (1996) dollars
U.S. export valueCanada . . . . . . . . . . . . . . . . . . . . . . . . . . . . 1,590.5 1,552.8 1,801.9 2,021.1 1,389.9 1,434.7 1,239.5 1,276.3Mexico . . . . . . . . . . . . . . . . . . . . . . . . . . . . 505.7 416.4 806.4 910.0 945.0 1,356.6 1,103.8 1,036.3
All other . . . . . . . . . . . . . . . . . . . . . . . . . . . 7,528.8 7,870.2 9,052.4 10,760.5 11,344.2 9,557.4 8,120.8 7,003.0
Total . . . . . . . . . . . . . . . . . . . . . . . . . . . . 9,625.0 9,839.4 11,660.8 13,691.7 13,679.1 12,348.7 10,464.0 9,315.7
Percent
Canada/Total . . . . . . . . . . . . . . . . . . . . . . . . 16.5 15.8 15.5 14.8 10.2 11.6 11.9 13.7Mexico/Total . . . . . . . . . . . . . . . . . . . . . . . . . 5.3 4.2 6.9 6.7 6.9 11.0 10.6 11.1U.S. export growthCanada . . . . . . . . . . . . . . . . . . . . . . . . . . . . — -2.4 16.1 12.2 -31.2 3.2 -13.6 3.0Mexico . . . . . . . . . . . . . . . . . . . . . . . . . . . . — -17.7 93.7 12.9 3.8 43.6 -18.6 -6.1All other . . . . . . . . . . . . . . . . . . . . . . . . . . . — 4.5 15.0 18.9 5.4 -15.8 -15.0 -13.8
Total . . . . . . . . . . . . . . . . . . . . . . . . . . . . . — 2.2 -6.3 2.2 18.5 17.4 0.1 -9.7
See note at end of table.
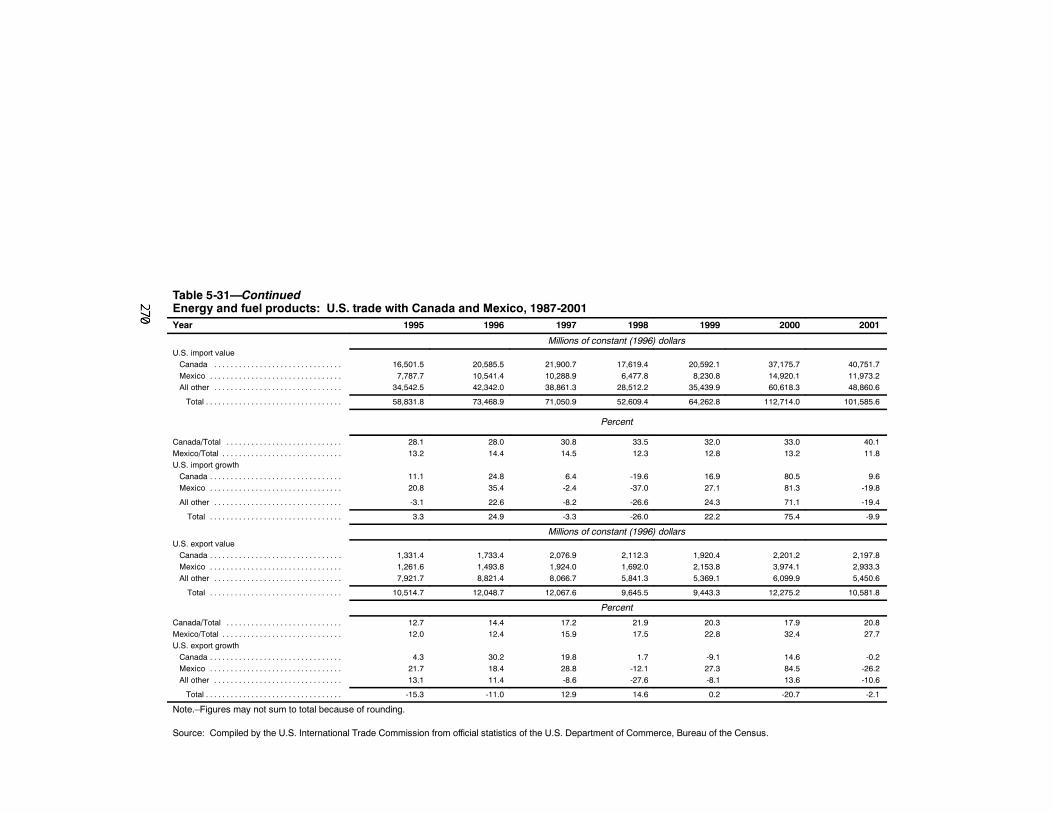
Table 5-31—ContinuedEnergy and fuel products: U.S. trade with Canada and Mexico, 1987-2001Year 1995 1996 1997 1998 1999 2000 2001
Millions of constant (1996) dollarsU.S. import valueCanada . . . . . . . . . . . . . . . . . . . . . . . . . . . . . . . 16,501.5 20,585.5 21,900.7 17,619.4 20,592.1 37,175.7 40,751.7Mexico . . . . . . . . . . . . . . . . . . . . . . . . . . . . . . . . 7,787.7 10,541.4 10,288.9 6,477.8 8,230.8 14,920.1 11,973.2All other . . . . . . . . . . . . . . . . . . . . . . . . . . . . . . . 34,542.5 42,342.0 38,861.3 28,512.2 35,439.9 60,618.3 48,860.6
Total . . . . . . . . . . . . . . . . . . . . . . . . . . . . . . . . . 58,831.8 73,468.9 71,050.9 52,609.4 64,262.8 112,714.0 101,585.6
Percent
Canada/Total . . . . . . . . . . . . . . . . . . . . . . . . . . . . 28.1 28.0 30.8 33.5 32.0 33.0 40.1Mexico/Total . . . . . . . . . . . . . . . . . . . . . . . . . . . . . 13.2 14.4 14.5 12.3 12.8 13.2 11.8U.S. import growthCanada . . . . . . . . . . . . . . . . . . . . . . . . . . . . . . . . 11.1 24.8 6.4 -19.6 16.9 80.5 9.6Mexico . . . . . . . . . . . . . . . . . . . . . . . . . . . . . . . . 20.8 35.4 -2.4 -37.0 27.1 81.3 -19.8
All other . . . . . . . . . . . . . . . . . . . . . . . . . . . . . . . -3.1 22.6 -8.2 -26.6 24.3 71.1 -19.4
Total . . . . . . . . . . . . . . . . . . . . . . . . . . . . . . . . 3.3 24.9 -3.3 -26.0 22.2 75.4 -9.9
Millions of constant (1996) dollarsU.S. export valueCanada . . . . . . . . . . . . . . . . . . . . . . . . . . . . . . . . 1,331.4 1,733.4 2,076.9 2,112.3 1,920.4 2,201.2 2,197.8Mexico . . . . . . . . . . . . . . . . . . . . . . . . . . . . . . . . 1,261.6 1,493.8 1,924.0 1,692.0 2,153.8 3,974.1 2,933.3All other . . . . . . . . . . . . . . . . . . . . . . . . . . . . . . . 7,921.7 8,821.4 8,066.7 5,841.3 5,369.1 6,099.9 5,450.6
Total . . . . . . . . . . . . . . . . . . . . . . . . . . . . . . . . 10,514.7 12,048.7 12,067.6 9,645.5 9,443.3 12,275.2 10,581.8
Percent
Canada/Total . . . . . . . . . . . . . . . . . . . . . . . . . . . . 12.7 14.4 17.2 21.9 20.3 17.9 20.8Mexico/Total . . . . . . . . . . . . . . . . . . . . . . . . . . . . . 12.0 12.4 15.9 17.5 22.8 32.4 27.7U.S. export growthCanada . . . . . . . . . . . . . . . . . . . . . . . . . . . . . . . . 4.3 30.2 19.8 1.7 -9.1 14.6 -0.2Mexico . . . . . . . . . . . . . . . . . . . . . . . . . . . . . . . . 21.7 18.4 28.8 -12.1 27.3 84.5 -26.2All other . . . . . . . . . . . . . . . . . . . . . . . . . . . . . . . 13.1 11.4 -8.6 -27.6 -8.1 13.6 -10.6
Total . . . . . . . . . . . . . . . . . . . . . . . . . . . . . . . . . -15.3 -11.0 12.9 14.6 0.2 -20.7 -2.1
Note.–Figures may not sum to total because of rounding.
Source: Compiled by the U.S. International Trade Commission from official statistics of the U.S. Department of Commerce, Bureau of the Census.
271
negligible because of the lack of pipeline infrastructure between the twonations; Mexico does export small quantities of crude petroleum to Canadavia tanker. Both countries are net petroleum exporters.
All segments of Mexico’s petroleum industry including the operations oftankers and pipelines, and trade of crude petroleum, natural gas, and refinedpetroleum products as well as oilfield services) remained under the solepurview of the Mexican state-owned Petroleos Mexicanos (PEMEX). TheNAFTA includes provisions that ensure the ability of a nation to protect itsnatural resources for reasons of national security. Crude petroleum is a nationalsecurity item, in accordance with the GATT.
Under the provisions of NAFTA, duty rates in the United States andCanada for crude petroleum and refined petroleum products, which averagedabout 0.5 percent ad valorem for crude petroleum and about 1 percent forrefined petroleum products, were reduced to free over a 10-year period.Mexico’s tariffs, which averaged about 5 percent ad valorem on crudepetroleum and 8.6 percent ad valorem on refined petroleum products, werereduced to free over the same 10-year period. Canada and the United Stateshave historically maintained a trade relationship exchanging crude for products.In Mexico, only PEMEX can import crude petroleum and refined petroleumproducts; PEMEX has historically imported these products as they deemnecessary, regardless of tariff rates.
Uruguay RoundThere was little or no direct impact on energy and fuels trade as a result of
the Uruguay Round Agreements. Crude petroleum and refined petroleumproducts were are not subject to further scheduled Normal Tariff Relationsstaged tariff reductions. The rates of duty for crude petroleum and refinedpetroleum products were already very low.
Miscellaneous Products250
OverviewThe miscellaneous products sector contains diverse industries that produce
a wide variety of products, ranging from high-technology medical equipment torelatively low-technology products such as footwear. The sector encompassesdynamic high-technology industries that have become global leaders, industriesthat have maintained a relatively stable U.S. market share by successfully
250 For the purposes of this investigation, miscellaneous products are composed ofSIC groups 25, 31, 38, and 39. This sector includes search, detection, navigation,guidance, aeronautical, and nautical systems and instruments for the entire period(1978--2001).
272
adapting to import competition, and labor-intensive industries that have lostmost of the U.S. market to lower-priced imports. The miscellaneous productssector is primarily composed of the following subsectors: medical goods,which accounted for 23 percent of the total value of sector shipments in2001; furniture, 22 percent; optical, measuring, and controlling instruments,18 percent; and search, detection, navigation, guidance, and aeronauticalinstruments, 10 percent.
Most U.S.-produced medical goods, measuring instruments, andnavigation/aeronautical instruments subsectors are high technology goods soldprimarily to medical and research institutions, manufacturingequipment/process control firms, defense-related contractors, security firms,and ship and aircraft producers. Although price is an important factor in worldcompetition, quality considerations are paramount. U.S. producers, noted fortheir rigid quality standards, have a strong position in global markets.Manufacturers in Europe and Japan are the chief competitors for U.S.producers. Leading producers, based in the United States and Japan, areseeking ways to reduce prices, including shifting assembly to countries withlower labor costs. Many, if not most, of the U.S. industries in this sector areglobally competitive. The United States had trade surpluses in navigationinstruments and remote control apparatus; medical goods; drawing, drafting,and calculating instruments; and measuring testing, and controlling instrumentsin 2001.251
U.S. producers’ shipments in the sector grew by 49 percent during1978-2001 to $279 billion (table 5-32).252 During the same period, sectoremployment fell by 16 percent to 1.8 million workers, productivity grew 32percent to $248,000 per worker, and hourly earnings increased by 8 percent to$11.91. The most dynamic segment of the miscellaneous products sector is themedical goods industry. U.S. producers’ shipments more than quadrupledduring 1978-2001 to $63.6 billion. Two factors have been key to the industry’sgrowth: breakthroughs in science and technology, which have led to thedevelopment of equipment such as magnetic resonance imaging (MRI)machines and the increased need for medical equipment to service the agingU.S. population.
U.S. producers’ shipments of furniture grew by 48 percent during1978-2001 to $60 billion. The market is highly sensitive to changes in interestrates, which affect home purchases, and therefore, furniture sales. U.S.-madefurniture, for the most part, is not competitive outside North America. U.S.furniture producers have responded to import competition by using imported
251 U.S. trade in the industry/commodity group “Optical goods, includingophthalmic instruments” is dominated by imports of eyeglass frames, which are notclassified in SIC 38. Therefore, the trade deficit and high import penetration ratio in thiscategory is not indicative of the competitiveness of U.S. producers of ophthalmicinstruments.
252 In constant (1996) dollars.
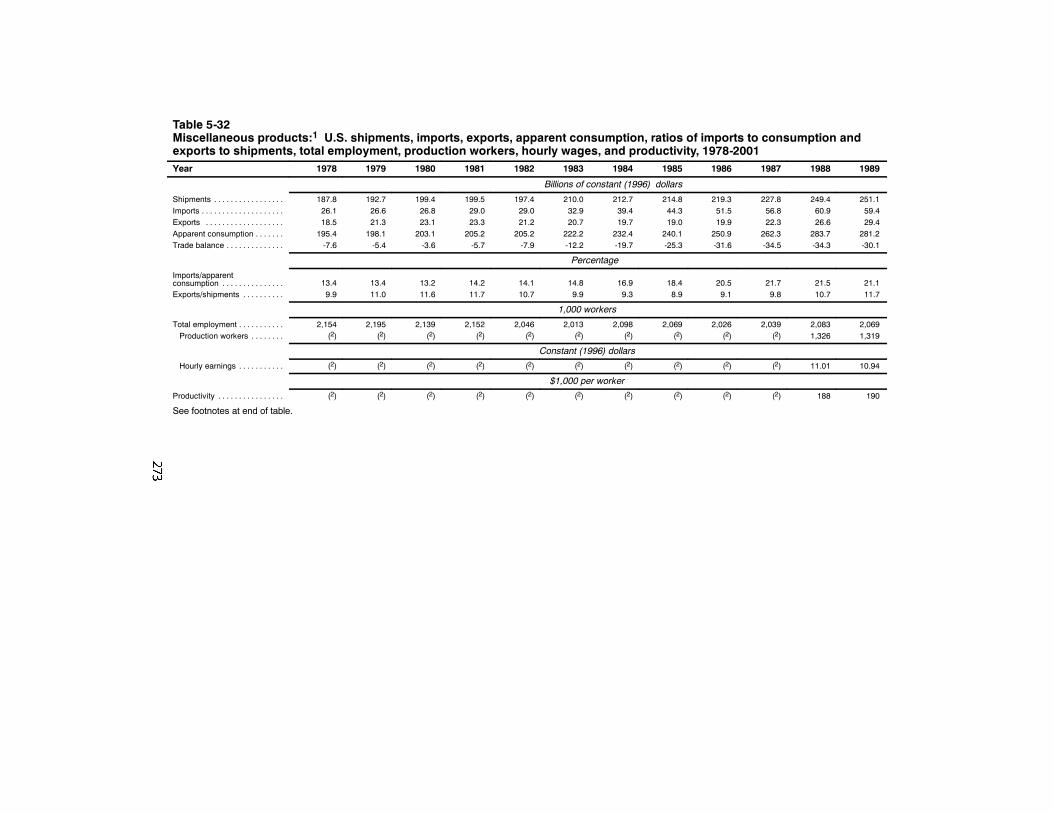
Table 5-32Miscellaneous products:1 U.S. shipments, imports, exports, apparent consumption, ratios of imports to consumption andexports to shipments, total employment, production workers, hourly wages, and productivity, 1978-2001Year 1978 1979 1980 1981 1982 1983 1984 1985 1986 1987 1988 1989
Billions of constant (1996) dollars
Shipments . . . . . . . . . . . . . . . . . 187.8 192.7 199.4 199.5 197.4 210.0 212.7 214.8 219.3 227.8 249.4 251.1Imports . . . . . . . . . . . . . . . . . . . . 26.1 26.6 26.8 29.0 29.0 32.9 39.4 44.3 51.5 56.8 60.9 59.4Exports . . . . . . . . . . . . . . . . . . . 18.5 21.3 23.1 23.3 21.2 20.7 19.7 19.0 19.9 22.3 26.6 29.4Apparent consumption . . . . . . . 195.4 198.1 203.1 205.2 205.2 222.2 232.4 240.1 250.9 262.3 283.7 281.2Trade balance . . . . . . . . . . . . . . -7.6 -5.4 -3.6 -5.7 -7.9 -12.2 -19.7 -25.3 -31.6 -34.5 -34.3 -30.1
Percentage
Imports/apparentconsumption . . . . . . . . . . . . . . . 13.4 13.4 13.2 14.2 14.1 14.8 16.9 18.4 20.5 21.7 21.5 21.1Exports/shipments . . . . . . . . . . 9.9 11.0 11.6 11.7 10.7 9.9 9.3 8.9 9.1 9.8 10.7 11.7
1,000 workers
Total employment . . . . . . . . . . . 2,154 2,195 2,139 2,152 2,046 2,013 2,098 2,069 2,026 2,039 2,083 2,069Production workers . . . . . . . . (2) (2) (2) (2) (2) (2) (2) (2) (2) (2) 1,326 1,319
Constant (1996) dollars
Hourly earnings . . . . . . . . . . . (2) (2) (2) (2) (2) (2) (2) (2) (2) (2) 11.01 10.94
$1,000 per worker
Productivity . . . . . . . . . . . . . . . . (2) (2) (2) (2) (2) (2) (2) (2) (2) (2) 188 190
See footnotes at end of table.
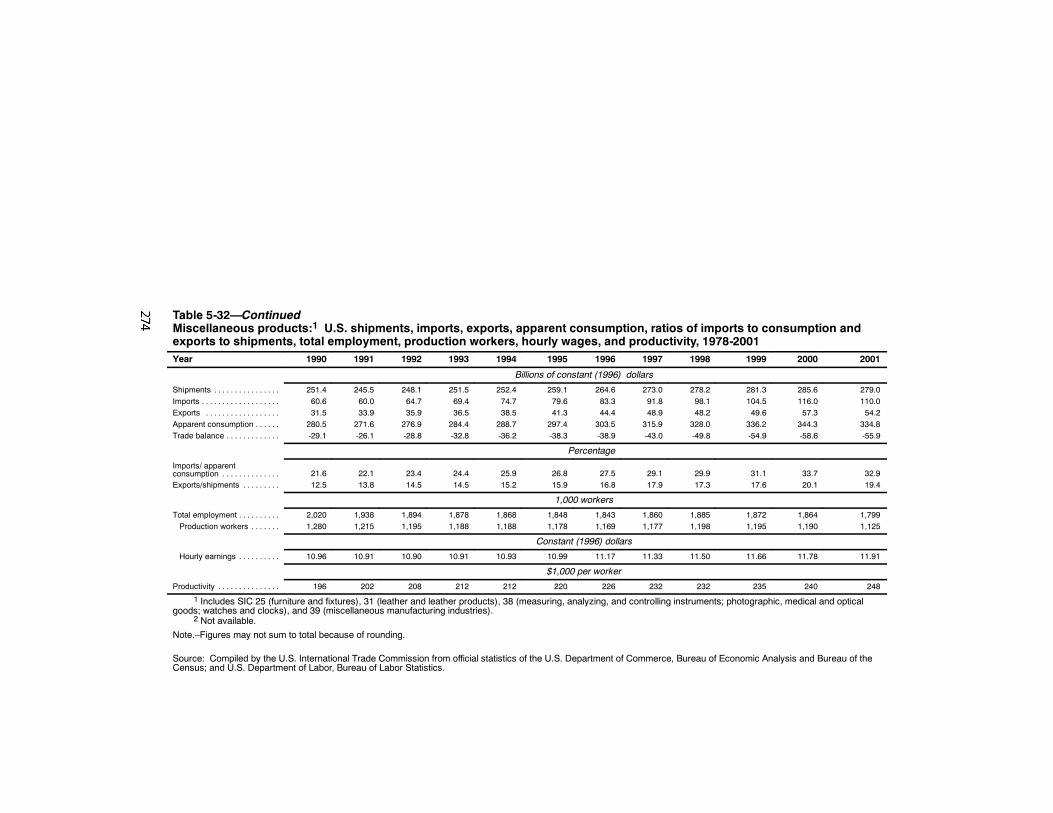
Table 5-32—ContinuedMiscellaneous products:1 U.S. shipments, imports, exports, apparent consumption, ratios of imports to consumption andexports to shipments, total employment, production workers, hourly wages, and productivity, 1978-2001Year 1990 1991 1992 1993 1994 1995 1996 1997 1998 1999 2000 2001
Billions of constant (1996) dollars
Shipments . . . . . . . . . . . . . . . . 251.4 245.5 248.1 251.5 252.4 259.1 264.6 273.0 278.2 281.3 285.6 279.0Imports . . . . . . . . . . . . . . . . . . . 60.6 60.0 64.7 69.4 74.7 79.6 83.3 91.8 98.1 104.5 116.0 110.0Exports . . . . . . . . . . . . . . . . . . 31.5 33.9 35.9 36.5 38.5 41.3 44.4 48.9 48.2 49.6 57.3 54.2Apparent consumption . . . . . . 280.5 271.6 276.9 284.4 288.7 297.4 303.5 315.9 328.0 336.2 344.3 334.8Trade balance . . . . . . . . . . . . . -29.1 -26.1 -28.8 -32.8 -36.2 -38.3 -38.9 -43.0 -49.8 -54.9 -58.6 -55.9
Percentage
Imports/ apparentconsumption . . . . . . . . . . . . . . 21.6 22.1 23.4 24.4 25.9 26.8 27.5 29.1 29.9 31.1 33.7 32.9Exports/shipments . . . . . . . . . 12.5 13.8 14.5 14.5 15.2 15.9 16.8 17.9 17.3 17.6 20.1 19.4
1,000 workers
Total employment . . . . . . . . . . 2,020 1,938 1,894 1,878 1,868 1,848 1,843 1,860 1,885 1,872 1,864 1,799Production workers . . . . . . . 1,280 1,215 1,195 1,188 1,188 1,178 1,169 1,177 1,198 1,195 1,190 1,125
Constant (1996) dollars
Hourly earnings . . . . . . . . . . 10.96 10.91 10.90 10.91 10.93 10.99 11.17 11.33 11.50 11.66 11.78 11.91
$1,000 per worker
Productivity . . . . . . . . . . . . . . . 196 202 208 212 212 220 226 232 232 235 240 248
1 Includes SIC 25 (furniture and fixtures), 31 (leather and leather products), 38 (measuring, analyzing, and controlling instruments; photographic, medical and opticalgoods; watches and clocks), and 39 (miscellaneous manufacturing industries).
2 Not available.
Note.–Figures may not sum to total because of rounding.
Source: Compiled by the U.S. International Trade Commission from official statistics of the U.S. Department of Commerce, Bureau of Economic Analysis and Bureau of theCensus; and U.S. Department of Labor, Bureau of Labor Statistics.
275
furniture to supplement their product lines and by importing labor-intensiveparts and hardware from China. Import penetration in the U.S. furnitureindustry depends on the materials from which a given type of furniture ismade and its end-use. Office furniture tends to be manufactured from metals,plastics, and man-made fibers and is characterized by greater standardization,automation, and longer production runs than for wood household orupholstered furniture. The weight and bulk of metal, upholstered furnitureand fully-assembled wood furniture result in shipping costs that discouragedimports of these products from sources other than Canada. China, however, ishighly competitive in U.S. markets for stackable furniture, knock-downfurniture, and parts of furniture that require labor intensive processing, suchas lathe-work on legs for tables and chairs.253 Although the U.S. trade deficitin the furniture industry amounted to $12.2 billion in 2001, importsaccounted for only 19 percent of U.S. apparent consumption.
The subsector producing optical, measuring, analyzing, and controllinginstruments has also expanded steadily throughout the period with U.S.producers’ shipments more than doubling during 1978-2001 to $49.3 billion.Almost every modern assembly line uses such equipment. This equipment isalso used for quality control in manufacturing, for testing in scientific andmedical laboratories, for checkout counters in retail stores, and in power plantsand other utilities to measure and control the flow of electricity, water, naturalgas, and petroleum. Although U.S. production has increased, lesstechnologically advanced products in this segment such as thermostats,speedometers, and gas meters face intense import competition. This situationhas led U.S. producers to use assembly plants in Mexico to lower theirproduction costs for these products.
Cameras and watches are primarily labor and technology-intensiveconsumer products. Companies based in Japan (with assembly plants in manyAsian countries) are the leading world producers of cameras and watches,while manufacturers in Switzerland also remain significant global suppliers ofwatches. U.S. producers have become niche suppliers of these products and theU.S. market relies on foreign suppliers to meet a significant share of domesticdemand. The U.S. trade deficit for photographic cameras and equipment andwatches and clocks combined was more that $4.5 billion in 2001, and the ratioof U.S. imports to apparent U.S. consumption for watches and clocks was 80percent.
Most U.S. producers of the remaining sector products are globallycompetitive only in the high-end niches. Production processes for most othergoods in this segment tend to be labor-intensive and production technology is
253 Taiwan was the leading supplier of such products to the U.S. market until themid--1980s. As labor costs rose in Taiwan, furniture manufacturers there shifted much oftheir production to China. See USITC, Industry and Trade Summary: Furniture andMotor Vehicle Seats, USITC Pub. 3382, Jan. 2001.
276
readily transferable to developing or newly industrialized countries.Numerous sector imports are produced in Asia under license from U.S.companies, and tend to be concentrated in consumer goods for which there isno remaining U.S. production (e.g., home video games and certain Christmasdecorations). Such products typically require semi-skilled assembly (e.g.,jewelry and musical instruments) or sewing (e.g., baseballs, sports gloves,leather footwear, and luggage) or low-technology injection molding (e.g., toysand dolls). Less import-sensitive articles are characterized by hightransportation costs; low raw-material costs in the United States relative tothose of foreign producers; or superior U.S. design and productiontechnology or copyright protection.
Effect of Trade Agreements on the SectorThe five trade agreements that are the subject of this investigation likely
have had little direct effect on overall production and trade in the U.S.miscellaneous products sector. However, some subsectors were impacted bytariff reductions as imports increased significantly.254 The growth in shipmentsand trade that has taken place in the miscellaneous products sector since 1978can be attributed principally to innovations in science and technology that haveaided the aggressive, high-tech industries making up the bulk of this sector.255For example, the medical goods industry, which accounted for nearlyone-fourth of U.S. producers’ shipments in this sector in 2001, has consistentlyretained competitiveness over the last decade due to its research anddevelopment pipeline of new product introductions and adaptations.256 Otherfactors contributing to sector expansion include very strong growth in demand;adapting to import competition with increased production sharing;257 reputationfor high standards; and ability to provide customized products. Further, U.S.companies increasingly took advantage of lower wage rates in Mexico and theDominican Republic by moving assembly of high volume but low margincommodities to these countries.
254 Segments in the miscellaneous products industry that have been impacted byincreased U.S. imports in part attributed to relatively large tariff reductions includecertain furniture, leather and leather products. Tariff reductions were also relatively largein other industries (SIC group 39), including specific costume jewelry, toys, and athleticgoods.
255 Measuring, analyzing, and controlling instruments; photographic, medical, andoptical instruments; and watches and clocks accounted for almost 60 percent of the totalvalue of U.S. producers’ shipments in this sector in 2001.
256 Products introduced or adapted during the past decade include advanced medicalimaging equipment, cardiac pacemakers and defibrillators, coronary stents, arthroscopicand other endoscopic surgical apparatus and tools, orthopedic reconstructive implants,medical lasers, and insulin imaging systems.
257 For additional detail see “Production--Sharing Update: Developments in 2001,”Industry Trade and Technology Review, USITC Pub. 3534, July 2002, pp. 27--42 (postedon USITC Internet site at www.usitc.gov/webpubs.htm).
277
Other sector products, such as footwear, luggage, and watches, have beenexempted from preferential tariff programs such as GSP, CBERA, and ATPA,and tariffs have been reduced gradually. Despite tariff protection, the U.S.industries manufacturing these products have, for the most part, disappeared.Low labor costs in China have more than offset U.S. tariffs for theselabor-intensive products. China’s eligibility for MFN treatment, effectedJanuary 30, 1980, was another factor influencing trade in this sector. China, theprincipal beneficiary of tariff reductions on many categories of sector products(i.e., furniture), has become an increasingly important supplier of certainmiscellaneous products. Table 5-33 presents trade issues addressed by thesubject trade agreements that were relevant to the sector.
Tokyo RoundBetween 1980 and 2000, total U.S. trade in miscellaneous products
increased by 246 percent, reaching $173 billion before declining by 5 percentin 2001. Imports of miscellaneous products increased almost yearly during1980-2001, quadrupling to $110 billion, while exports of sector items morethan doubled during the same period to $54 billion causing the sector tradedeficit to increase from $3.7 billion to $56 billion. As the sector responded to aglobalized economy and production sharing became a major force in trading,imports as a share of U.S. apparent consumption increased from 13 percent to34 percent while exports as a share of shipments increased from 12 percent to19 percent.
The effect of the Tokyo Round on the miscellaneous products industry waslimited. U.S. tariffs on sector products were relatively low prior to theagreements and tariffs in major foreign markets on the majority of sectorproducts were also low.258 Tariffs259 were reduced by 3.1 percentage points to4.7 percent during the period. The growth in international trade is primarilyattributable to technological advances and improvements in productionmethods.
U.S.-Israel FTA260Total U.S. trade in miscellaneous products with Israel more than
quadrupled during 1985-2001, from $1.7 billion to $6.7 billion. Trade withIsrael increased from 3 percent of total U.S. sector trade to 4 percent during thesame period. U.S. imports of sector products from Israel increased from $1.5billion in 1985 to $5.7 billion in 2001, while U.S. exports increased from $358million to nearly $1 billion (table 5-34).
258 There were important exceptions to this general observation. Relatively hightariffs were maintained on luggage, leather footwear, watches, and toys through theTokyo Round.
259 Average trade--weighted ad valorem or ad valorem equivalent tariff.260 The U.S.--Israel FTA was signed in 1985 and was fully implemented on Jan. 1,
1995.
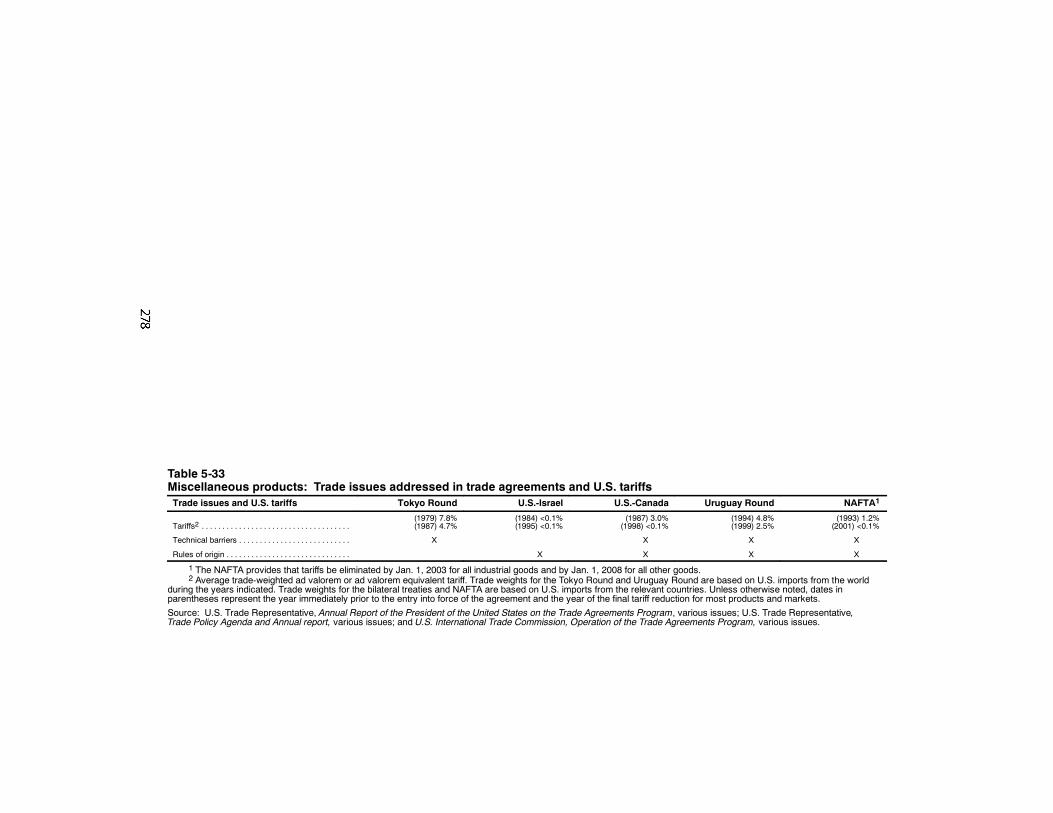
Table 5-33Miscellaneous products: Trade issues addressed in trade agreements and U.S. tariffsTrade issues and U.S. tariffs Tokyo Round U.S.-Israel U.S.-Canada Uruguay Round NAFTA1
Tariffs2 . . . . . . . . . . . . . . . . . . . . . . . . . . . . . . . . . . . .(1979) 7.8%(1987) 4.7%
(1984) <0.1%(1995) <0.1%
(1987) 3.0%(1998) <0.1%
(1994) 4.8%(1999) 2.5%
(1993) 1.2%(2001) <0.1%
Technical barriers . . . . . . . . . . . . . . . . . . . . . . . . . . . X X X X
Rules of origin . . . . . . . . . . . . . . . . . . . . . . . . . . . . . . X X X X
1 The NAFTA provides that tariffs be eliminated by Jan. 1, 2003 for all industrial goods and by Jan. 1, 2008 for all other goods.2 Average trade-weighted ad valorem or ad valorem equivalent tariff. Trade weights for the Tokyo Round and Uruguay Round are based on U.S. imports from the world
during the years indicated. Trade weights for the bilateral treaties and NAFTA are based on U.S. imports from the relevant countries. Unless otherwise noted, dates inparentheses represent the year immediately prior to the entry into force of the agreement and the year of the final tariff reduction for most products and markets.
Source: U.S. Trade Representative, Annual Report of the President of the United States on the Trade Agreements Program, various issues; U.S. Trade Representative,Trade Policy Agenda and Annual report, various issues; and U.S. International Trade Commission, Operation of the Trade Agreements Program, various issues.
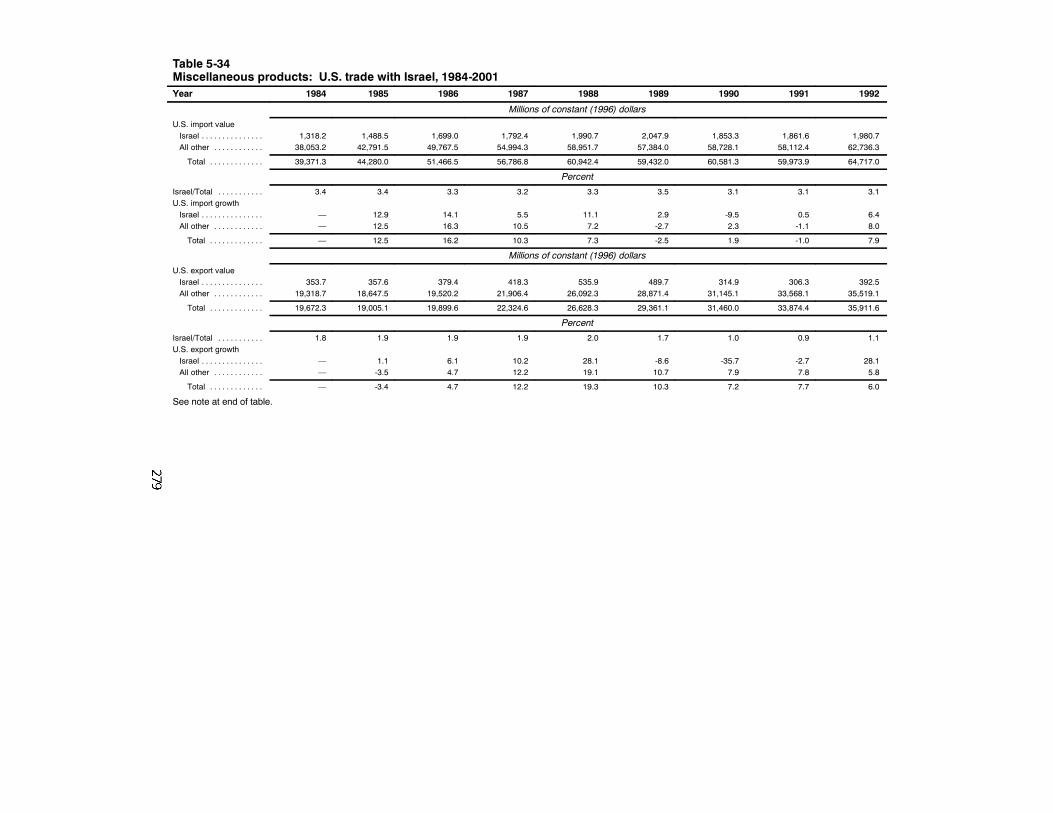
Table 5-34Miscellaneous products: U.S. trade with Israel, 1984-2001Year 1984 1985 1986 1987 1988 1989 1990 1991 1992
Millions of constant (1996) dollars
U.S. import valueIsrael . . . . . . . . . . . . . . . 1,318.2 1,488.5 1,699.0 1,792.4 1,990.7 2,047.9 1,853.3 1,861.6 1,980.7All other . . . . . . . . . . . . 38,053.2 42,791.5 49,767.5 54,994.3 58,951.7 57,384.0 58,728.1 58,112.4 62,736.3
Total . . . . . . . . . . . . . 39,371.3 44,280.0 51,466.5 56,786.8 60,942.4 59,432.0 60,581.3 59,973.9 64,717.0
Percent
Israel/Total . . . . . . . . . . . 3.4 3.4 3.3 3.2 3.3 3.5 3.1 3.1 3.1U.S. import growthIsrael . . . . . . . . . . . . . . . — 12.9 14.1 5.5 11.1 2.9 -9.5 0.5 6.4All other . . . . . . . . . . . . — 12.5 16.3 10.5 7.2 -2.7 2.3 -1.1 8.0
Total . . . . . . . . . . . . . — 12.5 16.2 10.3 7.3 -2.5 1.9 -1.0 7.9
Millions of constant (1996) dollars
U.S. export valueIsrael . . . . . . . . . . . . . . . 353.7 357.6 379.4 418.3 535.9 489.7 314.9 306.3 392.5All other . . . . . . . . . . . . 19,318.7 18,647.5 19,520.2 21,906.4 26,092.3 28,871.4 31,145.1 33,568.1 35,519.1
Total . . . . . . . . . . . . . 19,672.3 19,005.1 19,899.6 22,324.6 26,628.3 29,361.1 31,460.0 33,874.4 35,911.6
Percent
Israel/Total . . . . . . . . . . . 1.8 1.9 1.9 1.9 2.0 1.7 1.0 0.9 1.1U.S. export growthIsrael . . . . . . . . . . . . . . . — 1.1 6.1 10.2 28.1 -8.6 -35.7 -2.7 28.1All other . . . . . . . . . . . . — -3.5 4.7 12.2 19.1 10.7 7.9 7.8 5.8
Total . . . . . . . . . . . . . — -3.4 4.7 12.2 19.3 10.3 7.2 7.7 6.0
See note at end of table.
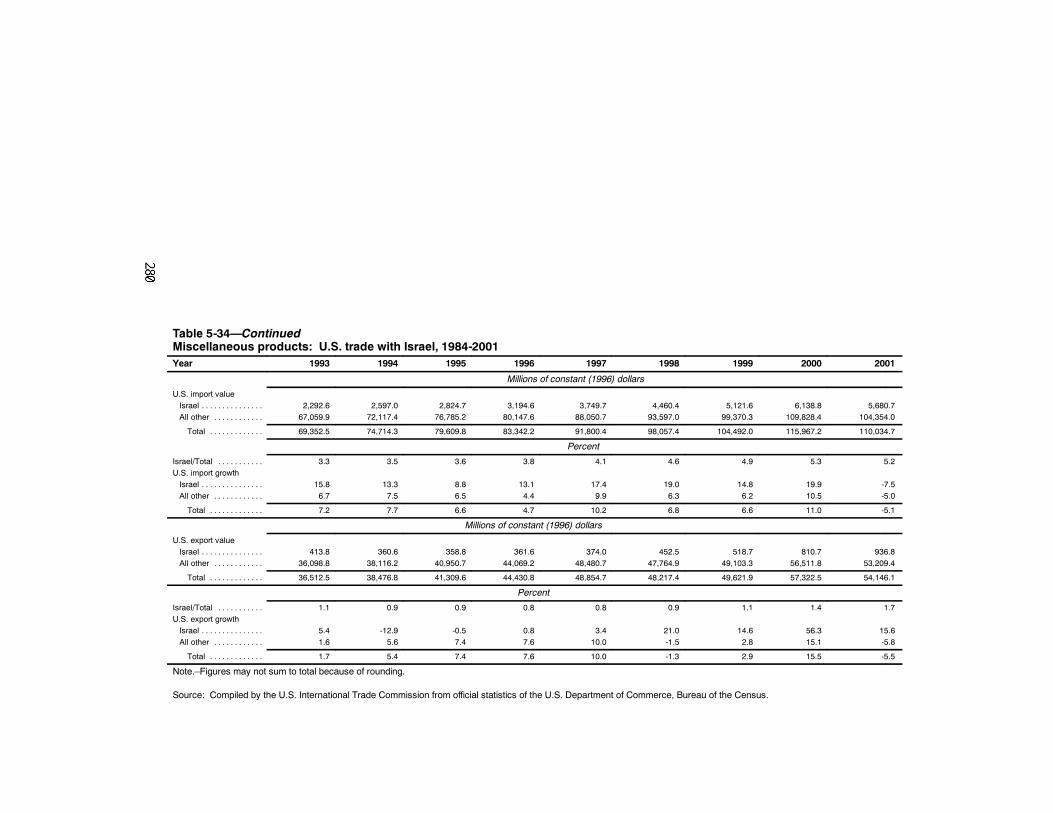
Table 5-34—ContinuedMiscellaneous products: U.S. trade with Israel, 1984-2001Year 1993 1994 1995 1996 1997 1998 1999 2000 2001
Millions of constant (1996) dollars
U.S. import valueIsrael . . . . . . . . . . . . . . . 2,292.6 2,597.0 2,824.7 3,194.6 3,749.7 4,460.4 5,121.6 6,138.8 5,680.7All other . . . . . . . . . . . . 67,059.9 72,117.4 76,785.2 80,147.6 88,050.7 93,597.0 99,370.3 109,828.4 104,354.0
Total . . . . . . . . . . . . . 69,352.5 74,714.3 79,609.8 83,342.2 91,800.4 98,057.4 104,492.0 115,967.2 110,034.7
Percent
Israel/Total . . . . . . . . . . . 3.3 3.5 3.6 3.8 4.1 4.6 4.9 5.3 5.2U.S. import growthIsrael . . . . . . . . . . . . . . . 15.8 13.3 8.8 13.1 17.4 19.0 14.8 19.9 -7.5All other . . . . . . . . . . . . 6.7 7.5 6.5 4.4 9.9 6.3 6.2 10.5 -5.0
Total . . . . . . . . . . . . . 7.2 7.7 6.6 4.7 10.2 6.8 6.6 11.0 -5.1
Millions of constant (1996) dollars
U.S. export valueIsrael . . . . . . . . . . . . . . . 413.8 360.6 358.8 361.6 374.0 452.5 518.7 810.7 936.8All other . . . . . . . . . . . . 36,098.8 38,116.2 40,950.7 44,069.2 48,480.7 47,764.9 49,103.3 56,511.8 53,209.4
Total . . . . . . . . . . . . . 36,512.5 38,476.8 41,309.6 44,430.8 48,854.7 48,217.4 49,621.9 57,322.5 54,146.1
Percent
Israel/Total . . . . . . . . . . . 1.1 0.9 0.9 0.8 0.8 0.9 1.1 1.4 1.7U.S. export growthIsrael . . . . . . . . . . . . . . . 5.4 -12.9 -0.5 0.8 3.4 21.0 14.6 56.3 15.6All other . . . . . . . . . . . . 1.6 5.6 7.4 7.6 10.0 -1.5 2.8 15.1 -5.8
Total . . . . . . . . . . . . . 1.7 5.4 7.4 7.6 10.0 -1.3 2.9 15.5 -5.5
Note.–Figures may not sum to total because of rounding.
Source: Compiled by the U.S. International Trade Commission from official statistics of the U.S. Department of Commerce, Bureau of the Census.
281
It is unlikely that the tariff reductions in theU.S-Israel FTA had anymeasurable impact on the U.S. miscellaneous products industry because Israelaccounted for only a negligible share of U.S. trade in this sector. Moreover, alarge portion of these imported products already entered the United Statesduty-free prior to 1985.
U.S.-Canada FTADuring 1988-2000, U.S. trade with Canada in miscellaneous products
nearly tripled, reaching $17.6 billion, before falling to $15.6 billion in 2001.U.S. imports of these items from Canada increased irregularly during theperiod to $7.1 billion in 2001, representing an increase of 135 percent over1988; U.S. exports of sector products to Canada increased by 226 percent to$8.6 billion (table 5-35). During the period under consideration, imports fromCanada accounted for 5 percent of total U.S. imports of miscellaneous productsin 1988, increasing to 6 percent in 2001; exports to Canada accounted for12 percent of total U.S. exports in 1988, increasing to 16 percent in 2001.Because Canada accounts for a relatively small share of U.S. trade in thissector,261 it is unlikely that a tariff reduction of 2.9 percentage points to 0.1percent262 had any measurable impact on the overall U.S. miscellaneousproducts industry.
NAFTAU.S. sector trade with NAFTA partners Mexico and Canada has increased
almost every year since the agreement entered into force in 1994 (table 5-35).Between 1994 and 2001, U.S. imports from Canada increased 63 percent to$7.1 billion (6 percent of total U.S. imports) and exports to Canada rose by 32percent to $9.4 billion in 2000, before declining to $8.6 billion in 2001 (16percent of total U.S. exports). Following a similar trend, U.S. imports fromMexico more than doubled to $9.4 billion (9 percent of total U.S. imports);exports to Mexico increased by 19 percent to $4.7 billion (9 percent of totalU.S. exports). Although much of the increase in sector trade with Mexico andCanada can be attributed to factors discussed earlier,263 the elimination oftariffs and nontariff barriers through this agreement–principally between theUnited States and Mexico–has contributed to increased trade in certain
261 The most important exception to this general assessment was in the furnitureindustry. U.S. furniture exports to Canada quadrupled during 1988--2000 as tariffs whichranged between 2.5 percent and 9.6 percent ad valorem were reduced to free. Canada isthe leading market for U.S. exports of furniture.
262 Average trade--weighted ad valorem or ad valorem equivalent tariff.263 The 50 percent devaluation of the Mexican peso in January 1995 was the leading
cause of the sharp rise in U.S. investment in assembly plants in Mexico in 1995 and 1996and the subsequent increase in U.S. trade with Mexico.
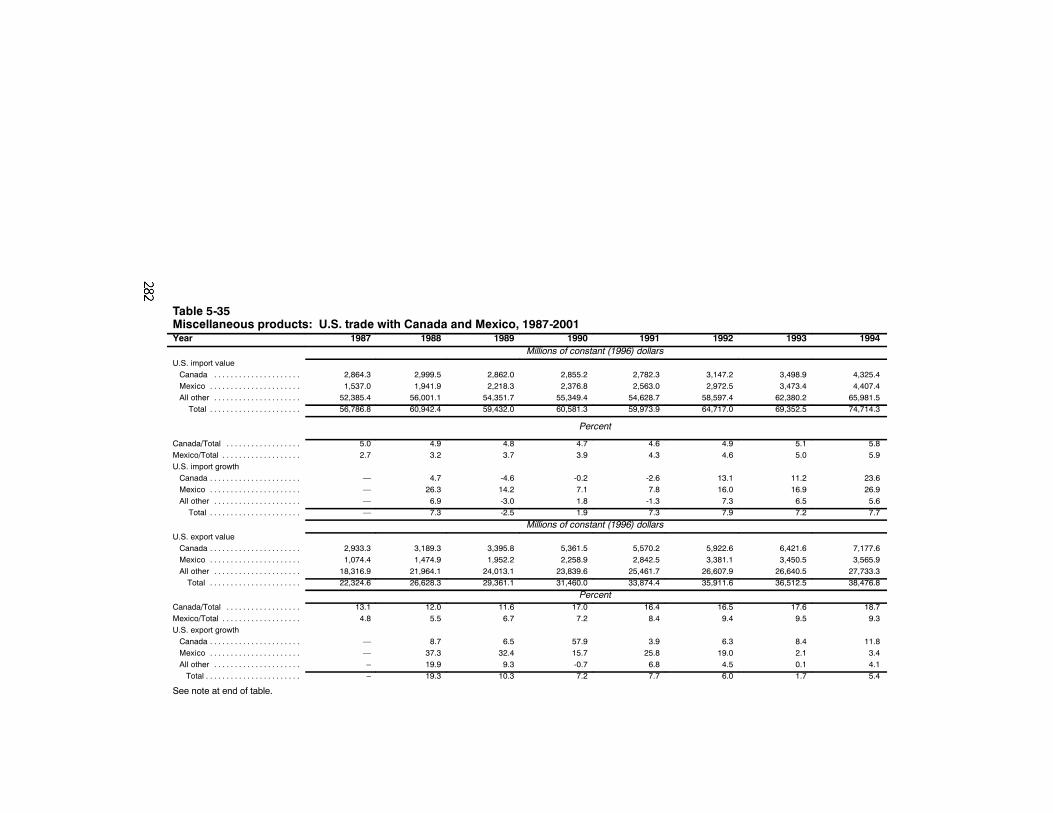
Table 5-35Miscellaneous products: U.S. trade with Canada and Mexico, 1987-2001Year 1987 1988 1989 1990 1991 1992 1993 1994
Millions of constant (1996) dollarsU.S. import valueCanada . . . . . . . . . . . . . . . . . . . . . 2,864.3 2,999.5 2,862.0 2,855.2 2,782.3 3,147.2 3,498.9 4,325.4Mexico . . . . . . . . . . . . . . . . . . . . . . 1,537.0 1,941.9 2,218.3 2,376.8 2,563.0 2,972.5 3,473.4 4,407.4All other . . . . . . . . . . . . . . . . . . . . . 52,385.4 56,001.1 54,351.7 55,349.4 54,628.7 58,597.4 62,380.2 65,981.5Total . . . . . . . . . . . . . . . . . . . . . . 56,786.8 60,942.4 59,432.0 60,581.3 59,973.9 64,717.0 69,352.5 74,714.3
Percent
Canada/Total . . . . . . . . . . . . . . . . . . 5.0 4.9 4.8 4.7 4.6 4.9 5.1 5.8Mexico/Total . . . . . . . . . . . . . . . . . . . 2.7 3.2 3.7 3.9 4.3 4.6 5.0 5.9U.S. import growthCanada . . . . . . . . . . . . . . . . . . . . . . — 4.7 -4.6 -0.2 -2.6 13.1 11.2 23.6Mexico . . . . . . . . . . . . . . . . . . . . . . — 26.3 14.2 7.1 7.8 16.0 16.9 26.9All other . . . . . . . . . . . . . . . . . . . . . — 6.9 -3.0 1.8 -1.3 7.3 6.5 5.6Total . . . . . . . . . . . . . . . . . . . . . . — 7.3 -2.5 1.9 7.3 7.9 7.2 7.7
Millions of constant (1996) dollarsU.S. export valueCanada . . . . . . . . . . . . . . . . . . . . . . 2,933.3 3,189.3 3,395.8 5,361.5 5,570.2 5,922.6 6,421.6 7,177.6Mexico . . . . . . . . . . . . . . . . . . . . . . 1,074.4 1,474.9 1,952.2 2,258.9 2,842.5 3,381.1 3,450.5 3,565.9All other . . . . . . . . . . . . . . . . . . . . . 18,316.9 21,964.1 24,013.1 23,839.6 25,461.7 26,607.9 26,640.5 27,733.3Total . . . . . . . . . . . . . . . . . . . . . . 22,324.6 26,628.3 29,361.1 31,460.0 33,874.4 35,911.6 36,512.5 38,476.8
PercentCanada/Total . . . . . . . . . . . . . . . . . . 13.1 12.0 11.6 17.0 16.4 16.5 17.6 18.7Mexico/Total . . . . . . . . . . . . . . . . . . . 4.8 5.5 6.7 7.2 8.4 9.4 9.5 9.3U.S. export growthCanada . . . . . . . . . . . . . . . . . . . . . . — 8.7 6.5 57.9 3.9 6.3 8.4 11.8Mexico . . . . . . . . . . . . . . . . . . . . . . — 37.3 32.4 15.7 25.8 19.0 2.1 3.4All other . . . . . . . . . . . . . . . . . . . . . – 19.9 9.3 -0.7 6.8 4.5 0.1 4.1Total . . . . . . . . . . . . . . . . . . . . . . . – 19.3 10.3 7.2 7.7 6.0 1.7 5.4
See note at end of table.
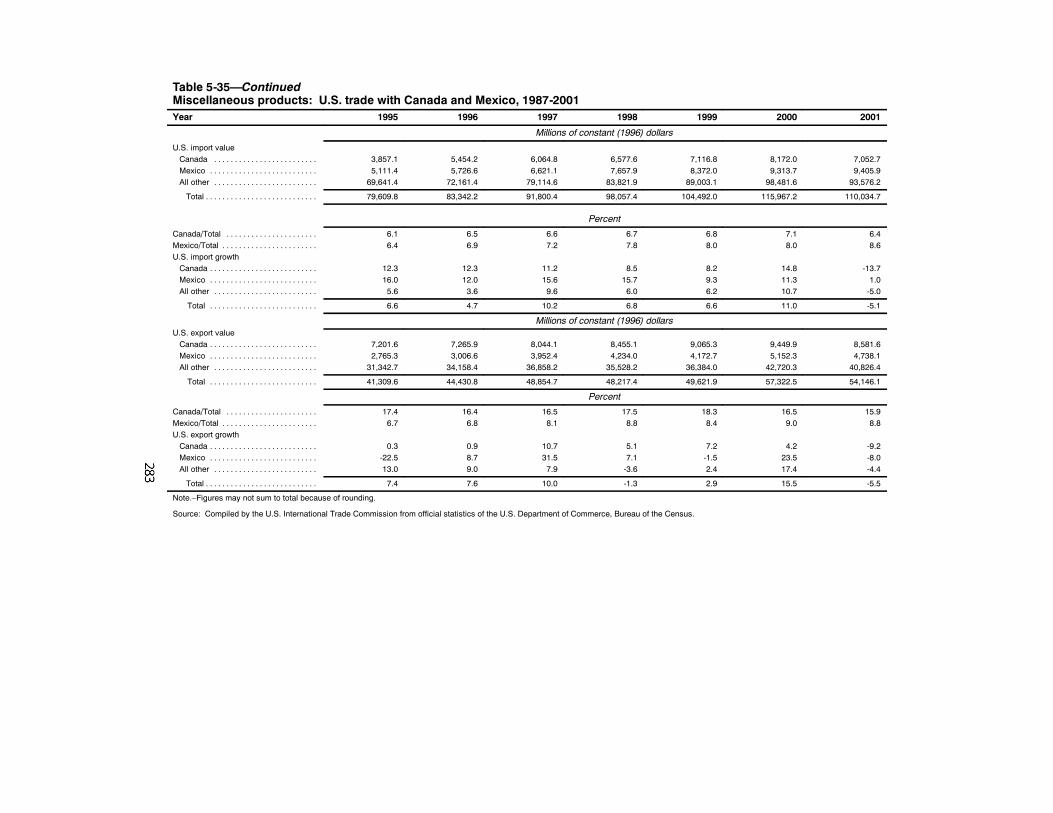
Table 5-35—ContinuedMiscellaneous products: U.S. trade with Canada and Mexico, 1987-2001Year 1995 1996 1997 1998 1999 2000 2001
Millions of constant (1996) dollars
U.S. import valueCanada . . . . . . . . . . . . . . . . . . . . . . . . . 3,857.1 5,454.2 6,064.8 6,577.6 7,116.8 8,172.0 7,052.7Mexico . . . . . . . . . . . . . . . . . . . . . . . . . . 5,111.4 5,726.6 6,621.1 7,657.9 8,372.0 9,313.7 9,405.9All other . . . . . . . . . . . . . . . . . . . . . . . . . 69,641.4 72,161.4 79,114.6 83,821.9 89,003.1 98,481.6 93,576.2
Total . . . . . . . . . . . . . . . . . . . . . . . . . . . 79,609.8 83,342.2 91,800.4 98,057.4 104,492.0 115,967.2 110,034.7
Percent
Canada/Total . . . . . . . . . . . . . . . . . . . . . . 6.1 6.5 6.6 6.7 6.8 7.1 6.4Mexico/Total . . . . . . . . . . . . . . . . . . . . . . . 6.4 6.9 7.2 7.8 8.0 8.0 8.6U.S. import growthCanada . . . . . . . . . . . . . . . . . . . . . . . . . . 12.3 12.3 11.2 8.5 8.2 14.8 -13.7Mexico . . . . . . . . . . . . . . . . . . . . . . . . . . 16.0 12.0 15.6 15.7 9.3 11.3 1.0All other . . . . . . . . . . . . . . . . . . . . . . . . . 5.6 3.6 9.6 6.0 6.2 10.7 -5.0
Total . . . . . . . . . . . . . . . . . . . . . . . . . . 6.6 4.7 10.2 6.8 6.6 11.0 -5.1
Millions of constant (1996) dollarsU.S. export valueCanada . . . . . . . . . . . . . . . . . . . . . . . . . . 7,201.6 7,265.9 8,044.1 8,455.1 9,065.3 9,449.9 8,581.6Mexico . . . . . . . . . . . . . . . . . . . . . . . . . . 2,765.3 3,006.6 3,952.4 4,234.0 4,172.7 5,152.3 4,738.1All other . . . . . . . . . . . . . . . . . . . . . . . . . 31,342.7 34,158.4 36,858.2 35,528.2 36,384.0 42,720.3 40,826.4
Total . . . . . . . . . . . . . . . . . . . . . . . . . . 41,309.6 44,430.8 48,854.7 48,217.4 49,621.9 57,322.5 54,146.1
Percent
Canada/Total . . . . . . . . . . . . . . . . . . . . . . 17.4 16.4 16.5 17.5 18.3 16.5 15.9Mexico/Total . . . . . . . . . . . . . . . . . . . . . . . 6.7 6.8 8.1 8.8 8.4 9.0 8.8U.S. export growthCanada . . . . . . . . . . . . . . . . . . . . . . . . . . 0.3 0.9 10.7 5.1 7.2 4.2 -9.2Mexico . . . . . . . . . . . . . . . . . . . . . . . . . . -22.5 8.7 31.5 7.1 -1.5 23.5 -8.0All other . . . . . . . . . . . . . . . . . . . . . . . . . 13.0 9.0 7.9 -3.6 2.4 17.4 -4.4
Total . . . . . . . . . . . . . . . . . . . . . . . . . . . 7.4 7.6 10.0 -1.3 2.9 15.5 -5.5
Note.–Figures may not sum to total because of rounding.
Source: Compiled by the U.S. International Trade Commission from official statistics of the U.S. Department of Commerce, Bureau of the Census.
284
industries.264 For example, although certain U.S. firms in this sector werefirst attracted to Mexico as a manufacturing site due to its relatively lowerwage costs and proximity to the United States, they also benefitted fromMexican investment incentives under its Maquiladora Program, preferentialU.S. production sharing duties, and eventually the reduction and eliminationof duties under NAFTA.
Uruguay Round
During 1995-2000, U.S. trade in miscellaneous products increased annuallyto $173 billion, or by 43 percent, before declining by 5 percent in 2001 to $164billion (table 5-35). Imports of miscellaneous products grew each year from1995 to 2000, reaching $116 billion before declining to $110 billion in 2001.Exports of such goods increased annually from $41 billion in 1995 to $57billion in 2000, or by 39 percent, before decreasing to $54 billion in 2001.During this period, U.S. shipments continued to grow, increasing from $250billion in 1995 to $279 billion in 2000.
Although much of the increase in U.S. trade following the implementationof the Uruguay Round can be attributed to the principal factors affecting thesector’s expansion, the Uruguay Round nonetheless had a modest effect oncertain sectors of the industry. Tariffs were reduced by 2.3 percentage points to2.5 percent.265 Under the Uruguay Round, the United States and severalimportant trading partners agreed to eliminate tariffs immediately for certainsector products–medical goods, furniture, and dolls, toys, and games. The U.S.medical instrument industry, a major world exporter, was in a strong position tobenefit from the removal of foreign tariffs. Many leading U.S. producers offurniture import a portion of their product lines and/or labor-intensive parts sothe reduction in tariffs reduced their costs, making tariff elimination a mixedblessing for some of the industry. Further, tariffs on imports of stackable andknock-down furniture from China were already low, so reducing the tariffs didnot significantly impact the level of imports. The two largest marketers of toys,dolls, and games own the most significant U.S. producers, although they supplymost of the U.S. market with products from wholly owned or contractmanufacturers in China. For certain products, both companies use assemblyfacilities in Mexico and for others, it is more economical to supply the U.S.market from domestic operations.
264 See Broom Corn Brooms, Inv. No. NAFTA 302--1 (Provisional Relief Phase),USITC Pub. 2963 (May 1996); Broom Corn Brooms, Inv. Nos. TA--201--65 and NAFTA302--1, USITC Pub. 2983 (Aug. 1996).
265 The average trade--weighted ad valorem or ad valorem equivalent tariffs.
285
Views of Interested Parties
American Brush Manufacturers Association266
The American Brush Manufacturers Association (ABMA) is a diversegroup of businesses made up of 162 member manufacturers and affiliatedsupplier companies that has represented broom, brush and mop manufacturerssince 1917.
A significant amount of U.S. corn broom production was lost to Mexicoafter NAFTA took effect due to high labor content of the product. Three of thefour largest U.S. companies have either moved all, or a significant amount, oftheir production to Mexico and most of the smaller U.S. manufacturers (orformer U.S. manufacturers) now import part or all of their finished productsfrom Mexico. In each instance NAFTA has caused “vanishing profits anddwindling workforces” in the U.S. corn broom industry.
Textiles and Apparel
OverviewThe U.S. textile and apparel sector267 is one of the world’s largest and
most efficient producers of high-volume goods such as denim and sheetingfabrics. In the past two decades, however, the textile and apparel sector hasdeclined in relative worldwide importance primarily because of increasedglobal competition.268 Notwithstanding quotas and high tariffs, U.S. importshave accounted for a growing share of domestic consumption. With theexisting quota system scheduled for elimination on January 1, 2005, U.S. textileand apparel producers have been pursuing business strategies for survival in aheightened competitive climate.
Labor costs are a critical competitive factor in both textile and apparelmanufacturing that often put U.S. manufacturers at a disadvantage vis-a-viscountries such as China and India where wages are substantially lower. Thehourly wage in the U.S. textile industry was $14.24 in 2000, compared withthose in China and India which were $0.69 and $0.58, respectively, in the same
266 David C. Parr, Executive Director, American Brush Manufacturers Association,written submission to the Commission, Feb. 14, 2003.
267 For the purpose of this investigation, the textile and apparel sector comprises SICgroups 22 and 23, including textile mill products such as yarns, fabrics, carpets, andother made--up articles, and apparel.
268 Because of high shipping costs, carpet production is less sensitive to importpenetration than other textile products. Subsequently, carpet manufacturers have notexperienced as many competitive challenges as producers in other segments of the textileindustry.
286
year (table 5-36).269 Average wages in the U.S. textile and apparel industriesincreased 11 percent during 1978-2001.270 This is likely a reflection of thedemand for higher-skilled workers as domestic textile firms have adoptedmore sophisticated production technology and apparel firms have retainedcutting jobs while sending lower-skilled sewing jobs offshore. Many U.S.apparel manufacturers are concentrating domestic production for nichemarkets that include high-fashion and high-quality tailored garments wherelabor costs are less of a factor in determining competitiveness.
U.S. textile and apparel firms have restructured and consolidated operationsextensively during the past decade. The number of establishments in the U.S.textile and apparel industries in 2000 totaled 11,300 and 16,500, respectively,following a succession of plant closures that have occurred primarily since theearly 1990s. U.S. textile and apparel sector shipments fluctuated during1978-2001, but declined overall from $176 billion in 1978 to $132 billion in2001, the lowest level during the period. Textile industry employmentdecreased by 50 percent to 400,000 employees during 1978-2001, while that ofthe apparel industry declined by 62 percent to 436,000 employees. The apparelindustry incurred a greater reduction in employment due in part to the shift inproduction and sourcing of finished goods offshore. The decline in textileemployment is partly attributable to erosion of the domestic production basefor apparel, a primary market for U.S. textile products, as well as to increasedautomation, which has improved efficiency.
The U.S. textile industry faces shrinking domestic markets for its yarn andfabric output largely because of growing imports of these goods as well asend-use items such as apparel and home textiles, which often contain foreigninputs. However, the growth in imports of apparel assembled from U.S. fabrichas boosted U.S. fabric exports and has helped offset weakness in domesticdemand for U.S. apparel fabrics.271 U.S. textile manufacturers are movingaway from markets that traditionally feed domestic apparel production (e.g.,broadwoven fabrics), and into less vulnerable niche markets such asperformance wear, technical, and industrial fabrics.
In an effort to remain competitive, U.S. textile mills have invested heavilyin technology to increase productivity and capacity, while reducingemployment. The industry has achieved high levels of productivity in theproduction of high-volume commodity goods such as denim and sheeting
269 The year 2000 is the last year for which data were available. Wages are forspinning and weaving jobs within the textile industry only, comparable apparel sectorwage data for the same year were not available. Werner International, International WageSurvey, Year 2000.
270 Based on data from the U.S. Department of Labor, Bureau of Labor Statistics.271 Mexico and Caribbean countries receive trade preferences for apparel imported
into the United States that has been assembled from U.S.--made fabrics. See tradeagreements portion of this section for more information on trade preferences underNAFTA and the Caribbean Basin Trade Partnership Act (CBTPA).
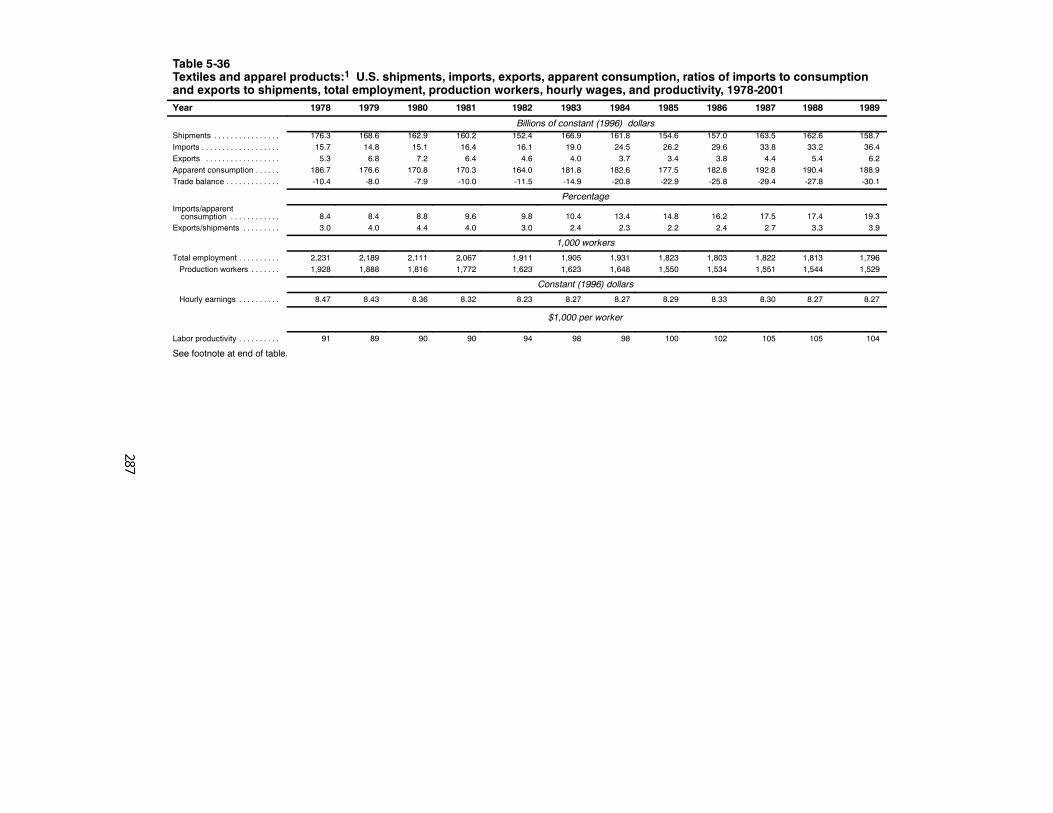
Table 5-36Textiles and apparel products:1 U.S. shipments, imports, exports, apparent consumption, ratios of imports to consumptionand exports to shipments, total employment, production workers, hourly wages, and productivity, 1978-2001Year 1978 1979 1980 1981 1982 1983 1984 1985 1986 1987 1988 1989
Billions of constant (1996) dollarsShipments . . . . . . . . . . . . . . . . 176.3 168.6 162.9 160.2 152.4 166.9 161.8 154.6 157.0 163.5 162.6 158.7Imports . . . . . . . . . . . . . . . . . . . 15.7 14.8 15.1 16.4 16.1 19.0 24.5 26.2 29.6 33.8 33.2 36.4Exports . . . . . . . . . . . . . . . . . . 5.3 6.8 7.2 6.4 4.6 4.0 3.7 3.4 3.8 4.4 5.4 6.2Apparent consumption . . . . . . 186.7 176.6 170.8 170.3 164.0 181.8 182.6 177.5 182.8 192.8 190.4 188.9Trade balance . . . . . . . . . . . . . -10.4 -8.0 -7.9 -10.0 -11.5 -14.9 -20.8 -22.9 -25.8 -29.4 -27.8 -30.1
PercentageImports/apparentconsumption . . . . . . . . . . . . 8.4 8.4 8.8 9.6 9.8 10.4 13.4 14.8 16.2 17.5 17.4 19.3
Exports/shipments . . . . . . . . . 3.0 4.0 4.4 4.0 3.0 2.4 2.3 2.2 2.4 2.7 3.3 3.9
1,000 workers
Total employment . . . . . . . . . . 2,231 2,189 2,111 2,067 1,911 1,905 1,931 1,823 1,803 1,822 1,813 1,796Production workers . . . . . . . 1,928 1,888 1,816 1,772 1,623 1,623 1,648 1,550 1,534 1,551 1,544 1,529
Constant (1996) dollars
Hourly earnings . . . . . . . . . . 8.47 8.43 8.36 8.32 8.23 8.27 8.27 8.29 8.33 8.30 8.27 8.27
$1,000 per worker
Labor productivity . . . . . . . . . . 91 89 90 90 94 98 98 100 102 105 105 104
See footnote at end of table.

Table 5-36—ContinuedTextiles and apparel products:1 U.S. shipments, imports, exports, apparent consumption, ratios of imports to consumptionand exports to shipments, total employment, production workers, hourly wages, and productivity, 1978-2001Year 1990 1991 1992 1993 1994 1995 1996 1997 1998 1999 2000 2001
Billions of constant (1996) dollars
Shipments . . . . . . . . . . . . . . . . 152.8 149.2 154.7 157.3 161.5 161.0 157.9 160.4 154.4 150.3 148.0 131.6Imports . . . . . . . . . . . . . . . . . . . 36.6 36.5 41.9 44.3 47.0 49.1 50.2 57.4 62.6 65.1 72.5 69.5Exports . . . . . . . . . . . . . . . . . . 7.5 8.8 9.9 10.8 11.8 13.1 14.3 16.1 16.1 15.6 16.5 14.6Apparent consumption . . . . . . 181.8 177.0 186.7 190.8 196.7 197.0 193.8 201.8 200.8 199.8 204.0 186.4Trade balance . . . . . . . . . . . . . -29.0 -27.8 -32.0 -33.5 -35.2 -36.0 -36.0 -41.4 -46.5 -49.5 -55.9 -54.9
Percentage
Imports/apparentconsumption . . . . . . . . . . . . 20.1 20.6 22.5 23.2 23.9 24.9 25.9 28.5 31.2 32.6 35.5 37.3
Exports/shipments . . . . . . . . . 4.9 5.9 6.4 6.8 7.3 8.2 9.1 10.0 10.5 10.4 11.2 11.1
1,000 workers
Total employment . . . . . . . . . . 1,728 1,676 1,681 1,664 1,650 1,599 1,494 1,440 1,363 1,249 1,164 1,044Production workers . . . . . . . 1,461 1,415 1,421 1,403 1,389 1,336 1,241 1,195 1,122 1,020 940 836
Constant (1996) dollars
Hourly earnings . . . . . . . . . . 8.27 8.24 8.30 8.32 8.42 8.54 8.70 8.86 9.07 9.36 9.52 9.47
$1,000 per worker
Labor productivity . . . . . . . . . . 105 105 109 112 116 121 127 134 138 147 157 157
1 Includes SIC 22 (textile mill products) and 23 (apparel and other finished products made from fabrics and similar materials).
Note.–Figures may not sum to total because of rounding.
Source: Compiled by the U.S. International Trade Commission from official statistics of the U.S. Department of Commerce, Bureau of Economic Analysis and Bureau of theCensus; and U.S. Department of Labor, Bureau of Labor Statistics.
289
fabrics, and in printing, dyeing, and finishing operations. Textile mills havealso invested in technology to improve manufacturing flexibility in an effortto coordinate production and marketing with the needs of their downstreamapparel customers. Domestic investment in U.S. textile machinery during1978-2001 averaged $2.1 billion per year and $2.7 billion per year during the1990s.272 The adoption of new manufacturing technologies enabled U.S.broadwoven fabric mills to increase fabric output per loom hour from 16 to35 square meters during 1989-99.273 Largely as a result of this investment,labor productivity in textile manufacturing increased 73 percent from1978-2001.
The U.S. apparel industry is a competitive and fragmented sector thatmostly comprises small establishments. The industry has undergone majorrestructuring during the past decade in response to rising import competition,changing consumer preferences, and increasing share of sales to a few largeretailers. The strong bargaining power of these retailers tends to reduce theflexibility of producers in negotiating prices and delivery dates, and enablesretailers to minimize inventory levels and push inventory costs back up thesupply chain.274 In response, U.S. apparel producers are increasing their focuson core products, reducing vertical integration to shed overhead costs,outsourcing more processes in the production chain domestically and offshore,and merging with other apparel companies to consolidate resources and capturegreater market share. Many smaller firms that are labor intensive and lack thefinancial resources, brand names, or operating efficiencies to compete havegone out of business.
The competitive pressures from retailers and foreign suppliers haveprompted many U.S. apparel firms to invest in new technology and improveproduction and marketing processes in an effort to maximize their inherentadvantage of market proximity. These firms now operate quick response (QR)systems to speed the flow of goods, services, and information betweensegments of the industry, linking them electronically with textile suppliers andretailers. Quick response programs provide apparel firms with timely access topoint-of-sale retail data, enabling them to focus production on apparel itemswith strong consumer appeal and maintain enough production flexibility toadapt to changing market demands. Although upgrades in technology haverevolutionized the apparel industry’s supply chain management, production ofmost garments remains labor intensive, largely because of the difficulty inautomating most sewing functions.
272 Capital expenditures for the 13--year period from 1978--2001 in the textile andapparel industries totaled $50 billion and $19 billion, respectively (to include equipmentand software purchases). U.S. Department of Commerce, Bureau of Economic Analysis,Historical--Cost Investment in private Equipment and Software by Industry (Table 3.7E),found at http://www.bea.gov, retrieved Sept. 25, 2002.
273 U.S. Department of Commerce, Census Bureau, CIR: Broadwoven Fabrics(Gray) Summary -- 1999 (MQ313T(99)--5), issued June 2000, and selected back issues.
274 Industry official, interview by USITC staff, New York, NY, May 13, 2002.
290
The decline in domestic demand for U.S.-made textiles has been offset, inpart, by the implementation of special access programs under heading9802.00.80 of the Harmonized Tariff Schedule (formerly TSUS item 807.00)that provide for the establishment of preferential quotas for apparel productsassembled in eligible countries from U.S.-origin fabrics. Such arrangementsallow domestic apparel companies to reduce costs on highly labor intensivesewing and detailing processes, while maintaining a market for U.S. textileproducts. A significant but declining part of the apparel imports under thistariff provision come from Caribbean Basin Economic Recovery Act (CBERA)countries and Mexico, which mainly compete with one another for assemblywork from U.S. firms.275 In addition to competitively priced labor, theproximity of these countries to the United States provides U.S. firms withgreater management control over production, quicker turnaround, and lowershipping costs than would Asian operations. The value of garment parts cut toshape in the United States and sent offshore for assembly totaled $6 billion in2001.
Effects of Trade Agreements on the SectorThe substantial rise in U.S. textile and apparel trade since 1982, and the
subsequent effects on the domestic industry can be attributed in part to the fivetrade agreements considered in this investigation. While tariff reductions incertain agreements (e.g., Tokyo Round) directly impacted trade flows, mostsector trade is still restricted by quotas originally set by the MultifiberArrangement and continuing until January 1, 2005 under the Agreement onTextiles and Clothing (see Uruguay Round section later in this chapter foradditional details). Furthermore, other factors such as the Caribbean BasinEconomic Recovery Act, currency devaluations in Mexico and certain Asiancountries, and the continuous emergence of low-cost producers world-widehave also been influential. Each of the five subject agreements has impactedthe U.S. sector to varying degrees. Table 5-37 presents trade issues addressedby the subject trade agreements that were relevant to the sector.
Tokyo RoundBetween 1982 (the first year in which Tokyo Round tariff reductions were
applied to sector products) and 2001, total U.S. trade in textile and apparelproducts increased more than 300 percent to $84 billion.276 While exports grew
275 U.S. imports of apparel from Mexico under 9802.00.80 have been decliningsince the implementation of the NAFTA, as the Agreement provides duty--free entry ofsuch goods under HTS heading 9802.00.90.
276 While tariff reductions for most products came into force on Jan. 1, 1980, thosepertaining to textile and apparel products were deferred to Jan. 1, 1982 due to a specialsnapback provision pertaining to the Multifiber Arrangement (MFA). The provision
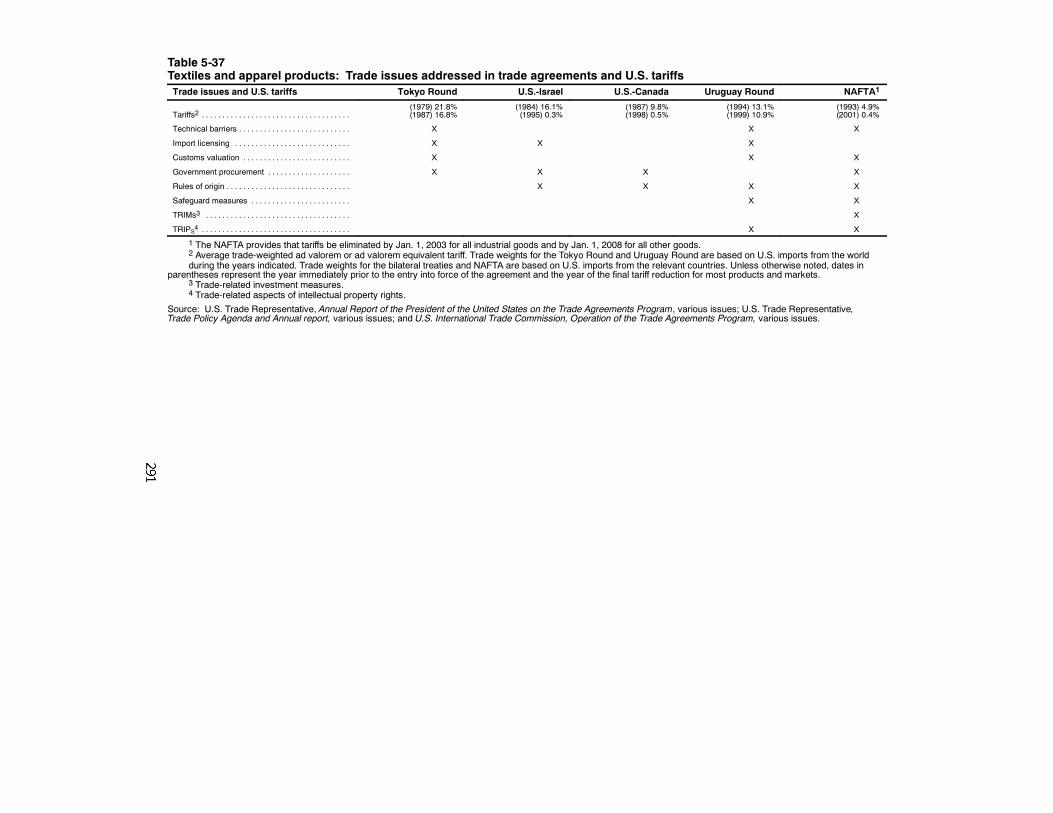
Table 5-37Textiles and apparel products: Trade issues addressed in trade agreements and U.S. tariffsTrade issues and U.S. tariffs Tokyo Round U.S.-Israel U.S.-Canada Uruguay Round NAFTA1
Tariffs2 . . . . . . . . . . . . . . . . . . . . . . . . . . . . . . . . . . . .(1979) 21.8%(1987) 16.8%
(1984) 16.1%(1995) 0.3%
(1987) 9.8%(1998) 0.5%
(1994) 13.1%(1999) 10.9%
(1993) 4.9%(2001) 0.4%
Technical barriers . . . . . . . . . . . . . . . . . . . . . . . . . . . X X X
Import licensing . . . . . . . . . . . . . . . . . . . . . . . . . . . . X X X
Customs valuation . . . . . . . . . . . . . . . . . . . . . . . . . . X X X
Government procurement . . . . . . . . . . . . . . . . . . . . X X X X
Rules of origin . . . . . . . . . . . . . . . . . . . . . . . . . . . . . . X X X X
Safeguard measures . . . . . . . . . . . . . . . . . . . . . . . . X X
TRIMs3 . . . . . . . . . . . . . . . . . . . . . . . . . . . . . . . . . . . X
TRIPS4 . . . . . . . . . . . . . . . . . . . . . . . . . . . . . . . . . . . . X X
1 The NAFTA provides that tariffs be eliminated by Jan. 1, 2003 for all industrial goods and by Jan. 1, 2008 for all other goods.2 Average trade-weighted ad valorem or ad valorem equivalent tariff. Trade weights for the Tokyo Round and Uruguay Round are based on U.S. imports from the worldduring the years indicated. Trade weights for the bilateral treaties and NAFTA are based on U.S. imports from the relevant countries. Unless otherwise noted, dates in
parentheses represent the year immediately prior to the entry into force of the agreement and the year of the final tariff reduction for most products and markets.3 Trade-related investment measures.4 Trade-related aspects of intellectual property rights.
Source: U.S. Trade Representative, Annual Report of the President of the United States on the Trade Agreements Program, various issues; U.S. Trade Representative,Trade Policy Agenda and Annual report, various issues; and U.S. International Trade Commission, Operation of the Trade Agreements Program, various issues.
292
at an average annual rate of 5 percent to $15 billion in 2001, importsincreased by 8 percent annually to $69 billion. Consequently, the UnitedStates recorded a trade deficit of $55 billion in 2001. International trade,already firmly established within the sector prior to the Tokyo Round,increased substantially during the period as globalization of the industry, anda succession of new low-cost suppliers, led manufacturers and retailers toalter production and sourcing patterns to reduce costs and maintaincompetitiveness. Imports as a share of domestic consumption nearlyquadrupled from 10 to 37 percent during 1982-2001, while exports as a shareof shipments increased almost four-fold to 11 percent. Apparel productsaccounted for a much larger share of sector imports in 2001 (88 percent) thandid textiles, while the two sub-sectors shared a nearly equal portion ofexports. Imports account for a much greater share of the consumption ofapparel than for textiles. For many significant apparel items such as shirtsand trousers, imports have captured more than 95 percent of the U.S. market.
It is likely that the effects of the Tokyo Round on the U.S. textile andapparel industry were modest. The element of the agreement that most affectedthe sector was the reduction in U.S. tariffs by an average of 21 percent over sixyears. However, most of the pre-existing rules governing textile and appareltrade were unaffected by the Tokyo Round as much sector trade continued tobe regulated by the Multifiber Arrangement (MFA), which was in force from1974-1994.
U.S.-Israel FTAAggregate U.S. trade in textile and apparel products with Israel increased at
an average annual rate of 15 percent during 1984-2001, reaching $622 million,of which apparel constituted $497 million (80 percent) (table 5-38). U.S.exports of textiles and apparel to Israel increased by 106 percent to $41 millionwhile imports from Israel increased more than ten times to $582 million. Themost significant concentration of imports in 2001 occurred in women’s knit andwoven apparel, and home textiles, while exports of synthetic filament fibersand yarns, and floor coverings dominated shipments to Israel. The sector tradedeficit with Israel broadened from $30 million to $540 million during1984-2001, with apparel accounting for 85 percent of the imbalance. Despitethe widening gap, however, trade with Israel in textile and apparel productsaccounted for less than one percent of total U.S. trade in the sector in 2001. Inthat year, Israel was the 36th largest market for U.S. sector exports and the24th largest supplier to the U.S. market.
276—Continuedstated that multilateral tariff reductions phased in over multiple years would return topre--negotiation levels in the absence of the MFA or a similar agreement. Because theMFA was set to expire on Jan. 1, 1982, tariff reductions were postponed until that date inorder to avoid nullification if the MFA was not renewed.
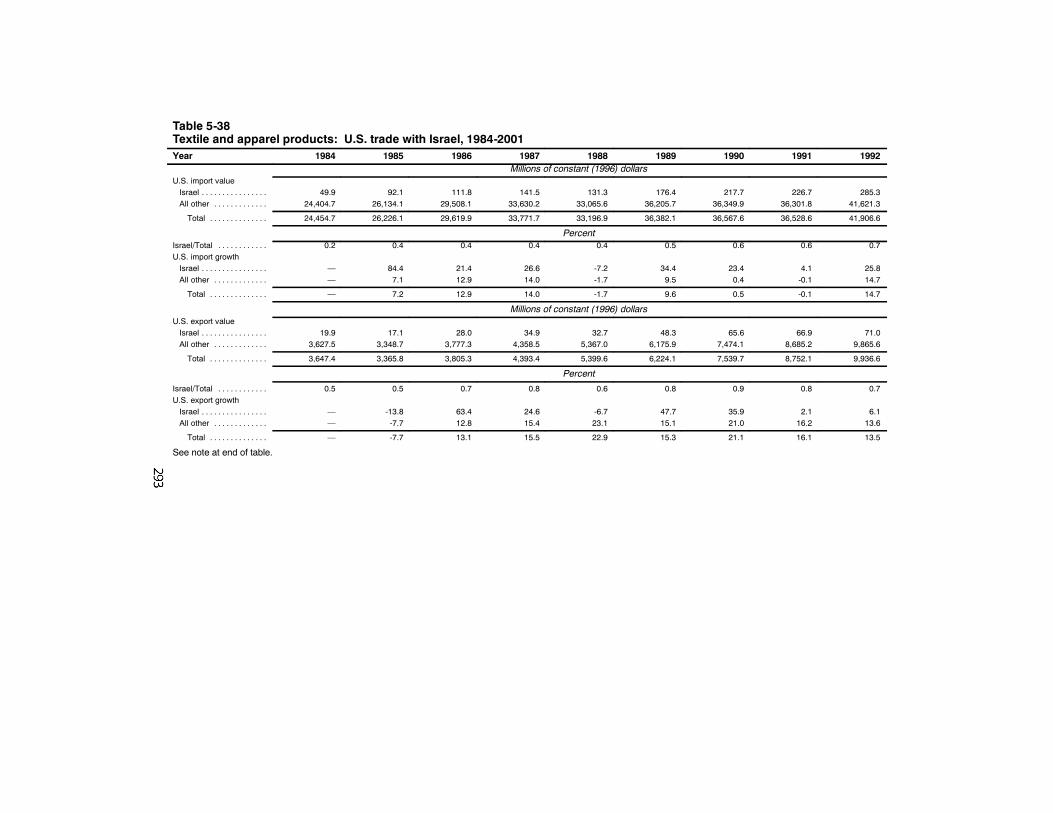
Table 5-38Textile and apparel products: U.S. trade with Israel, 1984-2001Year 1984 1985 1986 1987 1988 1989 1990 1991 1992
Millions of constant (1996) dollarsU.S. import valueIsrael . . . . . . . . . . . . . . . . 49.9 92.1 111.8 141.5 131.3 176.4 217.7 226.7 285.3All other . . . . . . . . . . . . . 24,404.7 26,134.1 29,508.1 33,630.2 33,065.6 36,205.7 36,349.9 36,301.8 41,621.3
Total . . . . . . . . . . . . . . 24,454.7 26,226.1 29,619.9 33,771.7 33,196.9 36,382.1 36,567.6 36,528.6 41,906.6
PercentIsrael/Total . . . . . . . . . . . . 0.2 0.4 0.4 0.4 0.4 0.5 0.6 0.6 0.7U.S. import growthIsrael . . . . . . . . . . . . . . . . — 84.4 21.4 26.6 -7.2 34.4 23.4 4.1 25.8All other . . . . . . . . . . . . . — 7.1 12.9 14.0 -1.7 9.5 0.4 -0.1 14.7
Total . . . . . . . . . . . . . . — 7.2 12.9 14.0 -1.7 9.6 0.5 -0.1 14.7
Millions of constant (1996) dollarsU.S. export valueIsrael . . . . . . . . . . . . . . . . 19.9 17.1 28.0 34.9 32.7 48.3 65.6 66.9 71.0All other . . . . . . . . . . . . . 3,627.5 3,348.7 3,777.3 4,358.5 5,367.0 6,175.9 7,474.1 8,685.2 9,865.6
Total . . . . . . . . . . . . . . 3,647.4 3,365.8 3,805.3 4,393.4 5,399.6 6,224.1 7,539.7 8,752.1 9,936.6
Percent
Israel/Total . . . . . . . . . . . . 0.5 0.5 0.7 0.8 0.6 0.8 0.9 0.8 0.7U.S. export growthIsrael . . . . . . . . . . . . . . . . — -13.8 63.4 24.6 -6.7 47.7 35.9 2.1 6.1All other . . . . . . . . . . . . . — -7.7 12.8 15.4 23.1 15.1 21.0 16.2 13.6
Total . . . . . . . . . . . . . . — -7.7 13.1 15.5 22.9 15.3 21.1 16.1 13.5
See note at end of table.
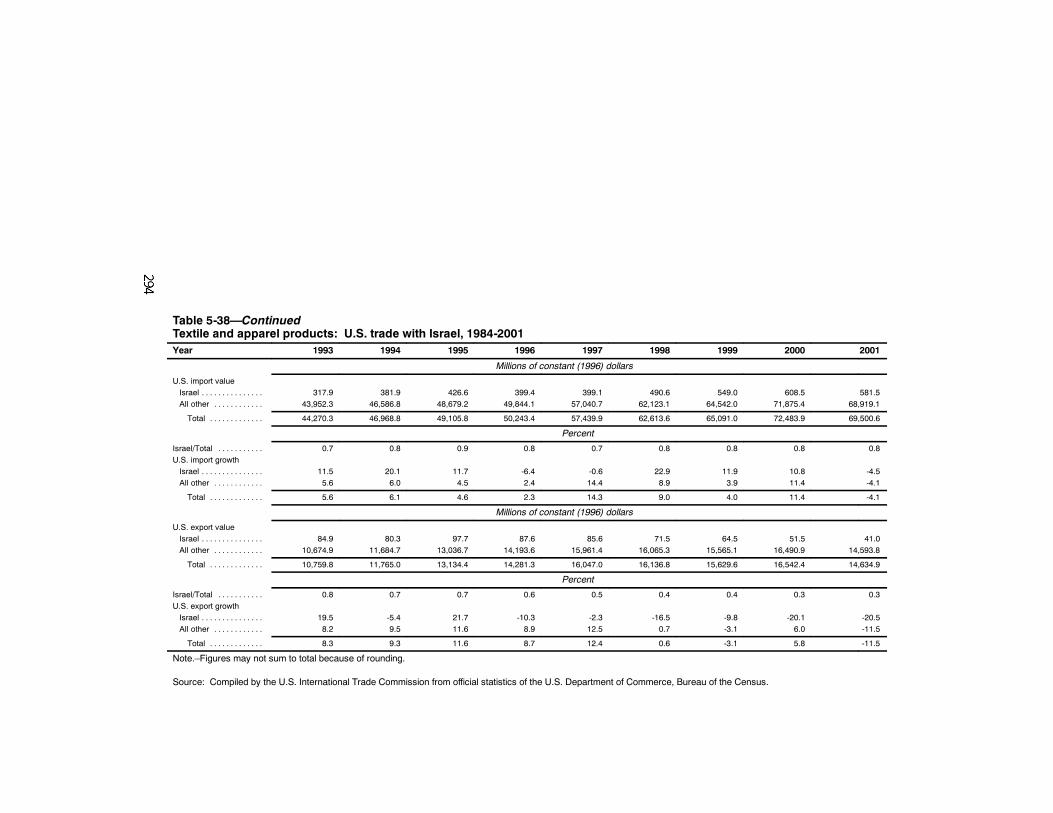
Table 5-38—ContinuedTextile and apparel products: U.S. trade with Israel, 1984-2001Year 1993 1994 1995 1996 1997 1998 1999 2000 2001
Millions of constant (1996) dollars
U.S. import valueIsrael . . . . . . . . . . . . . . . 317.9 381.9 426.6 399.4 399.1 490.6 549.0 608.5 581.5All other . . . . . . . . . . . . 43,952.3 46,586.8 48,679.2 49,844.1 57,040.7 62,123.1 64,542.0 71,875.4 68,919.1
Total . . . . . . . . . . . . . 44,270.3 46,968.8 49,105.8 50,243.4 57,439.9 62,613.6 65,091.0 72,483.9 69,500.6
Percent
Israel/Total . . . . . . . . . . . 0.7 0.8 0.9 0.8 0.7 0.8 0.8 0.8 0.8U.S. import growthIsrael . . . . . . . . . . . . . . . 11.5 20.1 11.7 -6.4 -0.6 22.9 11.9 10.8 -4.5All other . . . . . . . . . . . . 5.6 6.0 4.5 2.4 14.4 8.9 3.9 11.4 -4.1
Total . . . . . . . . . . . . . 5.6 6.1 4.6 2.3 14.3 9.0 4.0 11.4 -4.1
Millions of constant (1996) dollars
U.S. export valueIsrael . . . . . . . . . . . . . . . 84.9 80.3 97.7 87.6 85.6 71.5 64.5 51.5 41.0All other . . . . . . . . . . . . 10,674.9 11,684.7 13,036.7 14,193.6 15,961.4 16,065.3 15,565.1 16,490.9 14,593.8
Total . . . . . . . . . . . . . 10,759.8 11,765.0 13,134.4 14,281.3 16,047.0 16,136.8 15,629.6 16,542.4 14,634.9
Percent
Israel/Total . . . . . . . . . . . 0.8 0.7 0.7 0.6 0.5 0.4 0.4 0.3 0.3U.S. export growthIsrael . . . . . . . . . . . . . . . 19.5 -5.4 21.7 -10.3 -2.3 -16.5 -9.8 -20.1 -20.5All other . . . . . . . . . . . . 8.2 9.5 11.6 8.9 12.5 0.7 -3.1 6.0 -11.5
Total . . . . . . . . . . . . . 8.3 9.3 11.6 8.7 12.4 0.6 -3.1 5.8 -11.5
Note.–Figures may not sum to total because of rounding.
Source: Compiled by the U.S. International Trade Commission from official statistics of the U.S. Department of Commerce, Bureau of the Census.
295
It is not likely that the U.S.-Israel FTA had a measurable impact on thedomestic textile and apparel industry. While removal of quotas and most tariffson sector products under the agreement resulted in greater import levels fromIsrael during 1984-2001, the country remains a relatively small supplier to theU.S. market.
U.S.-Canada FTADuring 1987-2001, total U.S. trade in textile and apparel products with
Canada increased at an average annual rate of 12 percent, reaching $5.6 billion(table 5-39). Textiles and apparel represented 53 percent and 47 percent of thetrade value, respectively. Canada’s share of total U.S. textile trade increasedfrom 8 percent to 18 percent in the period, while its share of total U.S. appareltrade doubled from 2 percent to 4 percent. U.S. exports of textiles to Canadaincreased by 256 percent to $1.7 billion in 2001, while exports of apparel roseby 372 percent to $816 million. Within the same period, textile imports fromCanada increased by 511 percent to $1.3 billion and apparel by 339 percent to$1.8 billion. Canada was the second largest market for U.S. textile and apparelproducts in 1989 and the 11th largest supplier to the U.S. market. In 2001,Canada remained the second largest market for U.S. sector products, but hadbecome the fourth largest supplier to the United States.
It is likely that the U.S.-Canada FTA had a significant effect on U.S. sectortrade and production, particularly during 1988-1993 prior to implementation ofthe NAFTA, the trade provisions of which superseded those contained in thisagreement. During that period, elimination of tariffs and quotas led to a neartripling of sector exports to Canada reaching $1.9 billion, while importsfollowed a similar trend by more than doubling to $1.2 billion. The tradesurplus with Canada in sector products increased from $25 million to $766million between 1988-1993, most of which is attributable to higher exports ofintermediate textile goods, industrial textiles, and floor coverings.
NAFTADuring 1994-2001, total U.S. trade in textiles and apparel with NAFTA
countries Canada and Mexico increased at an average annual rate of 12 percentto $19 billion, compared with a 4-percent average annual increase in sectortrade with the rest of the world. Imports from Mexico increased by 184 percentto $9 billion, while those from Canada rose by 109 percent to $3.1 billion.Most of the increase occurred in apparel and manmade fibers. Exports toMexico, largely concentrated in broadwoven fabrics and garment parts forassembly, increased to $4.8 billion (111 percent). U.S. exports to Canadaclimbed to $2.4 billion (18 percent) during the 1994-2001 period, whichreflected increases in shipments of floor coverings and synthetic woven fabrics.In 1994, Mexico and Canada were the fifth and seventh largest sector suppliersto the United States, respectively, climbing to first and fourth place in 2001.Despite a quadrupling of the textile trade surplus with Mexico to $1.8 billion
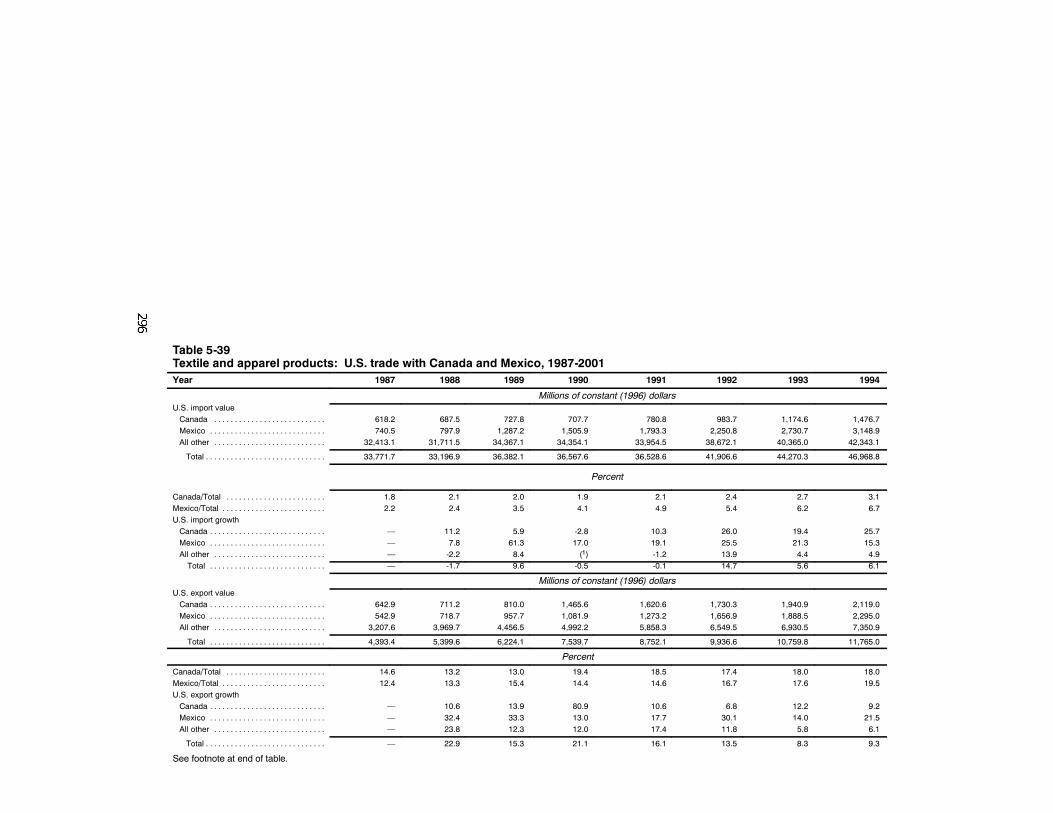
Table 5-39Textile and apparel products: U.S. trade with Canada and Mexico, 1987-2001Year 1987 1988 1989 1990 1991 1992 1993 1994
Millions of constant (1996) dollarsU.S. import valueCanada . . . . . . . . . . . . . . . . . . . . . . . . . . . 618.2 687.5 727.8 707.7 780.8 983.7 1,174.6 1,476.7Mexico . . . . . . . . . . . . . . . . . . . . . . . . . . . . 740.5 797.9 1,287.2 1,505.9 1,793.3 2,250.8 2,730.7 3,148.9All other . . . . . . . . . . . . . . . . . . . . . . . . . . . 32,413.1 31,711.5 34,367.1 34,354.1 33,954.5 38,672.1 40,365.0 42,343.1
Total . . . . . . . . . . . . . . . . . . . . . . . . . . . . . 33,771.7 33,196.9 36,382.1 36,567.6 36,528.6 41,906.6 44,270.3 46,968.8
Percent
Canada/Total . . . . . . . . . . . . . . . . . . . . . . . . 1.8 2.1 2.0 1.9 2.1 2.4 2.7 3.1Mexico/Total . . . . . . . . . . . . . . . . . . . . . . . . . 2.2 2.4 3.5 4.1 4.9 5.4 6.2 6.7U.S. import growthCanada . . . . . . . . . . . . . . . . . . . . . . . . . . . . — 11.2 5.9 -2.8 10.3 26.0 19.4 25.7Mexico . . . . . . . . . . . . . . . . . . . . . . . . . . . . — 7.8 61.3 17.0 19.1 25.5 21.3 15.3All other . . . . . . . . . . . . . . . . . . . . . . . . . . . — -2.2 8.4 (1) -1.2 13.9 4.4 4.9Total . . . . . . . . . . . . . . . . . . . . . . . . . . . . — -1.7 9.6 -0.5 -0.1 14.7 5.6 6.1
Millions of constant (1996) dollarsU.S. export valueCanada . . . . . . . . . . . . . . . . . . . . . . . . . . . . 642.9 711.2 810.0 1,465.6 1,620.6 1,730.3 1,940.9 2,119.0Mexico . . . . . . . . . . . . . . . . . . . . . . . . . . . . 542.9 718.7 957.7 1,081.9 1,273.2 1,656.9 1,888.5 2,295.0All other . . . . . . . . . . . . . . . . . . . . . . . . . . . 3,207.6 3,969.7 4,456.5 4,992.2 5,858.3 6,549.5 6,930.5 7,350.9
Total . . . . . . . . . . . . . . . . . . . . . . . . . . . . 4,393.4 5,399.6 6,224.1 7,539.7 8,752.1 9,936.6 10,759.8 11,765.0
Percent
Canada/Total . . . . . . . . . . . . . . . . . . . . . . . . 14.6 13.2 13.0 19.4 18.5 17.4 18.0 18.0Mexico/Total . . . . . . . . . . . . . . . . . . . . . . . . . 12.4 13.3 15.4 14.4 14.6 16.7 17.6 19.5U.S. export growthCanada . . . . . . . . . . . . . . . . . . . . . . . . . . . . — 10.6 13.9 80.9 10.6 6.8 12.2 9.2Mexico . . . . . . . . . . . . . . . . . . . . . . . . . . . . — 32.4 33.3 13.0 17.7 30.1 14.0 21.5All other . . . . . . . . . . . . . . . . . . . . . . . . . . . — 23.8 12.3 12.0 17.4 11.8 5.8 6.1
Total . . . . . . . . . . . . . . . . . . . . . . . . . . . . . — 22.9 15.3 21.1 16.1 13.5 8.3 9.3
See footnote at end of table.
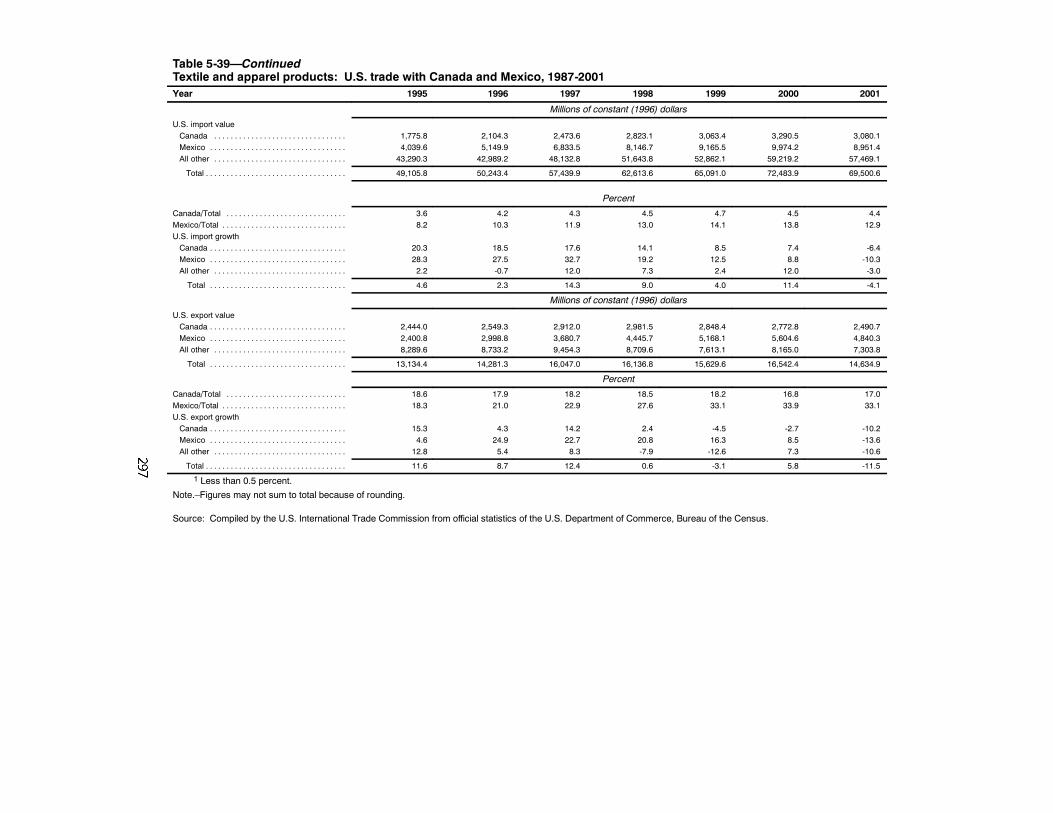
Table 5-39—ContinuedTextile and apparel products: U.S. trade with Canada and Mexico, 1987-2001Year 1995 1996 1997 1998 1999 2000 2001
Millions of constant (1996) dollars
U.S. import valueCanada . . . . . . . . . . . . . . . . . . . . . . . . . . . . . . . . 1,775.8 2,104.3 2,473.6 2,823.1 3,063.4 3,290.5 3,080.1Mexico . . . . . . . . . . . . . . . . . . . . . . . . . . . . . . . . . 4,039.6 5,149.9 6,833.5 8,146.7 9,165.5 9,974.2 8,951.4All other . . . . . . . . . . . . . . . . . . . . . . . . . . . . . . . . 43,290.3 42,989.2 48,132.8 51,643.8 52,862.1 59,219.2 57,469.1
Total . . . . . . . . . . . . . . . . . . . . . . . . . . . . . . . . . . 49,105.8 50,243.4 57,439.9 62,613.6 65,091.0 72,483.9 69,500.6
Percent
Canada/Total . . . . . . . . . . . . . . . . . . . . . . . . . . . . . 3.6 4.2 4.3 4.5 4.7 4.5 4.4Mexico/Total . . . . . . . . . . . . . . . . . . . . . . . . . . . . . . 8.2 10.3 11.9 13.0 14.1 13.8 12.9U.S. import growthCanada . . . . . . . . . . . . . . . . . . . . . . . . . . . . . . . . . 20.3 18.5 17.6 14.1 8.5 7.4 -6.4Mexico . . . . . . . . . . . . . . . . . . . . . . . . . . . . . . . . . 28.3 27.5 32.7 19.2 12.5 8.8 -10.3All other . . . . . . . . . . . . . . . . . . . . . . . . . . . . . . . . 2.2 -0.7 12.0 7.3 2.4 12.0 -3.0
Total . . . . . . . . . . . . . . . . . . . . . . . . . . . . . . . . . 4.6 2.3 14.3 9.0 4.0 11.4 -4.1
Millions of constant (1996) dollars
U.S. export valueCanada . . . . . . . . . . . . . . . . . . . . . . . . . . . . . . . . . 2,444.0 2,549.3 2,912.0 2,981.5 2,848.4 2,772.8 2,490.7Mexico . . . . . . . . . . . . . . . . . . . . . . . . . . . . . . . . . 2,400.8 2,998.8 3,680.7 4,445.7 5,168.1 5,604.6 4,840.3All other . . . . . . . . . . . . . . . . . . . . . . . . . . . . . . . . 8,289.6 8,733.2 9,454.3 8,709.6 7,613.1 8,165.0 7,303.8
Total . . . . . . . . . . . . . . . . . . . . . . . . . . . . . . . . . 13,134.4 14,281.3 16,047.0 16,136.8 15,629.6 16,542.4 14,634.9
Percent
Canada/Total . . . . . . . . . . . . . . . . . . . . . . . . . . . . . 18.6 17.9 18.2 18.5 18.2 16.8 17.0Mexico/Total . . . . . . . . . . . . . . . . . . . . . . . . . . . . . . 18.3 21.0 22.9 27.6 33.1 33.9 33.1U.S. export growthCanada . . . . . . . . . . . . . . . . . . . . . . . . . . . . . . . . . 15.3 4.3 14.2 2.4 -4.5 -2.7 -10.2Mexico . . . . . . . . . . . . . . . . . . . . . . . . . . . . . . . . . 4.6 24.9 22.7 20.8 16.3 8.5 -13.6All other . . . . . . . . . . . . . . . . . . . . . . . . . . . . . . . . 12.8 5.4 8.3 -7.9 -12.6 7.3 -10.6
Total . . . . . . . . . . . . . . . . . . . . . . . . . . . . . . . . . . 11.6 8.7 12.4 0.6 -3.1 5.8 -11.5
1 Less than 0.5 percent.
Note.–Figures may not sum to total because of rounding.
Source: Compiled by the U.S. International Trade Commission from official statistics of the U.S. Department of Commerce, Bureau of the Census.
298
between 1994-2001, the $6 billion deficit in apparel trade resulted in a tradedeficit for the entire textile and apparel sector.
It is likely the agreement had a significant effect on U.S. sector trade andproduction. The U.S. textile industry, especially fabric producers, has benefittedfrom the increased use of U.S. fabric in apparel and other made-up textilegoods assembled in production-sharing operations in Mexico. Further, theAgreement’s strict rules of origin virtually guaranteed high demand for U.S.and Canadian fabrics and yarns given the abundance of low-cost apparelmanufacturing and lack of high-quality textiles available in Mexico. However,as domestic textile mills have faced intense international competition in recentyears, many firms have reduced or discontinued operations despite demand inCanada and Mexico. The agreement has had a more negative effect on thedomestic apparel industry as competition from garments produced in Mexicousing low-cost labor have caused many U.S. manufacturers to close down ormove assembly operations offshore.277 Furthermore, devaluation of theMexican peso in December 1994-January 1995 greatly enhanced Mexico’scompetitive position in the U.S. market.
Uruguay RoundTotal U.S. trade in textiles and apparel increased at an average annual rate
of 5 percent during 1995-2001, reaching $84 billion at the end of the period.Imports of textiles increased by 23 percent to $8 billion while exports rose by44 percent to $8 billion. During the same period, apparel imports climbed by52 percent to $61 billion while exports increased by 8 percent to $7 billion.The strong growth of apparel imports relative to that of exports increased thesector trade deficit by 56 percent to $55 billion.
The Uruguay Round established the Agreement on Textiles and Clothing(ATC), which replaced the MFA as the comprehensive agreement governingglobal trade in this sector. The ATC established a ten-year schedule foracceleration of quota growth rates and gradual phase-out of all MFA quotas infour stages by January 1, 2005, with remaining quotas phased out at a fasterrate than previously.278 During the first three stages of integration, completedon July 1, 2002, quotas on at least 51 percent of eligible products were phasedout.279 Because importing countries had considerable flexibility in selecting
277 Industry official, telephone interview by USITC staff, June 21, 2001.278 MFA quotas were applied on a country--specific basis. This was a departure from
the GATT nondiscrimination principle that all GATT--member countries be treatedequally when quotas or other trade restrictions are applied.
279 The quota phase--out schedule required 16 percent integration on July 1, 1995, anadditional 17 percent on July 1, 1998, and another 18 percent on July 1, 2002. Individualcountries were allowed to determine which products from each of four categories (topsand yarns, fabrics, made--up textile products, and apparel) that they would included ineach tranche.
299
products for inclusion in each phase, the United States delayed removingquotas on the most import-sensitive products until the final stage. It ispossible that considerable disruption, including major switching amongimport suppliers, will occur to the domestic industry when quotas on theremaining 49 percent of goods are eliminated, as products under thosecategories accounted for 85 percent of textile and apparel imports in 2001.Certain products that were fully integrated on January 1, 2002 haveexperienced increases in import levels by quantity though the value of thoseimports may have declined. For example, overall shipments of infants’apparel into the United States in 2002, no longer subject to quotas, rose10 percent by volume but decreased 3 percent in value, most likely resultingfrom a large increase in low-price imports from China which replacedhigher-priced imports from other sources.280 The ATC also required membersto reduce or eliminate nontariff barriers and facilitate customs, administrative,and licensing procedures. According to U.S. industry representatives,however, many such barriers remain in foreign markets or have been createdby countries seeking to offset WTO market concessions using measures suchas onerous labeling requirements or lengthy pre-import inspections.281 U.S.consumers have likely benefitted to some degree already from lower pricesand greater product diversity.
Views of Interested Parties
Association of the Nonwoven Fabrics Industry282
The Association of the Nonwoven Fabrics Industry (INDA) is the tradeassociation of the nonwovens industry, a multi-billion-dollar business in theUnited States and abroad. INDA members are involved in the manufacture ofnonwoven roll goods and production of primary materials and machinery usedto create nonwovens. INDA members also include companies that convertnonwoven roll goods into finished products such as disposable baby diapers,surgical drapes and gowns, filtration materials, wiping products, constructionmaterials, geotextiles, and numerous other end-use applications.
280 Based on category 239 Major Shippers Report data from the Department ofCommerce. China’s category imports increased 826 percent by quantity in 2002, whilejust 298 percent by value.
281 American Textile Manufacturers Institute, “Promises Unkept: A Report onMarket Access for U.S. Textile and Apparel Products Five Years into the World TradeOrganization,” Mar. 17, 2000.
282 Jessica Franken, Government Affairs Associate, Association of the NonwovenFabrics Industry, written submission to the Commission, March 31, 2003.
300
The unilateral phaseout of U.S. tariffs on nonwoven roll goods during theUruguay Round, which went from a high of 16 percent in 1994 to zero as ofJanuary 1, 1999, has been at least partially responsible for a dramaticnarrowing in the gap between U.S. imports and U.S. exports of nonwoven rollgoods (as measured in kilograms) over the past six years. Imports of nonwovenroll goods to the United States increased more than 140 percent during1996-2001, while U.S. exports have risen by a more modest rate of 59 percentover the same period. The United States exported 162 percent more nonwovenroll goods than it imported during 1996, although by 2001 that gap hadnarrowed such that the U.S. exported 72 percent more nonwoven roll goodsthan it imported. Given these trends, INDA is concerned that imports ofnonwoven roll goods to the U.S. will match, and perhaps exceed, U.S. exportswithin the next few years.
“The nonwovens industry has often been regarded as one of the few brightpoints within the struggling textiles sector of the U.S. economy, but these dutyimbalances threaten to reverse that trend.” INDA requests that the USITCreflect in its investigation the difficulties its industry has experienced as a resultof the elimination of tariffs of nonwoven roll goods during the Uruguay Round.
301
CHAPTER 6:The Impact of NAFTA
Preferences on U.S.-MexicanTrade: A Sectoral Approach
IntroductionNAFTA came into effect on Jan. 1, 1994. The Agreement capped nearly a
decade of improved and expanded trade ties between the United States andMexico, and widened the scope of the U.S.-Canada Free Trade Agreement(CFTA), which was signed in 1989. A large number of studies have examinedNAFTA and its effect on trade. However, due to the lack of historical data, themajority of these studies used computable general equilibrium (CGE) modelsto address this question.1 The general consensus of these ex ante studies is thatNAFTA would provide large positive benefits to the Mexican economy, havesmall but positive effects on the U.S. economy, and have minimal effects onthe Canadian economy.
1 A notable exception is USITC, The Impact of the North American Free TradeAgreement on the U.S. Economy and Industries: A Three-Year Review, USITCPublication No. 3045, June 1997. As discussed in chapter 4, this study uses import andexport demand functions to examine the effects of NAFTA on North American trade atthe aggregate level, between 1989 and 1996. The study reports the volume of U.S.imports from Mexico increased by 10 percent in 1994, by 5.7 percent in 1995, and 6.4percent in 1996, as a result of NAFTA. The volume of U.S. exports to Mexico rose by1.3 percent in 1994, was 3.8 percent higher in 1995, and 3.2 percent higher in 1996.However, there were no significant effects of NAFTA on U.S. aggregate trade withCanada. Using a similar methodology, the study analyzed almost 200 industries,accounting for more than 85 percent of trade between the United States and its NAFTApartners. For most of the industries analyzed, the USITC found no discernible impact ofNAFTA on changes in the volume of bilateral trade between member countries.However, U.S. exports to Mexico increased significantly in 13 industries, and fell innone. U.S. imports from Mexico increased in 16 industries, and decreased in sevenindustries. U.S. exports to Canada increased in 10 industries, and fell in eight industries,while U.S. imports from Canada increased in 13 industries, but declined in eightindustries.
302
In ex post studies, it is difficult to isolate the effect of NAFTA on trade,partly because other domestic and trade-related events occurred close to orduring the NAFTA phase-in period. These events include political instability inMexico, the devaluation of the peso in December 1994, and the establishmentof the World Trade Organization in 1995. Furthermore, not all tariffs on tradedcommodities were eliminated between the United States, Canada, and Mexicoin 1994. For most commodities, tariffs are being phased out over a10-to-15-year period, depending on the commodity category. Therefore, NorthAmerican trade flows since 1994 are not entirely free of duty. Moreover, inaddition to tariff reductions, NAFTA contains other provisions relating tonontariff barriers, border measures, and dispute resolution mechanisms that canbe expected to generate changes that are difficult to quantify. These factorscomplicate the analysis and make it more difficult for researchers to adequatelycapture the effects of NAFTA on trade among member countries.
Nevertheless, sufficient time has now elapsed since the implementation ofNAFTA to make statistical testing feasible. The objective of this chapter is toestimate statistically the impact of NAFTA tariff reductions and tariffpreferences on U.S. and Mexican trade in goods across industries.2 Threespecific questions are examined. First, did reductions in U.S. and Mexicantariffs under NAFTA increase import shares significantly across industries?Second, did import shares increase more in industries with relatively largerNAFTA tariff preferences? Third, does the response to NAFTA tariffliberalization differ significantly across industries?
This chapter examines the changes in Mexican shares of U.S. imports ofmanufactured goods from 1989-2001, and changes in U.S. shares of Mexicanimports of manufactured goods from 1991-1999.3 In order to include thepre-existing GSP preferences, and the gradual phase-in of NAFTA, the appliedtariff preferences are used for each product over the time period. The impact ofboth tariff reductions and tariff preferences on import shares are examinedacross industries. Tests for differences in response to tariff reductions and tariffpreferences before and after NAFTA are conducted. For the U.S. market, testsfor differences in response across industries are conducted.
Results suggest that U.S. tariff reductions and tariff preferences underNAFTA did have a significant impact on Mexican shares of U.S. imports.About one-third of the growth in Mexico’s import shares could be attributed toU.S. tariff reductions and tariff preferences under NAFTA. The impact of both
2 As stated above, the Commission analysis examines tariff reductions on goodsonly. It does not examine changes in non-tariff barriers, nor trade in services.
3 Clearly, additional U.S. tariff reductions after 2001 and Mexican tariff reductionsafter 1999 are not included. Since much of the phase-in took place by 2001, this is notlikely to bias the results.
303
U.S. tariff reductions and U.S. tariff preferences was larger after NAFTArelative to the period as a whole. Estimates for the textile and apparelindustry showed an even stronger response to U.S. trade liberalization andU.S. tariff preferences under NAFTA, suggesting that responses to NAFTAare likely to differ across sectors. Results also suggest that Mexican tariffreductions and tariff preferences under NAFTA had a significant impact onU.S. shares of Mexican imports. Mexican trade liberalization toward theUnited States under NAFTA implied an expansion of about 13 percent in theaverage U.S. share of Mexico’s manufactured goods imports. However, thisexpansion was almost completely offset by the depreciation of the pesoagainst the dollar.
Previous Studies4
There is much debate as to whether the NAFTA has had any significantimpact on trade flows. Recent ex post statistical studies show conflictingresults, while leaving some questions unanswered. Agama and McDaniel5study the impact of U.S. NAFTA tariff preference toward Mexico on aggregateU.S. imports from Mexico between 1989 and 2001. They explicitly capture thegradual phase-in of these preferences. The authors find that U.S. tariffpreferences did significantly increase U.S. imports from Mexico, and that theimpact of NAFTA tariff preferences on U.S.-Mexican trade was significantlylarger than the impact of U.S. preferences extended to Mexico prior toNAFTA. Agama and McDaniel also find that Mexican tariff preferences underNAFTA significantly increased Mexican aggregate imports from the UnitedStates. These results are in sharp contrast to those of Krueger.6 Examining U.S.aggregate imports from Mexico between 1991 and 1997, Krueger finds littleevidence that membership in NAFTA had significant effects on NorthAmerican trade. However, she does argue that trade in some individual sectorsmay have increased due to NAFTA.
Romalis7 examines the impact of the U.S. NAFTA preferences onCanadian and Mexican shares of U.S. imports across industries. In general, hefinds a positive, significant effect of NAFTA trade preferences on Mexican andCanadian shares of U.S. imports. However, his analysis does not directlycapture the year-by-year phase-in of the NAFTA tariff preferences. Fukao,
4 See appendix B for a more detailed discussion of the papers cited in this section.5 Laurie-Ann Agama and Christine A. McDaniel, “The NAFTA Preference and
U.S.-Mexico Trade: Aggregate Level Analysis,” The World Economy, forthcoming2003.
6 Ann O. Krueger, “Trade Creation and Trade Diversion Under NAFTA,” NationalBureau of Economic Research (NBER) Working Paper, December 1999.
7 John Romalis, “NAFTA’s Impact on North American Trade,” University ofChicago Graduate School of Business Working Paper, 2001.
304
et al.,8 also examine U.S. imports from Mexico and Canada acrossmanufactured goods, from 1992-1998. They find that U.S. tariff reductionsunder NAFTA implied increases in Mexican and Canadian shares of U.S.imports for a significant number of industries. However, Fukao, et al. do notexplicitly test the effect of U.S. tariff preferences under NAFTA.
NAFTA and North American Trade
United States9
Figure 6-1 shows a comparison across sectors of U.S. applied tariffs againstU.S. imports from Mexico for the pre- and post-NAFTA implementationperiod.10 The figure shows substantial variation in the initial level of protectionas well as differences in the degree of tariff liberalization across sectors.11 In1993, the U.S. applied tariffs on imports from Mexico ranged, on average,from a low of only 0.7 percent on wood products to a high of 9.4 percent ontextiles and apparel products. Between 1993 and 2001, applied tariffs onMexican goods fell across all sectors as tariff reductions under NAFTA werephased in. By 2001, U.S. applied tariffs on goods imported from Mexicoranged from nearly free trade in wood products to about 1 percent on footwearproducts. The textile and apparel sector experienced the largest decline, as theaverage tariff fell from over 9 percent in 1993 to less than 1 percent in 2001.Figure 6-2 shows that U.S. applied tariffs on goods imported from non-NAFTAcountries followed a similar pattern, declining across all sectors between 1993and 2001, largely due to the Uruguay Round. However, U.S. tariffs against thenon-NAFTA partners fell at a much slower rate than those against Canada andMexico.
Figure 6-3 shows the variation in tariff preference that the United Statesextended to Mexico between 1993 and 2001 across sectors. With the exceptionof the agriculture sector, Mexico received a tariff preference in all sectors priorto the implementation of NAFTA, under the GSP program, theproduction-sharing provisions of the United States Harmonized Tariff System(HTS), and under duty suspension in HTS chapter 99. After NAFTA came intoeffect, Mexico was no longer eligible for GSP program benefits. The tariff
8 Kyoji Fukao, Toshihiro Okubo, and Robert Stern, “An Econometric Analysis ofTrade Diversion,” The North American Journal of Economics and Finance, vol. 14, No.1, March 2003, pp. 3-24.
9 All data on U.S. trade and tariffs are taken from the U.S. Department ofCommerce.
10 Applied tariffs are calculated as the ratio of collected import duties to customsvalue of total imports from Mexico.
11 Sectors are defined according to the section classifications in the HTS. See tableB-1 in appendix B.
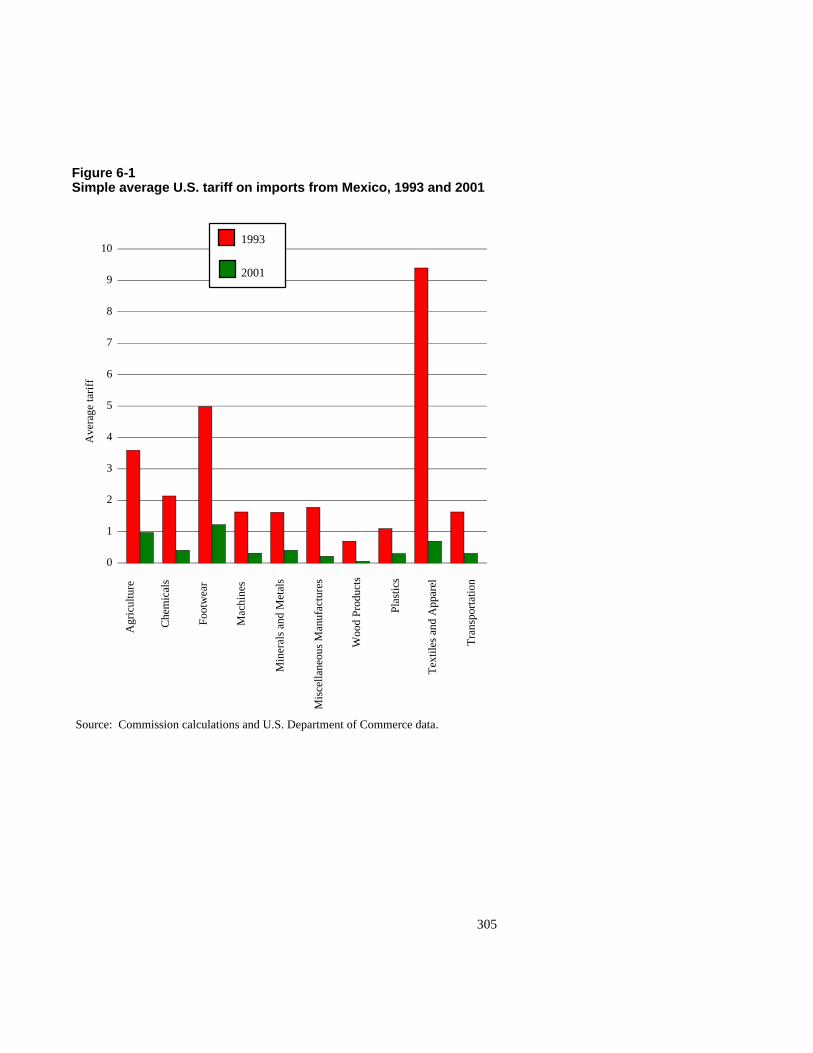
305
Figure 6-1Simple average U.S. tariff on imports from Mexico, 1993 and 2001
0
1
2
3
4
5
6
7
8
9
10
Source: Commission calculations and U.S. Department of Commerce data.
Ave
rage
tari
ff
Agr
icul
ture
Che
mic
als
Foot
wea
r
Mac
hine
s
Min
eral
san
dM
etal
s
Mis
cella
neou
sM
anuf
actu
res
Woo
dPr
oduc
ts
Plas
tics
Tex
tiles
and
App
arel
Tra
nspo
rtat
ion
1993
2001
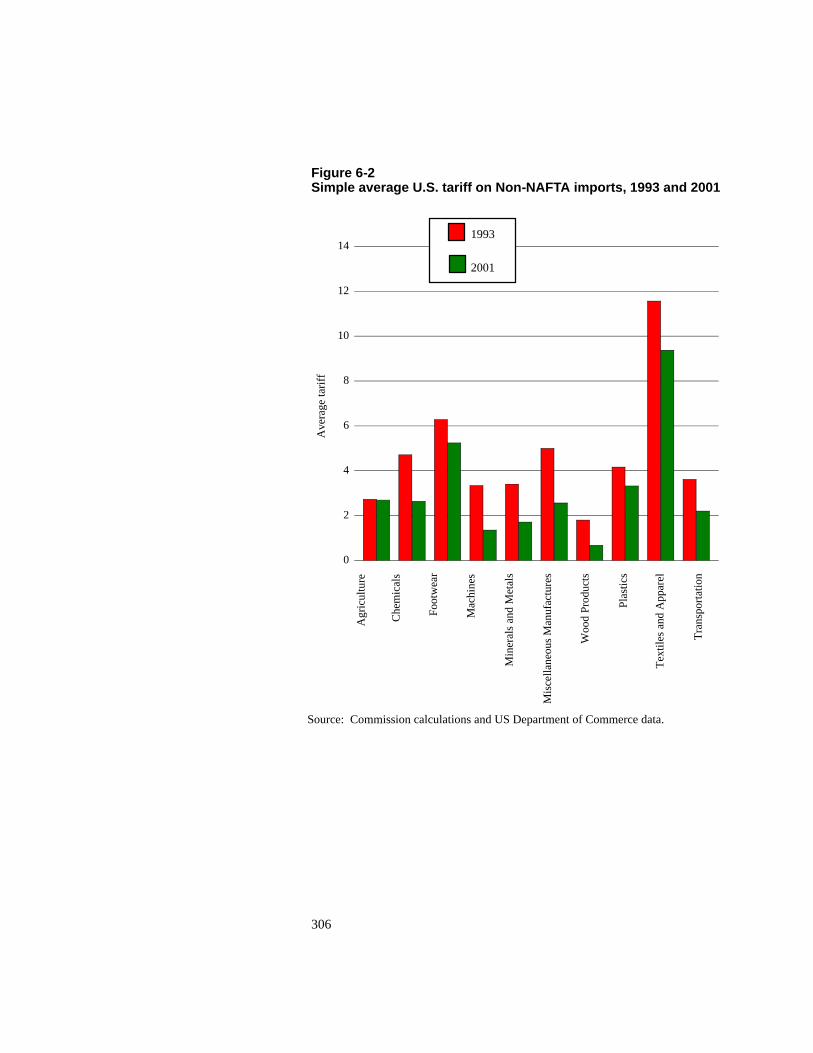
306
Figure 6-2Simple average U.S. tariff on Non-NAFTA imports, 1993 and 2001
0
2
4
6
8
10
12
14
Source: Commission calculations and US Department of Commerce data.
Ave
rage
tari
ff
Agr
icul
ture
Che
mic
als
Foot
wea
r
Mac
hine
s
Min
eral
san
dM
etal
s
Mis
cella
neou
sM
anuf
actu
res
Woo
dPr
oduc
ts
Plas
tics
Tex
tiles
and
App
arel
Tra
nspo
rtat
ion
1993
2001
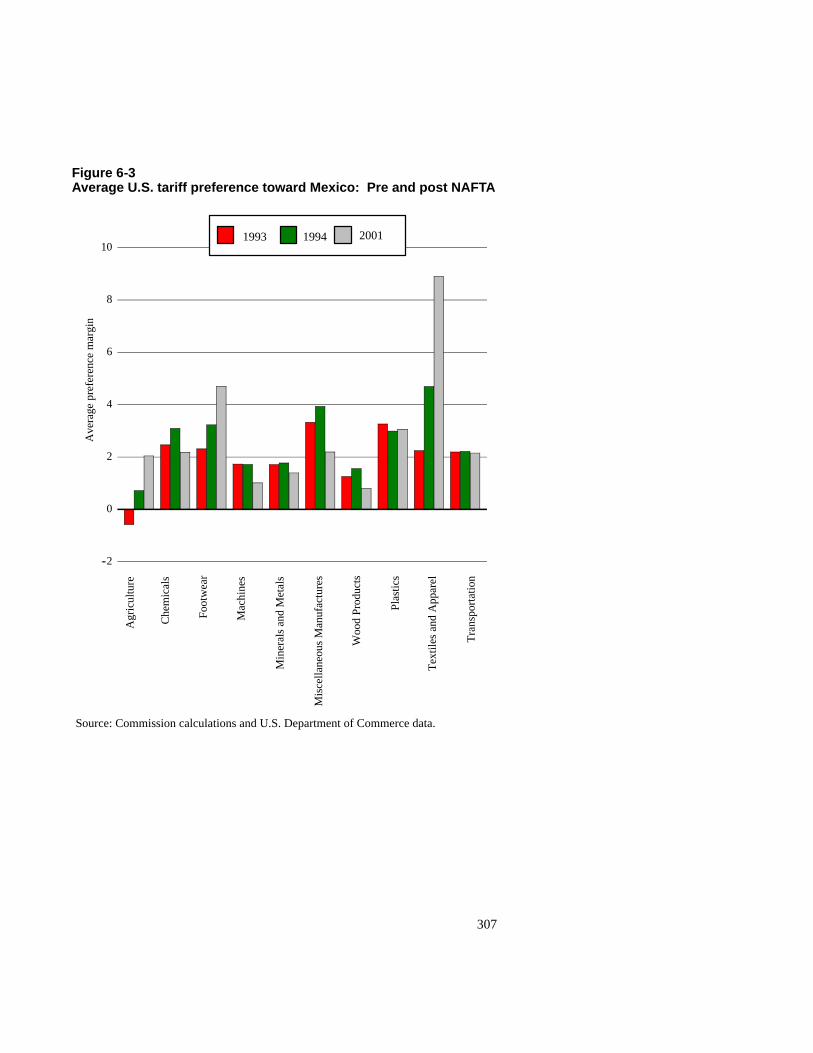
307
Figure 6-3Average U.S. tariff preference toward Mexico: Pre and post NAFTA
--2
0
2
4
6
8
10
Source: Commission calculations and U.S. Department of Commerce data.
Ave
rage
pref
eren
cem
argi
n
Agr
icul
ture
Che
mic
als
Foot
wea
r
Mac
hine
s
Min
eral
san
dM
etal
s
Mis
cella
neou
sM
anuf
actu
res
Woo
dPr
oduc
ts
Plas
tics
Tex
tiles
and
App
arel
Tra
nspo
rtat
ion
1993 1994 2001
308
preference increased for all sectors (except plastics), and remained positive in2001, although it declined slightly in some sectors, most likely due tomultilateral tariff cuts under the Uruguay Round.
Mexico’s share of U.S. imports for 1993, 1994, and 2001, grouped by U.S.2001 tariff preference, are shown in figure 6-4. Although Mexico increased itsimport share in both the pre- and post-NAFTA period, the growth in Mexico’sshare of U.S. imports accelerated across all preference ranges during theNAFTA years. It is clear that products that received positive preferences in2001 did experience significant growth between 1989 and 1993. However, afterthe implementation of NAFTA, growth rates for these products accelerated,particularly for products with preferences exceeding 5 percentage points.12
Mexico13
Figure 6-5 shows the distribution of Mexico’s tariffs against imports fromthe United States.14 It is evident that between 1991 and 1999, Mexican tariffsfell dramatically across all product categories.15 Mexico’s average tariff fellfrom an initial level of 13.8 percent in 1991, to an average level of only 3.9percent in 1999. Mexico’s initial tariffs against U.S. products varied acrosssectors, ranging from about 11.0 percent for chemical products to 18.0 percentfor miscellaneous manufactures products. The largest reduction in averagetariff, 13.5 percentage points, took place in the miscellaneous manufacturessector. The textiles and apparel and footwear sectors experienced declines ofalmost 12 percentage points, closely followed by the machinery andtransportation sectors with reductions in tariffs of more than 11 percentagepoints.
Mexico’s average tariffs against non-NAFTA partners were the same asthose against the United States prior to NAFTA (figure 6-6). However,Mexican tariffs against non-NAFTA countries actually rose between 1991 and1999, most likely reflecting a decision made in response to the peso crisis.16
The largest increases are seen in textiles, apparel, and footwear items. As aresult of continued tariff cuts on products imported from the United States,coupled with increased barriers against non-NAFTA partners, Mexican tariffpreferences toward the United States grew considerably, as shown in figure6-7.
12 This includes more than 700 items at the HTS 6-digit level.13 All Mexican trade and tariff data are taken from the United Nations Conference
on Trade and Development’s Trade Analysis and Information System.14 Applied tariffs are calculated as the ratio of import duties to customs value of total
imports from the United States.15 Sectors are defined according to the section classifications in the HTS. See table
B-1 in appendix B.
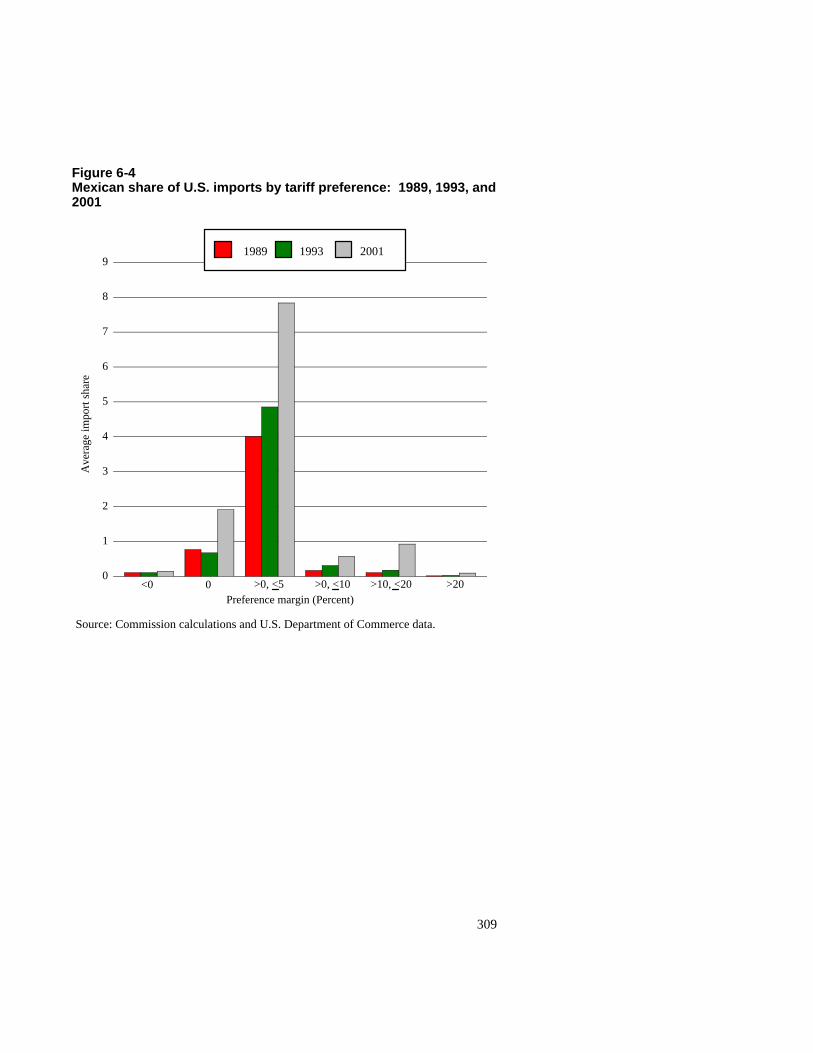
309
Figure 6-4Mexican share of U.S. imports by tariff preference: 1989, 1993, and2001
0
1
2
3
4
5
6
7
8
9
Source: Commission calculations and U.S. Department of Commerce data.
Ave
rage
impo
rtsh
are
1989 1993 2001
Preference margin (Percent)<0 0 >0, <10 >10, <20 >20>0, <5
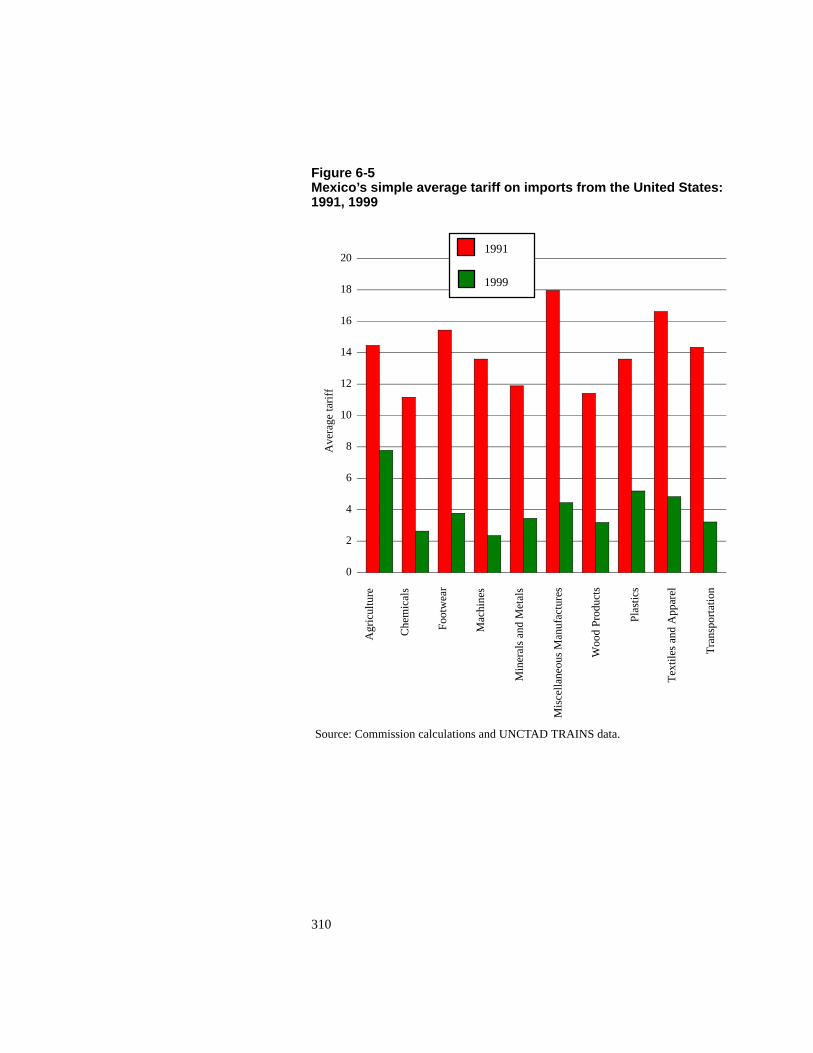
310
Figure 6-5Mexico’s simple average tariff on imports from the United States:1991, 1999
0
2
4
6
8
10
12
14
16
18
20
Source: Commission calculations and UNCTAD TRAINS data.
Ave
rage
tari
ff
Agr
icul
ture
Che
mic
als
Foot
wea
r
Mac
hine
s
Min
eral
san
dM
etal
s
Mis
cella
neou
sM
anuf
actu
res
Woo
dPr
oduc
ts
Plas
tics
Tex
tiles
and
App
arel
Tra
nspo
rtat
ion
1991
1999
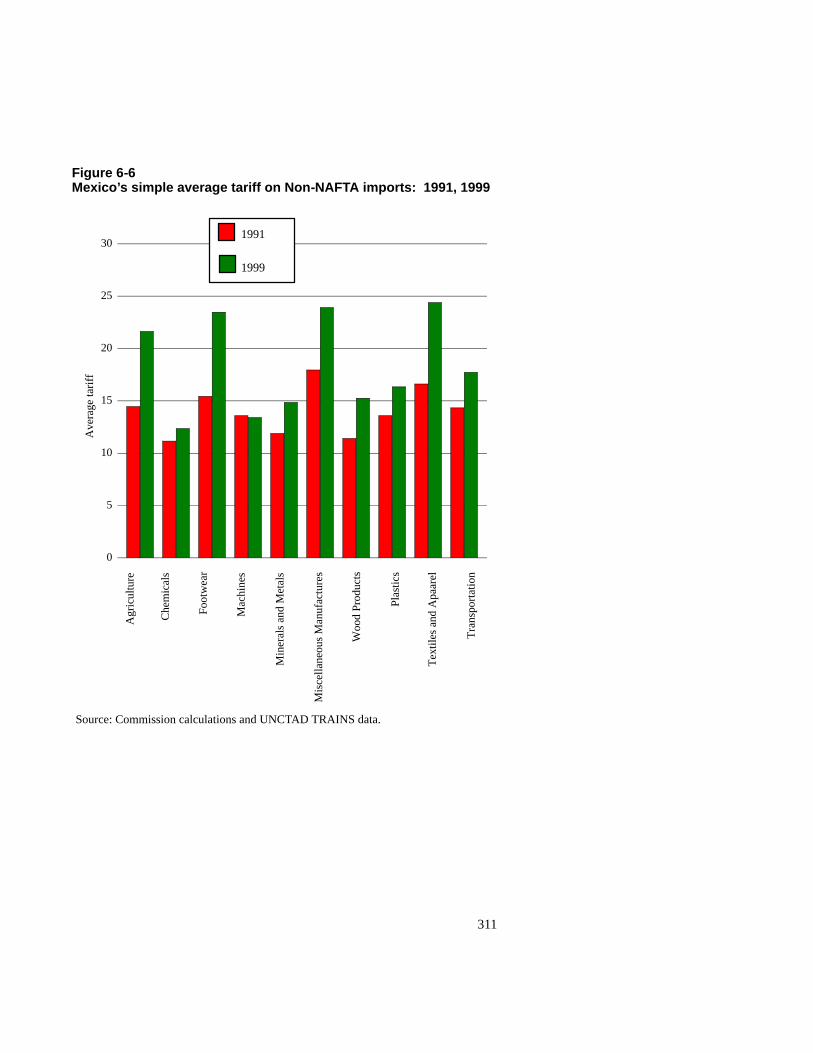
311
Figure 6-6Mexico’s simple average tariff on Non-NAFTA imports: 1991, 1999
0
5
10
15
20
25
30
Source: Commission calculations and UNCTAD TRAINS data.
Ave
rage
tari
ff
Agr
icul
ture
Che
mic
als
Foot
wea
r
Mac
hine
s
Min
eral
san
dM
etal
s
Mis
cella
neou
sM
anuf
actu
res
Woo
dPr
oduc
ts
Plas
tics
Tex
tiles
and
Apa
arel
Tra
nspo
rtat
ion
1991
1999
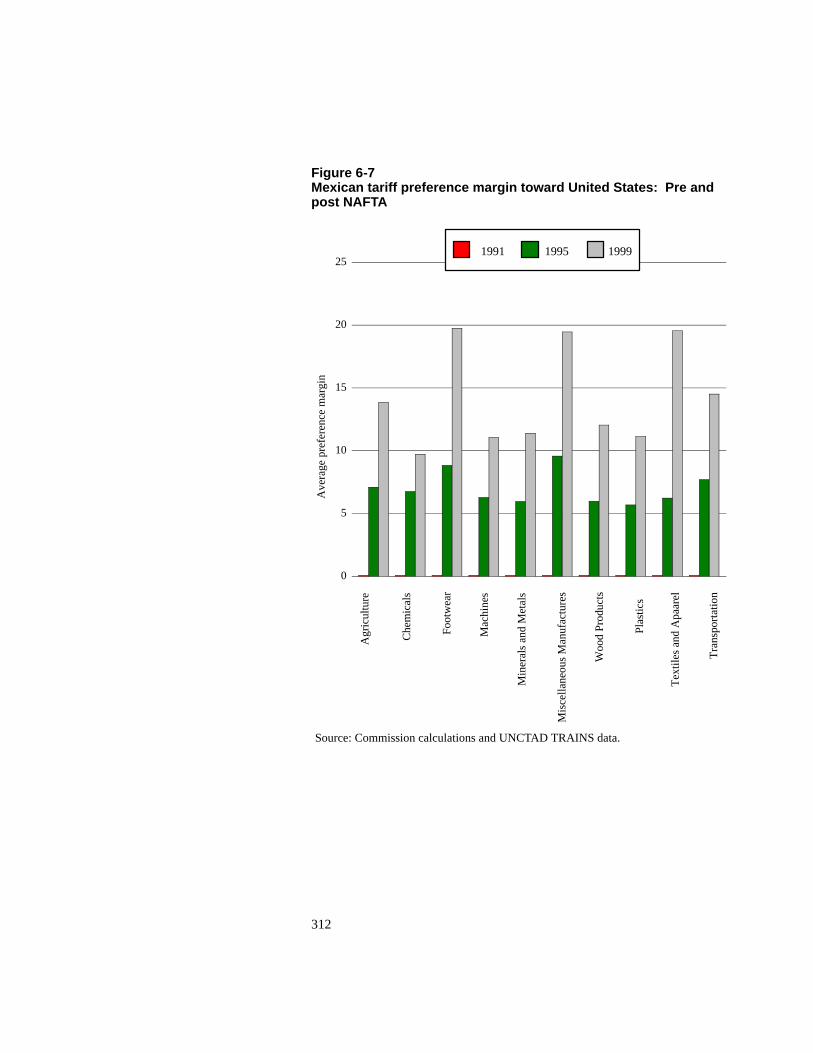
312
Figure 6-7Mexican tariff preference margin toward United States: Pre andpost NAFTA
0
5
10
15
20
25
Source: Commission calculations and UNCTAD TRAINS data.
Ave
rage
pref
eren
cem
argi
n
Agr
icul
ture
Che
mic
als
Foot
wea
r
Mac
hine
s
Min
eral
san
dM
etal
s
Mis
cella
neou
sM
anuf
actu
res
Woo
dPr
oduc
ts
Plas
tics
Tex
tiles
and
Apa
arel
Tra
nspo
rtat
ion
1991 1995 1999
313
Figure 6-8 shows the average U.S. share of Mexico’s imports during thepre- and post-NAFTA periods grouped according to the NAFTA preference in1999. U.S. shares rose in those categories with the larger preferences asMexico shifted its sourcing to its NAFTA neighbor. However, in categorieswhere the preference margins were small, U.S. import shares declined slightly.The data show that initial U.S. shares varied across the categories of tariffprotection, ranging from 60.8 percent for goods afforded a preference greaterthan 20 percent, to 69.3 percent for good with a preference between 5 and 10percent. With the exception of the goods afforded a preference up to andincluding 5 percent, U.S. shares grew across all preference categoriesimmediately after NAFTA came into effect, before declining slightly. By 1999,again with the exception of goods with a preference below and including 5percent, U.S. import shares had fallen below their 1995 levels, but remained ator above their initial levels. U.S. import shares ranged from 58.1 percent foritems with a preference up to and including 5 percent, to 69.2 percent for itemsafforded a preference between 5 percent and 20 percent.
Analytical Framework17
The Commission undertook a statistical analysis of the impact of NAFTAtariff reductions and tariff preferences on U.S. and Mexican trade acrossindustries. Economic theory suggests that preferential trade liberalization, suchas NAFTA, should expand trade between the countries that are part of theagreement. At the sectoral level, preferential liberalization might be expected tosignificantly increase the import shares of partner countries. This study usesconventional statistical techniques to test the impact of NAFTA on importshares across sectors. Three questions are investigated. First, did reductions inU.S. and Mexican tariffs under NAFTA increase import shares significantlyacross industries? Second, did import shares increase more in industries withrelatively larger NAFTA tariff preferences? Third, does the response to NAFTAtariff liberalization differ significantly across industries?
A country’s share of its partner’s imports in any industry is expected to bepredominantly a function of the price of that country’s imports relative to theprice of imports from other countries. Thus, Mexico’s share of US imports willdepend upon the price of Mexican imports relative to imports from othercountries. The same would be true for the United States’ share of Mexico’simports. The prices of imports from any country are made up of four keycomponents: the actual export price of the product, the additional markup dueto transport costs, the tariff applied to that imported good,18 and the exchangerate, which translates the foreign currency price into the partner’s currency.Changes in any of these four components will change relative prices, and thus
16 USITC (1997).17 A detailed technical discussion may be found in Appendix B.

314
Figure 6-8U.S. share of Mexican imports by tariff preference, 1991 and 19991
0
10
20
30
40
50
60
70
80
1 Number above bars indicates the number of HTS 6-digit tariff lines in thatpreference margin group in 2001
Source: Commission calculations and UNCTAD TRAINS data.
U.S
.Ave
rage
impo
rtsh
are
1991 1995 1999
59
508
489 2,265
790
Preference margin (Percent)
<0 >0, <10 >10, <20 >20>0, <5
315
influence a country’s share of its partner’s imports. In order to isolate therole of NAFTA trade preferences on import shares, changes in these otherkey components are incorporated directly into the analysis.
The Commission analysis uses actual data on applied tariff rates throughoutthe period 1989-2001, to capture both the differences in tariff preferencesacross goods and the gradual phase-in of preferences over time under NAFTA.Proxies for export prices from the United States, Mexico and other countriesare included, as well as measures of changes in the peso-dollar exchange rate,and in U.S. and Mexican purchasing power over imports from other sources.Lagged import shares are included to help capture the fact that markets do notalways adjust to policy changes immediately, and that Mexican or U.S. importshares may be historically high or low in some products. The tariff level itselfis also included, since in any given year, regardless of the tariff preference,Mexico or the United States would likely have relatively smaller import sharesin products where they face relatively highly barriers.
Several conclusions from previous studies are also examined. Agama andMcDaniel suggested that U.S. preferences toward Mexico did significantlyraise Mexico’s share of U.S. imports at the aggregate level, and that thesepreferences mattered more after NAFTA than before. In the present study, anexplicit test is conducted to see if the impact of U.S. preferences differs beforeand after NAFTA. Krueger suggested that any significant change in Mexico’sshare of U.S. imports was likely due to the major peso devaluation in late1994, rather than NAFTA. The present study allows a direct comparison of theinfluence of the trade preferences relative to exchange rate changes during thistime period. Krueger also suggests that specific sectors, such as textiles andapparel, may have been significantly impacted by the NAFTA preferences,even if aggregate effects were negligible. The present study estimates theeffects of preferences specifically on Mexican shares of U.S. imports of textilesand apparel, and compares the results to the impact on manufacturing as awhole. A detailed discussion of data sources, definitions, and estimationprocedures can be found in Appendix B.
Results
United StatesTables 6-1 and 6-2 summarize the effect of United States NAFTA tariff
preferences on Mexico’s share of U.S. manufactured imports.19 Table 6-1shows the impact of changes in NAFTA tariff preferences and other key
18 If other non-tariff barriers, such as quotas, also exist on a particular importedproduct, the tariff -equivalent of such barriers must be taken into account to get anaccurate estimate of the increase in price due to all trade barriers.
19 Complete results for the United States are reported in tables B-2 and B-3 inappendix B.
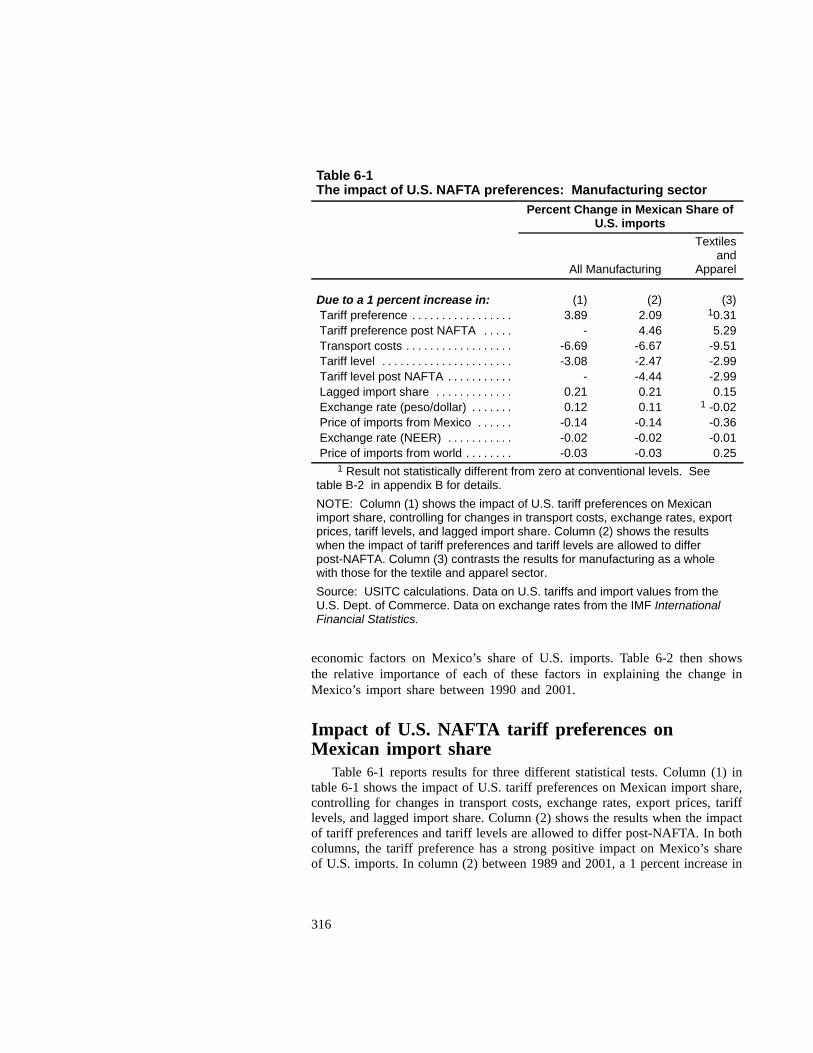
316
Table 6-1The impact of U.S. NAFTA preferences: Manufacturing sector
Percent Change in Mexican Share ofU.S. imports
All Manufacturing
Textilesand
Apparel
Due to a 1 percent increase in: (1) (2) (3)Tariff preference . . . . . . . . . . . . . . . . . 3.89 2.09 10.31Tariff preference post NAFTA . . . . . - 4.46 5.29Transport costs . . . . . . . . . . . . . . . . . . -6.69 -6.67 -9.51Tariff level . . . . . . . . . . . . . . . . . . . . . . -3.08 -2.47 -2.99Tariff level post NAFTA . . . . . . . . . . . - -4.44 -2.99Lagged import share . . . . . . . . . . . . . 0.21 0.21 0.15Exchange rate (peso/dollar) . . . . . . . 0.12 0.11 1 -0.02Price of imports from Mexico . . . . . . -0.14 -0.14 -0.36Exchange rate (NEER) . . . . . . . . . . . -0.02 -0.02 -0.01Price of imports from world . . . . . . . . -0.03 -0.03 0.25
1 Result not statistically different from zero at conventional levels. Seetable B-2 in appendix B for details.
NOTE: Column (1) shows the impact of U.S. tariff preferences on Mexicanimport share, controlling for changes in transport costs, exchange rates, exportprices, tariff levels, and lagged import share. Column (2) shows the resultswhen the impact of tariff preferences and tariff levels are allowed to differpost-NAFTA. Column (3) contrasts the results for manufacturing as a wholewith those for the textile and apparel sector.
Source: USITC calculations. Data on U.S. tariffs and import values from theU.S. Dept. of Commerce. Data on exchange rates from the IMF InternationalFinancial Statistics.
economic factors on Mexico’s share of U.S. imports. Table 6-2 then showsthe relative importance of each of these factors in explaining the change inMexico’s import share between 1990 and 2001.
Impact of U.S. NAFTA tariff preferences onMexican import share
Table 6-1 reports results for three different statistical tests. Column (1) intable 6-1 shows the impact of U.S. tariff preferences on Mexican import share,controlling for changes in transport costs, exchange rates, export prices, tarifflevels, and lagged import share. Column (2) shows the results when the impactof tariff preferences and tariff levels are allowed to differ post-NAFTA. In bothcolumns, the tariff preference has a strong positive impact on Mexico’s shareof U.S. imports. In column (2) between 1989 and 2001, a 1 percent increase in
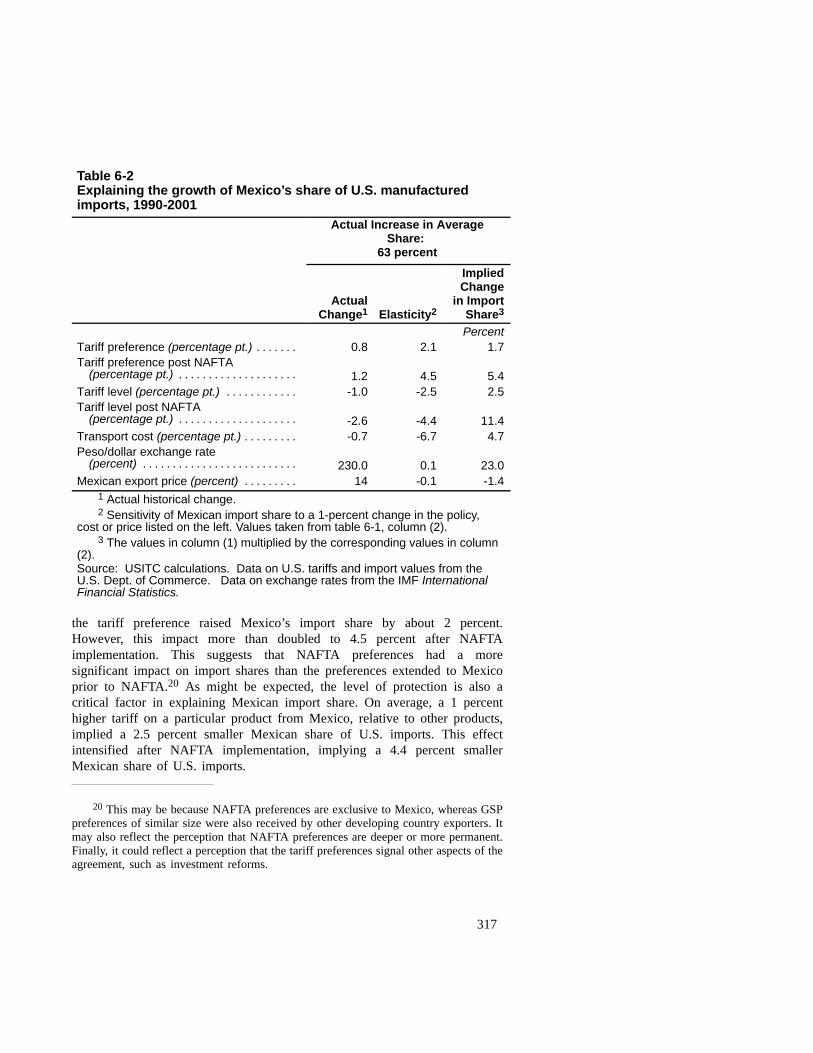
317
Table 6-2Explaining the growth of Mexico’s share of U.S. manufacturedimports, 1990-2001
Actual Increase in AverageShare:
63 percent
ActualChange1 Elasticity2
ImpliedChange
in ImportShare3
PercentTariff preference (percentage pt.) . . . . . . . 0.8 2.1 1.7Tariff preference post NAFTA
(percentage pt.) . . . . . . . . . . . . . . . . . . . . 1.2 4.5 5.4Tariff level (percentage pt.) . . . . . . . . . . . . -1.0 -2.5 2.5Tariff level post NAFTA
(percentage pt.) . . . . . . . . . . . . . . . . . . . . -2.6 -4.4 11.4Transport cost (percentage pt.) . . . . . . . . . -0.7 -6.7 4.7Peso/dollar exchange rate
(percent) . . . . . . . . . . . . . . . . . . . . . . . . . . 230.0 0.1 23.0Mexican export price (percent) . . . . . . . . . 14 -0.1 -1.4
1 Actual historical change.2 Sensitivity of Mexican import share to a 1-percent change in the policy,
cost or price listed on the left. Values taken from table 6-1, column (2).3 The values in column (1) multiplied by the corresponding values in column
(2).Source: USITC calculations. Data on U.S. tariffs and import values from theU.S. Dept. of Commerce. Data on exchange rates from the IMF InternationalFinancial Statistics.
the tariff preference raised Mexico’s import share by about 2 percent.However, this impact more than doubled to 4.5 percent after NAFTAimplementation. This suggests that NAFTA preferences had a moresignificant impact on import shares than the preferences extended to Mexicoprior to NAFTA.20 As might be expected, the level of protection is also acritical factor in explaining Mexican import share. On average, a 1 percenthigher tariff on a particular product from Mexico, relative to other products,implied a 2.5 percent smaller Mexican share of U.S. imports. This effectintensified after NAFTA implementation, implying a 4.4 percent smallerMexican share of U.S. imports.
20 This may be because NAFTA preferences are exclusive to Mexico, whereas GSPpreferences of similar size were also received by other developing country exporters. Itmay also reflect the perception that NAFTA preferences are deeper or more permanent.Finally, it could reflect a perception that the tariff preferences signal other aspects of theagreement, such as investment reforms.
318
Exchange rate changes and export prices are also important determinants ofthe Mexican share of U.S. imports during this time period. A 1-percentdepreciation of the peso against the dollar would imply relatively cheaperMexican imports, and lead to a 0.12-percent increase in Mexico’s import share,while a 1-percent depreciation of the dollar against other trading partnerswould increase Mexico’s import share by 0.02 percent. A 1-percent increase inthe price of imports from Mexico relative to other countries lowered Mexico’sshare of imports by 0.14 percent.21 Finally, the higher the Mexican importshare in the previous year, the higher the Mexican import share in the presentyear.
Because individual industries may respond differently to U.S. tariffpreferences under NAFTA, the scenario shown in column (2) was estimated foran individual industry in which sufficient data were available: textiles andapparel (HTS 11). Column (3) reports the results for the textile and apparelsector. A comparison of columns (2) and (3) shows that Mexican shares of U.S.imports in textiles and apparel are less responsive than manufacturing to tariffpreferences prior to NAFTA, but much more responsive after NAFTA. Thismay be due in part to the presence of quantitative restrictions (QRs) on appareland textile imports which were in place prior to NAFTA, but removed after theagreement was implemented.22 If binding, QRs would limit any response to atariff preference.23 Mexico’s textile and apparel import share is stronglyaffected by the extent of tariff reductions (as is manufacturing), and appearsmore sensitive to changes in the price of Mexican exports and to transportcosts than overall manufacturing. Column (3) thus provides some evidence thatindividual industries may respond differently to trade liberalization.24
21 The impact of changes in competing exporters’ prices is likely to be small, giventhat this is an unweighted average price over all sellers. However, its negative impact isunexpected, and may be due to the fact that Mexico is a small seller of many products,hence Mexican export prices move together with other larger competing exporters’prices. Results for the textile and apparel industries (in aggregate) in column (3) showthe expected positive sign on price of imports from the world.
22 For detailed information on the removal of these QRs under NAFTA, see USITC,The Economic Effects of Significant U.S. Import Restraints, Third Update 2002, USITCPublication No. 3519, June 2002.
23 It would be tempting to test the impact of the NTBs in textiles and apparel byincluding a measure such as the coverage ratio (the percent of tariff lines restricted by theNTB). However, there are several problems with this approach. First, data are not readilyavailable over time prior to NAFTA, so no time variation can be captured. Second, thecoverage ratio does not measure the severity of the restriction, only its scope. Third,since the restrictions are voluntary export restrictions, their severity is likely captured inthe premium exporters can charge for their products in the U.S. market. This premium ispart of the Mexican export price, and as presently calculated, it cannot be separated outof the price variable.
24 Complete results for textiles and apparel are reported in table B-3, appendix B.
319
Importance of U.S. NAFTA tariff preferences forMexico’s import share
The results in table 6-1 show the responsiveness of Mexican shares of U.S.imports to U.S. NAFTA tariff preferences and to changes in other keyeconomic factors. To see the relative importance of NAFTA tradeliberalization, compared to other economic factors, in explaining actual changesin Mexican shares of U.S. manufactured imports, the results from table 6-1must be combined with actual historical changes in tariffs, exchange rates,transport costs, and Mexican export price. This is done in table 6-2.
The average Mexican share of U.S. manufactured imports was 4.5 percentin 1991. This share grew by about 63 percent between 1990 and 2001. Therelative influence of NAFTA trade preferences and peso devaluation can beapproximated by using the values in table 6-2, column (1) and (2). Column (1)shows the actual percentage change in tariff preferences, tariffs levels, transportcosts, Mexican export prices and the peso-dollar exchange rate between 1990and 2001. The largest change during this period was the depreciation of thepeso against the dollar by about 230 percent. Column (2) shows the sensitivityof the Mexican import share to a 1 percent change in each economic factor(from table 6-1, column (2)). Multiplying the value in column (2) by 230.0percent suggests that the actual depreciation of the peso raised Mexico’saverage share of U.S. imports by about 23.0 percent. This is recorded incolumn (3). Peso depreciation thus accounts for about one-third of the growthin Mexico’s average import share.
Table 6-2 also shows that the impact of U.S. tariff preferences and tariffreductions had a large impact on Mexico’s share of U.S. imports. The averageU.S. tariff preference toward Mexico grew by 0.8 percentage points (prior toNAFTA), and by 1.2 percentage points after NAFTA. Again, column (2) showsthe sensitivity of the Mexican import share to a 1-percent change in thesepolicy variables. Multiplying the values in column (1) by those in column (2)suggests that larger U.S. tariff preference raised Mexico’s import share by 1.7percent prior to NAFTA, and by 5.4 percent after NAFTA (column (3)). Theaverage U.S. tariff on Mexican manufactured goods fell by 1 percentage pointprior to NAFTA, and by 2.6 percentage points after NAFTA took effect. Again,multiplying the values in column (1) by those in column (2), the drop in U.S.average tariffs against Mexico raised Mexico’s import share by 2.5 percentprior to NAFTA, and by 11.4 percent after NAFTA (column (3)). Adding thefirst four numbers in column (3) suggests that overall trade liberalizationtoward Mexico between 1990 and 2001 led to a 21 percent increase inMexico’s average share of U.S. imports. Thus, overall trade liberalizationtoward Mexico accounted for about one-third of the growth in Mexico’saverage import share.
320
MexicoTables 6-3 and 6-4 summarize the impact of Mexican NAFTA tariff
preferences on the U.S. share of Mexican manufactured imports.25 Table 6-3shows the impact of changes in NAFTA tariff preferences and other keyeconomic factors on the U.S. import share. Table 6-4 then shows the relativeimportance of each of these factors in explaining the change in the U.S. importshare between 1991 and 1999.26
Impact of Mexican NAFTA tariff preferences onU.S. import share
Table 6-3 shows that Mexican NAFTA preferences had a strong positiveimpact on U.S. shares of Mexican imports. Column (1) shows the impact ofMexican tariff preferences on U.S. import share, controlling for changes inexchange rates. Column (2) shows the results when the 1991 tariff level and1991 import share are included. In column (1) a 1-percent increase in the tariffpreference extended to the United States increased the U.S. share of Mexicanimports by 0.37 percent. This result is independent of the changes in theexchange rate, which also had a significant impact. A 1-percent depreciation ofthe peso against the dollar decreased Mexican imports from the United Statesby 0.06 percent. At the same time, a 1-percent real depreciation of the pesoagainst all trading partners, currencies would lead to a 0.002-percent increasein the U.S. share of Mexican imports.
Column (2) shows the importance of historical factors in influencing theU.S. share of Mexican imports. If a U.S. product faced a 1-percent higherMexican tariff in 1991 relative to other U.S. products, the U.S. share of importsof that product would be 0.84 percent lower in the future relative to other U.S.products. Products in which the U.S. share of Mexican imports was high in1991 had a larger U.S. share after NAFTA. A 1-percent higher U.S. share in1991 led to a 0.49 percent higher U.S. share post-NAFTA. Column (2) alsoshows that after controlling for these historical influences, the impact of theMexican tariff preferences on U.S. import share is larger. Now, a 1-percenthigher Mexican tariff preference toward the United States raises the U.S.import share by 0.44 percent.
25 Complete results for Mexico are reported in tables B-4 in appendix B.26 Limitations in the availability of Mexican tariff data, especially prior to NAFTA,
meant that only 3 years of data–for 1992, 1995, and 1999–could be used in the statisticaltests. The nonconsecutive nature of the data means that lagged effects cannot beincluded. In addition, all Mexican import data are c.i.f. value, and thus, unit values andtransport costs cannot be calculated.
321
Importance of Mexican NAFTA tariff preferencesfor U.S. import share
The results in table 6-3 show the responsiveness of U.S. shares of Mexicanimports to Mexican NAFTA tariff preferences and to changes in other keyeconomic factors. Again, to see the relative importance of NAFTA tradeliberalization, compared to other economic factors, in explaining actual changesin U.S. shares of Mexican manufactured imports, the results from table 6-3must be combined with actual historical changes in tariff preferences andexchange rates. This is done in table 6-4.
The average U.S. share of Mexican manufactured imports was about 64.6percent in 1991. By 1999, this average share had grown by about 2.5 percent.The relative influence of NAFTA trade preferences and peso devaluation canbe approximated by using the values in table 6-4, columns (1) and (2). Column(1) shows the actual percentage point change in tariff preferences, the tariffslevel, and the peso-dollar exchange rate, between 1990 and 2001. The degreeof Mexican trade liberalization was large during this period. Tariffs against theUnited States fell by about 10 percentage points on average, and preferencesrose from zero in 1991 to 12.2 percent in 1999. Column (2) shows thesensitivity of U.S. import share to a 1-percent change in these policies.Multiplying the values in column (2) by those in column (1) suggests thatlarger Mexican tariff reductions increased the U.S. import share by 8.4 percent,while larger tariff preferences increased the U.S. import share by 5.3 percent.These are recorded in column (3). Adding the first two values in column (3)indicates that overall Mexican trade liberalization between 1991 and 1999raised the average U.S. share of Mexican imports by about 13.7 percent.Clearly the 230 percent depreciation of the peso counteracted this increase.Again multiplying 230 percent by the corresponding value in column (2)suggests that the depreciation of the peso against the dollar led to an 11.5percent drop in the average U.S. share of Mexican imports. These resultssuggest that the overall small growth in U.S. share of Mexican imports was notdue to insensitivity to trade liberalization, but due to the counteracting forces oftrade liberalization and peso devaluation.
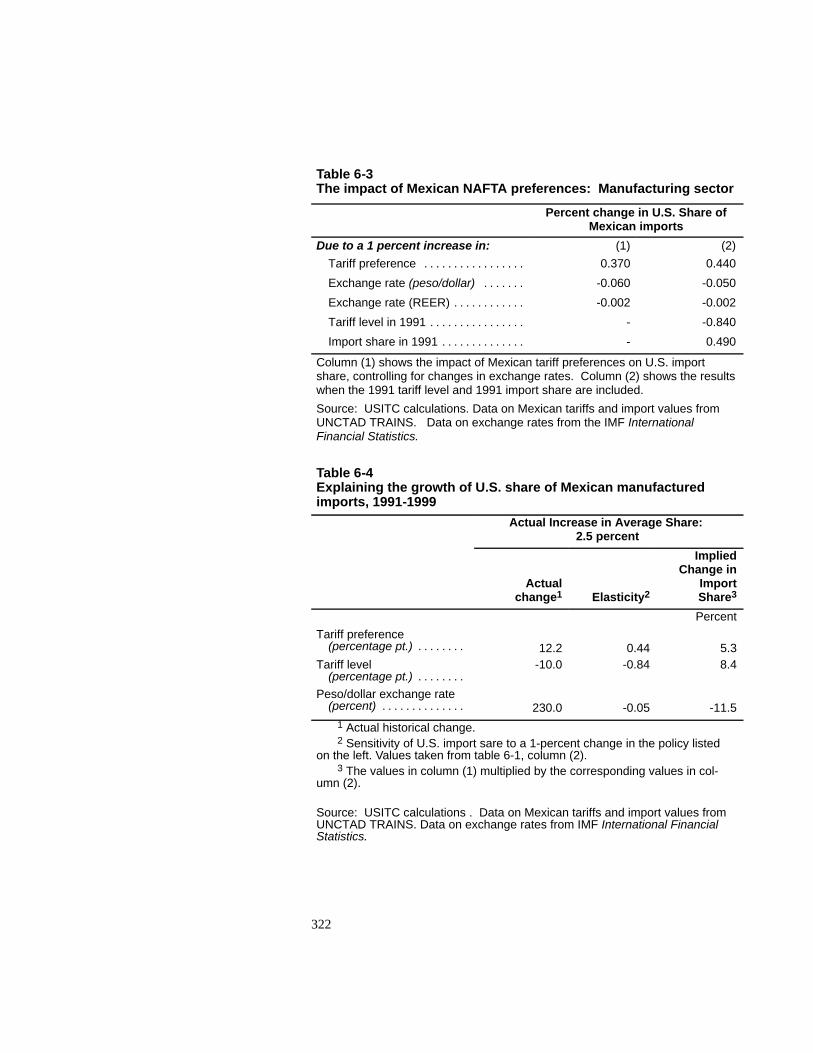
322
Table 6-3The impact of Mexican NAFTA preferences: Manufacturing sector
Percent change in U.S. Share ofMexican imports
Due to a 1 percent increase in: (1) (2)Tariff preference . . . . . . . . . . . . . . . . . 0.370 0.440
Exchange rate (peso/dollar) . . . . . . . -0.060 -0.050
Exchange rate (REER) . . . . . . . . . . . . -0.002 -0.002
Tariff level in 1991 . . . . . . . . . . . . . . . . - -0.840
Import share in 1991 . . . . . . . . . . . . . . - 0.490
Column (1) shows the impact of Mexican tariff preferences on U.S. importshare, controlling for changes in exchange rates. Column (2) shows the resultswhen the 1991 tariff level and 1991 import share are included.
Source: USITC calculations. Data on Mexican tariffs and import values fromUNCTAD TRAINS. Data on exchange rates from the IMF InternationalFinancial Statistics.
Table 6-4Explaining the growth of U.S. share of Mexican manufacturedimports, 1991-1999
Actual Increase in Average Share:2.5 percent
Actualchange1 Elasticity2
ImpliedChange in
ImportShare3
PercentTariff preference
(percentage pt.) . . . . . . . . 12.2 0.44 5.3Tariff level
(percentage pt.) . . . . . . . .-10.0 -0.84 8.4
Peso/dollar exchange rate(percent) . . . . . . . . . . . . . . 230.0 -0.05 -11.5
1 Actual historical change.2 Sensitivity of U.S. import sare to a 1-percent change in the policy listed
on the left. Values taken from table 6-1, column (2).3 The values in column (1) multiplied by the corresponding values in col-
umn (2).
Source: USITC calculations . Data on Mexican tariffs and import values fromUNCTAD TRAINS. Data on exchange rates from IMF International FinancialStatistics.
323
ConclusionThe Commission results suggest that tariff reductions and tariff preferences
did have a significant impact on Mexican shares of U.S. manufactured goodsimports between 1990 and 2001. From an initial average level of about 5percent, Mexican shares of U.S. imports grew, on average, by about 63 percent.Of this, roughly one-third could be attributed to tariff reductions and tariffpreferences. Another third could be attributed to the appreciation of the dollarrelative to the peso. Tariff reductions and tariff preferences had a significantlylarger effect after NAFTA relative to the period as a whole. Estimates for thetextile and apparel industry showed an even stronger response to tradeliberalization and tariff preferences, suggesting that there may be differences inresponsiveness to NAFTA trade liberalization across individual industries.
The Commission results indicate that both tariff reductions and tariffpreferences had a significant impact on U.S. shares of Mexican manufacturedgoods imports between 1991 and 1999. The average U.S. share of Mexicanimports began at about 65 percent and grew by about 2.5 percent. Though thisexpansion was small on net, Mexican trade liberalization toward the UnitedStates would have implied an expansion of about 13 percent. However, thisexpansion was nearly completely offset by the depreciation of the peso againstthe dollar.

325
CHAPTER 7:Comparative Simulations of the
Economywide Effects of the FiveTrade Agreements Negotiated
Under Fast-Track Authority
OverviewThis chapter provides a consistent structural analysis of the five trade
agreements negotiated under fast-track authority. The analysis uses timeappropriate data on trade and overall economic conditions to quantify thedifference between the economy as observed under liberalization (thebenchmark) and the simulated economy in the absence of liberalization. Fortransparency, and to highlight the relative impacts of each agreement, thesimulation model captures the imposition of those specific, quantifiabledistortions1 that were explicitly eliminated under the agreements.2 The modelcaptures only those changes that arise as a result of relative price changes.3 The
1 A distortion in this context refers to any policy instrument that causes a change tothe market-clearing price and quantity. One definition of distortion in this context is“[a]ny departure from the ideal of perfect competition that interferes with economicagents maximizing social welfare when they maximize their own. [It] Includes taxes andsubsidies, tariffs and nontariff barriers, externalities, incomplete information, andimperfect competition.” (Alan V. Deardorff, Deardorff’s Glossary of InternationalEconomics, found at http://www-personal.umich.edu/~alandear/glossary/, downloadedJune 8, 2003) This study explicitly considers only ad valorem tariffs and quantityrestraints on trade. However, these distortions interact with other distortions implicit inthe model, including domestic tax policy.
2 Some portions of the agreements were not in force at the time of the study(2002-2003), and therefore, were not included as a part of the simulation analysis. Someimportant examples of scheduled liberalizations that are not considered here include thefinal phase out of textile and apparel quotas under the Agreement on Textiles andClothing (a part of the Uruguay Round) on Jan. 1, 2005; and the scheduled eliminationunder NAFTA of restrictions on imports of sugar and other agricultural productsoriginating from Mexico.
3 The model only considers the effect on relative prices of the quantifiable tradedistortions (that is, tariffs and those non-tariff barriers that have been quantified inpublicly available sources) removed by the agreements. Unquantified policy changes,
326
purpose of the simulations is to provide a consistent and widely acceptableframework for assessing the relative impacts of the direct liberalizationembodied in each agreement using verifiable, publicly available data.
The simulations discussed below suggest that of the five agreementsanalyzed, the two multilateral agreements – the Tokyo Round and the UruguayRound4 – had the greatest impact on welfare. The welfare impact of the otheragreements rose with the intensity of the pre--existing trading relationship andthe magnitude of tariff cuts. NAFTA ranks as the most important, followed bythe U.S--Canada FTA and the U.S.--Israel FTA. Had the United States notentered into the five agreements, the model suggests that welfare would havebeen lower by approximately 0.6 percent of real income in 2001.
The estimated impacts produced in the simulations here are conservativefrom a quantitative and a theoretical perspective. The trade policy changesconsidered in the analysis are only those that have been quantified in publiclyavailable sources (i.e. tariff and selected non--tariff barriers). The model onlyconsiders the effects of relative price changes attributable to trade policychanges. As has been discussed throughout this report, trade policy mightplausibly be linked to increasing scale economies or higher productivity levels.Because the evidence for these effects is somewhat mixed, this exercise doesnot attribute changes in productivity levels or in firm scale to changes in tradepolicy. Models that allow for increased scale economies and productivityeffects from trade liberalization generally suggest larger welfare gains fromliberalization.5 In chapter 8, we present a model where consumers valueproduct variety and trade policy induces changes in product variety. In thischapter, however, no such changes occur to welfare through this mechanism.
3—Continuedsuch as agreements on trade in services in the Uruguay Round, are not included.Therefore, the model likely understates the effect of the agreements on relative prices.By limiting its analysis to the effect of relative price changes, the model does not takeinto account economic impacts that may go beyond relative price change. For example,trade agreements may have increased product variety, an effect discussed in chapter 8.
4 Data requirements limit the analysis to the years 1978-2001. Two of theagreements, the Uruguay Round and NAFTA, had not been fully implemented by 2001.For example, the Agreement on Textiles and Clothing, a part of the Uruguay Round, wasnot fully implemented in 2001. The modeled effects of these agreements would havebeen are relatively larger had these agreements been fully implemented by 2001.
5 Thomas F. Rutherford and David G. Tarr (“Trade Liberalization, Product Varietyand Growth in a Small Open Economy: A Quantitative Assessment,” Journal ofInternational Economics, vol. 56, pp. 247-272, 2002) contrast the welfare effects of tradeliberalization obtained in standard (constant-returns-to-scale) models and their model,which includes scale economies. Rutherford and Tarr find welfare impacts manymultiples higher than those obtained in standard models.
327
ApproachThe tool used to analyze the economy in the absence of liberalization is a
numeric or computable general equilibrium model calibrated to the observedtrade flows, and macro-- and microeconomic conditions of the U.S. economyover the historical period from 1978 to 2001.6 The numeric model is amathematical representation of the economy, simulating the interaction ofproducers and consumers where each agent maximizes its own welfare subjectto resource endowments and market prices. Resource and technologicalconstraints interact with trade barriers to determine overall welfare. For thisexercise resource endowments and technologies are held constant across thepolicy simulations. Doing so allows for an experiment that completely controlsfor shocks that are contemporaneously correlated with policy changes. Onlythose impacts that are specifically (structurally) attributed to policy appear inthe simulation. Thus, the technique employed here is more akin to the ex antestudies reviewed in chapter 4, but it is applied in an ex post analysis of theagreements.
The motivation for using an ex ante technique for assessing pastagreements is to isolate the economywide impact of the policy of interest.Other sources of U.S. economic change, apart from the agreements andincluding those identified in chapter 4, make it difficult to isolate the effects oftrade policy changes in an economy--wide context. Ex post analysis typicallyexplores statistical relationships between trade policy changes and economicoutcomes. While it is often possible to isolate effects on individual sectorsfacing liberalization, indirect effects are usually too difficult to isolate fromother changes occurring in the economy. It is especially difficult to trace theeffects of trade policy changes on one sector, such as apparel and other textileproducts, onto other sectors, such as retail trade. The simulations presentedhere rely on a particular theoretical structure of economic behavior to provide aframework for passing the effects of trade policy changes onto the broadereconomy.7 Employing such a framework is important, because sectors mostdirectly affected by liberalization (goods sectors) account for a relatively smallshare of national output, and the much larger service sectors are often affectedindirectly.
In the simulation model, each year in the past represents a staticequilibrium in which all resource and technological relationships are calibratedto a best estimate of the historical baseline. Yearly calibration directlyaccommodates changes in population, productivity and tastes over time, as well
6 Appendix C of this report includes a technical description of the model used for thesimulations that appear in this chapter. Details of the data and construction of the socialaccounts can be found in Edward J. Balistreri and Alan K. Fox, “TSCAPE: A TimeSeries of Consistent Accounts for Policy Evaluation,” USITC Working Paper 2003-5-A,2003.
7 For more details on model structure, see appendix C.
328
as macroeconomic phenomena related to business cycles. The realized tariffreductions and phase--in periods embodied in each agreement are also directlyaccommodated in the baseline calibration. The baseline equilibrium for theU.S. economy replicates the historical series on real 1996 dollar merchandisetrade flows with specific trade partners covered by the agreements and theworld as a whole. The baseline also replicates aggregate income and otherspecific series from the National Income and Products Accounts (NIPA)published in the annual Economic Report of the President. Productiontechnologies are determined by using the detailed benchmark input--outputaccounts published every five years by the Bureau of Economic Analysis ofthe U.S. Department of Commerce (USDOC).
The model depends on a set of response parameters as well as on thecalibrated baseline data. These parameters establish the model’s behavioralresponses to price changes. A key response parameter governing model resultsis the elasticity of substitution between domestic and foreign varieties of agiven commodity. Estimates of these parameters are taken from econometricliterature on international trade.8 A back--of--the--envelope calculation indicatesthat an average trade elasticity of about 5, combined with the trade--weightedaverage tariff reduction for all agreements of 3 percentage points (calculated inchapter 3 of this report) might be expected to yield about a 15 percent increasein trade flows. In comparison, the simulation results below showed about a 12percent change in trade flows.9 Other important response relationships aredictated by other elasticities. For example, consumers in the model are assumedto make decisions based on Cobb--Douglas10 preferences. Firms substitutebetween capital and labor according to a Cobb--Douglas technology, but useintermediate inputs in fixed proportions to the value--added composite.
With the benchmark and response parameters established, the model cansimulate a counterfactual equilibrium in which tariff and other concessions
8 David Hummels, Purdue University, uses U.S. data on trade and trade costs toestimate the degree to which trade flows change with changes in trade costs. Thesimulation model uses Hummels’ estimates, at the 1-digit level, to map trade-policychanges into trade-flow changes. The 1-digit estimates were obtained through personalcorrespondence with David Hummels. The estimation methodology can be found inDavid Hummels’ paper, “Toward a Geography of Trade Costs” (mimeo, PurdueUniversity, 2000).
9 The difference between the back-of-the-envelope calculation and the structuralmodel simulation might generally be attributed to the complexity of the modeledeconomy and more realistic characterization of the actual policies. For example, theback-of-the-envelope calculation does not track the imports diverted from rest-of-worldimports to imports from a free-trade agreement partner. This and other complexities mayact to mitigate the overall trade response. Model-based calculations are more reliablebecause they can explicitly account for such complexities.
10 In a Cobb-Douglas formulation, the budget shares devoted to each good remainconstant.
329
embodied in the trade agreements are not eliminated. The generalmethodology for implementing counterfactual U.S. import policy is to adoptthe rate of protection (using calculated duties) in the year prior to theenforcement of the agreement. The removal of partner--country concessions isalso incorporated to reflect the overall impact of the agreement on tradeprices.11 The counterfactual simulations should be interpreted as “but for” theagreement. In the but--for economy, U.S. trade barriers increase and pricesreceived by U.S. exporters fall. The net result of not entering the tradeagreements is restricted trade. Unlike traditional ex post analyses, this ismore an assumption than an empirical result. Essentially, the simulationmodel aids in the quantification of this assumption and permits the rankingof the relative importance of the different agreements.
Simulation scenarios were designed to take advantage of data on collectedduties and minimize qualitative assessments of what the world would havelooked like under a set of hypothetical circumstances. With only data on duties,for example, it is not possible to establish what concessions the United States’free--trade agreement partners might have made under the Uruguay Round butin the absence of the U.S. trade agreement. The liberalizations were thuscumulatively removed from the point of view of the year prior to enforcement.This approach allowed for an analysis of the marginal effect of eachagreement, as well as the aggregate effect of all agreements that follow aparticular agreement. The central scenarios are:
1. But--for: Uruguay Round
2. But--for: Uruguay Round and NAFTA12
3. But--for: Uruguay Round, NAFTA, and U.S.--Canada FTA
11 A number of different sources were used to establish the changes in export pricesthat might be attributed to each agreement. J. Michael Finger, Merlinda D. Ingco, andUlrich Reincke, The Uruguay Round: Statistics on Tariff Concessions Given andReceived, (World Bank: Washington D.C., 1996) was used to establish the concessionsreceived by the United States under the Uruguay Round. For NAFTA and theU.S.-Canada FTA direct duty data was obtained from the TRAINS database published bythe United Nations Conference on Trade and Development. Bernard D. Reams Jr., TheTrade Agreements Program of the United States: Annual Reports of the President1957-1985: Volume 3, (Buffalo, New York: William S. Hein and Co., Inc., 1989), wasused to establish the concessions received by the United States under the Tokyo Round.Although there was a lack of data on concessions received by U.S. exporters to Israel, anassumption was made that export prices to Israel increased by 3 percent under theU.S.-Israel FTA.
12 The policy changes linked to NAFTA in the exercise are only changes in Mexicanpolicy and changes in U.S. policy toward Mexico. Canadian policy changes and U.S.policy changes toward Canada are attributed to the U.S.-Canada FTA.
330
4. But--for: Uruguay Round, NAFTA, U.S.--Canada FTA, and U.S.--IsraelFTA
5. But--for: Uruguay Round, NAFTA, U.S.--Canada FTA, U.S.--IsraelFTA, and Tokyo Round.
In the first scenario, trade barriers were set for all future years beyond 1994at a level consistent with the tariffs and nontariff barriers measured in 1994, theyear prior to enforcement of the Uruguay Round. Trade barriers for U.S.free--trade agreement partners remained at their baseline values; U.S.--Mexicotariffs are implicitly unaffected by the removal of the Uruguay Round. Thisscenario simulated the but--for Uruguay Agreement equilibrium. The secondscenario included the but--for Uruguay Round changes in barriers and addedthe changes to the set of trade barriers between the United States and Mexicoremoved in response to NAFTA. Trade barriers between the United States andMexico were set for all future years beyond 1993 at a level consistent with thebarriers between the United States and Mexico measured in 1993, the yearbefore NAFTA came into force. The second scenario simulated the but--forNAFTA and Uruguay equilibrium.
Similarly, subsequent scenarios compounded the impacts of suppressing theliberalization of the next previous agreement. For example, the third scenarioincluded all the changes in barriers from scenario 2 and added the changes tothe set of trade barriers between the United States and Canada removed inresponse to the U.S.--Canada FTA. Trade barriers between the United Statesand Canada were set, for all subsequent years beyond 1988, at a levelconsistent with the observed barriers between the United States and Canada in1988, the year before the Canadian agreement went into force. Thisstep--by--step unwinding of trade agreements facilitates analysis of theaggregate and marginal impacts of the agreements. This approach avoidsmaking arbitrary assumptions about what concessions the United States mighthave received during later negotiations had prior agreements not occurred. Thatis, no judgment is made about the form the Uruguay Round might have takenhad NAFTA never been implemented.
Principal FindingWithin the simulation model the most relevant summary measure of the
economywide effects of the trade agreements is the simulated change inwelfare, as measured by the money--metric equivalent variation. Change inwelfare measures the income loss in 1996 dollars equivalent to eliminating theliberalizations embodied in the agreements. Figure 7--1 shows the welfarechanges attributed to each scenario. In 2001, for example, the annual welfareloss attributed to the but--for--Uruguay scenario (the removal of the UruguayRound tariff cuts) was approximately $20 billion in 1996 dollars. In thebut--for--all--agreements scenario the loss was more than $56 billion in 1996dollars, approximately 0.6 percent of real income in 2001. The annual welfare
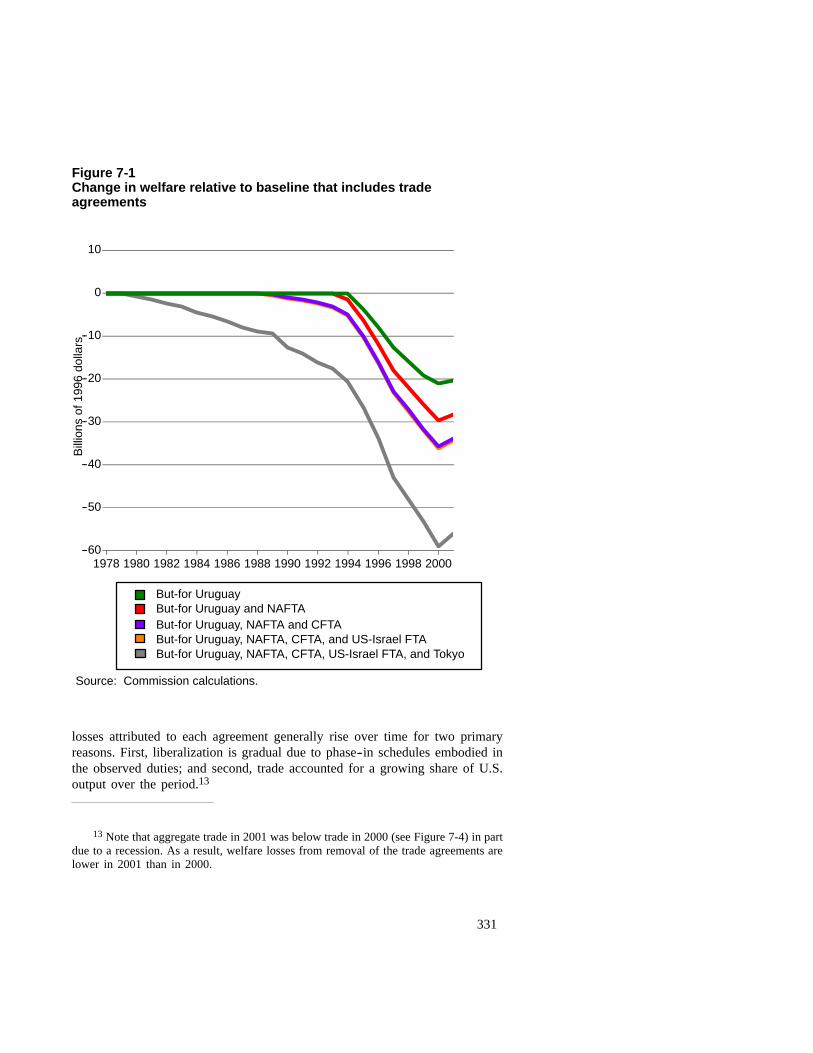
331
Figure 7-1Change in welfare relative to baseline that includes tradeagreements
--60
--50
--40
--30
--20
--10
0
10
1978 1980 1982 1984 1986 1988 1990 1992 1994 1996 1998 2000
Source: Commission calculations.
Bill
ions
of19
96do
llars
But-for UruguayBut-for Uruguay and NAFTABut-for Uruguay, NAFTA and CFTABut-for Uruguay, NAFTA, CFTA, and US-Israel FTABut-for Uruguay, NAFTA, CFTA, US-Israel FTA, and Tokyo
losses attributed to each agreement generally rise over time for two primaryreasons. First, liberalization is gradual due to phase--in schedules embodied inthe observed duties; and second, trade accounted for a growing share of U.S.output over the period.13
13 Note that aggregate trade in 2001 was below trade in 2000 (see Figure 7-4) in partdue to a recession. As a result, welfare losses from removal of the trade agreements arelower in 2001 than in 2000.
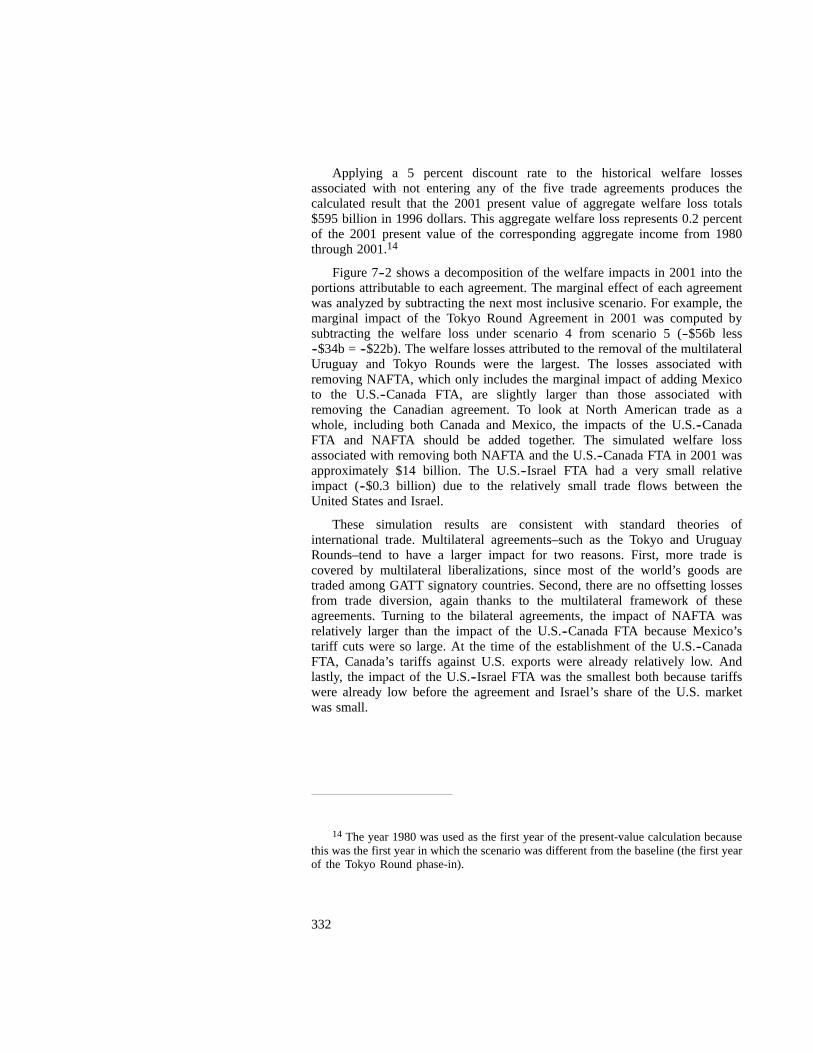
332
Applying a 5 percent discount rate to the historical welfare lossesassociated with not entering any of the five trade agreements produces thecalculated result that the 2001 present value of aggregate welfare loss totals$595 billion in 1996 dollars. This aggregate welfare loss represents 0.2 percentof the 2001 present value of the corresponding aggregate income from 1980through 2001.14
Figure 7--2 shows a decomposition of the welfare impacts in 2001 into theportions attributable to each agreement. The marginal effect of each agreementwas analyzed by subtracting the next most inclusive scenario. For example, themarginal impact of the Tokyo Round Agreement in 2001 was computed bysubtracting the welfare loss under scenario 4 from scenario 5 (--$56b less--$34b = --$22b). The welfare losses attributed to the removal of the multilateralUruguay and Tokyo Rounds were the largest. The losses associated withremoving NAFTA, which only includes the marginal impact of adding Mexicoto the U.S.--Canada FTA, are slightly larger than those associated withremoving the Canadian agreement. To look at North American trade as awhole, including both Canada and Mexico, the impacts of the U.S.--CanadaFTA and NAFTA should be added together. The simulated welfare lossassociated with removing both NAFTA and the U.S.--Canada FTA in 2001 wasapproximately $14 billion. The U.S.--Israel FTA had a very small relativeimpact (--$0.3 billion) due to the relatively small trade flows between theUnited States and Israel.
These simulation results are consistent with standard theories ofinternational trade. Multilateral agreements–such as the Tokyo and UruguayRounds–tend to have a larger impact for two reasons. First, more trade iscovered by multilateral liberalizations, since most of the world’s goods aretraded among GATT signatory countries. Second, there are no offsetting lossesfrom trade diversion, again thanks to the multilateral framework of theseagreements. Turning to the bilateral agreements, the impact of NAFTA wasrelatively larger than the impact of the U.S.--Canada FTA because Mexico’stariff cuts were so large. At the time of the establishment of the U.S.--CanadaFTA, Canada’s tariffs against U.S. exports were already relatively low. Andlastly, the impact of the U.S.--Israel FTA was the smallest both because tariffswere already low before the agreement and Israel’s share of the U.S. marketwas small.
14 The year 1980 was used as the first year of the present-value calculation becausethis was the first year in which the scenario was different from the baseline (the first yearof the Tokyo Round phase-in).
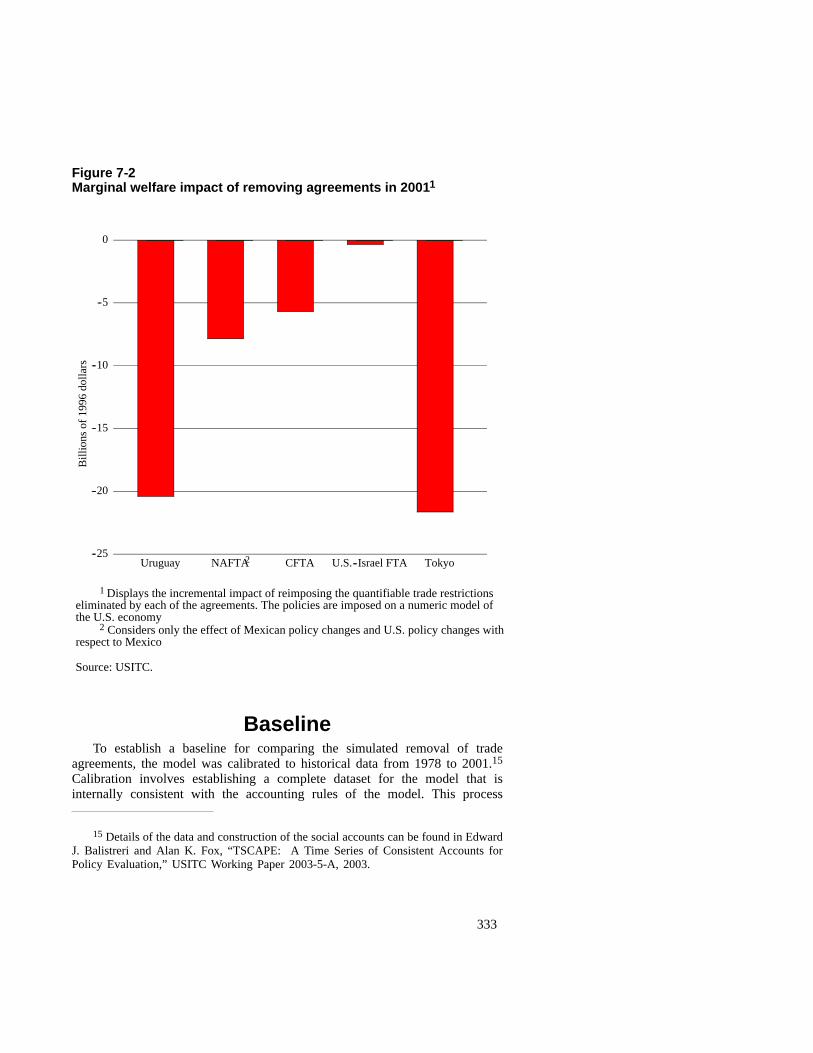
333
Figure 7-2Marginal welfare impact of removing agreements in 20011
--25
--20
--15
--10
--5
0
Uruguay NAFTA CFTA U.S.--Israel FTA Tokyo
Source: USITC.
Bill
ions
of19
96do
llars
1 Displays the incremental impact of reimposing the quantifiable trade restrictionseliminated by each of the agreements. The policies are imposed on a numeric model ofthe U.S. economy
2 Considers only the effect of Mexican policy changes and U.S. policy changes withrespect to Mexico
2
BaselineTo establish a baseline for comparing the simulated removal of trade
agreements, the model was calibrated to historical data from 1978 to 2001.15
Calibration involves establishing a complete dataset for the model that isinternally consistent with the accounting rules of the model. This process
15 Details of the data and construction of the social accounts can be found in EdwardJ. Balistreri and Alan K. Fox, “TSCAPE: A Time Series of Consistent Accounts forPolicy Evaluation,” USITC Working Paper 2003-5-A, 2003.
334
imposes a set of consistency conditions that will generally fail whencombining unadjusted data from different sources. Priority was thereforegiven to maintaining the integrity of data from certain sources. For example,the aggregate NIPA series on real GDP, published in the annual EconomicReport of the President, is reproduced in the baseline model run. Figure 7--3presents these data in a chart. The baseline data are useful for putting thescenario results in the context of the overall size of the U.S. economy. Figure7--3 also decomposes GDP into its labor and other--value--added components.Labor’s value share of GDP over the series averages about 58 percent.Other--value--added includes payments to property type income, and indirectbusiness taxes and non--tax liabilities.
The integrity of the merchandise trade flows and duty payments is alsomaintained in the calibration process because of the focus of analysis ondetailed changes to international trade policy. These current--dollarcustoms--level series are aggregated and converted into real 1996 dollars.Combining the information from the NIPA totals and the detailed benchmarkinput--output tables determined the nonmerchandise trade flows. Figure 7--4presents aggregate real imports and real exports that are generated in thebaseline equilibrium.
Trade has become a much larger component of the U.S. economy over thebaseline period. In 1978, imports were 7 percent of GDP, growing to 16percent of GDP in 2001. In 1978, exports were 6 percent of GDP; by 2001they had risen to 12 percent. The dramatic relative growth in baseline trade isimportant as a point of context for the scenario results. Clearly, some of thetrade growth is directly attributable to the trade agreements under analysis here,but much of it cannot be directly linked to the measured changes in barriers. Ifthe growth is not attributed to the changes in tariff and nontariff barriersembodied in the agreements, the baseline indicates significant structuralchange. Figure 7--5 illustrates the relative trade growth by convertingreal--baseline GDP, imports and exports into quantity indices normalized ontheir respective 1978 levels.
Detailed ResultsFigure 7--6 shows changes in imports and illustrates the aggregate impacts
that the agreements had on trade volumes. The aggregate change in exportswill be the same, evaluated at world prices, because of the trade balanceconstraint (no change in baseline balance--of--payments position). Theagreements signed under trade promotion authority had a substantial impact ontrade volumes. Under scenario 5, in which all agreements are removed, 2001imports (and exports) are $178 billion less than the levels that were observed in2001. As with the welfare results, the greatest trade impacts were attributed tothe multilateral Tokyo and Uruguay Agreements. The North Americanagreements also had significant impacts on trade volumes, whereas theU.S.--Israel FTA had very little impact on aggregate trade.
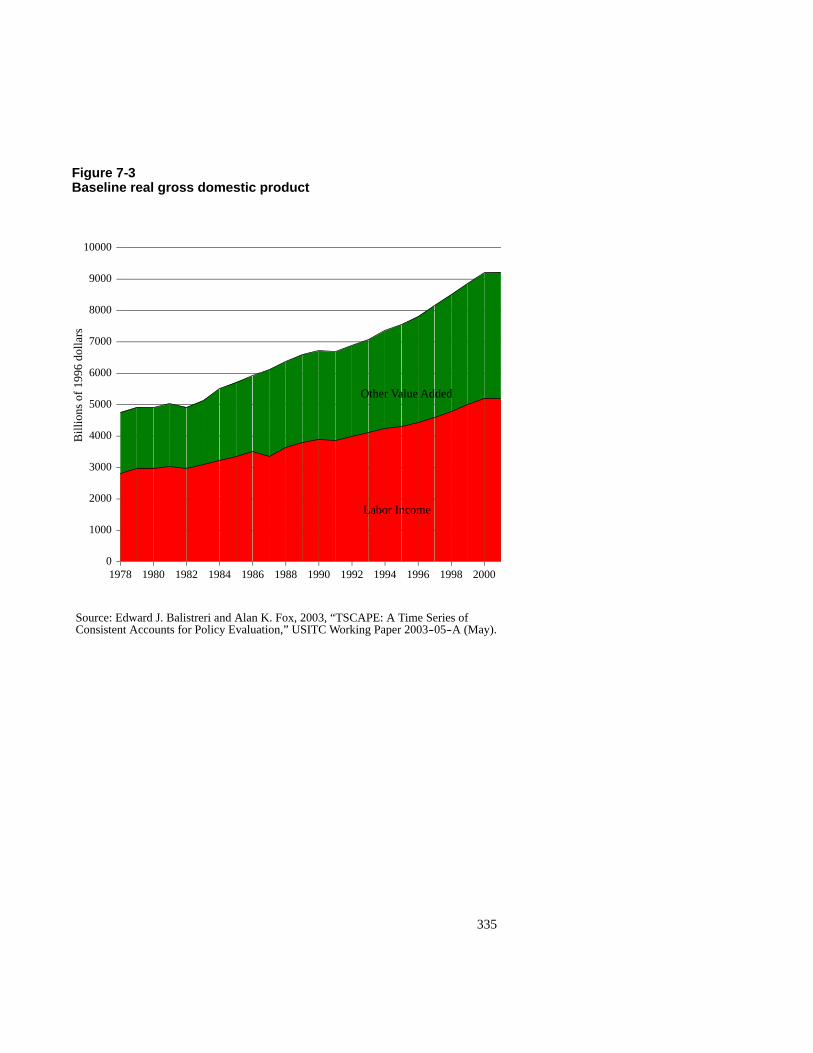
335
Figure 7-3Baseline real gross domestic product
0
1000
2000
3000
4000
5000
6000
7000
8000
9000
10000
1978 1980 1982 1984 1986 1988 1990 1992 1994 1996 1998 2000
Source: Edward J. Balistreri and Alan K. Fox, 2003, “TSCAPE: A Time Series ofConsistent Accounts for Policy Evaluation,” USITC Working Paper 2003--05--A (May).
Other Value Added
Labor Income
Bill
ions
of19
96do
llars
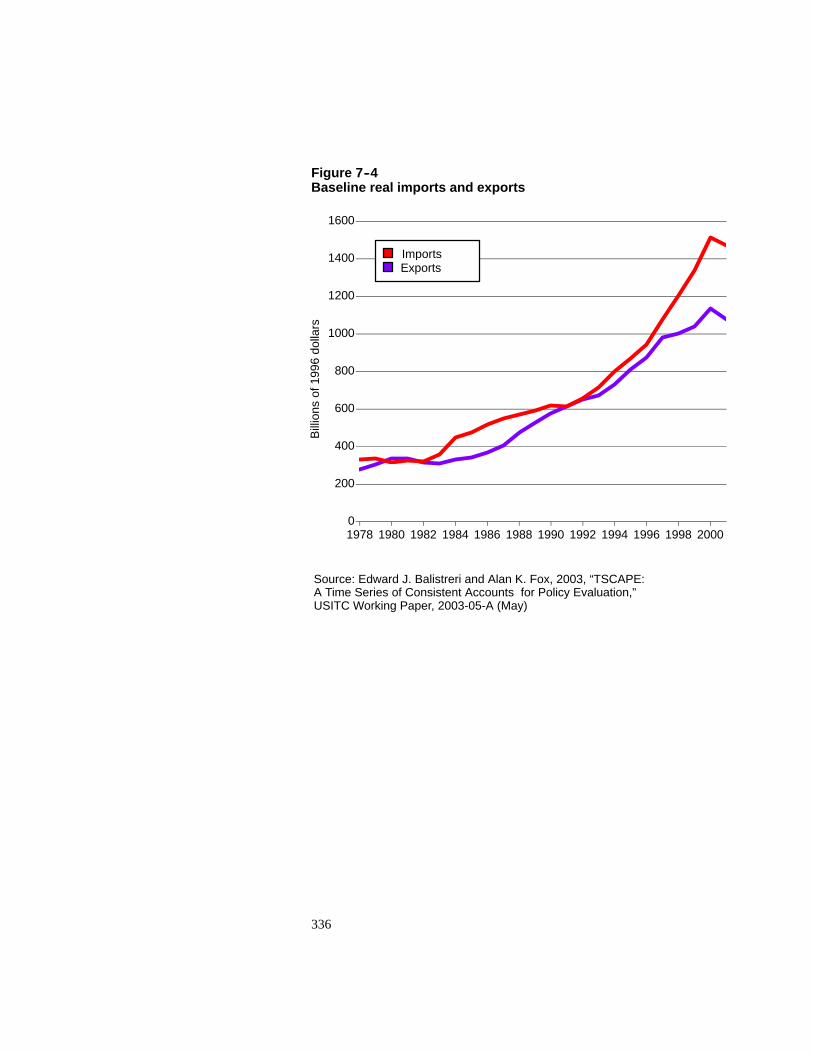
336
Figure 7--4Baseline real imports and exports
0
200
400
600
800
1000
1200
1400
1600
1978 1980 1982 1984 1986 1988 1990 1992 1994 1996 1998 2000
Source: Edward J. Balistreri and Alan K. Fox, 2003, “TSCAPE:A Time Series of Consistent Accounts for Policy Evaluation,”USITC Working Paper, 2003-05-A (May)
Bill
ions
of19
96do
llars
ImportsExports
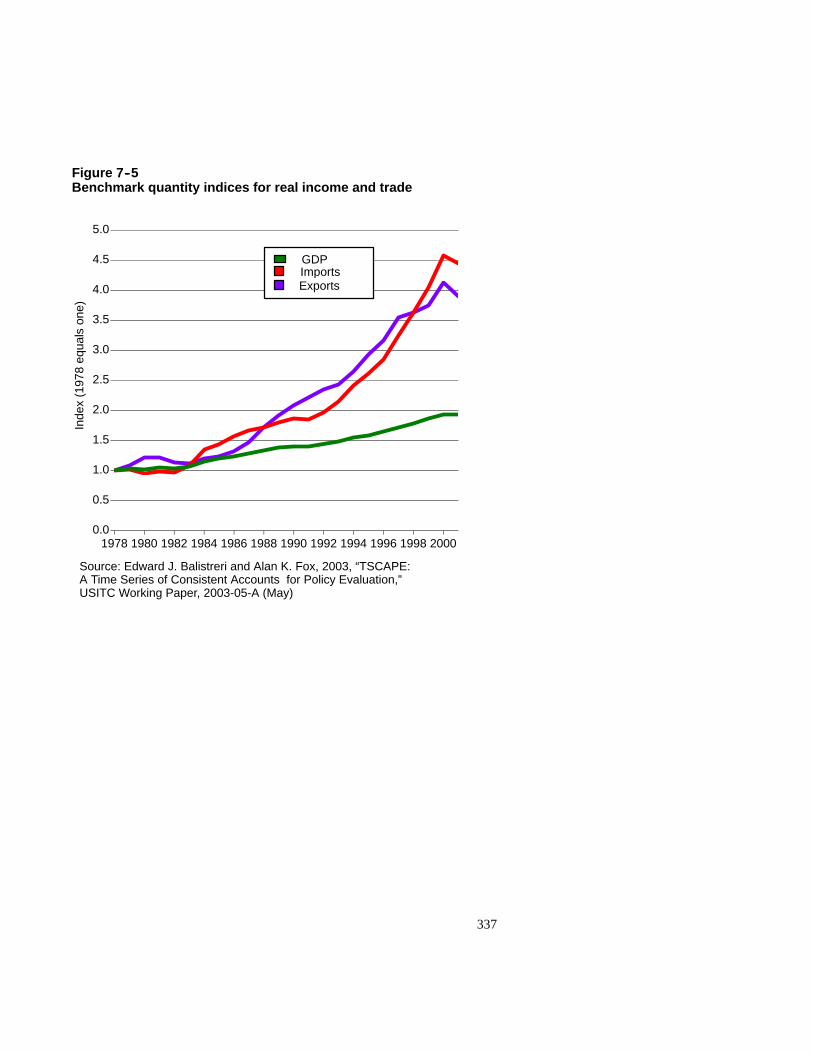
337
Figure 7--5Benchmark quantity indices for real income and trade
0.0
0.5
1.0
1.5
2.0
2.5
3.0
3.5
4.0
4.5
5.0
1978 1980 1982 1984 1986 1988 1990 1992 1994 1996 1998 2000
Source: Edward J. Balistreri and Alan K. Fox, 2003, “TSCAPE:A Time Series of Consistent Accounts for Policy Evaluation,”USITC Working Paper, 2003-05-A (May)
Inde
x(1
978
equa
lson
e)
GDPImportsExports
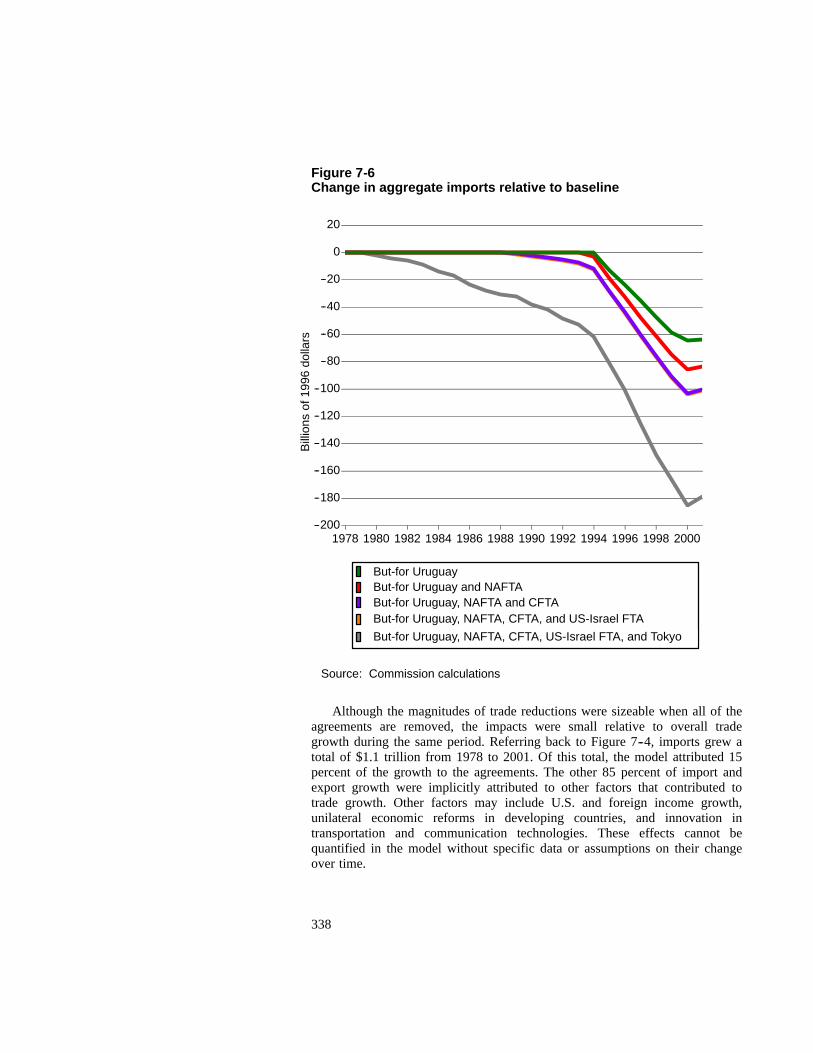
338
Figure 7-6Change in aggregate imports relative to baseline
--200
--180
--160
--140
--120
--100
--80
--60
--40
--20
0
20
1978 1980 1982 1984 1986 1988 1990 1992 1994 1996 1998 2000
Source: Commission calculations
Bill
ions
of19
96do
llars
But-for UruguayBut-for Uruguay and NAFTABut-for Uruguay, NAFTA and CFTABut-for Uruguay, NAFTA, CFTA, and US-Israel FTABut-for Uruguay, NAFTA, CFTA, US-Israel FTA, and Tokyo
Although the magnitudes of trade reductions were sizeable when all of theagreements are removed, the impacts were small relative to overall tradegrowth during the same period. Referring back to Figure 7--4, imports grew atotal of $1.1 trillion from 1978 to 2001. Of this total, the model attributed 15percent of the growth to the agreements. The other 85 percent of import andexport growth were implicitly attributed to other factors that contributed totrade growth. Other factors may include U.S. and foreign income growth,unilateral economic reforms in developing countries, and innovation intransportation and communication technologies. These effects cannot bequantified in the model without specific data or assumptions on their changeover time.
339
The aggregate results might also be summarized in terms of changes inincome. This income change can be decomposed into labor, capital, and tariffrevenue components. The simulation model has a stylized representation of thelabor market. Only one type of labor is assumed, and the market always clearswith full employment at the baseline levels. Total compensation to workerschanges, however, due to changes in the market clearing wage (relative to thetrue--cost--of--living index, the numeraire). Overall, in 2001 under scenario 5,labor income fell by 0.8 percent ($40 billion). This reduction indicated thatremoval of the trade agreements reduced net demand for labor. Similarly, theremoval of agreements decreased the net return to capital, reducingother--value--added payments by 0.7 percent ($30 billion). Offsetting theseincome decreases was a gain in tariff revenues (when the agreements areremoved) totaling $50 billion in 2001 under scenario 5.

341
CHAPTER 8:Growth in Product Variety
There are a number of ways in which economies benefit from increasedinternational trade. In the simulation model used in chapter 7, trade agreementsincrease U.S. welfare because they lower the price of U.S. imports and raisethe price of U.S. exports.1 While relative price changes are likely the primarybenefit of trade agreements, theoretical models of international trade suggestanother important benefit–U.S. tariff reductions allow a wider variety ofproducts to be sold in the U.S. market. Added variety can benefit consumers ifthey value having choices among multiple products. Firms buying importedintermediate goods can also benefit from access to a wider variety of products.Because standard models do not relate tariff reductions to greater productvariety, they may understate the benefits of trade liberalization.
This chapter documents a notable feature of recent U.S. tradegrowth–growth in the number of import sources per imported commodity. In1978, the U.S. imported from an average of 39 countries per SIC 4-digitcommodity. By 2001, the number of import sources per commodity had risento 58. Calculations in this chapter indicate that 2.5 percent of U.S. importgrowth since 1978 can be attributed to the increased number of trading partnersper product.
There are a number of possible explanations for the growth in the numberof product-country pairs in U.S. imports.2 During the time period considered inthis report, many countries undertook significant political and economicreforms that facilitated their wider participation in world markets.3 Asmentioned in chapter 4, technological innovations in transportation andcommunication technologies have also facilitated trade growth. The analysis in
1 Such changes raise the average standard of living because increased export pricesraise average income, while decreased import prices reduce the cost of living.
2 In what follows, “product--country pair” is used to indicate imports of a specificproduct originating in a specific country. For example, “computer equipment fromChina” identifies a product--country pair. The chapter investigates growth in the numberof product--country pairs per product in which U.S. imports are recorded, and measuresthe share of total trade growth attributable to new product--country pairs.
3 Several reforming countries are significant U.S. trading partners, includingMexico, China, India, and Indonesia. The trade agreements considered in this study mayhave had some role in helping to make reform efforts more credible. However, it is quitelikely that such reforms would have occurred, even in the absence of the tradeagreements.
342
this chapter employs an econometric model to estimate the role of tariffreductions in increased import variety. While the statistical relationshipbetween tariff cuts and new import sources is weak, model estimates suggestthat between 1.3 and 3.5 new varieties, or approximately 5 to 20 percent ofgrowth in U.S. import variety since 1978, can be attributed to U.S. tariffreductions.
Theoretical models of international trade developed over the last twodecades suggest that the economic benefits associated with new import sourcesmay be large. If buyers of imports consider goods from new import sources tobe qualitatively different than goods from existing sources, standard modelswill understate the value of trade liberalization to the U.S. economy. If, on theother hand, the goods from new sources cannot be distinguished from thegoods from existing sources, there is no benefit from the increased number ofimport sources.4 In that case, the standard gains from trade, like thosemeasured in chapter 7, would be a more appropriate measure of welfarechanges.
This chapter employs a calibrated theoretical model to demonstrate thepossible magnitude of the gains from new varieties induced by tariff reduction.Estimates from that exercise suggest that increased product variety mayaccount for as much as three-quarters of the welfare gain from U.S. tariffreductions. Thus, standard models, which measure only the effects of relativeprice change, may substantially understate the welfare gains from tradeagreements.
Theoretical DiscussionTheoretical discussions of the role of product variety in international trade
began with models by Krugman and Ethier.5 In both these models, individualfirms produce different varieties of the same product. In the Krugman model,trade occurs because consumers wish to consume a variety of products.Consumers’ taste for variety leads them to demand foreign varieties. In Ethier’s
4 For example, consumers might view a woman’s blouse from Mexico and awoman’s blouse from China as the same product, or the new Chinese variety might havebeen produced in Mexico at one time. In these cases, importing blouses from Mexico andChina would be no different, in a welfare sense, than importing from Mexico or Chinaalone. This chapter considers the possibility that new sources represent new varieties.The exercise is intended to suggest a possible gain from trade missing in standard modelslike that used in chapter 7.
5 Paul R. Krugman, “Increasing Returns, Monopolistic Competition andInternational Trade,” Journal of International Economics ,vol. 9, No.4, November 1979,pp. 469--79; and Wilfred J. Ethier, “National and International Returns to Scale in theModern Theory of International Trade,” American Economic Review, June 1982, vol.72, No. 3, pp. 389--405.
343
model, having access to a greater variety of intermediate goods raises afirm’s productivity. In both models, the economic gains from increasedvariety are the reason for international trade. Romer argues that economicmodels without a role for increased product variety may substantiallyunderstate the value of international trade.6
Most theoretical models that include a role for product variety attachvarietal differences to the output of individual firms. Unfortunately, trade dataare infrequently available at the firm level, so empirical research typicallyattaches varietal differences to a product’s country of origin. By assumption,buyers of imports (consumers, firms, or both) treat electronic equipment fromCanada as an imperfect substitute for electronic equipment from Germany, andbuyers are assumed to desire imports from each source.7 This chapter followsthis convention, treating the output of each country as a distinct variety of thegood in question. This chapter focuses on product-country pairs that are new tothe U.S. market since 1978.
Several empirical applications, some of which are reviewed in chapter 4,are relevant to the work in this chapter. Evenett and Venables decomposegrowth in developing country exports from 1970 to 1997.8 This chapteremploys Evenett and Venables’ method to decompose growth in U.S. imports.Following Schott, the chapter identifies country groupings that are mostresponsible for U.S. import growth.9 Subsequent work in this chapter adapts amodel and technique proposed by Klenow and Rodgriguez-Clare, who estimatethe welfare gains from Costa Rican liberalization in the mid 1980s.10
6 Paul M. Romer, “New Goods, Old Theory, and the Welfare Costs of TradeRestrictions,” Journal of Development Economics, vol. 43, 1995, pp. 5--38.
7 This is the Armington assumption, that goods are differentiated by their country oforigin. This treatment was first proposed in Paul Armington, “A Theory of Demand forProducts Distinguished by Place of Production.” International Monetary Fund StaffPapers, March 1969, vol. 16, No. 1, pp. 159--78. The Armington assumption underliesmany applied trade models, including the Global Trade Analysis Project (GTAP) modeland the model used in Chapter 7 of this report.
8 Simon J Evenett and Anthony J. Venables, “Export Growth in DevelopingCountries: Market Entry and Bilateral Trade Flows,” July, 2002. Presented at theNational Bureau of Economic Research Summer Research Institute. Downloaded fromthe internet site http://www.nber.org/~confer/2002/si2002/venables.pdf on April 24,2003.
9 Schott, Peter K. “Do Rich and Poor Countries Specialize in a Different Mix ofGoods? Evidence from Product--Level U.S. Trade Data,” National Bureau of EconomicResearch Working Paper 8492, September 2001.
10 Peter J. Klenow and Andres Rodriguez--Clare, “Quantifying Variety Gains fromTrade Liberalization,” September 1997, Graduate School of Business, University ofChicago. Downloaded from web page of Peter Klenowhttp://www.klenow.com/QuantifyingVariety.pdf on Nov 12, 2002.
344
DataThe primary data source employed in this study is the U.S. import series
from the Department of Commerce (DOC).11 In the construction of this data,product categories from the Trade Statistics of the United States of America(TSUSA) and Harmonized Tariff System (HTS) were concorded to 4-digitStandard Industrial Classification categories.12 Some part of the phenomenonmeasured here may include changes in product classification systems overtime–what appears as a new product may simply represent a reclassification ofan existing product. Considerable efforts were undertaken to reconcile the twodata systems, but analysis of product variety is sensitive to the process ofreconciliation.
A number of political changes since 1978 also complicate this analysis,including the break-up of political units like the Soviet Union, and the mergersof political units like East and West Germany. In order to ensure a consistentnumber of possible U.S. trading partners over time, geographic areas that wereunified in any time period during our sample are identified as a single tradingpartner for the purposes of this analysis. Thus, for analytical purposes, theformer Soviet Republics are grouped into a single country, as are other groupsof countries that were broken apart or merged during the period 1978-2001.13
Products from political subdivisions that have their own import code in U.S.trade statistics are treated as distinct from products exported from the parentcountry.14
Historical ExperienceFigure 8-1 shows annual average number of import sources per SIC 4-digit
category. In 1978, the U.S. imported from an average of 39 import sources perSIC 4-digit commodity. By 2001, that figure had risen to 58. While importvariety has generally increased over time, Figure 8-1 reveals an interestingaberration in the mid 1980s. Import product variety increased rapidly in themid-1980s, and then fell back to its long-term growth trend in the late 1980s.The deviation from the trend appears to be connected with changes in the real
11 Because DOC collected the data under two different classificiation schemes, thedata were concorded to allow a single classification scheme. The concordance procedureis described in Edward J. Balistreri and Alan K. Fox, “TSCAPE: a Time Series ofConsistent Accounts for Policy Evaluation,” USITC working paper 2003--5--A, 2003.
12 The United States collected data under the TSUSA classification system through1988. Since 1989, trade data has been collected under the HTS system. Combining thesedata series required an exercise of mapping products into a single classification system.
13 The former republics of Yugoslavia are treated as a single variety, as are thecombination of North and South Yemen, Israel and the West Bank/Gaza, the Czech andSlovak Republics, Eritrea and Ethiopia, and East and West Germany.
14 So, for example, Aruba’s products are treated as distinct from the products fromthe Netherlands.
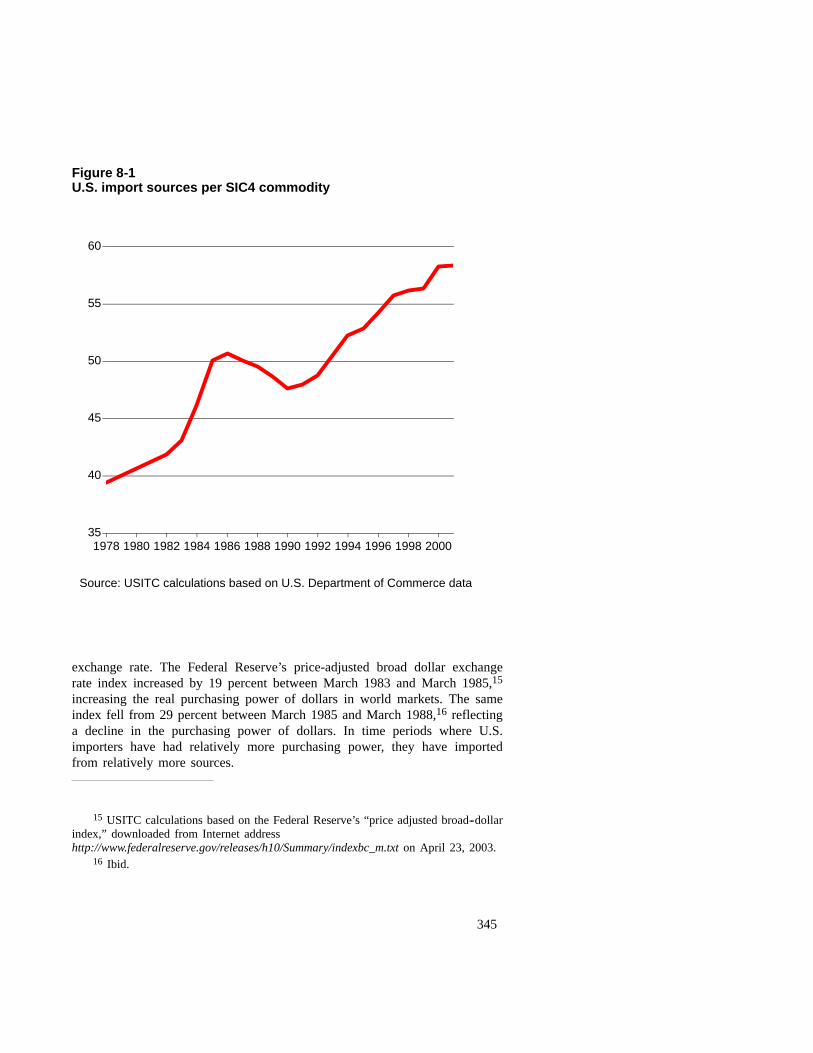
345
Figure 8-1U.S. import sources per SIC4 commodity
35
40
45
50
55
60
1978 1980 1982 1984 1986 1988 1990 1992 1994 1996 1998 2000
Source: USITC calculations based on U.S. Department of Commerce data
exchange rate. The Federal Reserve’s price-adjusted broad dollar exchangerate index increased by 19 percent between March 1983 and March 1985,15
increasing the real purchasing power of dollars in world markets. The sameindex fell from 29 percent between March 1985 and March 1988,16 reflectinga decline in the purchasing power of dollars. In time periods where U.S.importers have had relatively more purchasing power, they have importedfrom relatively more sources.
15 USITC calculations based on the Federal Reserve’s “price adjusted broad--dollarindex,” downloaded from Internet addresshttp://www.federalreserve.gov/releases/h10/Summary/indexbc_m.txt on April 23, 2003.
16 Ibid.
346
New Varieties in Trade Growth, aDecomposition
To better understand the significance of new country-product pairs inoverall trade growth, a decomposition method proposed by Evenett andVenables is applied to U.S. import data over the period 1978-2001. At the4-digit SIC level, 2.5 percent of import growth can be attributed to importsfrom new trading partners. Most of the new growth attributed to newcountry-product pairs occurs in countries the World Bank classifies as “middleincome” countries. Countries that joined the GATT/WTO during the years1978-2001 accounted for a larger share of import growth in new productcountry pairs than countries that were either members of the GATT in 1978, orcountries that were not members of the WTO in 2001. One percent of allimport growth between 1978 and 2001 occurred in products that China beganexporting to the United States during the period.
MethodEvenett and Venables show that trade growth can be decomposed into three
components: new trade in products not traded before, growth in the trade ofproducts already traded, and reduced trade due to the discontinuation of tradein some products. They suggest a further decomposition of the second category- growing trade in products already traded. U.S. imports in already tradedproducts may have grown because the United States imports more fromexisting sources or because the United States imports the product from newsources. U.S. imports of existing products may also decline because someexporters discontinue exporting to the United States. The category of interest inthis chapter is the share of trade growth that can be attributed to new exportersof existing products.17
One part of the analysis uses country groupings to establish commonalitiesamong the countries that became exporters of new products to the UnitedStates. The first country grouping emphasizes the timing of a country’saccession to the General Agreement on Tariffs and Trade or the World TradeOrganization. A second grouping emphasizes new exporters’ level of averageincome. The World Bank classifies countries into three levels of development -low income, middle income, and high income.18 In this analysis, countries aregrouped according to the World Bank’s characterization of their income statusin 1999.
17 For example, in 1978, the U.S. did not import any products in the “electroniccomputers” category (SIC 3571) from China. By 2001, Chinese exports accounted for 11percent of total U.S. imports of electronic computers.
18 World Bank, “Classification of Economies by Income and Region, 2000,” WorldDevelopment Report 2000/2001: Attacking Poverty, p. 334, Oxford University Press,New York, 2001.
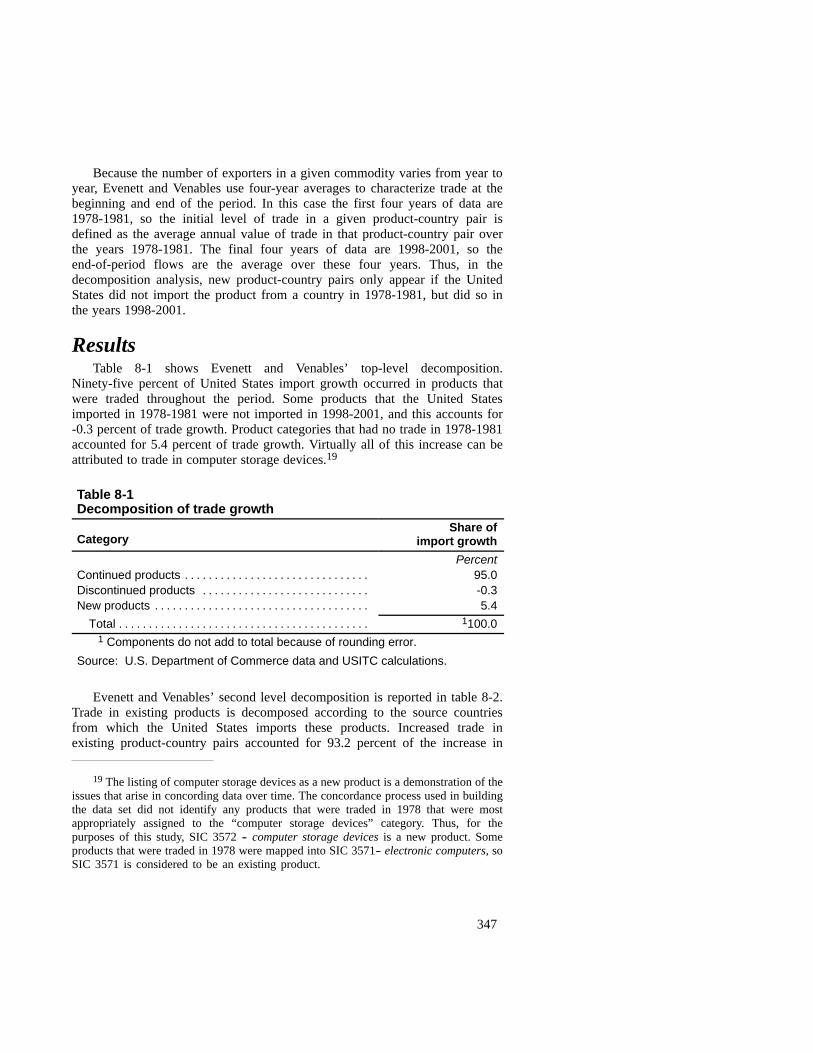
347
Because the number of exporters in a given commodity varies from year toyear, Evenett and Venables use four-year averages to characterize trade at thebeginning and end of the period. In this case the first four years of data are1978-1981, so the initial level of trade in a given product-country pair isdefined as the average annual value of trade in that product-country pair overthe years 1978-1981. The final four years of data are 1998-2001, so theend-of-period flows are the average over these four years. Thus, in thedecomposition analysis, new product-country pairs only appear if the UnitedStates did not import the product from a country in 1978-1981, but did so inthe years 1998-2001.
ResultsTable 8-1 shows Evenett and Venables’ top-level decomposition.
Ninety-five percent of United States import growth occurred in products thatwere traded throughout the period. Some products that the United Statesimported in 1978-1981 were not imported in 1998-2001, and this accounts for-0.3 percent of trade growth. Product categories that had no trade in 1978-1981accounted for 5.4 percent of trade growth. Virtually all of this increase can beattributed to trade in computer storage devices.19
Table 8-1Decomposition of trade growth
CategoryShare of
import growth
PercentContinued products . . . . . . . . . . . . . . . . . . . . . . . . . . . . . . . 95.0Discontinued products . . . . . . . . . . . . . . . . . . . . . . . . . . . . -0.3New products . . . . . . . . . . . . . . . . . . . . . . . . . . . . . . . . . . . . 5.4
Total . . . . . . . . . . . . . . . . . . . . . . . . . . . . . . . . . . . . . . . . . . 1100.01 Components do not add to total because of rounding error.
Source: U.S. Department of Commerce data and USITC calculations.
Evenett and Venables’ second level decomposition is reported in table 8-2.Trade in existing products is decomposed according to the source countriesfrom which the United States imports these products. Increased trade inexisting product-country pairs accounted for 93.2 percent of the increase in
19 The listing of computer storage devices as a new product is a demonstration of theissues that arise in concording data over time. The concordance process used in buildingthe data set did not identify any products that were traded in 1978 that were mostappropriately assigned to the “computer storage devices” category. Thus, for thepurposes of this study, SIC 3572 -- computer storage devices is a new product. Someproducts that were traded in 1978 were mapped into SIC 3571-- electronic computers, soSIC 3571 is considered to be an existing product.
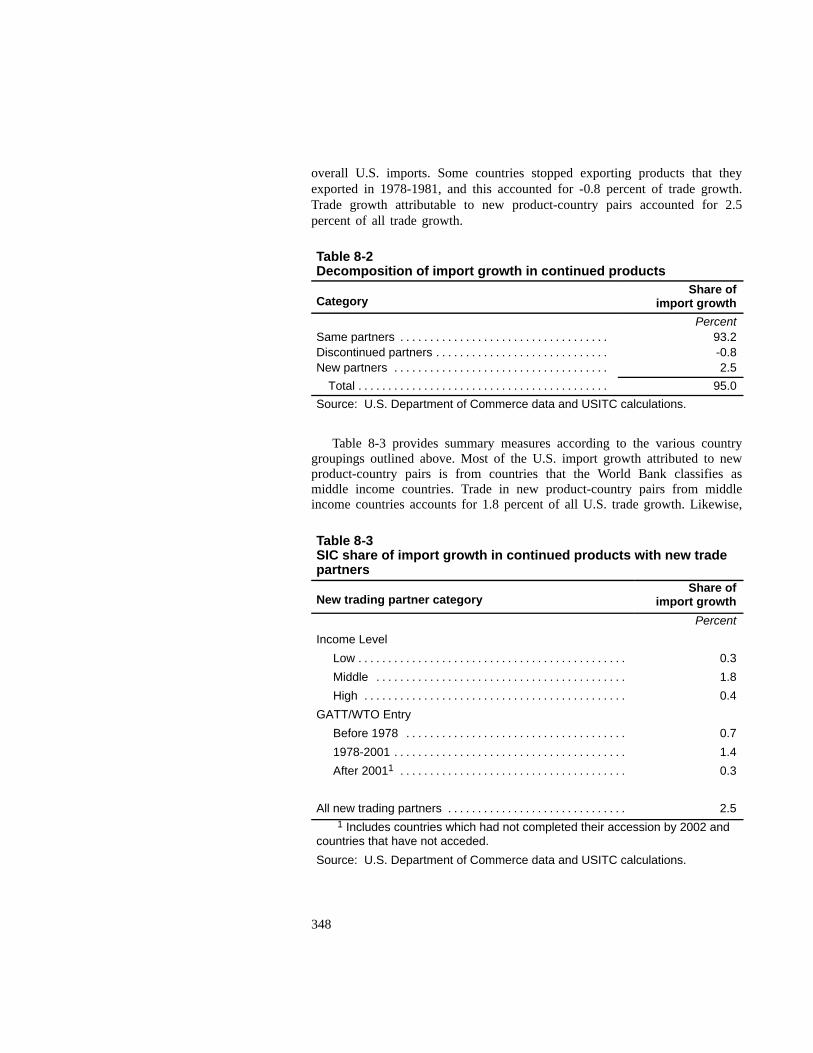
348
overall U.S. imports. Some countries stopped exporting products that theyexported in 1978-1981, and this accounted for -0.8 percent of trade growth.Trade growth attributable to new product-country pairs accounted for 2.5percent of all trade growth.
Table 8-2Decomposition of import growth in continued products
CategoryShare of
import growth
PercentSame partners . . . . . . . . . . . . . . . . . . . . . . . . . . . . . . . . . . . 93.2Discontinued partners . . . . . . . . . . . . . . . . . . . . . . . . . . . . . -0.8New partners . . . . . . . . . . . . . . . . . . . . . . . . . . . . . . . . . . . . 2.5
Total . . . . . . . . . . . . . . . . . . . . . . . . . . . . . . . . . . . . . . . . . . 95.0
Source: U.S. Department of Commerce data and USITC calculations.
Table 8-3 provides summary measures according to the various countrygroupings outlined above. Most of the U.S. import growth attributed to newproduct-country pairs is from countries that the World Bank classifies asmiddle income countries. Trade in new product-country pairs from middleincome countries accounts for 1.8 percent of all U.S. trade growth. Likewise,
Table 8-3SIC share of import growth in continued products with new tradepartners
New trading partner categoryShare of
import growth
Percent
Income Level
Low . . . . . . . . . . . . . . . . . . . . . . . . . . . . . . . . . . . . . . . . . . . . . 0.3
Middle . . . . . . . . . . . . . . . . . . . . . . . . . . . . . . . . . . . . . . . . . . 1.8
High . . . . . . . . . . . . . . . . . . . . . . . . . . . . . . . . . . . . . . . . . . . . 0.4
GATT/WTO Entry
Before 1978 . . . . . . . . . . . . . . . . . . . . . . . . . . . . . . . . . . . . . 0.7
1978-2001 . . . . . . . . . . . . . . . . . . . . . . . . . . . . . . . . . . . . . . . 1.4
After 20011 . . . . . . . . . . . . . . . . . . . . . . . . . . . . . . . . . . . . . . 0.3
All new trading partners . . . . . . . . . . . . . . . . . . . . . . . . . . . . . . 2.51 Includes countries which had not completed their accession by 2002 and
countries that have not acceded.
Source: U.S. Department of Commerce data and USITC calculations.
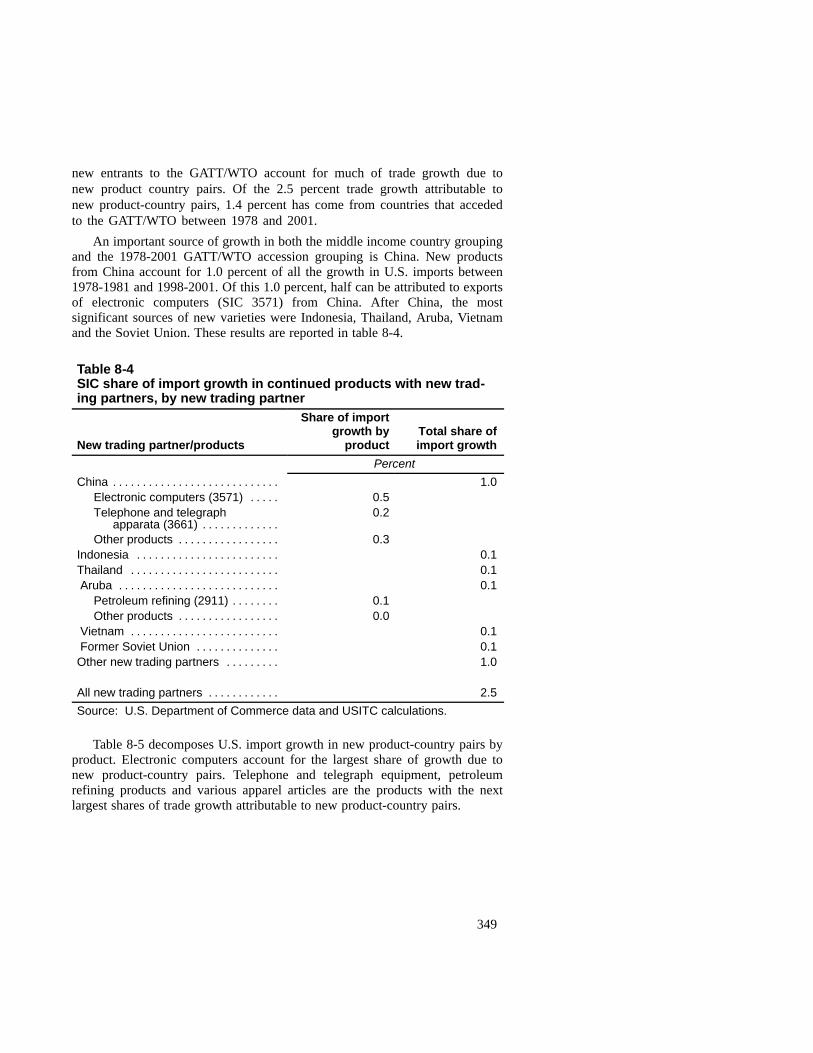
349
new entrants to the GATT/WTO account for much of trade growth due tonew product country pairs. Of the 2.5 percent trade growth attributable tonew product-country pairs, 1.4 percent has come from countries that accededto the GATT/WTO between 1978 and 2001.
An important source of growth in both the middle income country groupingand the 1978-2001 GATT/WTO accession grouping is China. New productsfrom China account for 1.0 percent of all the growth in U.S. imports between1978-1981 and 1998-2001. Of this 1.0 percent, half can be attributed to exportsof electronic computers (SIC 3571) from China. After China, the mostsignificant sources of new varieties were Indonesia, Thailand, Aruba, Vietnamand the Soviet Union. These results are reported in table 8-4.
Table 8-4SIC share of import growth in continued products with new trad-ing partners, by new trading partner
New trading partner/products
Share of importgrowth by
productTotal share ofimport growth
Percent
China . . . . . . . . . . . . . . . . . . . . . . . . . . . . 1.0Electronic computers (3571) . . . . . 0.5Telephone and telegraph
apparata (3661) . . . . . . . . . . . . .0.2
Other products . . . . . . . . . . . . . . . . . 0.3Indonesia . . . . . . . . . . . . . . . . . . . . . . . . 0.1Thailand . . . . . . . . . . . . . . . . . . . . . . . . . 0.1Aruba . . . . . . . . . . . . . . . . . . . . . . . . . . . 0.1
Petroleum refining (2911) . . . . . . . . 0.1Other products . . . . . . . . . . . . . . . . . 0.0
Vietnam . . . . . . . . . . . . . . . . . . . . . . . . . 0.1Former Soviet Union . . . . . . . . . . . . . . 0.1
Other new trading partners . . . . . . . . . 1.0
All new trading partners . . . . . . . . . . . . 2.5
Source: U.S. Department of Commerce data and USITC calculations.
Table 8-5 decomposes U.S. import growth in new product-country pairs byproduct. Electronic computers account for the largest share of growth due tonew product-country pairs. Telephone and telegraph equipment, petroleumrefining products and various apparel articles are the products with the nextlargest shares of trade growth attributable to new product-country pairs.
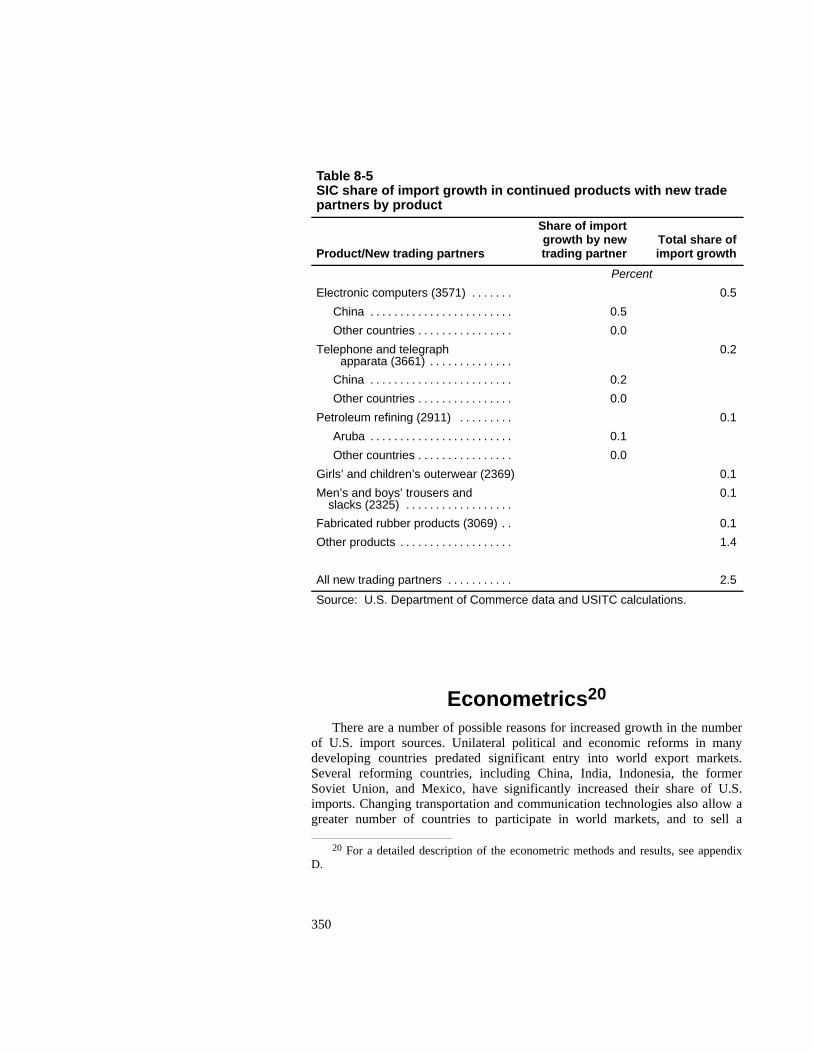
350
Table 8-5SIC share of import growth in continued products with new tradepartners by product
Product/New trading partners
Share of importgrowth by newtrading partner
Total share ofimport growth
Percent
Electronic computers (3571) . . . . . . . 0.5
China . . . . . . . . . . . . . . . . . . . . . . . . 0.5
Other countries . . . . . . . . . . . . . . . . 0.0
Telephone and telegraphapparata (3661) . . . . . . . . . . . . . .
0.2
China . . . . . . . . . . . . . . . . . . . . . . . . 0.2
Other countries . . . . . . . . . . . . . . . . 0.0
Petroleum refining (2911) . . . . . . . . . 0.1
Aruba . . . . . . . . . . . . . . . . . . . . . . . . 0.1
Other countries . . . . . . . . . . . . . . . . 0.0
Girls’ and children’s outerwear (2369) 0.1
Men’s and boys’ trousers andslacks (2325) . . . . . . . . . . . . . . . . . .
0.1
Fabricated rubber products (3069) . . 0.1
Other products . . . . . . . . . . . . . . . . . . . 1.4
All new trading partners . . . . . . . . . . . 2.5
Source: U.S. Department of Commerce data and USITC calculations.
Econometrics20
There are a number of possible reasons for increased growth in the numberof U.S. import sources. Unilateral political and economic reforms in manydeveloping countries predated significant entry into world export markets.Several reforming countries, including China, India, Indonesia, the formerSoviet Union, and Mexico, have significantly increased their share of U.S.imports. Changing transportation and communication technologies also allow agreater number of countries to participate in world markets, and to sell a
20 For a detailed description of the econometric methods and results, see appendixD.
351
wider variety of products. The purpose of this exercise is to isolate the roleof U.S. tariff reductions as a source of increased product variety. Since mostU.S. tariff reductions over the period can be linked directly to the five tradeagreements considered, this exercise is meant to identify the impact of thetrade agreements on product variety over the time period 1978-2001.
The econometric strategy relates changes in U.S. tariff rates and freightcharges to changes in the number of import sources per commodity. Theeconometric question can be summarized as, “Did products that experiencedlarger U.S. tariff reductions between 1978 and 2001 experience larger increasesin the number of import sources?” The evidence presented in appendix Dsuggests that the answer is yes. Estimates from the econometric model suggestthat, on average, a 1 percentage point reduction in the multilateral tariff rate ona SIC 4-digit commodity increases the number of U.S. import sources of thatcommodity by 0.3 to 0.4. The model also suggests that the net effect ofpreferential tariff reductions awarded products from Israel, Canada, and Mexicohave also contributed to growth in the number of export varieties. Postestimation calculations suggest that between 1.3 and 3.5 new varieties percommodity can be attributed to tariff reductions. These estimates suggest that 5to 20 percent of the growth in new product varieties can be linked to tariffreductions.
Measuring the Economic Effects ofIncreased Product Variety
In standard models like the one used in chapter 7, tariff reductions do notinduce new product-country pairs in imports. Consumers are modeled as if theywould benefit from such entry; the framework simply does not allow entry tooccur. More recent theoretic models use a framework that allows a consistentrepresentation of new product entry. Importers pay a fixed cost to purchase anew variety. When tariffs fall, the reduced relative price of imported goodsleads consumers to increase their relative demand for imports, and they buymore varieties as a result.
The Commission simulated the effects of tariff changes on a modelcalibrated to match certain features of the United States economy.21 A keyfeature of the calibration is that the model matches the econometric estimates, a4 percent increase in the tariff reduces the number of import varieties from 58to 55.22 Similar to chapter 7, the model is shocked by imposing historical
21 The model is discussed in detail in technical appendix D.22 Three is chosen because it is the largest integer within the range of econometric
estimates that suggest 1.3 to 3.5 new import varieties can be attributed to tariffreductions. The purpose of the modeling exercise is to set a reasonable upper bound onadditional gains from import variety. Thus, the largest possible integer within the rangeof econometric estimates was chosen.
352
tariffs on a representation of the 2001 economy. In this case, the 1978average tariff is imposed. Welfare is calculated in two circumstances, one inwhich the model includes benefits from added import variety and one inwhich consumers do not gain from increased import variety. The ratio of thetwo estimates offers a suggestive guide to the possible magnitude ofvariety-type effects.
The estimates suggest that variety effects, if present, could be importantcontributors to overall welfare. When variety effects are not included in thewelfare calculation, raising U.S. tariffs to their 1978 level reduces welfare by0.04 percent. When variety effects and relative price changes are both included,returning to 1978 tariffs reduces welfare by 0.15 percent. Changes in importproduct variety account for three-quarters of the total welfare change in theimport variety model. These estimates indicate that, if variety type effects arepresent in the real economy, the estimates in chapter 7 may substantiallyunderstate the effects of trade agreements on U.S. economic welfare.

APPENDIX AAuthorizing Legislation and
Federal Register Notice

A-2


APPENDIX BChapter 6 Technical Annex

B-2
B-3
Previous StudiesThis section provides a brief review of recent ex post statistical studies that
have attempted to capture the impact of NAFTA on its North American tradingpartners. At the disaggregated level, the most closely related study is that ofRomalis.1 Romalis examines the impact of the U.S. NAFTA preferences onCanadian and Mexican shares of U.S. imports across about 6,800 commoditiestraded continually between 1989 and 2000. Since his tariff preference data arelimited to the year 2000, Romalis tests whether the 2000 tariff preference hadan effect on import shares in 2000 and in previous years. In general he finds apositive, significant effect, which grows between 1994 and 2000. Romalisinterprets this as capturing the phase--in of tariff preferences over time, andconcludes that NAFTA has had a substantial effect on North American trade.
Agama and McDaniel2 use an import demand model to exploit thetime--varying dimension of the U.S. tariff preference toward Mexico onaggregate imports between 1989 and 2001. The authors note that this isimportant because the United States extended a tariff preference to Mexicoprior to NAFTA under the GSP program, and the NAFTA preference wasphased in over time. They use the model to examine the impact of the tariffpreference on the U.S. demand for Mexican goods. The authors report a 1percentage point rise in the preference corresponds to a 5.7 to 8.0 percent risein U.S. demand for goods produced in Mexico. After NAFTA wasimplemented, a 1 percentage point rise in the preference resulted in anadditional 6.0 to 7.2 percent rise in the U.S. demand for goods from Mexico.This suggests that U.S. import demand was more responsive to changes in thetariff preference following the implementation of NAFTA. Agama andMcDaniel also use an export demand model to examine the impact of theMexican tariff preference toward the United States over the 1993 to 2001period. They report that a 1 percentage point rise in the NAFTA preferencecorresponds to a 4.7 to 6.3 percent rise in Mexico’s demand for goodsproduced in the United States.
1 John Romalis, “NAFTA’s Impact on North American Trade,” University ofChicago Graduate School of Business Working Paper, 2001.
2 Laurie-Ann Agama and Christine A. McDaniel, “The NAFTA Preference andU.S.-Mexico Trade: Aggregate Level Analysis,” The World Economy, forthcoming2003.
B-4
Krueger3 uses a gravity model to analyze the effects of membership inpreferential trade agreements on trade flows for 61 countries between 1991 and1997. She finds little evidence that membership in NAFTA had significanteffects on North American trade at the aggregate level. However, usingqualitative analysis to examine North American trade at the industry level,Krueger argues that trade in some individual sectors may have increased due toNAFTA. These sectors include, among others, machinery and equipment, andtextiles and apparel.
Although Fukao, et al.,4 try to test for evidence of trade diversion fromNAFTA, their study provides additional empirical evidence on the impact oftariff reductions on import flows. Fukao, et al., use a gravity model to examinethe impact of tariff reductions on U.S. manufactured commodity import sharesat the HS 2--digit level from 1992 to 1998. Selected commodities are alsoanalyzed at the HS 4--digit level over this period. The authors report that theestimated coefficients on tariffs were negative and statistically significant for15 commodities and conclude that reductions in tariff rates had significantpositive effects on U.S. trade for these 15 commodities.5
Two studies of the Canada--U.S. Free Trade Agreement (CUSFTA) findevidence that trade liberalization has a significant impact on trade flows.Trefler6 tests the impact of Canadian tariff cuts under the CUSFTA onCanadian manufacturing imports from the United States as a share of Canadianoutput. He finds that CUSFTA tariff cuts are a statistically significantdeterminant of these import shares. Clausing7 uses an import demand model to
3 Ann O. Krueger, “Trade Creation and Trade Diversion Under NAFTA,” NationalBureau of Economic Research (NBER) Working Paper, December 1999.
4 Kyoji Fukao, Toshihiro Okubo, and Robert Stern, “An Econometric Analysis ofTrade Diversion,” The North American Journal of Economics and Finance, vol. 14,No. 1, March 2003, pp. 3-24.
5 Given that U.S. tariffs against Mexico and Canada fell faster than U.S. tariffsagainst the rest of the world, the authors infer that NAFTA resulted in significant tradediversion from other competing exporters to the NAFTA partners.
6 Daniel Trefler, “The Long and Short of the U.S.-Canada Free Trade Agreement,”NBER Working Paper No. 8293, May 2001.
7 Kim A. Clausing, “Trade Creation and Trade Diversion in the Canada-U.S. FreeTrade Agreement,” Canadian Journal of Economics, vol. 34, No. 3, 2001, pp. 676-696.
B-5
examine the responsiveness of U.S. imports from Canada to U.S. tariffchanges due to the CUSFTA. She reports that U.S.--Canadian trade is highlysensitive to changes in tariffs. Each 1 percent point reduction in tariffs isassociated with a 9.6 percent increase in imports from Canada.8
Analytical FrameworkAs in Romalis’ study, a country’s share of U.S. imports in any industry is
expected to be predominantly a function of the price of that country’s importsrelative to the price of imports from other countries. For each good i, in anyyear t, Mexico’s share of U.S. total imports is, thus, a function of the price ofMexican imports relative to the average price of U.S. imports from all othersources:
(1)(1)
The prices of U.S. imports (PI) from any country j are made up of four keycomponents: the actual export price of the product (P*), the additionalmarkup due to transport costs (TR), the tariff (T) applied to that importedgood,9 and the exchange rate (E), which translates the foreign currency priceinto U.S. dollars.
(2)
Changes in any of these four components will change the relative price ofimports from an individual country and influence its share of U.S. imports.Any attempt to isolate the impact of trade preferences on import share,therefore, must control for changes in the other three components.
The Commission analysis extends Romalis’ study in several ways. First,actual data on applied tariff rates throughout the period 1989--2001 are used,capturing both the differences in tariff preferences across goods and the gradual
8 Clausing also tests for trade diversion, but finds no evidence that it occurred.9 If other non-tariff barriers, such as quotas, also exist on a particular imported
product, the tariff -equivalent of such barriers must be taken into account to get anaccurate estimate of the increase in price due to all trade barriers.
B-6
phase--in of preferences over time. Second, proxies for export prices fromMexico and other countries are included, as well as measures of changes inthe peso--dollar exchange rate, and in U.S. purchasing power over importsfrom other sources. Third, the import share in the previous year (laggedimport share) is included as a determinant of today’s import share. Thisvariable helps to control for the fact that markets do not always adjust topolicy changes immediately, and that Mexican import shares may behistorically high in some products. Fourth, the tariff itself is used as a controlvariable, since in any given year, regardless of the tariff preference, Mexicowould likely have relatively smaller import shares in products where it facesrelatively highly barriers. Finally, the growth of U.S. shares of Mexicanimports in response to Mexico’s NAFTA tariff preferences is examined.Taking the log of equations (2) and (1), and substituting (2) into (1), yieldsthe basic specification to be estimated. Incorporating lagged import sharesand tariff levels yields:
(3)
where: lowercase letters indicate log values; j,k=Mexico, US, j≠k; w=world;N=dummy for post--NAFTA years.
Several conclusions from previous studies are also explored using equation(3). Agama and McDaniel suggested that U.S. preferences toward Mexico didsignificantly raise Mexico’s share of U.S. imports at the aggregate level, andthat these preferences mattered more after NAFTA than before. In the presentstudy, an explicit test is conducted to see if the impact of U.S. preferencesdiffers before and after NAFTA. Krueger suggested that any significant changein Mexico’s share of U.S. imports was likely due to the major peso devaluationin late 1994, rather than NAFTA. The present study allows a direct comparisonof the influence of the trade preferences relative to exchange rate changesduring this time period. Krueger also suggests that specific sectors, such astextiles and apparel, may have been significantly impacted by the NAFTApreferences, even if aggregate effects were negligible. The present studyestimates the effects of preferences specifically on Mexican shares of U.S.imports of textiles and apparel, and compares the results to the impact onmanufacturing as a whole.
B-7
Data and EstimationEquation (3) is estimated for the U.S. manufacturing sector over the period
1990--200110 for all HTS 6--digit subheadings that existed throughout the1989--2001 period.11 Mexico’s share of U.S. imports is calculated as the ratioof U.S. imports from Mexico to U.S. imports from the world, using customsvalue for the calculations. Applied tariffs on imports from Mexico and theworld are calculated as import duties collected, divided by customs value, foreach product in each year. Transport costs are approximated by the ratio of thec.i.f. value of imports to the customs value of imports. The U.S. NAFTApreference toward Mexico is then the difference between the applied tariff onworld imports, and the applied tariff on Mexican imports. The use of appliedtariffs has both benefits and drawbacks. The benefit is a better measure of theextent and magnitude of the tariff preferences phased in by a particular year.The drawback is that applied tariffs are only available for products which theU.S. actually imports from Mexico, which reduces the sample, though thedataset remains quite large at about 37,000 observations.12 The introduction oflagged import shares eliminates the initial year’s data, reducing the sample toabout 34,700.
Changes in the value of the Mexican peso to the U.S. dollar are measuredby the nominal peso/dollar exchange rate. The nominal effective exchange ratefor the U.S. measures changes in the U.S. dollar’s purchasing power withrespect to a weighted average of its trading partners’ currencies. Both exchangerate series are taken from the International Monetary Fund’s InternationalFinancial Statistics.13 The export prices of products from Mexico and from allother countries are proxied by unit values. These are calculated as customsvalue of imports divided by quantity. Due to aggregation problems with
10 For both the U.S. and Mexican specifications, estimation uses generalized leastsquares, with fixed effects at the industry level, and a correction for heteroskedasticity.
11 Over this time period some subheadings are eliminated, while new ones areintroduced. Within the manufacturing sector, the sample of subheadings which appearsconsistently throughout the period is approximately 4,300.
12 A more serious problem may be the non-random nature of the reduction in thesample. Romalis has a similar problem, and reestimates his model correcting for thispotential bias. He finds that the correction produces negligible differences in the results.
13 The annual values used are simple averages of the monthly data.
B-8
quantity measures, it was not possible to construct consistent unit values forimports for all sources other than Mexico. As an alternative, the unit valuemeasures for U.S. imports from the world (all countries including Mexico)are used. Since some HTS 6--digit subheadings lines have multiple quantitymeasures which cannot be accurately compared over the entire time period,nor easily aggregated, these products were dropped from the sample.14 Thus,inclusion of price measures reduced the sample to about 28,000 observations.
All Mexican trade data were taken from the United Nations Conference onTrade and Development’s Trade Analysis and Information System (TRAINS).Import shares, applied tariffs and preferences were all calculated as in the U.S.analysis. Although Mexican imports from the United States and the world wereavailable for 1991--2000, tariffs against U.S. imports were only available for1991, 1995, and 1999. Thus, the estimation for Mexico uses pooled data over 3years and about 4,000 products. Since import data were only available in c.i.f.value, it was not possible to construct a measure of transport costs or proxiesfor export prices from either the United States or the world. U.S. shares ofMexican imports in 1989 were used to capture historical differences acrossproducts, and Mexican tariffs against the United States in 1989 were used tocapture differences in the level of historical protection across products.
14 For example, some products are reported at the 6-digit level in kilograms, numberof units, and dozens, for the period 1989-1995, and only in kilograms and dozens for1996-2001.
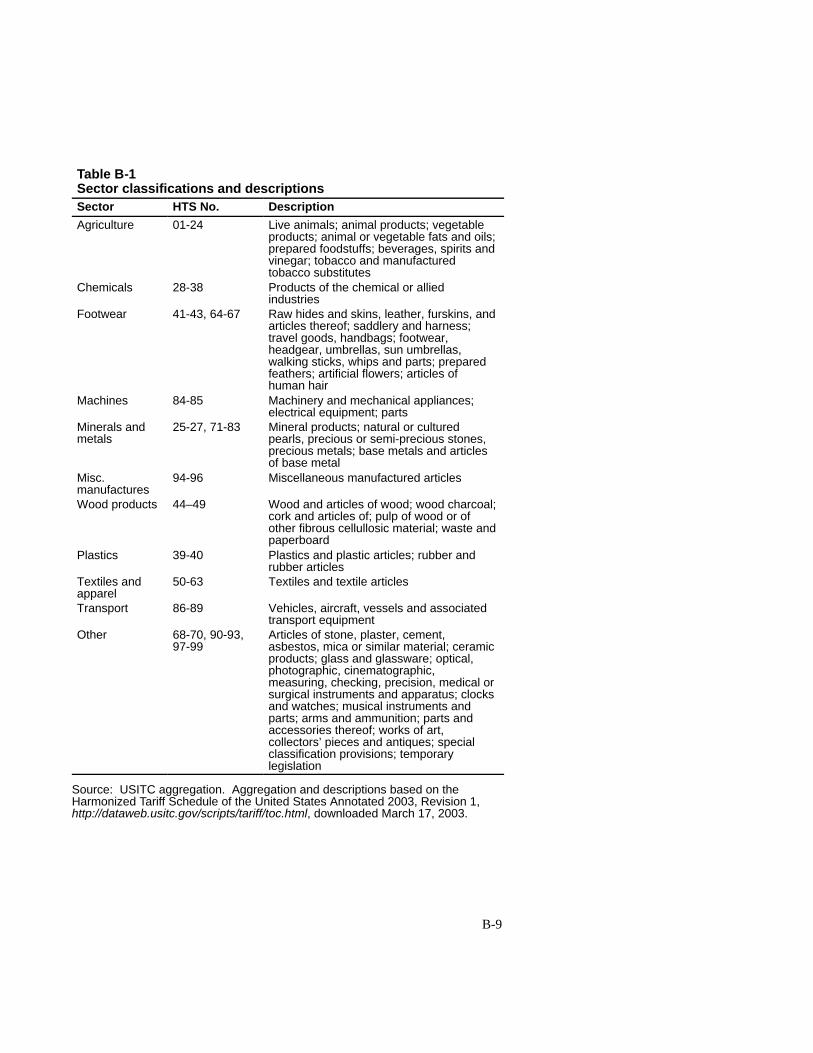
B-9
Table B-1Sector classifications and descriptionsSector HTS No. Description
Agriculture 01-24 Live animals; animal products; vegetableproducts; animal or vegetable fats and oils;prepared foodstuffs; beverages, spirits andvinegar; tobacco and manufacturedtobacco substitutes
Chemicals 28-38 Products of the chemical or alliedindustries
Footwear 41-43, 64-67 Raw hides and skins, leather, furskins, andarticles thereof; saddlery and harness;travel goods, handbags; footwear,headgear, umbrellas, sun umbrellas,walking sticks, whips and parts; preparedfeathers; artificial flowers; articles ofhuman hair
Machines 84-85 Machinery and mechanical appliances;electrical equipment; parts
Minerals andmetals
25-27, 71-83 Mineral products; natural or culturedpearls, precious or semi-precious stones,precious metals; base metals and articlesof base metal
Misc.manufactures
94-96 Miscellaneous manufactured articles
Wood products 44–49 Wood and articles of wood; wood charcoal;cork and articles of; pulp of wood or ofother fibrous cellullosic material; waste andpaperboard
Plastics 39-40 Plastics and plastic articles; rubber andrubber articles
Textiles andapparel
50-63 Textiles and textile articles
Transport 86-89 Vehicles, aircraft, vessels and associatedtransport equipment
Other 68-70, 90-93,97-99
Articles of stone, plaster, cement,asbestos, mica or similar material; ceramicproducts; glass and glassware; optical,photographic, cinematographic,measuring, checking, precision, medical orsurgical instruments and apparatus; clocksand watches; musical instruments andparts; arms and ammunition; parts andaccessories thereof; works of art,collectors’ pieces and antiques; specialclassification provisions; temporarylegislation
Source: USITC aggregation. Aggregation and descriptions based on theHarmonized Tariff Schedule of the United States Annotated 2003, Revision 1,http://dataweb.usitc.gov/scripts/tariff/toc.html, downloaded March 17, 2003.
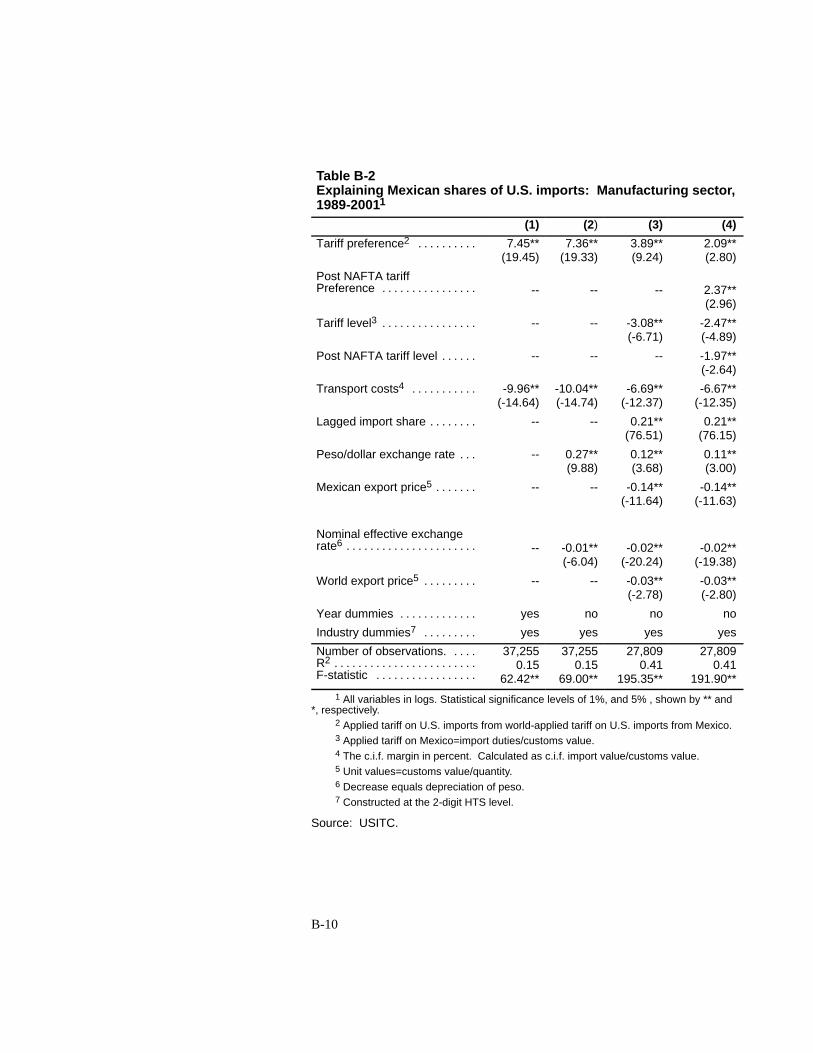
B-10
Table B-2Explaining Mexican shares of U.S. imports: Manufacturing sector,1989-20011
(1) (2) (3) (4)
Tariff preference2 . . . . . . . . . . 7.45**(19.45)
7.36**(19.33)
3.89**(9.24)
2.09**(2.80)
Post NAFTA tariffPreference . . . . . . . . . . . . . . . . -- -- -- 2.37**
(2.96)
Tariff level3 . . . . . . . . . . . . . . . . -- -- -3.08**(-6.71)
-2.47**(-4.89)
Post NAFTA tariff level . . . . . . -- -- -- -1.97**(-2.64)
Transport costs4 . . . . . . . . . . . -9.96**(-14.64)
-10.04**(-14.74)
-6.69**(-12.37)
-6.67**(-12.35)
Lagged import share . . . . . . . . -- -- 0.21**(76.51)
0.21**(76.15)
Peso/dollar exchange rate . . . -- 0.27**(9.88)
0.12**(3.68)
0.11**(3.00)
Mexican export price5 . . . . . . . -- -- -0.14**(-11.64)
-0.14**(-11.63)
Nominal effective exchangerate6 . . . . . . . . . . . . . . . . . . . . . . -- -0.01**
(-6.04)-0.02**
(-20.24)-0.02**
(-19.38)
World export price5 . . . . . . . . . -- -- -0.03**(-2.78)
-0.03**(-2.80)
Year dummies . . . . . . . . . . . . . yes no no no
Industry dummies7 . . . . . . . . . yes yes yes yes
Number of observations. . . . .R2 . . . . . . . . . . . . . . . . . . . . . . . .F-statistic . . . . . . . . . . . . . . . . .
37,2550.15
62.42**
37,2550.15
69.00**
27,8090.41
195.35**
27,8090.41
191.90**1 All variables in logs. Statistical significance levels of 1%, and 5% , shown by ** and
*, respectively.2 Applied tariff on U.S. imports from world-applied tariff on U.S. imports from Mexico.3 Applied tariff on Mexico=import duties/customs value.4 The c.i.f. margin in percent. Calculated as c.i.f. import value/customs value.5 Unit values=customs value/quantity.6 Decrease equals depreciation of peso.7 Constructed at the 2-digit HTS level.
Source: USITC.
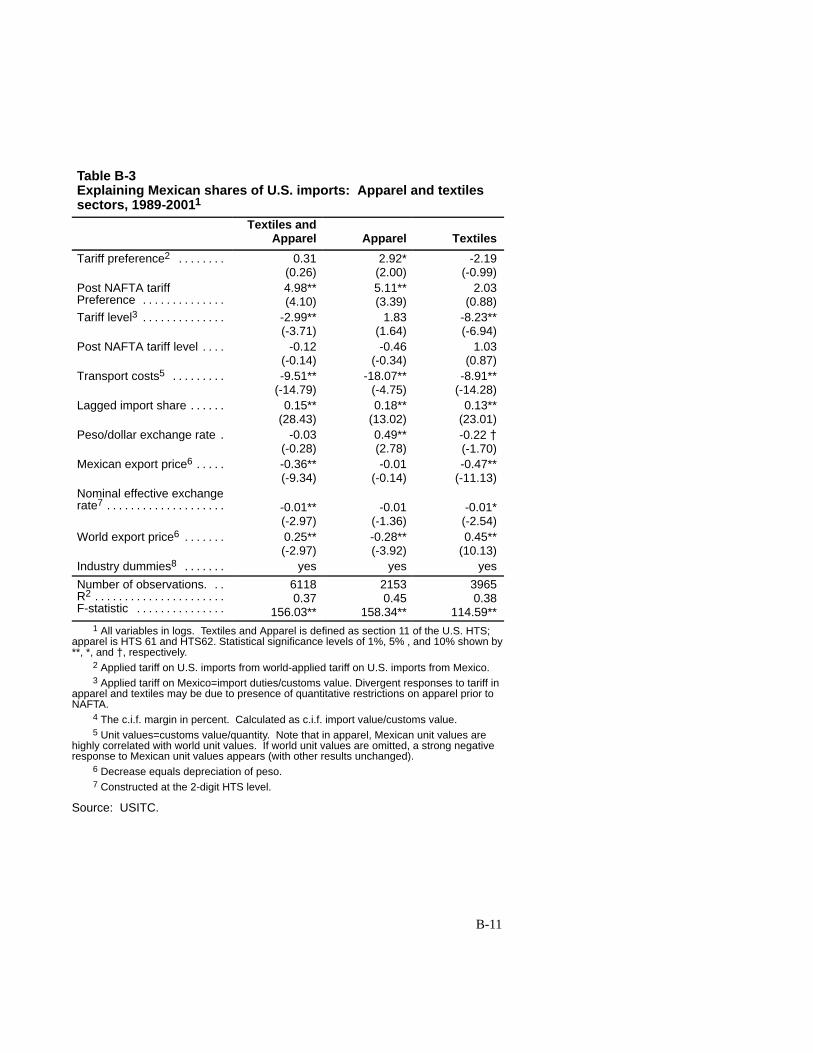
B-11
Table B-3Explaining Mexican shares of U.S. imports: Apparel and textilessectors, 1989-20011
Textiles andApparel Apparel Textiles
Tariff preference2 . . . . . . . . 0.31(0.26)
2.92*(2.00)
-2.19(-0.99)
Post NAFTA tariffPreference . . . . . . . . . . . . . .
4.98**(4.10)
5.11**(3.39)
2.03(0.88)
Tariff level3 . . . . . . . . . . . . . . -2.99**(-3.71)
1.83(1.64)
-8.23**(-6.94)
Post NAFTA tariff level . . . . -0.12(-0.14)
-0.46(-0.34)
1.03(0.87)
Transport costs5 . . . . . . . . . -9.51**(-14.79)
-18.07**(-4.75)
-8.91**(-14.28)
Lagged import share . . . . . . 0.15**(28.43)
0.18**(13.02)
0.13**(23.01)
Peso/dollar exchange rate . -0.03(-0.28)
0.49**(2.78)
-0.22 {(-1.70)
Mexican export price6 . . . . . -0.36**(-9.34)
-0.01(-0.14)
-0.47**(-11.13)
Nominal effective exchangerate7 . . . . . . . . . . . . . . . . . . . . -0.01**
(-2.97)-0.01
(-1.36)-0.01*
(-2.54)World export price6 . . . . . . . 0.25**
(-2.97)-0.28**(-3.92)
0.45**(10.13)
Industry dummies8 . . . . . . . yes yes yes
Number of observations. . .R2 . . . . . . . . . . . . . . . . . . . . . .F-statistic . . . . . . . . . . . . . . .
61180.37
156.03**
21530.45
158.34**
39650.38
114.59**1 All variables in logs. Textiles and Apparel is defined as section 11 of the U.S. HTS;
apparel is HTS 61 and HTS62. Statistical significance levels of 1%, 5% , and 10% shown by**, *, and {, respectively.
2 Applied tariff on U.S. imports from world-applied tariff on U.S. imports from Mexico.3 Applied tariff on Mexico=import duties/customs value. Divergent responses to tariff in
apparel and textiles may be due to presence of quantitative restrictions on apparel prior toNAFTA.
4 The c.i.f. margin in percent. Calculated as c.i.f. import value/customs value.5 Unit values=customs value/quantity. Note that in apparel, Mexican unit values are
highly correlated with world unit values. If world unit values are omitted, a strong negativeresponse to Mexican unit values appears (with other results unchanged).
6 Decrease equals depreciation of peso.7 Constructed at the 2-digit HTS level.
Source: USITC.
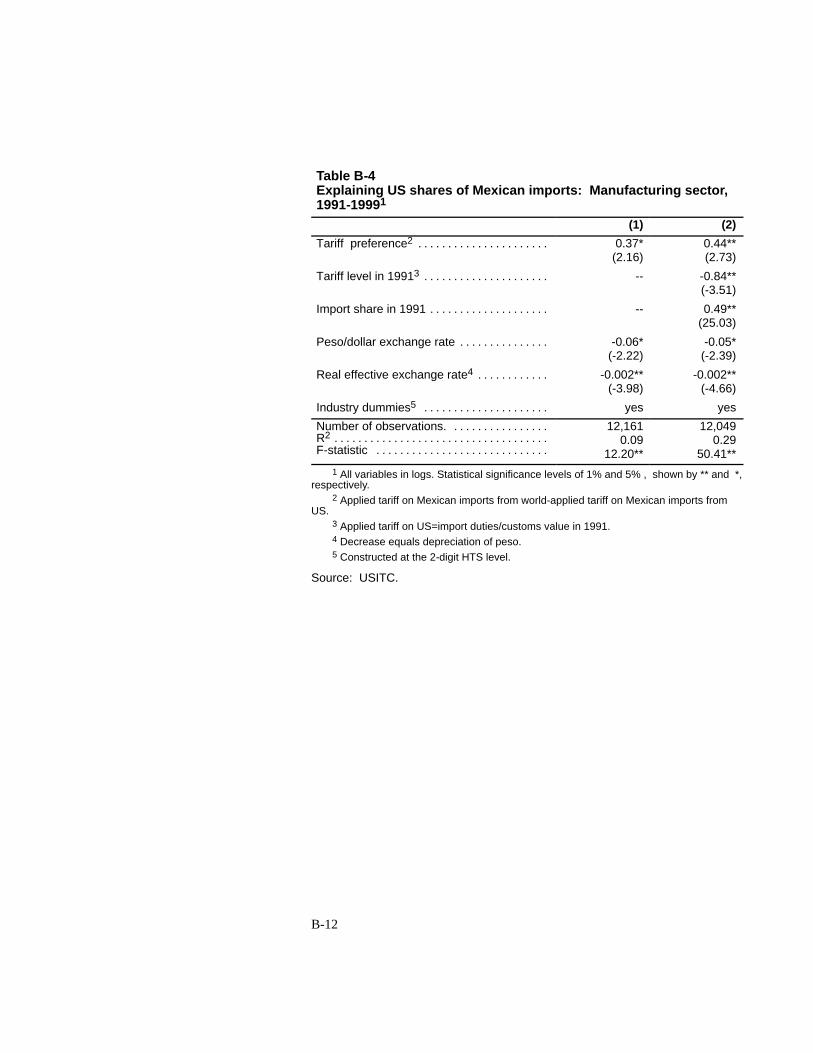
B-12
Table B-4Explaining US shares of Mexican imports: Manufacturing sector,1991-19991
(1) (2)
Tariff preference2 . . . . . . . . . . . . . . . . . . . . . . 0.37*(2.16)
0.44**(2.73)
Tariff level in 19913 . . . . . . . . . . . . . . . . . . . . . -- -0.84**(-3.51)
Import share in 1991 . . . . . . . . . . . . . . . . . . . . -- 0.49**(25.03)
Peso/dollar exchange rate . . . . . . . . . . . . . . . -0.06*(-2.22)
-0.05*(-2.39)
Real effective exchange rate4 . . . . . . . . . . . . -0.002**(-3.98)
-0.002**(-4.66)
Industry dummies5 . . . . . . . . . . . . . . . . . . . . . yes yes
Number of observations. . . . . . . . . . . . . . . . .R2 . . . . . . . . . . . . . . . . . . . . . . . . . . . . . . . . . . . .F-statistic . . . . . . . . . . . . . . . . . . . . . . . . . . . . .
12,1610.09
12.20**
12,0490.29
50.41**1 All variables in logs. Statistical significance levels of 1% and 5% , shown by ** and *,
respectively.2 Applied tariff on Mexican imports from world-applied tariff on Mexican imports from
US.3 Applied tariff on US=import duties/customs value in 1991.4 Decrease equals depreciation of peso.5 Constructed at the 2-digit HTS level.
Source: USITC.

APPENDIX CChapter 7 Technical Annex

TECHNICAL APPENDIX
Simulation Model Used in Chapter 7 forAnalysis of the Agreements Signed
Under Fast-track Authority
IntroductionThe tool used to analyze the economy in the absence of fast-track
liberalizations is a numeric general equilibrium model calibrated to theobserved trade flows and to macro- and microeconomic conditions of the U.S.economy over the historical period from 1978 to 2001.1 The numeric model isa mathematical representation of economic scarcity and exchange. Resourceand technological constraints interact with policy distortions to limit overallwelfare. For this exercise, resource endowments and technologies are heldconstant across the policy simulations. This generates a clean numericexperiment that controls for shocks that are contemporaneously correlated withpolicy changes. Only those impacts that are specifically (structurally) attributedto policy appear in the simulation. Thus, the technique employed is more akinto an ex ante technique applied to an ex post analysis of the agreements.
Model DescriptionGeneral equilibrium models simulate interactions among producers and
consumers within an economy in markets for goods, services, labor, andphysical capital. The distinguishing feature of the general equilibrium approachis its economywide coverage and multisectoral nature. The model employedhere explicitly accounts for upstream and downstream production linkages,intersectoral competition for labor and capital, and international price changes.Currently the model contains no intertemporal linkages; each year is solved asan independent static equilibrium. The key elements of the model can bedivided into four components that define the behavioral relationships: finaldemand behavior, production technology, factor supplies, and the tradeequilibrium.
1 Details of the data and construction of the social accounts can be found in EdwardJ. Balistreri and Alan K. Fox, “TSCAPE: a Time Series of Consistent Accounts forPolicy Evaluation,” USITC working paper 2003-5-A, 2003.
Final Demand BehaviorThe model considers three separate components of domestic final demand:
household consumption, government demand, and investment demand.Household consumption is dictated by Cobb-Douglas utility over each product.The other components of final demand are fixed exogenously at their baselinelevels; real government spending and investment are held constant. Householdconsumption is subject to a budget constraint equal to the sum of factorincomes, net capital flows, and tariff revenues, less investment and governmentspending.
Holding government spending fixed is consistent with welfare analysisunder the assumption of separability of private consumption and publiclyprovided goods in the household utility function. The separability assumption isnecessary in the absence of information about the total net benefit associatedwith government provision of public goods. The model assumes that changesin government outlays (due to changes in tariff policy) are lump-sumredistributed to households. Using distortionary tax instruments (such as labortax rates) to redistribute additional tariff revenues might decrease or increasethe estimated welfare impacts in the scenarios. This depends on the marginalcost of public funds generated by the tax instruments, and the tariffs, inquestion.2
Holding aggregate investment constant in the specification abstracts fromissues of substitution between present and future consumption. This assumptionis appropriate for static welfare comparisons, but might seem awkward in ananalysis that covers multiple time periods. The analysis here, however, is aseries of static equilibria, not a dynamic model that considers capitalaccumulation. This approach might best be described as a recursive-staticexercise. In each time period the capital stock is assumed fixed. Althoughbeyond the scope of analysis here, relaxation of these assumptions might revealimportant insights into the adjustment dynamics associated with trade policy.
Production TechnologyProduction technology is modeled using a nested constant elasticity of
substitution (CES) value- added function.3 Figure C-1 illustrates the productiontechnology. At the bottom of the figure, inputs are combined to producesectoral output Xj. In the value added nest, capital and labor substitute for oneanother at a rate fj. Domestic outputs of commodity i produced by sector j, Dji,
2 See Charles L. Ballard and Don Fullerton, “Distortionary Taxes and the Provisionof Public Goods,” Journal of Economic Perspectives, vol. 6, no. 3, pp. 117-131, 1992.
3 For an introduction to CES production functions, see ch. 9 of P. R. G. Layard andA. A. Walters, Microeconomic Theory (New York: McGraw-Hill, 1978);, and ch. 9 of E.Silberberg, The Structure of Economics (New York: McGraw-Hill, 1990);, and ch. 9 ofJ. W. Chung, Utility and Production Functions: Theory and Applications (Cambridge,MA: Blackwell Publishers, 1994).
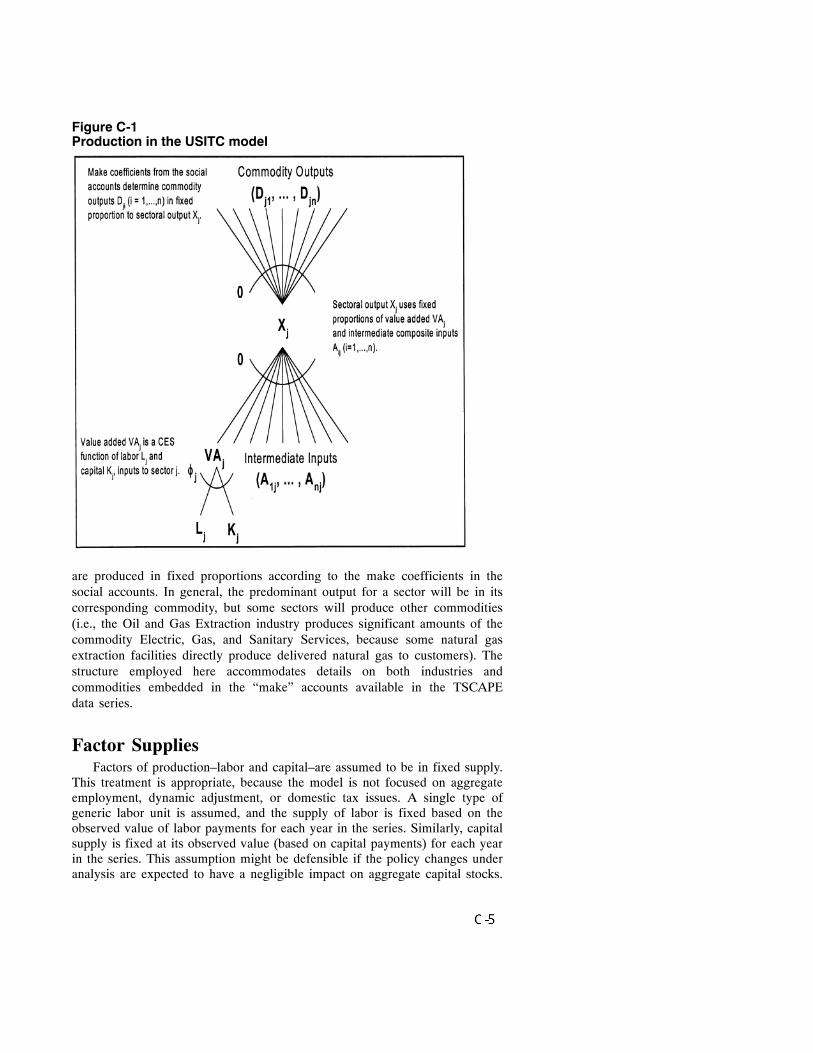
Figure C-1Production in the USITC model
are produced in fixed proportions according to the make coefficients in thesocial accounts. In general, the predominant output for a sector will be in itscorresponding commodity, but some sectors will produce other commodities(i.e., the Oil and Gas Extraction industry produces significant amounts of thecommodity Electric, Gas, and Sanitary Services, because some natural gasextraction facilities directly produce delivered natural gas to customers). Thestructure employed here accommodates details on both industries andcommodities embedded in the “make” accounts available in the TSCAPEdata series.
Factor SuppliesFactors of production–labor and capital–are assumed to be in fixed supply.
This treatment is appropriate, because the model is not focused on aggregateemployment, dynamic adjustment, or domestic tax issues. A single type ofgeneric labor unit is assumed, and the supply of labor is fixed based on theobserved value of labor payments for each year in the series. Similarly, capitalsupply is fixed at its observed value (based on capital payments) for each yearin the series. This assumption might be defensible if the policy changes underanalysis are expected to have a negligible impact on aggregate capital stocks.
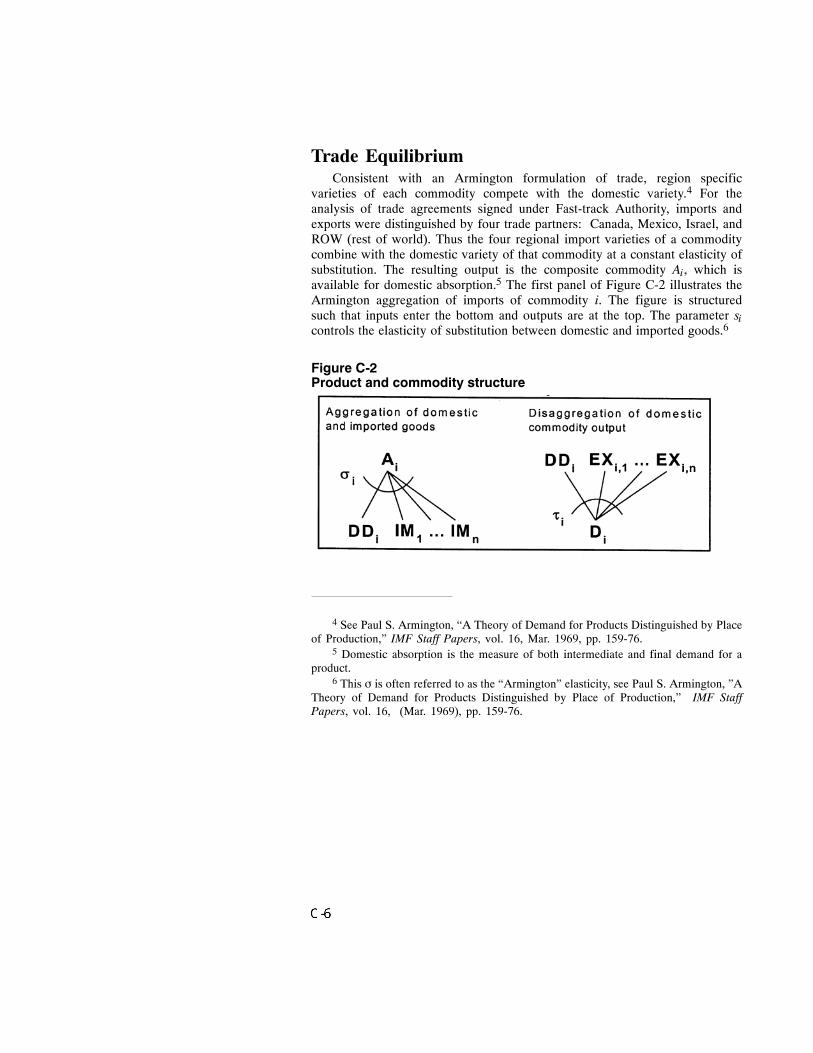
Trade EquilibriumConsistent with an Armington formulation of trade, region specific
varieties of each commodity compete with the domestic variety.4 For theanalysis of trade agreements signed under Fast-track Authority, imports andexports were distinguished by four trade partners: Canada, Mexico, Israel, andROW (rest of world). Thus the four regional import varieties of a commoditycombine with the domestic variety of that commodity at a constant elasticity ofsubstitution. The resulting output is the composite commodity Ai, which isavailable for domestic absorption.5 The first panel of Figure C-2 illustrates theArmington aggregation of imports of commodity i. The figure is structuredsuch that inputs enter the bottom and outputs are at the top. The parameter sicontrols the elasticity of substitution between domestic and imported goods.6
Figure C-2Product and commodity structure
4 See Paul S. Armington, “A Theory of Demand for Products Distinguished by Placeof Production,” IMF Staff Papers, vol. 16, Mar. 1969, pp. 159-76.
5 Domestic absorption is the measure of both intermediate and final demand for aproduct.
6 This σ is often referred to as the “Armington” elasticity, see Paul S. Armington, ”ATheory of Demand for Products Distinguished by Place of Production,” IMF StaffPapers, vol. 16, (Mar. 1969), pp. 159-76.
U.S. commodity output is illustrated in the right panel of figure C-2. Direpresents total output of commodity i. Total output Di is then disaggregatedinto domestic market supply (DDi) and international market supply (EXi,r)according to a constant elasticity-of-transformation (CET) function. The CETparameter τi controls the export supply response.
Response ParametersIn addition to establishing the baseline data (TSCAPE), the model depends
on a set of response parameters. These parameters establish behavioralresponses to price changes. A key response parameter governing model resultsis the elasticity of substitution between domestic and foreign varieties of agiven commodity. Estimates of these parameters are taken from econometricliterature on international trade.7
7 David Hummels (Professor of Economics, Purdue University) uses U.S. data ontrade and trade costs to estimate the degree to which trade flows change with changes intrade costs. The simulation model uses Hummels’ estimates, at the one-digit level, tomap trade policy changes into trade flow changes. The one-digit estimates were obtainedthrough personal correspondence with David Hummels. The estimation methodology canbe found in David Hummels’ paper, “Toward a Geography of Trade Costs” (Mimeo,Purdue University, 2000).


APPENDIX DChapter 8 Technical Annex

D-2
D-3
This technical appendix contains the details of the calculations reported inchapter 8. Two technical exercises were undertaken in chapter 8: aneconometric study of the effect of tariff and other trade cost changes on importvariety, and a simulation exercise that measures welfare changes in aneconomic model in which import variety is endogenous to the level of thetariff. The primary purpose of the simulation exercise is to demonstrate therelative magnitude of two sources of welfare gains from trade liberalization,relative price changes and the entry of new product varieties.
The first portion of the technical summary outlines the econometricprocedure and characterizes the regression results. Detailed econometric resultsare reported in tables D3-D6. The second section of the technical appendixdescribes the model used to measure welfare changes associated with increasedproduct variety.
Econometrics
Methodological ApproachThe econometric model is straightforward. It relates changes in the number
of import sources in a given commodity with changes in tariff levels and infreight costs facing that commodity. Estimated coefficients on changes in tariffrates provide an estimate of how tariff changes are linked to changes in thenumber of import sources per commodity. A regression constant measures thenumber of new sources per commodity that are not linked to changes in tariffsor freight charges.
The econometric specification is as follows:
where ∆Countk is the change in the number of U.S. import sources incommodity k between 1978 and 2001, α is a regression constant, ∆tariffk andare ∆freightk changes in the measured ad valorem tariff and freight rates forcommodity k, and εk is a randomly distributed error term.1 The regressioncoefficients, β1 and β2, are estimates of the degree to which changes intariffs and freight rates explain changes in the number of import sources percommodity.
Implicit in the estimating strategy defined in equation 1 is the hypothesisthat no variables correlated with tariffs and freight charges are excluded fromthe regression. If reductions in non-tariff barriers have increased productvariety, and non-tariff barriers are positively correlated with tariffs, the
1 The error is assumed to be heteroskedastic. The regression procedures use theWhite estimation technique to account for heteroskedasticity.
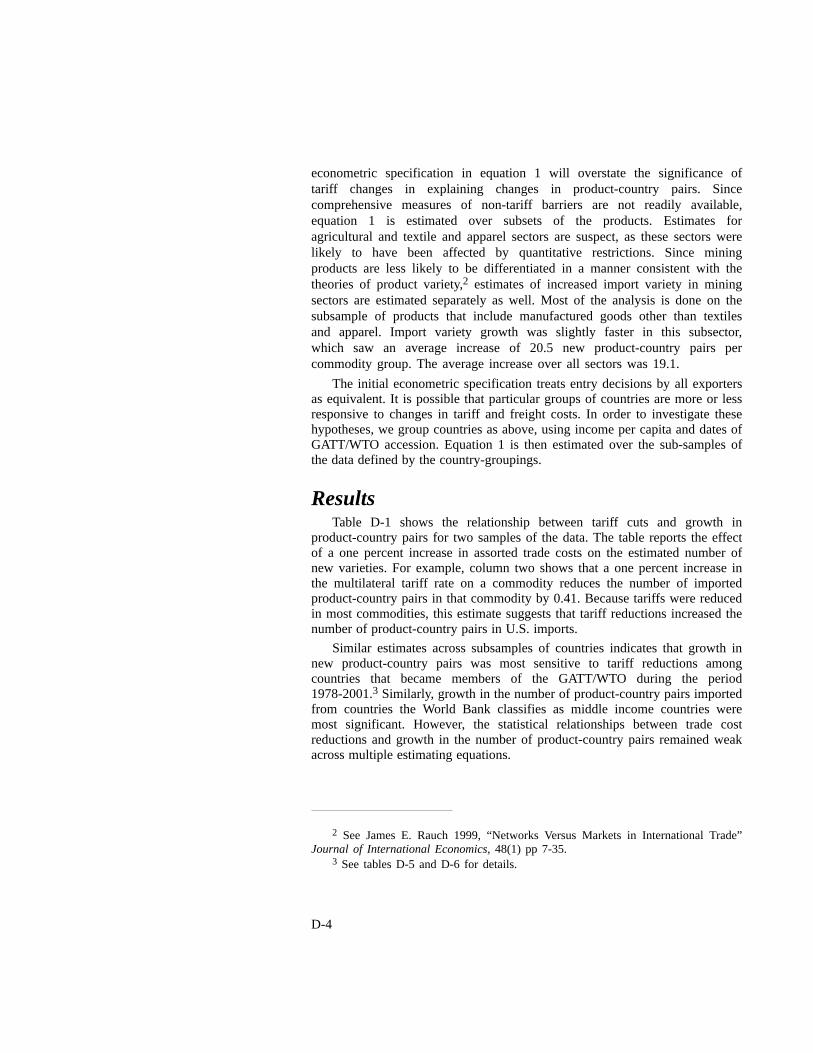
D-4
econometric specification in equation 1 will overstate the significance oftariff changes in explaining changes in product-country pairs. Sincecomprehensive measures of non-tariff barriers are not readily available,equation 1 is estimated over subsets of the products. Estimates foragricultural and textile and apparel sectors are suspect, as these sectors werelikely to have been affected by quantitative restrictions. Since miningproducts are less likely to be differentiated in a manner consistent with thetheories of product variety,2 estimates of increased import variety in miningsectors are estimated separately as well. Most of the analysis is done on thesubsample of products that include manufactured goods other than textilesand apparel. Import variety growth was slightly faster in this subsector,which saw an average increase of 20.5 new product-country pairs percommodity group. The average increase over all sectors was 19.1.
The initial econometric specification treats entry decisions by all exportersas equivalent. It is possible that particular groups of countries are more or lessresponsive to changes in tariff and freight costs. In order to investigate thesehypotheses, we group countries as above, using income per capita and dates ofGATT/WTO accession. Equation 1 is then estimated over the sub-samples ofthe data defined by the country-groupings.
ResultsTable D-1 shows the relationship between tariff cuts and growth in
product-country pairs for two samples of the data. The table reports the effectof a one percent increase in assorted trade costs on the estimated number ofnew varieties. For example, column two shows that a one percent increase inthe multilateral tariff rate on a commodity reduces the number of importedproduct-country pairs in that commodity by 0.41. Because tariffs were reducedin most commodities, this estimate suggests that tariff reductions increased thenumber of product-country pairs in U.S. imports.
Similar estimates across subsamples of countries indicates that growth innew product-country pairs was most sensitive to tariff reductions amongcountries that became members of the GATT/WTO during the period1978-2001.3 Similarly, growth in the number of product-country pairs importedfrom countries the World Bank classifies as middle income countries weremost significant. However, the statistical relationships between trade costreductions and growth in the number of product-country pairs remained weakacross multiple estimating equations.
2 See James E. Rauch 1999, “Networks Versus Markets in International Trade”Journal of International Economics, 48(1) pp 7-35.
3 See tables D-5 and D-6 for details.
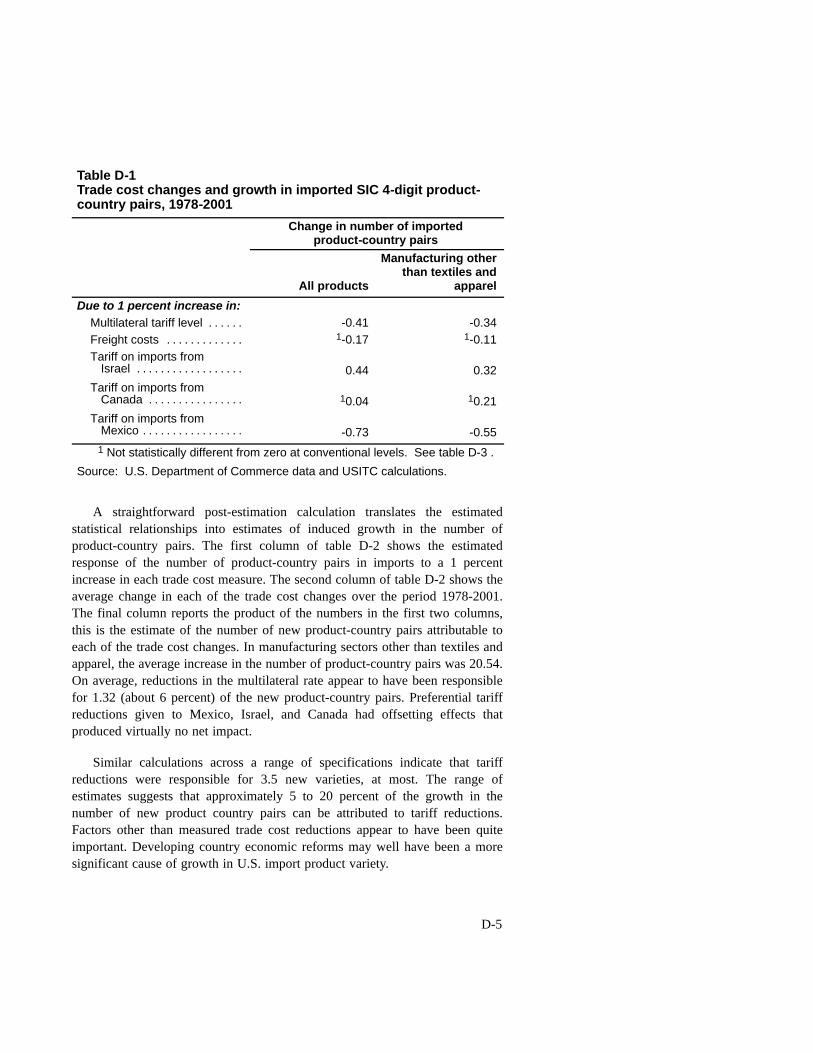
D-5
Table D-1Trade cost changes and growth in imported SIC 4-digit product-country pairs, 1978-2001
Change in number of importedproduct-country pairs
All products
Manufacturing otherthan textiles and
apparel
Due to 1 percent increase in:Multilateral tariff level . . . . . . -0.41 -0.34Freight costs . . . . . . . . . . . . . 1-0.17 1-0.11Tariff on imports from
Israel . . . . . . . . . . . . . . . . . . 0.44 0.32Tariff on imports from
Canada . . . . . . . . . . . . . . . . 10.04 10.21Tariff on imports from
Mexico . . . . . . . . . . . . . . . . . -0.73 -0.551 Not statistically different from zero at conventional levels. See table D-3 .
Source: U.S. Department of Commerce data and USITC calculations.
A straightforward post-estimation calculation translates the estimatedstatistical relationships into estimates of induced growth in the number ofproduct-country pairs. The first column of table D-2 shows the estimatedresponse of the number of product-country pairs in imports to a 1 percentincrease in each trade cost measure. The second column of table D-2 shows theaverage change in each of the trade cost changes over the period 1978-2001.The final column reports the product of the numbers in the first two columns,this is the estimate of the number of new product-country pairs attributable toeach of the trade cost changes. In manufacturing sectors other than textiles andapparel, the average increase in the number of product-country pairs was 20.54.On average, reductions in the multilateral rate appear to have been responsiblefor 1.32 (about 6 percent) of the new product-country pairs. Preferential tariffreductions given to Mexico, Israel, and Canada had offsetting effects thatproduced virtually no net impact.
Similar calculations across a range of specifications indicate that tariffreductions were responsible for 3.5 new varieties, at most. The range ofestimates suggests that approximately 5 to 20 percent of the growth in thenumber of new product country pairs can be attributed to tariff reductions.Factors other than measured trade cost reductions appear to have been quiteimportant. Developing country economic reforms may well have been a moresignificant cause of growth in U.S. import product variety.
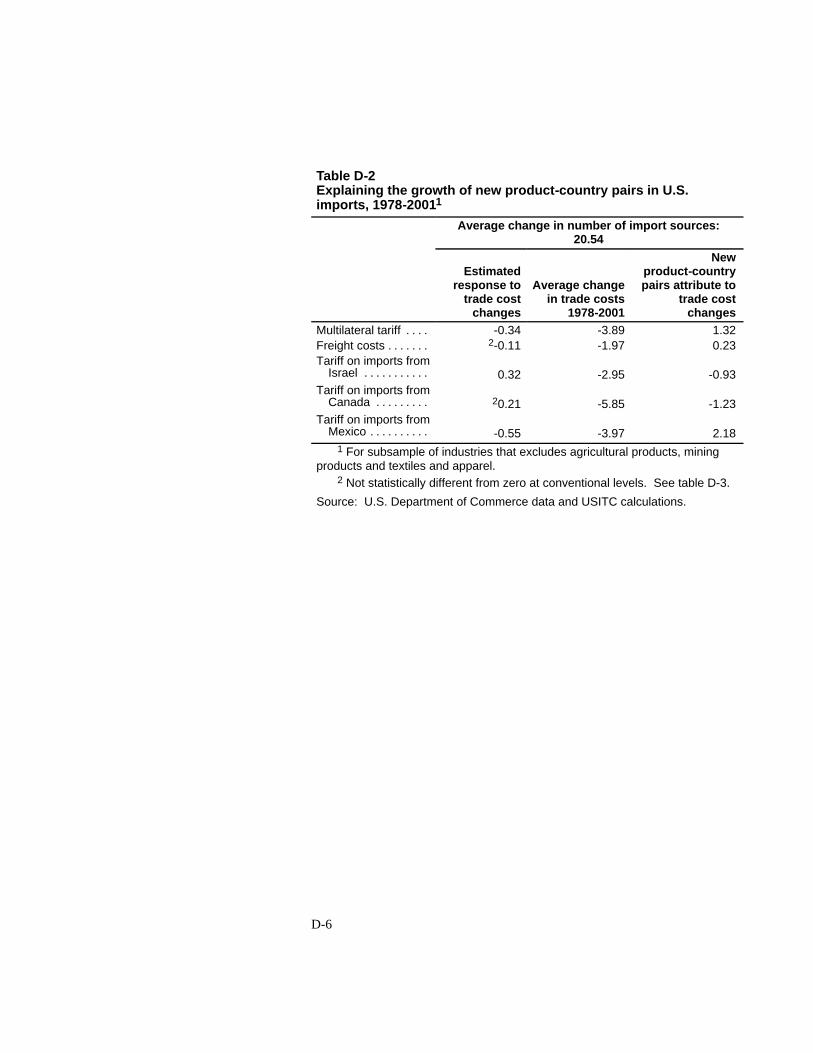
D-6
Table D-2Explaining the growth of new product-country pairs in U.S.imports, 1978-20011
Average change in number of import sources:20.54
Estimatedresponse to
trade costchanges
Average changein trade costs
1978-2001
Newproduct-countrypairs attribute to
trade costchanges
Multilateral tariff . . . . -0.34 -3.89 1.32Freight costs . . . . . . . 2-0.11 -1.97 0.23Tariff on imports from
Israel . . . . . . . . . . . 0.32 -2.95 -0.93Tariff on imports from
Canada . . . . . . . . . 20.21 -5.85 -1.23Tariff on imports from
Mexico . . . . . . . . . . -0.55 -3.97 2.181 For subsample of industries that excludes agricultural products, mining
products and textiles and apparel.2 Not statistically different from zero at conventional levels. See table D-3.
Source: U.S. Department of Commerce data and USITC calculations.
D-7
Detailed Econometric TablesTable D-3Regression of import variety changes on trade cost changes for allsectors and for industry subsectors1
Commoditiesincluded insample
all SIC 4sectors
agriculturalgoods2
miningproducts3
textilesand
apparel4
manufac-turingotherthan
textilesand
apparel5
Constant . . . . . . . 15.20**(1.22)
2.19(3.13)
-8.15(5.38)
26.60(5.75)
18.97**(1.14)
Change inmultilateraltariff6 . . . . . . . . -0.41**
(0.15)1.56
(1.06)43.14**(13.97)
0.77(0.70)
-0.34*(0.16)
freight costs7 . -0.17(0.17)
0.06(0.23)
-0.79{(0.41)
0.61(1.07)
-0.11(0.23)
Israel tariff . . . . 0.44**(0.11)
0.77(0.53)
-40.90*(13.47)
0.83{(0.43)
0.32**(0.10)
Canada tariff . . 0.04(0.20)
-0.90(0.46)
-0.49(1.03)
0.54(0.54)
0.21(0.21)
Mexico tariff . . -0.73**(0.15)
-1.03(1.01
-5.22(4.87)
-1.64**(0.46)
-0.55**(0.18)
Number ofobservations. . . .R2 . . . . . . . . . . . . .F-statistic . . . . . .
3880.10
12.97**
290.121.51
190.577.4**
390.29
3.21*
3010.04
5.73**1 Statistical significance levels of 1%, 5%, and 10% shown by **, *, and {,
respectively.2 Products with SIC4 classification numbers less than 1000.3 Products with SIC4 classification numbers 1000-1499.4 Products with SIC4 classification numbers 2200-2399.5 Products with SIC4 classification numbers above 2000, except for textiles and
apparel sectors.6 Calculated as (Collected duties - duties collected on imports from Israel,
Canada and Mexico)/(Value of imports - Value of imports from Israel, Canada andMexico).
7 Calculated as (CIF value - customs value)/ CIF value.
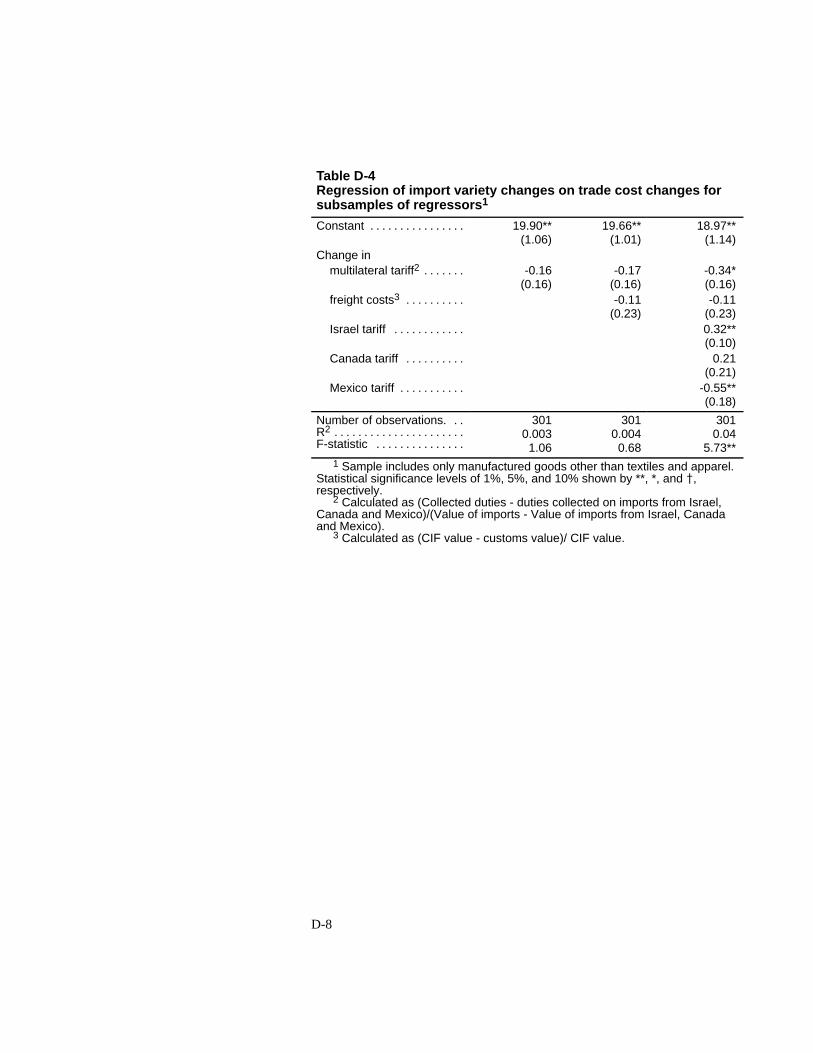
D-8
Table D-4Regression of import variety changes on trade cost changes forsubsamples of regressors1
Constant . . . . . . . . . . . . . . . . 19.90**(1.06)
19.66**(1.01)
18.97**(1.14)
Change inmultilateral tariff2 . . . . . . . -0.16
(0.16)-0.17
(0.16)-0.34*(0.16)
freight costs3 . . . . . . . . . . -0.11(0.23)
-0.11(0.23)
Israel tariff . . . . . . . . . . . . 0.32**(0.10)
Canada tariff . . . . . . . . . . 0.21(0.21)
Mexico tariff . . . . . . . . . . . -0.55**(0.18)
Number of observations. . .R2 . . . . . . . . . . . . . . . . . . . . . .F-statistic . . . . . . . . . . . . . . .
3010.0031.06
3010.0040.68
3010.04
5.73**1 Sample includes only manufactured goods other than textiles and apparel.
Statistical significance levels of 1%, 5%, and 10% shown by **, *, and {,respectively.
2 Calculated as (Collected duties - duties collected on imports from Israel,Canada and Mexico)/(Value of imports - Value of imports from Israel, Canadaand Mexico).
3 Calculated as (CIF value - customs value)/ CIF value.
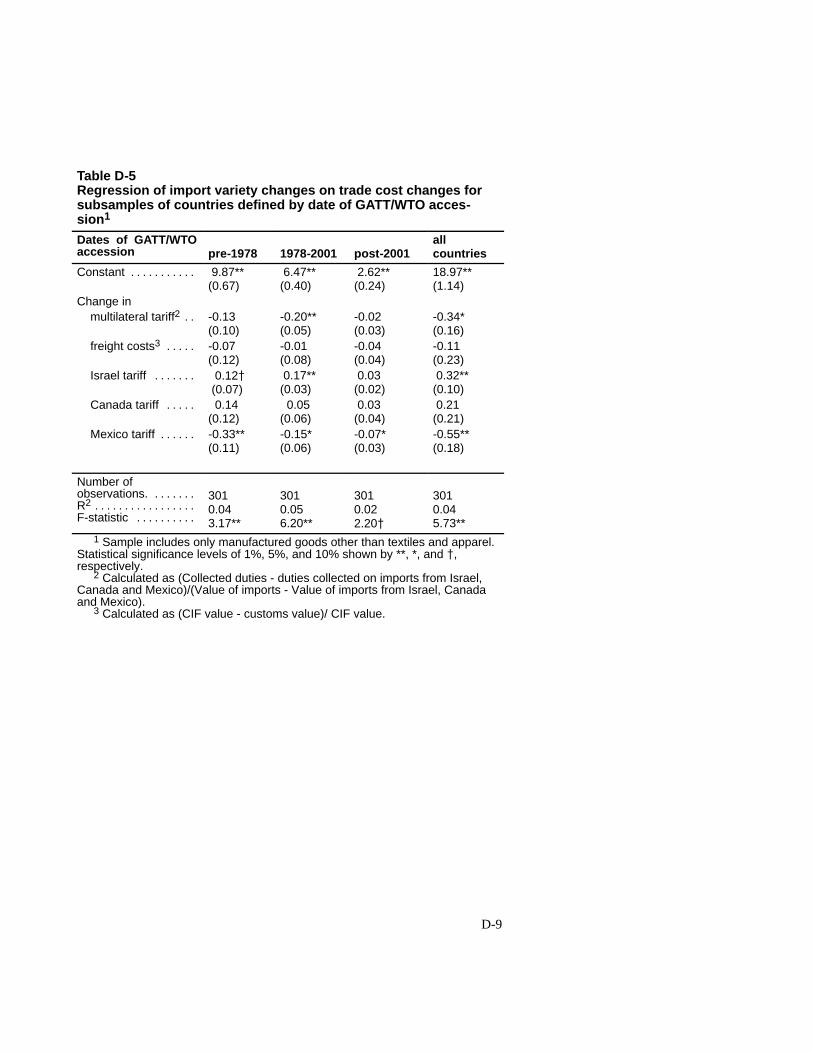
D-9
Table D-5Regression of import variety changes on trade cost changes forsubsamples of countries defined by date of GATT/WTO acces-sion1
Dates of GATT/WTOaccession pre-1978 1978-2001 post-2001
allcountries
Constant . . . . . . . . . . . 9.87**(0.67)
6.47**(0.40)
2.62**(0.24)
18.97**(1.14)
Change inmultilateral tariff2 . . -0.13
(0.10)-0.20**(0.05)
-0.02(0.03)
-0.34*(0.16)
freight costs3 . . . . . -0.07(0.12)
-0.01(0.08)
-0.04(0.04)
-0.11(0.23)
Israel tariff . . . . . . . 0.12{(0.07)
0.17**(0.03)
0.03(0.02)
0.32**(0.10)
Canada tariff . . . . . 0.14(0.12)
0.05(0.06)
0.03(0.04)
0.21(0.21)
Mexico tariff . . . . . . -0.33**(0.11)
-0.15*(0.06)
-0.07*(0.03)
-0.55**(0.18)
Number ofobservations. . . . . . . .R2 . . . . . . . . . . . . . . . . .F-statistic . . . . . . . . . .
3010.043.17**
3010.056.20**
3010.022.20{
3010.045.73**
1 Sample includes only manufactured goods other than textiles and apparel.Statistical significance levels of 1%, 5%, and 10% shown by **, *, and {,respectively.
2 Calculated as (Collected duties - duties collected on imports from Israel,Canada and Mexico)/(Value of imports - Value of imports from Israel, Canadaand Mexico).
3 Calculated as (CIF value - customs value)/ CIF value.
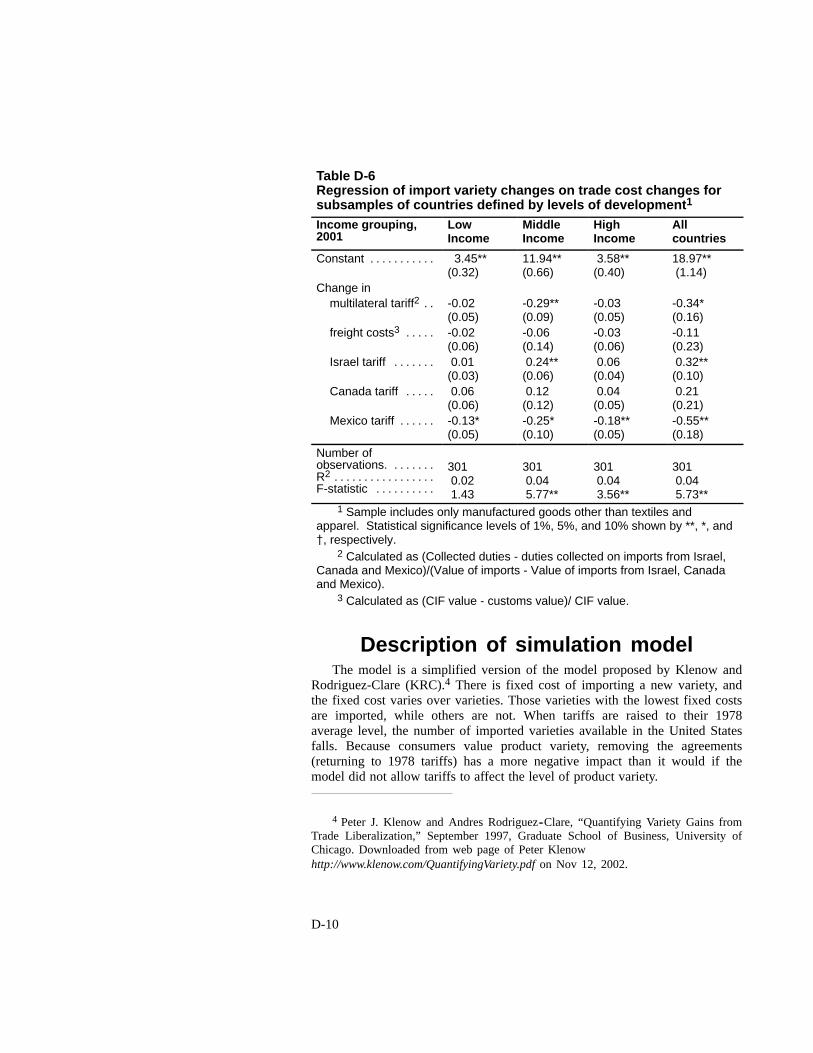
D-10
Table D-6Regression of import variety changes on trade cost changes forsubsamples of countries defined by levels of development1
Income grouping,2001
LowIncome
MiddleIncome
HighIncome
Allcountries
Constant . . . . . . . . . . . 3.45**(0.32)
11.94**(0.66)
3.58**(0.40)
18.97**(1.14)
Change inmultilateral tariff2 . . -0.02
(0.05)-0.29**(0.09)
-0.03(0.05)
-0.34*(0.16)
freight costs3 . . . . . -0.02(0.06)
-0.06(0.14)
-0.03(0.06)
-0.11(0.23)
Israel tariff . . . . . . . 0.01(0.03)
0.24**(0.06)
0.06(0.04)
0.32**(0.10)
Canada tariff . . . . . 0.06(0.06)
0.12(0.12)
0.04(0.05)
0.21(0.21)
Mexico tariff . . . . . . -0.13*(0.05)
-0.25*(0.10)
-0.18**(0.05)
-0.55**(0.18)
Number ofobservations. . . . . . . .R2 . . . . . . . . . . . . . . . . .F-statistic . . . . . . . . . .
3010.021.43
3010.045.77**
3010.043.56**
3010.045.73**
1 Sample includes only manufactured goods other than textiles andapparel. Statistical significance levels of 1%, 5%, and 10% shown by **, *, and{, respectively.
2 Calculated as (Collected duties - duties collected on imports from Israel,Canada and Mexico)/(Value of imports - Value of imports from Israel, Canadaand Mexico).
3 Calculated as (CIF value - customs value)/ CIF value.
Description of simulation modelThe model is a simplified version of the model proposed by Klenow and
Rodriguez-Clare (KRC).4 There is fixed cost of importing a new variety, andthe fixed cost varies over varieties. Those varieties with the lowest fixed costsare imported, while others are not. When tariffs are raised to their 1978average level, the number of imported varieties available in the United Statesfalls. Because consumers value product variety, removing the agreements(returning to 1978 tariffs) has a more negative impact than it would if themodel did not allow tariffs to affect the level of product variety.
4 Peter J. Klenow and Andres Rodriguez--Clare, “Quantifying Variety Gains fromTrade Liberalization,” September 1997, Graduate School of Business, University ofChicago. Downloaded from web page of Peter Klenowhttp://www.klenow.com/QuantifyingVariety.pdf on Nov 12, 2002.
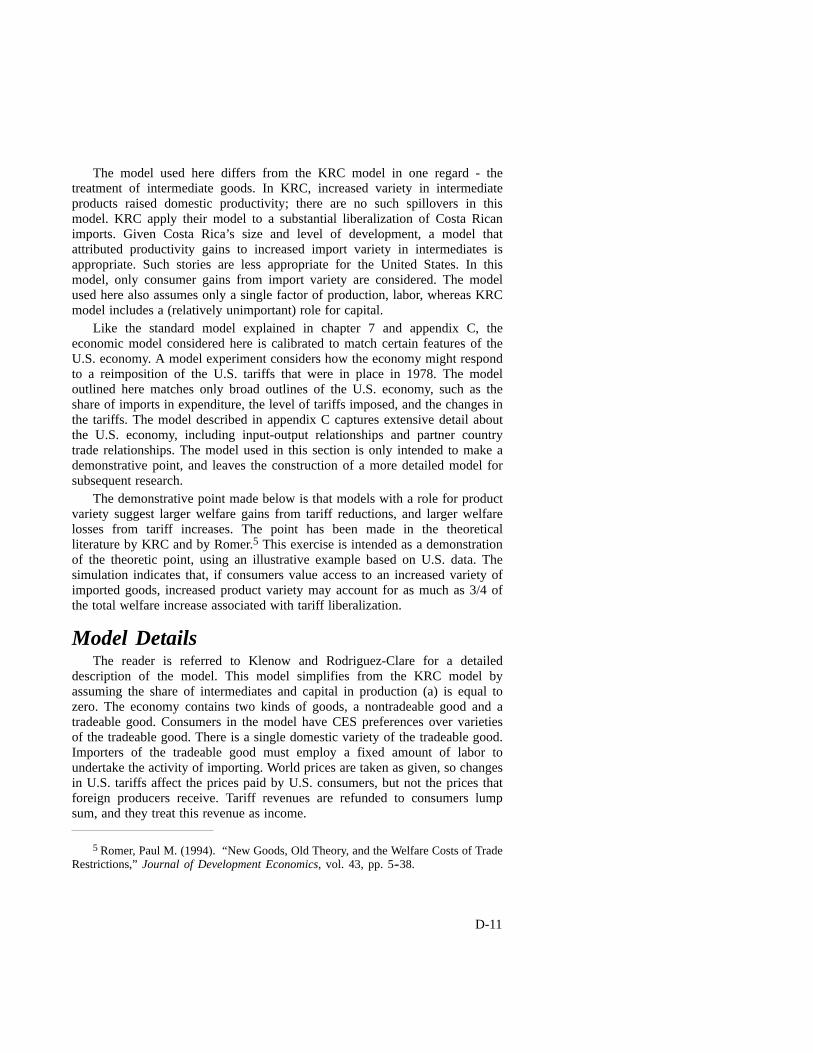
D-11
The model used here differs from the KRC model in one regard - thetreatment of intermediate goods. In KRC, increased variety in intermediateproducts raised domestic productivity; there are no such spillovers in thismodel. KRC apply their model to a substantial liberalization of Costa Ricanimports. Given Costa Rica’s size and level of development, a model thatattributed productivity gains to increased import variety in intermediates isappropriate. Such stories are less appropriate for the United States. In thismodel, only consumer gains from import variety are considered. The modelused here also assumes only a single factor of production, labor, whereas KRCmodel includes a (relatively unimportant) role for capital.
Like the standard model explained in chapter 7 and appendix C, theeconomic model considered here is calibrated to match certain features of theU.S. economy. A model experiment considers how the economy might respondto a reimposition of the U.S. tariffs that were in place in 1978. The modeloutlined here matches only broad outlines of the U.S. economy, such as theshare of imports in expenditure, the level of tariffs imposed, and the changes inthe tariffs. The model described in appendix C captures extensive detail aboutthe U.S. economy, including input-output relationships and partner countrytrade relationships. The model used in this section is only intended to make ademonstrative point, and leaves the construction of a more detailed model forsubsequent research.
The demonstrative point made below is that models with a role for productvariety suggest larger welfare gains from tariff reductions, and larger welfarelosses from tariff increases. The point has been made in the theoreticalliterature by KRC and by Romer.5 This exercise is intended as a demonstrationof the theoretic point, using an illustrative example based on U.S. data. Thesimulation indicates that, if consumers value access to an increased variety ofimported goods, increased product variety may account for as much as 3/4 ofthe total welfare increase associated with tariff liberalization.
Model DetailsThe reader is referred to Klenow and Rodriguez-Clare for a detailed
description of the model. This model simplifies from the KRC model byassuming the share of intermediates and capital in production (a) is equal tozero. The economy contains two kinds of goods, a nontradeable good and atradeable good. Consumers in the model have CES preferences over varietiesof the tradeable good. There is a single domestic variety of the tradeable good.Importers of the tradeable good must employ a fixed amount of labor toundertake the activity of importing. World prices are taken as given, so changesin U.S. tariffs affect the prices paid by U.S. consumers, but not the prices thatforeign producers receive. Tariff revenues are refunded to consumers lumpsum, and they treat this revenue as income.
5 Romer, Paul M. (1994). “New Goods, Old Theory, and the Welfare Costs of TradeRestrictions,” Journal of Development Economics, vol. 43, pp. 5--38.
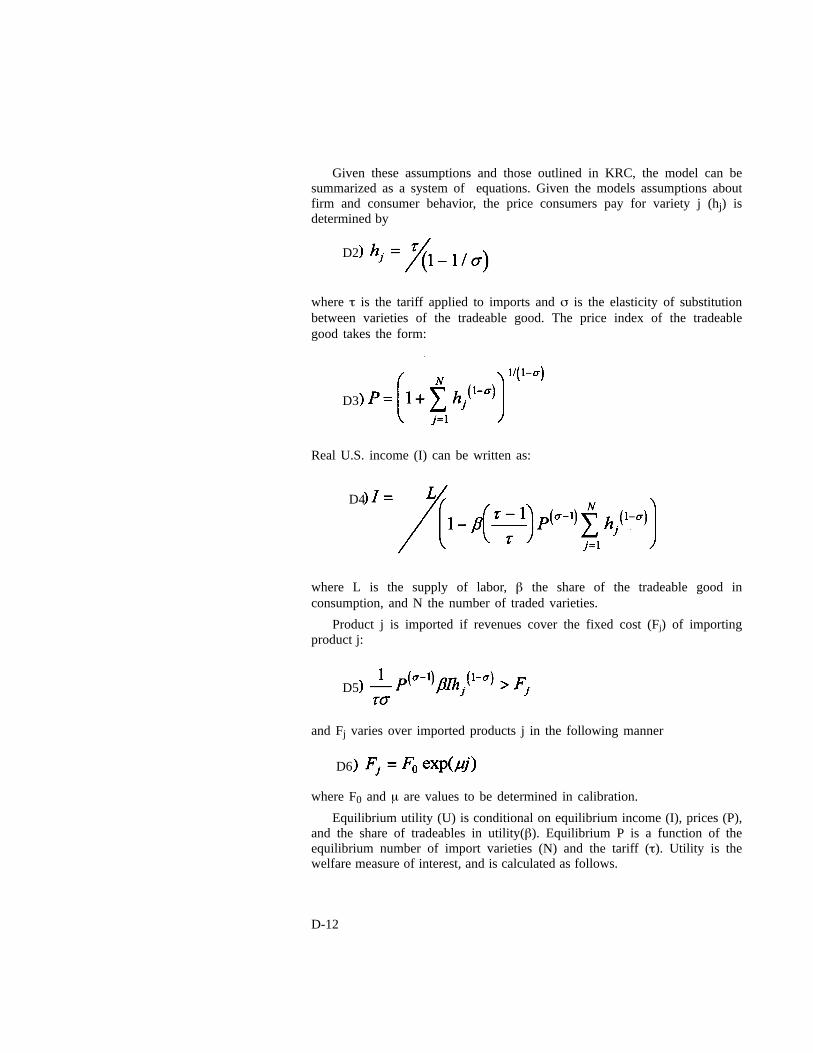
D-12
Given these assumptions and those outlined in KRC, the model can besummarized as a system of equations. Given the models assumptions aboutfirm and consumer behavior, the price consumers pay for variety j (hj) isdetermined by
D2
where τ is the tariff applied to imports and σ is the elasticity of substitutionbetween varieties of the tradeable good. The price index of the tradeablegood takes the form:
D3
Real U.S. income (I) can be written as:
D4
where L is the supply of labor, β the share of the tradeable good inconsumption, and N the number of traded varieties.
Product j is imported if revenues cover the fixed cost (Fj) of importingproduct j:
D5
and Fj varies over imported products j in the following manner
D6
where F0 and µ are values to be determined in calibration.
Equilibrium utility (U) is conditional on equilibrium income (I), prices (P),and the share of tradeables in utility(β). Equilibrium P is a function of theequilibrium number of import varieties (N) and the tariff (τ). Utility is thewelfare measure of interest, and is calculated as follows.
D-13
D7
The Simulation ExperimentAs in the simulation experiment in chapter 7, the model is used to measure
the effect of imposing 1978 tariffs on a representation of the 2001 economy.Under the assumption that the model of economic behavior is correct, this typeof experiment produces a simulated environment that represents the world as itwould have existed had the U.S. not reduced its tariffs. The (simple) averagetariff on 4 digit commodities in 2001 was 2.7 percent. In 1978, that value was7.1 percent. Econometric evidence outlined in chapter 8 suggests that thesetariff cuts induced import growth of between 1 and 3.5 new varieties. Themodel is calibrated so that the simulated tariff increase from 2.7 to 7.1 percenteliminates 3 varieties from the import bundle.6
Calibration DetailsThe model is calibrated through the choice of parameter values that reflect
specific features of the U.S. economy, and then free parameters are chosensuch that 3 fewer varieties are imported at the 7.1 percent tariff than at the 2.7percent tariff. The parametric inputs are reported in table D-7.
6 This reflects the upper range of the 1-3.5 range. Because the experiment is aimed atidentifying possible upper bounds on variety type effects, the largest discrete number inthis range is chosen as a calibration input.
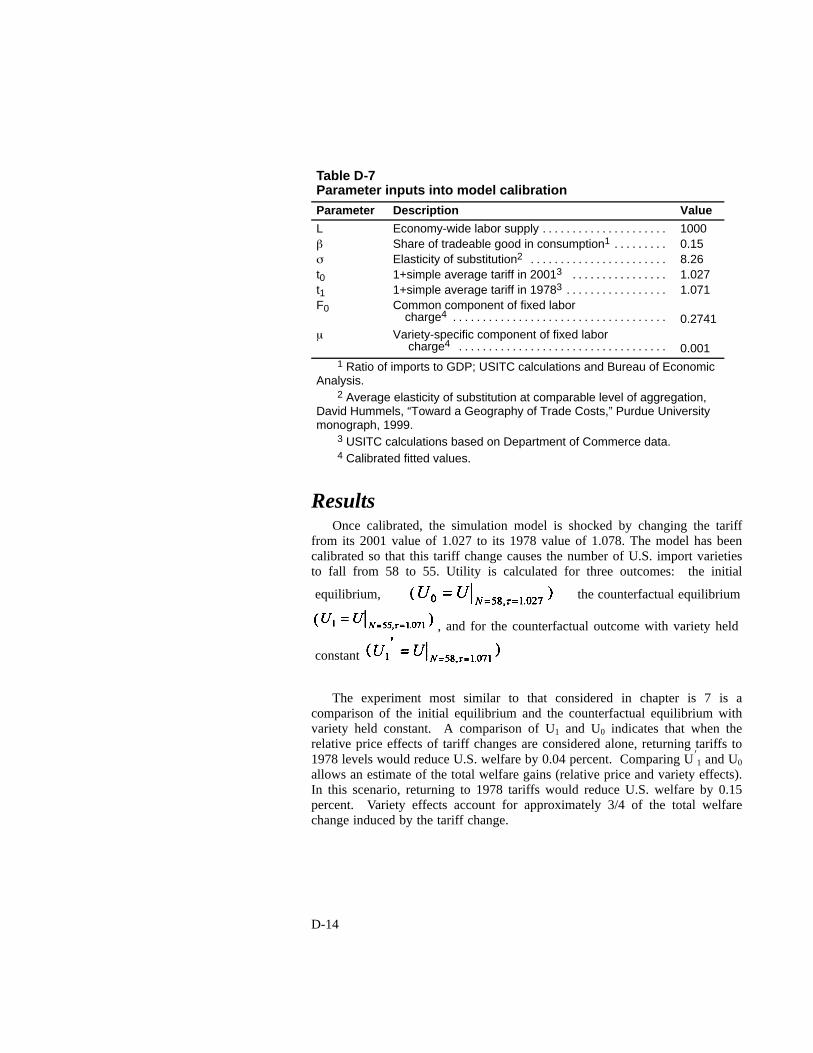
D-14
Table D-7Parameter inputs into model calibrationParameter Description Value
L Economy-wide labor supply . . . . . . . . . . . . . . . . . . . . . 1000β Share of tradeable good in consumption1 . . . . . . . . . 0.15σ Elasticity of substitution2 . . . . . . . . . . . . . . . . . . . . . . . 8.26t0 1+simple average tariff in 20013 . . . . . . . . . . . . . . . . 1.027t1 1+simple average tariff in 19783 . . . . . . . . . . . . . . . . . 1.071F0 Common component of fixed labor
charge4 . . . . . . . . . . . . . . . . . . . . . . . . . . . . . . . . . . . . 0.2741µ Variety-specific component of fixed labor
charge4 . . . . . . . . . . . . . . . . . . . . . . . . . . . . . . . . . . . 0.0011 Ratio of imports to GDP; USITC calculations and Bureau of Economic
Analysis.2 Average elasticity of substitution at comparable level of aggregation,
David Hummels, “Toward a Geography of Trade Costs,” Purdue Universitymonograph, 1999.
3 USITC calculations based on Department of Commerce data.4 Calibrated fitted values.
ResultsOnce calibrated, the simulation model is shocked by changing the tariff
from its 2001 value of 1.027 to its 1978 value of 1.078. The model has beencalibrated so that this tariff change causes the number of U.S. import varietiesto fall from 58 to 55. Utility is calculated for three outcomes: the initial
equilibrium, the counterfactual equilibrium
, and for the counterfactual outcome with variety held
constant
The experiment most similar to that considered in chapter is 7 is acomparison of the initial equilibrium and the counterfactual equilibrium withvariety held constant. A comparison of U1 and U0 indicates that when therelative price effects of tariff changes are considered alone, returning tariffs to1978 levels would reduce U.S. welfare by 0.04 percent. Comparing Ui1 and U0
allows an estimate of the total welfare gains (relative price and variety effects).In this scenario, returning to 1978 tariffs would reduce U.S. welfare by 0.15percent. Variety effects account for approximately 3/4 of the total welfarechange induced by the tariff change.

APPENDIX EBibliography

E-2
E-3
Bibliography
Adams, Richard, Philippa Dee, Jyothi Gali, and Greg McGuire (2003).“The Trade and Investment Effects of Preferential Trading Arrangements- Old and New Evidence,” Productivity Commission Staff Working Paper(May 2003), Canberra, Australia: Productivity Commission.
Agama, Laurie-Ann C. and Christine A. McDaniel (2003). “The NAFTAPreference and U.S.-Mexico Trade: Aggregate-Level Analysis,” TheWorld Economy (forthcoming).
Aitken, Brian and Ann Harrison (1999). “Do Domestic Firms Benefitfrom Foreign Direct Investment? Evidence from Venezuela,” AmericanEconomic Review, vol. 89, pp. 605-618.
Aw, Bee Yan, Sukkyun Chung, and Mark Roberts (2000). “Productivityand Turnover in the Export Market: Micro-Level Evidence from theRepublic of Korea and Taiwan (China),” World Bank Economic Review,vol. 14, pp. 65-90.
Aw, Bee Yan and Amy Huang (1995). “Productivity and the ExportMarket: aFirm-LevelAnalysis,”JournalofDevelopmentEconomics, vol.47, pp. 313-32.
Baier, Scott L. and Jeffrey H. Bergstrand (2001). “The Growth of WorldTrade: Tariffs, Transport Costs and Income Similarity,” Journal ofInternational Economics, vol. 53, pp.1-27.
Balasubramanyam, V.N., Mohammed Salisu, and David Sapsford (1996).“Foreign Direct Investment and Growth in Export Promoting and ImportSubstituting Countries,” Economic Journal vol. 106, No. 434 (January),pp. 92-105.
Baldwin, Robert and Tracy Murray (1997). “MFN Tariff Reductions andDeveloping Country Trade Benefits under the GSP” Economic Journal,vol. 87, No. 345, pp.30-46, March.
Baldwin, Richard and Elena Seghezza (1996a). “Trade-InducedInvestment-Led Growth,” National Bureau of Economic ResearchWorking Paper 5582.
Baldwin, Richard and Elena Seghezza (1996b). “Testing forTrade-Induced Investment-Led Growth,” National Bureau of EconomicResearch Working Paper 5416.
Baldwin, Richard and Elena Seghezza (1997). “Growth and EuropeanIntegration: Towards an Empirical Assessment,” Centre for EconomicPolicy Research, Discussion Paper No. 1393.
E-4
Baldwin, Richard and Elena Seghezza (1998). “Regional Integration andGrowth in Developing Nations,” Journal of Economic Integration, vol.13, pp. 367-399.
Bartelsman, Eric and Mark Doms (2000). “Understanding Productivity:Lessons from Longitudinal Microdata,” Journal of Economic Literature,vol.38, pp. 569-594.
Benjamin, Nancy and Michael Ferrantino (2001). “Trade Policy andProductivity Growth in OECD Manufacturing,” International EconomicJournal, vol. 15, pp. 95-115.
Berman, Eli, John Bound, and Zvi Griliches (1994). “Changes in theDemand for Skilled Labor within U.S. Manufacturing: Evidence fromAnnual Survey of Manufactures,” Quarterly Journal of Economics, vol.109, No. 2, pp. 367-397.
Bernard, Andrew and J. Bradford Jensen (1995). “Exporters, Jobs, andWages in U.S. Manufacturing: 1976-1987,” Brookings Papers onEconomic Activity, pp. 67-112.
Bernard, Andrew and J. Bradford Jensen (1999). “Exceptional ExporterPerformance: Cause, Effects, or Both?” Journal of InternationalEconomics, vol. 47, pp. 1-25.
Bernard, Andrew, J. Bradford Jensen and Peter K. Schott (2002). “FallingTrade Costs, Heterogeneous Firms, and Industry Dynamics,” YaleUniversity School of Management (September), working paper availableathttp://www.som.yale.edu/Faculty/pks4/files/research/papers/expdyn26_020916.pdf.
Bernard, Andrew, J. Bradford Jensen and Peter K. Schott (2002).“Survival of the Best Fit: Low Wage Competition and the (Uneven)Growth of US Manufacturing Plants,” Yale University School ofManagement working paper, available athttp://www.som.yale.edu/Faculty/pks4/files/research/papers/bestfit_020816.pdf.
Bernard, Andrew, J. Bradford Jensen, and Peter K. Schott, (2003)“Survival of the Best Fit: Exposure to Low-Wage Countries and the(Uneven) Growth of U.S. Manufacturing Plants,” April, Yale Universitymanuscript.
Bhagwati, Jagdish, Arvind Panagariya, and T.N. Srinivasan (1998).Lectures on International Trade, 2nd Edition (Cambridge, MA: MITPress).
Borensztein, Eduardo, Jose DeGregorio, and Jong-Wha Lee (1998).“How Does Foreign Direct Investment Affect Economic Growth?”Journal of International Economics, vol. 45, pp. 115-35.
E-5
Borjas, George J., Richard B. Freeman, and Lawrence F. Katz (1997).“How Much Do Immigration and Trade AffectLabor MarketOutcomes?”Brookings Papers on Economic Activity, vol. 1, pp. 1-67.
Borjas, George J. and Valerie A. Ramey (1993). “Foreign Competition,Market Power, and Wage Inequality: Theory and Evidence,” NationalBureau of Economic Research Working Paper No. 4556 (December).
Bound, John and George Johnson (1992). “Changes in the Structure ofWages in the 1980s: An Evaluation of Alternative Explanations,”American Economic Review, vol. 82, No. 3, pp. 371-392.
Brander, James A. and Barbara J. Spencer (1984). “Tariff Protection andImperfect Competition,” in H. Kierzkowski, ed., MonopolisticCompetition and International Trade (Oxford, UK: Oxford UniversityPress) pp. 194-206.
Brown, Drusilla K. (1994). “Properties of Applied General EquilibriumTrade Models with Monopolistic Competition and Foreign DirectInvestment,” in J.F. Francois and C.R. Shiells, eds., Modeling TradePolicy: Applied General Equilibrium Assessments of North AmericanFree Trade (Cambridge, UK: Cambridge University Press) pp. 124-148.
Brown, Drusilla K., Alan V. Deardorff and Alan K. Fox, and RobertM.Stern (1995). “Computational Analysis of Goods and ServicesLiberalization in the Uruguay Round,” in W. Martin and L.A. Winters,eds., The Uruguay Round and the Developing Economies, World BankDiscussion Paper 307 (Washington, DC: The World Bank) pp. 365-380.
Brown, Drusilla K., Alan V. Deardorff and Robert M. Stern (1992). “TheNorth American Free Trade Agreement: Analytical Issues and aComputational Assessment,” The World Economy, vol. 15, No. 1,pp. 15-29.
Brown,DrusillaK.,AlanV.Deardorff andRobertM.Stern (1992). “NorthAmerican Integration,” The Economic Journal, vol. 102 (November),pp. 1507-1518.
Brown, Drusilla K and Robert M. Stern (1989), “Computable GeneralEquilibrium Estimates of the Gains from U.S.-Canadian TradeLiberalisation,” in David Greenaway, Thomas Hyclak, and Robert J.Thornton, eds., Economic Aspects of Regional Trading Arrangements,Hertfordshire, England, Harvester Wheatsheaf, pp. 69-108.
Brown, Fredand JohnWhalley (1980). “GeneralEquilibriumEvaluationsof Tariff-Cutting Proposals in the Tokyo Round and Comparisons WithMore Extensive Liberalisation of World Trade,” The Economic Journal,vol. 90 (December), pp. 836-866.
Burfisher, Mary E., Sherman Robinson and Karen Theirfelder (1994).“Wage Changes in a U.S.-Mexico Free Trade Area: Migration Versus
E-6
Stolper-Samuelson Effects,” in J.F. Francois and C.R. Shiells, eds.,Modeling Trade Policy: Applied General Equilibrium Assessments ofNorth American Free Trade (Cambridge, UK: Cambridge UniversityPress) pp. 195-222.
Burfisher, Mary E., Sherman Robinson and Karen Theirfelder (2001).“The Impact of NAFTA on the United States,” Journal of EconomicPerspectives, vol. 15, No. 1 (Winter), pp. 125-144.
Burtless, Gary (1997). “Widening U.S. Income Inequality and the Growthin World Trade,” Brookings Institution, unpublished manuscript, as citedin William R. Cline, Trade and Income Distribution (Washington, DC:Institute for International Economics), p. 19.
Caves, Richard E. and David Barton (1990). Efficiency in U.S. MarketingIndustries (Cambridge, MA: MIT Press).
Caves, Richard E, Jeffrey A. Frankel, and Ronald W. Jones (2002). WorldTrade and Payments: An Introduction, 9th edition (Boston:Addison-Wesley).
Clausing,KimberlyA. (2001). “TradeCreationandTradeDiversion in theCanada-United States Free Trade Agreement,” Canadian Journal ofEconomics, vol. 34, No. 3, pp. 676-696.
Cline, William R. (1997). Trade and Income Distribution (Washington,DC: Institute for International Economics).
Cox, David and Richard G. Harris (1985), “Trade Liberalization andIndustrialOrganization:SomeEstimates forCanada,”JournalofPoliticalEconomy, vol. 93, No. 1, February 1985, pp 115-145.
Cox, David and Richard G. Harris (1986), “A Quantitative Assessment ofthe Economic Impact on Canada of Sectoral Free Trade with the UnitedStates,” Canadian Journal of Economics, vol. 19, No. 3, August 1986,pp. 377-94.
Coughlin, CletusC. and Howard J. Wall (2000). NAFTAand theChangingPattern of State Exports, Working Paper 2000-029, Research Division,Federal Reserve Bank of St. Louis, October.
Deardorff, Alan V. and Robert M. Stern (1981). “A Disaggregated Modelof World Production and Trade: An Estimate of the Impact of the TokyoRound,” Journal of Policy Modeling, vol. 3, pp. 127-152.
Deardorff, Alan V. and Robert M. Stern (1983), “Economic Effects of theTokyo Round,” Southern Economic Journal, January 1983, vol. 49, No. 3,pp. 605-624.
Deardorff, Alan V. and Robert M. Stern (1986). The Michigan Model ofWorld Production and Trade (Cambridge, MA: MIT Press).
E-7
Delgado, Miguel, Jose Farinas, and Sonia Ruano (2002). “FirmProductivity and Export Markets: a Non-Parametric Approach,” Journalof International Economics, vol. 57, pp. 397-422.
Devarajan, Shantayanan, Delfin S. Go, Jeffrey D. Lewis, ShermanRobinson, and Pekka Sinko (1997), “Chapter 6: Simple GeneralEquilibrium Modeling,” in Applied Methods for Trade Policy Analysis,Joseph F. Francois and Kenneth A. Reinert, eds. (Cambridge, UK:Cambridge University Press).
DeRosa, Dean A. (1998). Regional Integration Arrangements: StaticEconomic Theory, Quantitative Findings, and Policy Guidelines, WorldBank Policy Research Report 2007.
Dollar, David (1992). “Outward-Oriented Developing Economies ReallyDo Grow More Rapidly: Evidence from 95 LDCs, l976-l985,” EconomicDevelopment and Cultural Change, vol. 41, pp. 523-544.
Doms, Mark and J. Bradford Jensen (1998). “Comparing Wages, Skills,and Productivity Between Domestic and Foreign Owned ManufacturingEstablishments in the United States,” in Geography and Ownership asBases for Economic Accounting. R. Baldwin, R. Lipsey, and J.D.Richardson, eds. (Chicago: University of Chicago Press).
Edwards, Sebastian (1992). “Trade Orientation, Distortions, and Growthin Developing Countries,”Journal of Development Economics, vol. 39,pp. 31-57.
Edwards, Sebastian (1993). “Openness, TradeLiberalization, andGrowthin Developing Countries, Journal of Economic Literature, vol. 31,pp. 1358-1393.
Edwards, Sebastian (1998). “Openness, Productivity, and Growth: WhatDo We Really Know?” Economic Journal, vol. 108, pp. 383-398
Feenstra, Robert C. (1994). “New Product Varieties and the Measurementof International Prices,” American Economic Review, vol. 84 (March),pp. 157-177.
Feenstra, Robert C. (1998). “Integration of Trade and Disintegration ofProduction in the Global Economy,” Journal of Economic Perspectives,vol. 12, No. 4, pp. 31-50.
Feenstra, Robert C., ed. (2000). The Impact of International Trade onWages (Chicago, IL: The University of Chicago Press).
Feenstra, Robert C. (2003), “Increasing Returns and the GravityEquation,” chapter 5 in Feenstra, Advanced International Trade: Theoryand Evidence (Princeton, NJ: Princeton University Press, 2003forthcoming).
E-8
Feenstra, Robert C. and Gordon Hanson (1999). “ProductivityMeasurement and the Impact of Trade and Technology on Wages:Estimates for the U.S., 1972-1990,” Quarterly Journal of Economics, vol.114, No. 3, August 1999, pp. 907-940.
Feenstra, Robert C. and Gordon H. Hanson (2001). “Global ProductionSharing and Rising Inequality: A Survey of Trade and Wages,” Universityof California, San Diego, and National Bureau of Economic Research,Revised June 2001.
Feenstra, Robert C., Gordon H. Hanson and Deborah L. Swenson, (2000)“OffshoreAssembly fromtheUnitedStates:ProductionCharacteristicsofthe 9802 Program,” in Robert E. Feenstra, ed. (2000), The Impact ofInternational Trade on Wages (Chicago: University of Chicago Press,pp. 85-122).
Feenstra, Robert C., James R. Markusen, and Andrew K. Rose (2001).“Using the Gravity Model Equation to Differentiate Among AlternativeTheories of Trade,” Canadian Journal of Economics, vol. 34, No. 2,pp. 430-447.
Feenstra, Robert C. and Clinton R. Shiells (1997). “Bias in U.S. ImportPrices and Demand,” in Timothy F. Bresnahan and Robert J. Gordon,eds.(1997), The Economics of New Goods, 249-76. (Chicago: Universityof Chicago Press).
Ferrantino, Michael (2001). “Evidence of Trade, Income, andEmploymentEffects of NAFTA,” Industry Tradeand TechnologyReview,U.S. International Trade Commission Publication 3483 (December).
Field, Alfred J. and Edward M.Graham(1997) “Is there aSpecialCase forImport Protection for the Textile and Apparel Sectors Based on LabourAdjustment?” The World Economy, vol. 20, No. 2 (March) pp. 137-157.
Fox, Alan K. (2000) “Evaluating the Success of a CGE Model of theU.S.-Canada Free Trade Agreement,” in Alan K. Fox, Three Essays onInternational Trade Policy, Ph.D. dissertation, University of Michigan.http://www-personal.umich.edu/~alanfox/dissert.pdf(accessedAugust1,2003).
Francois, Joseph F., Bradley McDonald, and Hakan Nordstrom (1995).“Assessing the Uruguay Round,” in W. Martin and L.A. Winters, eds.,TheUruguay Round and the Developing Economies, World Bank DiscussionPaper 307, (Washington, DC: The World Bank) pp. 117-214.
Francois, Joseph F., and Clinton R. Shiells (1994). “AGE Models of NorthAmerican Free Trade,” in J.F. Francois and C.R. Shiells, eds., ModelingTrade Policy: Applied General Equilibrium Assessments of NorthAmerican Free Trade, (Cambridge, UK: Cambridge University Press)p. 3-44.
E-9
Frankel, JeffreyA. (1997).RegionalTradingBlocs in theWorldEconomicSystem (Washington, D.C.: Institute for International Economics).
Frankel, Jeffrey A. and David Romer (1999). “Does Trade CauseGrowth?” American Economic Review, vol. 89, pp. 379-99.
Frankel, Jeffrey A. and Andrew K. Rose (2002). “An Estimate of theEffect of Common Currencies on Trade and Income,” The QuarterlyJournal of Economics, vol. 117, No. 2, pp. 437-466.
Frankel, Jeffrey A. and Shang-Jin Wei (1995). “Open Regionalism in aWorld of Continental Trading Blocks,” National Bureau of EconomicResearch Working Paper No. 5272.
Frankel, Jeffrey A. and Shang-Jin Wei (1996). “ASEAN in a RegionalPerspective,”PacificBasin Working Paper No. PB96-02, FederalReserveBank of San Francisco.
Freeman, Richard (1995). “Are Your Wages Set in Beijing?” Journal ofEconomic Perspectives, vol. 9, No. 3 (Summer), pp. 15-32.
Fukao, Kyoji, Toshihiro Okubo and Robert M. Stern (2003). “AnEconometric Analysis of Trade Diversion under NAFTA,” The NorthAmerican Journal of Economics and Finance, vol.14, No.1 (March),pp. 3-24.
GAO (2000a), “Trade Adjustment Assistance: Trends, Outcomes, andManagement Issues in Dislocated Worker Programs,” GAO-01-59,October.
GAO (2000b) “Trade Adjustment Assistance: Impact of FederalAssistance to Firms is Unclear,” GAO-01-12, December.
GAO (2001), “Trade Adjustment Assistance: Experiences of SixTrade-Impacted Communities,” GAO-01-838, August.
Ghosh, Sucharita and Steven Yamarik (2003). “Are Regional TradingArrangements Trade Creating? An Application of Extreme BoundsAnalysis,” Journal of International Economics (forthcoming).
Girma, Sourafel, David Greenaway, and Richard Kneller (2002). “DoesExporting Lead to Better Performance? A Microeconomic Analysis ofMatched Firms,” manuscript.
Goldberg, Pinelopi and Frank Verboven (2001). “Market Integration andConvergence to the Law of One Price: Evidence from the European CarMarket,” Centre for Economic Policy Research Discussion Paper No.2926 (August).
Goldin, Ian, and Dominque van der Mensbrugghe(1995). “The UruguayRound: An Assessment of Economywide and Agricultural Reforms,” in
E-10
Will Martin and L. Alan Winters, eds., The Uruguay Round and theDeveloping Economies, World Bank Discussion Paper 307 (Washington,DC: The World Bank, 1995) pp. 25-52.
Gould,DavidM. (1998). “HasNAFTAChangedNorthAmericanTrade?”Federal Reserve Bank of Dallas Economic Review (First Quarter)pp. 12-23.
Greenaway, David, Wyn Morgan, and Peter Wright (1998). “TradeReform, Adjustment and Growth: What Does the Evidence Tell Us?”Economic Journal, vol. 108, pp. 1547-1561.
Haaland, Jan and Truls C. Tollefsen (1994). “The Uruguay Round andTrade in Manufactures and Services: General Equilibrium Simulations ofProduction, Trade, and Welfare Effects of Liberalization,” Centre forEconomic Policy Research Discussion Paper No. 1008 (July).
Haddad, Mona and Ann E. Harrison (1993). “Are There PositiveSpillovers from Foreign Direct Investment?Evidence fromPanel Data forMorocco,” Journal of Development Economics, vol. 42, pp. 51-74.
Harrigan, James (2000). “International Trade and American Wages inGeneral Equilibrium,” in Robert C. Feenstra, ed, The Impact ofInternational Trade on Wages (Chicago, IL: The University of ChicagoPress), 2000, pp. 171-196.
Harris, Richard (1984). “Applied General Equilibrium Analysis of SmallOpen Economies with Scale Economies and Imperfect Competition,”American Economic Review 74:5, December 1984, pp. 1016-32
Harrison,AnnE. (1994). “Productivity, ImperfectCompetition, andTradeReform: Theory and Evidence,” Journal of International Economics, vol.36, pp. 53-73.
Harrison, Ann E. (1996). “Openness and Growth: a Time-Series,Cross-Country Analysis for Developing Countries,” Journal ofDevelopment Economics, vol. 48, pp. 419-447.
Harrison, Ann E. and Ana Revenga (1995). “The Effects of Trade PolicyReform: What Do We Really Know?” National Bureau of EconomicResearch Working Paper 5225.
Harrison, Glen W., Thomas F. Rutherford, and David G. Tarr (1995).“Quantifying the Uruguay Round,” in W. Martin and L.A. Winters, eds.,The Uruguay Round and the Developing Economies, World BankDiscussion Paper 307 (Washington, DC: The World Bank) pp. 215-284.
Haskel, Jonathan E. and Matthew J. Slaughter (2000). “Have FallingTariffs and Transportation Costs Raised U.S. Wage Inequality?” NationalBureau of Economic Research Working Paper No. 7539 (February).
E-11
Haskel, Jonathan E. (1999). “The Trade and Labour Approaches to WageInequality,” Centre for Economic Policy Research Working Paper, QueenMary and Westfield College, University of London (July).
Hassink, Wolter H.J. and Ronald Schettkat (2001). “On Price-Setting forIdentical Products in Markets Without Formal Trade Barriers,” UtrechtUniversity Discussion Paper No. 315 (June).
Head, Keith and John Ries (1999). “Rationalization Effects of TariffReductions, Journal of International Economics, vol. 47, pp. 295-320.
Hertel, Tom, Will Martin, Koji Yanagishima, and Betina Dimaranan(1995). “Liberalizing Manufactures Trade in a Changing WorldEconomy,” in W. Martin and L.A. Winters, eds., The Uruguay Round andthe Developing Economies, World Bank Discussion Paper 307(Washington, DC: The World Bank) pp. 73-96.
Hillberry, Russell and Christine McDaniel (2002). “A Decomposition ofTrade Growth Since NAFTA,” U.S. International Trade CommissionOffice of Economics Working Paper No. 2002-12-A (December).
Hummels, David (1999). “Have InternationalTransportCostsDeclined?”Purdue University, November 1999, available athttp://www.mgmt.purdue.edu/faculty/hummelsd/research/decline/declined.pdf, downloaded March 17, 2003.
Hummels, David (2001). “Time as a Trade Barrier” July 2001, PurdueUniversity manuscript, downloaded fromhttp://www.mgmt.purdue.edu/faculty/hummelsd/research/time3b.pdf onMarch 17, 2003.
Hummels, David, Jun Ishii, and Kei-Mu Yi (2001). “The Nature andGrowth of Vertical Specialization in World Trade,”Journal ofInternational Economics, vol. 54.
Hummels, David and Peter J. Klenow (2002). “The Variety and Quality ofaNation’sTrade,”NationalBureau of EconomicResearch Working Paper8712 (January).
Hummels, David and Volodymyr Lugovskyy (2002). “Usable Data?Matched Partner Trade Statistics as Measures of International TransportCosts,” Purdue University manuscript.
Hummels, David and Alexandre Skiba (2003). “A Virtuous Circle?Regional Tariff Liberalization and Scale Economies in Transport,”forthcoming 2003 in FTAA and Beyond: Prospects for Integration in theAmericas.
Karemara, David and Kalu Ojah (1998). “An Industrial Analysis of TradeCreation and Diversion Effects of NAFTA,” Journal of EconomicIntegration, vol. 13, pp. 400-25.
E-12
Katayama, Hajime, Shihua Lu, and James Tybout (2002). “InferringPlant-Level Performance Measures from Revenues and Costs,”manuscript.
Katz, Lawrence F. and David Autor (1999) “Changes in the WageStructure and Earnings Inequality,” in Orley Ashenfelter and David Card,eds.,HandbookofLaborEconomics,Vol.3A (Amsterdam:Elsevier,1999)pp. 1463-1555.
Katz, Lawrence F. and Kevin M. Murphy (1992). “Changes in RelativeWages 1963-1987: Supply and Demand Factors,” Quarterly Journal ofEconomics, vol 107, No. 428 (February), pp. 35-78.
Kehoe, Timothy J. (2002). “An Evaluation of the Performance of AppliedGeneral Equilibrium Models of the Impact of NAFTA,” Federal ReserveBank of Minneapolis Research Department Staff Report, revisedDecember 2002.
Kehoe, Patrick J. and Timothy J. Kehoe (1994). “Capturing NAFTA’sImpact With Applied General Equilibrium Models.” Federal ReserveBank of Minneapolis Quarterly Review (Spring) vol. 18, No. 1.
Kim, Euysung (2000). “Trade Liberalization and Productivity Growth inKorean Manufacturing Industries: Price Protection, Market Power, andScale Efficiency,” Journal of Development Economics, vol. 62, 55-83.
Klenow, Peter J. and Andres Rodriguez-Clare (1997). “QuantifyingVariety Gains from Trade Liberalization,” manuscript (September),downloaded from Peter Klenow’s web page athttp://www.klenow.com/QuantifyingVariety.pdf on November 12, 2002.
Kletzer, Lori G. (2001). Job Loss from Imports: Measuring the Costs(Washington, DC: Institute for International Economics).
Krueger, Anne O. (1999). Trade Creation and Trade Diversion UnderNAFTA, National Bureau of Economic Research Working Paper No. 7429(December).
Krueger, Anne O. (2000). “NAFTA’s Effects: A PreliminaryAssessment”, The World Economy, vol. 23, No. 6 (June).
Krugman, Paul (1995). “Growing World Trade, Causes andConsequences,” Brookings Papers on Economic Activity, No. 1, pp.327-377.
Krugman, Paul R. and Maurice Obstfeld (2000). InternationalEconomics: Theory and Policy, 5th Edition (Reading, MA:Addison-Wesley).
Krishna, Pravin and Devashish Mitra (1998). “Trade Liberalization,Market Discipline, and Productivity Growth: New Evidence from India,”Journal of Development Economics, vol. 56, pp. 447-62.
E-13
Kucera, David and William Millberg (2002). “Trade and the Loss ofManufacturing Jobs in the OECD: New Factor Content Calculations for1978-1995,” International Institute for Labor Studies Paper:DP/135/2002.
Lawrence, Robert Z. and Matthew J. Slaughter (1993). “Trade and U.S.Wages: Great Sucking Sound or Small Hiccup?” Brookings Papers onEconomic Activity, vol. 2, pp. 161-226.
Leamer, Edward E. (1982). “Sets of Posterior Means with BoundedVariance Priors,” Econometrica, vol. 50, pp. 725-736.
Leamer, Edward E. (1999), “Effort, Wages, and the International Divisionof Labor,” Journal of Political Economy vol. 107, No. 6, part 1(December), pp. 1127-63.
Leamer, Edward E., Alfonso Guerra, Martin Kaufman, and Boris Segura(1995). “How Does the North American Free Trade Agreement AffectCentral America?” World Bank Policy Research Working Paper 1464.
Leamer, Edward E. and Herman Leonard (1983). “Reporting the Fragilityof Regression Estimates,” The Review of Economics and Statistics, vol.65, No. 2, pp. 306-317.
Leamer, Edward E. and Christopher F. Thornburg (2000), “Effort andWages: A New Look at the Interindustry Wage Differentials,” in Robert E.Feenstra, ed. (2000), The Impact of International Trade on Wages(Chicago: University of Chicago Press), pp. 37-80.
Lee, Jong-Wha and Phillip Swagel (1997). “Trade Barriers and TradeFlows Across Countries and Industries,” Review of Economics andStatistics, vol. 74, pp. 372-382.
Levine, Ross and David Renelt (1992) “A Sensitivity Analysis ofCross-Country Growth Regressions,” American Economic Review, vol.82, pp. 942-963.
Levinsohn, James (1993). “Testing the Imports-as-Market-DisciplineHypothesis,” Journal of International Economics, vol 35, pp. 1-22.
MacDonald, James M. (1994). “Does Import Competition Force EfficientProduction?” Review of Economics and Statistics, vol. 76, pp. 721-27.
Markusen, JamesR., JamesR.Melvin,WilliamH.Kaempfer, andKeithE.Maskus (1995). International Trade: Theory and Evidence, InternationalEdition, (Boston: McGraw-Hill).
Martin, Will and Alan L. Winters (1995). The Uruguay Round–Wideningand Deepening the World Trading System (Washington, DC: The WorldBank).
E-14
Meade, James E. (1955). The Theory of Customs Union (Amsterdam:North Holland).
Nguyen, Trien T., Carlo Perroni, and Randall M. Wigle (1995). “AUruguay Round Success?” World Economy, vol. 18 (January) pp. 25-30.
Pavcnik, Nina (2002). “Trade Liberalization, Exit, and ProductivityImprovements: Evidence from Chilean Plants,” Review of EconomicStudies, vol. 69, pp. 245-76
Perroni, Carlo (1996) “TheUruguay Round and Its Impact on DevelopingCountries: An Overview of Model Results,” report prepared for a UnitedNations Conferenceon Trade and DevelopmentProject on “The Impact ofthe Uruguay Round on Developing Countries,”(February).
Perroni, Carlo and John Whalley (2000). “The New Regionalism: TradeLiberalization or Insurance?” Canadian Journal of Economics, vol. 33,No. 1 (February) pp. 1-24.
Pritchett, Lant (1996). “Measuring Outward Orientation in LDCs: Can itBe Done? Journal of Development Economics, vol. 49, pp. 307-335.
Ray, Edward John and Howard P. Marvel (1995). “CountervailingDuties”, Economic Journal, vol. 105, No. 433, pp.1576-93, November.
Richardson, David J. (1995) “Income Inequality and Trade: How toThink, What to Conclude,” Journal of Economic Perspectives, vol. 9, No.3 (Summer) pp. 33-55.
Roberts, Mark J. and JamesR. Tybout, eds. (1996). Industrial Evolution inDeveloping Countries: Micro Patterns of Turnover, Productivity andMarket Structure (New York: Oxford University Press).
Robertson, Raymond (2000). “Wage Shocks and North AmericanLabor-Market Integration,” The American Economic Review, vol 90, No.4 (September) pp. 742-764.
Rodriguez, Francisco and Dani Rodrik (1999). “Trade Policy andEconomic Growth: A Skeptic’s Guide to the Cross-National Evidence,”National Bureau of Economic Research Working Paper No. 7081.
Roland-Holst, David W., Kenneth A. Reinert, and Clinton R. Shiells(1992). “North American Trade Liberalization and the Role of NontariffBarriers,” Economy-wide Modeling of the Economic Implications of aFTA with Mexico and Canada (Washington, DC: U.S. International TradeCommission, May), Publication 2508.
Roland-Holst, David W., Kenneth A. Reinert, and Clinton R. Shiells(1994). “A General Equilibrium Analysis of North AmericanIntegration,” Modeling Trade Policy: Applied General EquilibriumAssessments of North American Free Trade (Cambridge, UK: CambridgeUniversity Press ), pp. 47-82.
E-15
Romalis, John (2001). “NAFTA’s Impact on North American Trade,”University of Chicago Graduate School of Business Working Paper.
Romer, Paul M. (1994). “New Goods, Old Theory, and the Welfare Costsof Trade Restrictions,” Journal of Development Economics, vol. 43, pp.5-38.
Rose, Andrew K. (1991). “Why Has World Trade Grown Faster ThanIncome?” Canadian Journal of Economics, vol. 24, pp. 417-427.
Rose, Andrew K. (2000). “One Money, One Market? The Effects ofCommon Currencies on International Trade,” Economic Policy, vol. 15,No. 30, pp. 7-46.
Rose, Andrew K. (2002). “Do WTO Members Have More Liberal TradePolicy?”,NationalBureauofEconomicResearchWorkingPaperno.9347(November).
Rutherford, Thomas F. and David G. Tarr (2002). “Trade Liberalization,Product Variety and Growth in a Small Economy: A QuantitativeAssessment,” Journal of International Economics, vol. 56, pp. 247-272.
Sachs, Jeffrey D. and Howard J. Shatz (1994). “Trade and Jobs in U.S.Manufactures,” Brookings Papers on Economic Activity, vol. 1, pp. 1-84.
Sachs, Jeffrey D. and Andrew Warner (1995). “Economic Reform and theProcess of Global Integration,” Brookings Papers on Economic Activity,vol. 1-118.
Sawyer, Charles W. and Richard L. Sprinkle (1986). “U.S.-Israel FreeTradeArea:TradeExpansion Effects of theAgreement,”Journal ofWorldTrade Law, vol. 20, No. 5 (September-October) pp. 529-39.
Schott, Peter K. (2001). “Do Rich and Poor Countries Specialize in aDifferent Mix of Goods? Evidence from Product-Level U.S. Trade Data,”National Bureau of Economic Research Working Paper 8492,(September).
Slaughter, Matthew J. (1998). “International Trade and Labour-MarketOutcomes: Results, Questions, and Policy Options,” The EconomicJournal, vol. 108 (September) pp. 1452-1462.
Slaughter, Matthew J. and Phillip Swagel (1997). “The Effect ofGlobalization on Wages in the Advanced Economies,” InternationalMonetary Fund Working Paper WP/97/43 (April).
Slaughter, Matthew J. (2000). “What Are the Results of Product-PriceStudies and What Can We Learn from Their Differences?” in Robert C.Feenstra, ed, The Impact of International Trade on Wages (Chicago, IL:The University of Chicago Press).
E-16
Smarzynska, Beata (2002). “Does Foreign Direct Investment Increase theProductivity of Domestic Firms? In Search of Spillovers throughBackward Linkages,” World Bank Policy Research Working Paper 2923.
Soloaga, Isidro and L. Alan Winters (2001). “Regionalism in the Nineties:What Effect on Trade?” North American Journal of Economics andFinance, vol. 121, pp.1-29.
Stolper, Wolfgang and Paul Samuelson (1941). “Protection and RealWages,” Review of Economic Studies, vol. 9, pp. 58-73.
Trefler, Daniel (1995). “The Case of the Missing Trade and OtherMysteries,” American Economic Review, vol. 85, No. 5 (December),pp. 1029-1046.
Trefler, Daniel (2001).TheLong and Short of theCanada-U.S. FreeTradeAgreement, National Bureau of Economic Research Working Paper No.8293 (May).
Trella, Irene and John Whalley (1994). “Trade Liberalization inQuota-Restricted Items: The United States and Mexico in Textiles andSteel,” in J.F. Francois and C.R. Shiells, eds., Modeling Trade Policy:Applied General Equilibrium Assessments of North American Free Trade(Cambridge, UK: Cambridge University Press), pp. 256-98.
Tybout, James. (2000). “Manufacturing Firms in Developing Countries:How Well Do They Do, and Why?” Journal of Economic Literature, vol.38, pp. 11-44.
U.S. International Trade Commission (1997). The Impact of the NorthAmerican Free Trade Agreement on the U.S. Economy and Industries: aThree-Year Review, Publication No. 3045 (June).
U.S. International Trade Commission (1997). The Dynamic Effects ofTrade Liberalization: an Empirical Analysis, Publication No. 3069(October).
U.S. International Trade Commission (2002). The Economic Effects ofSignificant U.S. Import Restraints: Third Update 2002, Publication No.3519 (June).
Viner, Jacob (1950). The Customs Union Issue, (New York: CarnegieEndowment for International Peace).
Wacziarg, Romain (2001). “Measuring the Dynamic Gains from Trade,”World Bank Economic Review, vol. 15, pp. 393-429.
Wall, Howard J. (2003). “NAFTA and the Geography of North AmericanTrade,” Federal Reserve Bank of St.Louis Review, vol.85, No. 2,March/April.
E-17
Whalley, John (1984). Trade Liberalization Among Major World TradingAreas (Cambridge, MA: Massachusetts Institute of Technology Press).
Wong, Kar-Yiu (1995). International Trade in Goodsand FactorMobility(Cambridge, MA: Massachusetts Institute of Technology Press).
Wood, Adrian (1994). North-South Trade, Employment, and Inequality:Changing Fortunes in a Skill-Driven World (New York: OxfordUniversity Press).
Yi, Kei-Mu (2001). “Can Vertical Specialization Explain the Growth inWorld Trade?”-Journal of Political Economy, forthcoming 2003. Draftavailable athttp://www.newyorkfed.org/rmaghome/economist/yi/pubs.html,downloaded Mar. 20, 2003.


APPENDIX FHearing Witnesses and Views of
Interested Parties

F-2
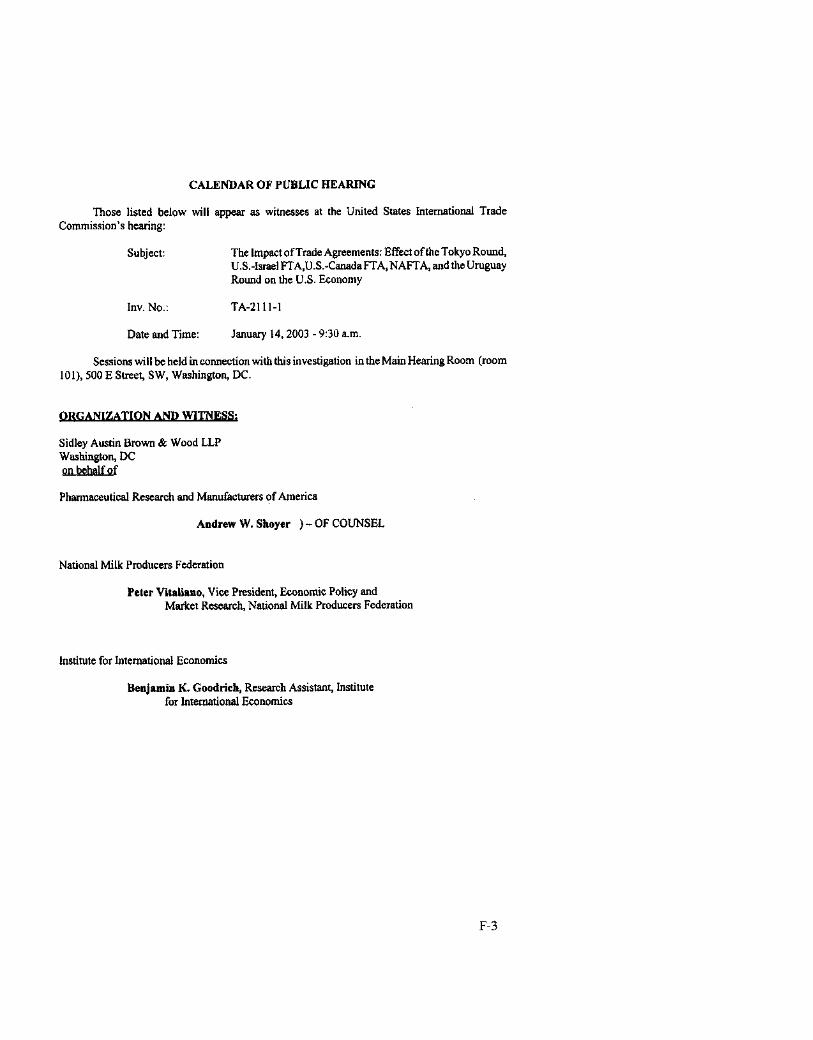
F-4
Positions of Interested Parties
This section summarizes the views of interested parties submitted to theCommission in connection with the investigation, either at the hearing or inwritten statements. The original statements can be viewed at the USITCElectronic Document Information System web site, http://edis.usitc.gov. Thesesummaries do not reflect the views of the U.S. International Trade Commissionor any individual Commissioner.
AFL-CIO1
The AFL-CIO is a voluntary federation of 65 national and internationallabor unions that represent 13 million workers.
U.S. trade policies have resulted in “exploding trade deficits and staggeringjob losses, especially in [the] manufacturing sector; significant impingement onthe power of the national government and state and local authorities to regulatein the public interest; and dilution of protections under domestic trade laws.”The United States should “go back to square one” and recraft its trade policies“to ensure that they promote and protect workers’ rights and the environmentin the United States and other nations.”
Uruguay RoundThe U.S. trade deficit in goods and services nearly quadrupled during
1994-2002 and these deficits have substantially retarded GDP growth. Growingtrade deficits have also eliminated a net total of 3 million actual and potentialjobs from the U.S. economy. Most (65 percent) job losses were in themanufacturing sector. Displaced workers in import-competing sectors have haddifficulty finding jobs in growing sectors. Further, real manufacturing wageshave not kept pace with the cost of living.
These factors have affected local businesses and have eroded state andlocal tax bases. The Uruguay Round Agreements (URA) have negativelyaffected the power to regulate in the public interest as the WTO disputeresolution procedures have challenged domestic laws and regulations design toprotect the environment, health and safety, consumers, or workers. The URAhas also weakened the substance of U.S. trade laws and reduced the ability toeffectively implement these laws. If global competition remains unchecked, itwill make the world increasingly “unstable” by creating greater inequality and“weaker democracies.”
1 AFL-CIO, written submission to the Commission, Feb. 14, 2003.
F-5
NAFTANAFTA has been a “dismal failure” and workers’ wages in all three
NAFTA countries have fallen or stagnated. The trade surplus that the UnitedStates had with Mexico before NAFTA is now a deficit and the deficit that ithad with Canada is now much larger. These deficits eliminate jobopportunities. NAFTA also has caused jobs to shift from “relativelyhigh-paying manufacturing jobs with good benefits and higher union density toservice sector jobs that pay less and provide fewer benefits.” The effect hasbeen particularly negative on the textile and apparel sector and the automotivegoods sector. Wage disparities between manufacturing production workers inMexico and the United States have increased, encouraging U.S. production toshift to Mexico and undocumented Mexican workers to move to the UnitedStates. “NAFTA has also made it less risky and more lucrative to moveproduction to Canada and Mexico” thereby “undermining the bargainingposition of U.S. workers.”
Air Transportation Association2
The Air Transportation Association (ATA) is the principal trade and serviceorganization of the U.S. scheduled airline industry.
Of the 5 subject trade agreements, only the URA covers commercial airtransport although the ATA generally supports all of these and otheragreements that liberalize trade with foreign partners. However, some free tradeagreements, such as the U.S.-Singapore FTA, cover express delivery servicessimilar to those provided by certain ATA members. Even so, there is not yetindustry consensus on this approach to liberalization.
The URA, particularly the General Agreement on Trade in Services(GATS), covers limited aspects of commercial air transportation. The GATSAnnex on Air Transport Services covers three sub-sectors, two of which theUnited States has taken exemptions on. ATA supports the U.S. governmentposition that liberalization of air transportation services can best be achievedunder the current, broad exclusion from the GATS of most activities in thissector. ATA believes that the existing venues and mechanisms for air transportliberalization are sufficient.
2 Edward A. Merlis, Senior Vice President, Legislative and International Affairs, AirTransportation Association written submission to the Commission, Jan. 21, 2003.
F-6
American Brush ManufacturersAssociation3
The American Brush Manufacturers Association (ABMA) is a diversegroup of businesses made up of 162 member manufacturers and affiliatedsupplier companies that has represented broom, brush and mop manufacturerssince 1917.
A significant amount of U.S. corn broom production was lost to Mexicoafter NAFTA took effect due to high labor content of the product. Three of thefour largest U.S. companies have either moved all, or a significant amount, oftheir production to Mexico and most of the smaller U.S. manufacturers (orformer U.S. manufacturers) now import part or all of their finished productsfrom Mexico. In each instance NAFTA has caused “vanishing profits anddwindling workforces” in the U.S. corn broom industry.
American Forest & Paper Association4
American Forest and Paper Association (AF&PA) is the national tradeassociation of the forest, pulp, paper, paperboard, and wood products industry.In its view, tariffs are the principal factor impairing the competitiveness of theU.S. forest products industry, and it believes that “no progress has been madeon multilateral tariff elimination in the wood products sector and only partialprogress has been achieved in the paper sector.” Regional FTAs to which theUnited States is not a party have only exacerbated the competitiveness problemby shutting out the U.S. industry from those markets. Besides tariffs, foreignsanitary and phytosanitary (SPS) measures and producer subsides also createsignificant U.S. competitive disadvantages for this sector. In general, U.S.exports have fallen in recent years, according to the AF&PA, because of thedownturn in the Japanese housing market, the strong U.S. dollar, and othermacroeconomic factors.
Tokyo and Uruguay RoundsThese Rounds led to declines or elimination of U.S. tariffs in this sector
without corresponding cuts by trading partners, “locking in” a U.S. competitive
3 David C. Parr, Executive Director, American Brush Manufacturers Association,written submission to the Commission, Feb. 14, 2003.
4 Jacob Handelsman, Senior Director, International Trade, and Elizabeth Ward,Executive Director, Wood Products International, American Forest & Paper Association,written submission to the Commission, Mar. 31, 2003.
F-7
disadvantage. In particular, the failure to achieve “zero-for-zero” cuts inwood products tariffs with Japan has put the U.S. industry at a disadvantage.Developing countries also have not liberalized their markets or industries, tothe detriment of the U.S. industry. Subsidies in both developing anddeveloped economies abroad continue to create competition for U.S. exports.SPS disciplines negotiated in the Uruguay Round are important to theindustry and AF&PA opposes any attempt to evade such disciplines, such asattempts by the EU to block U.S. trade with SPS measures based on otherthan scientific grounds.
NAFTAMexico is an important market for U.S. wood products, because there is
limited domestic production in Mexico. However, the lengthy staging-in periodfor Mexican tariff reduction has limited U.S. exports below what they mightotherwise have been. The strong dollar vis-a-vis competing exporters inlow-cost countries has also hurt U.S. export potential in Mexico. On the otherhand, U.S. paper product exports to Mexico have been “thriving.”
American Restaurant China Council5The American Restaurant China Council (ARCC) is a trade association
that represents a substantial majority of U.S. Commercial Chinawareproduction.6 The ARCC member companies are Buffalo China, Inc., The HallChina Company, and The Homer-Laughlin China Company.
Tokyo and Uruguay RoundsThe Tokyo and Uruguay Round tariff reductions led to large surges of
low-priced imports that eroded U.S. market share for commercial chinaware.Following the Tokyo Round tariff reduction on commercial chinaware from48-percent to 35-percent, product imports increased more than eightfold tonearly five million dozens during 1979-1994. These imports captured a
5 Susan Esserman and Melanie Schneck, Steptoe & Johnson, LLP on behalf of theAmerican Restaurant China Council, written submission to the Commission, February14, 2003.
6 Commercial chinaware (HTS 6911.10.10 and HTS 6912.00.20) is “especiallydesigned for use by hotels, restaurants, and other commercial establishments andinstitutions that require stronger, thicker, more durable and more sanitary chinaware.”
F-8
substantial share of the U.S. market, resulting in either the transfer or shutdown of a number of U.S. manufacturers operations and the loss of hundredsof American jobs. Imports continued to increase during the Uruguay Roundtariff reduction staging to over 6.8 million dozens by year end 2000,dropping to 5.8 million dozens in 2001 due to the U.S. economic slowdown.This flow of U.S. imports is not offset by significant U.S. exportopportunities due largely to high tariff rates overseas, onerous testing andcertification requirements, and national preferences to buy domesticproduction, particularly in Europe.
The U.S. Government has historically recognized that commercialchinaware is an import sensitive product by limiting the industry’s tariffreduction requirements during the Tokyo Round and by granting a 10-yearstaged reduction in the Uruguay Round.7 During this time, the industry madesignificant capital improvement investments to lower production costs andincrease efficiency in an effort to ensure its future competitiveness. However,the commercial chinaware market remains intensely price sensitive and anyfuture tariff elimination or accelerated tariff reduction would threaten the U.S.industry’s survival. ARCC also states that maintaining import tariffs forcommercial chinaware would have no discernible effect on consumers(restaurants and hotels) because it is generally recognized that the cost ofchinaware represents an insignificant part of their (the consumers’) operatingcosts.
Association of the NonwovenFabrics Industry8
The Association of the Nonwoven Fabrics Industry (INDA) is the tradeassociation of the nonwovens industry, a multi-billion-dollar business in theUnited States and abroad. INDA members are involved in the manufacture ofnonwoven roll goods and production of primary materials and machinery usedto create nonwovens. INDA members also include companies that convertnonwoven roll goods into finished products such as disposable baby diapers,surgical drapes and gowns, filtration materials, wiping products, constructionmaterials, geotextiles, and numerous other end-use applications.
7 The U.S. Government limited the tariff reduction to no more than 25 percent of theoriginal tariff during the Tokyo Round. Ten-year staged reductions were also providedunder NAFTA, and more recently the U.S.-Jordan Free Trade Agreement. Also, the U.S.Government refused to review petitions to include commercial chinaware to theGeneralized System of Preference during the 1984, 1986, 1987, 1990, 1991 and 1992review exercises.
8 Jessica Franken, Government Affairs Associate, Association of the NonwovenFabrics Industry, written submission to the Commission, March 31, 2003.
F-9
The unilateral phaseout of U.S. tariffs on nonwoven roll goods during theUruguay Round, which went from a high of 16 percent in 1994 to zero as ofJanuary 1, 1999, has been at least partially responsible for a dramaticnarrowing in the gap between U.S. imports and U.S. exports of nonwoven rollgoods (as measured in kilograms) over the past six years. Imports of nonwovenroll goods to the United States increased more than 140 percent during1996-2001, while U.S. exports have risen by a more modest rate of 59 percentover the same period. The United States exported 162 percent more nonwovenroll goods than it imported during 1996, although by 2001 that gap hadnarrowed such that the U.S. exported 72 percent more nonwoven roll goodsthan it imported. Given these trends, INDA is concerned that imports ofnonwoven roll goods to the U.S. will match, and perhaps exceed, U.S. exportswithin the next few years.
“The nonwovens industry has often been regarded as one of the few brightpoints within the struggling textiles sector of the U.S. economy, but these dutyimbalances threaten to reverse that trend.” INDA requests that the USITCreflect in its investigation the difficulties its industry has experienced as a resultof the elimination of tariffs of nonwoven roll goods during the Uruguay Round.
Benjamin Goodrich9
Benjamin Goodrich is employed by the Institute for InternationalEconomics. However, the views expressed in his submission are his own anddo not necessarily reflect the views of individual colleagues or the members ofthe Institute’s Board or Advisory Committee.
Mr. Goodrich generally holds a favorable view of all the subject tradeagreements. His submission emphasizes a number of points for theCommission to keep in mind when evaluating the effects of the subject tradeagreements on the U.S. economy. It also discusses the merits and shortcomingsof various economic models that can be used to estimate the counterfactualcondition expressed as “What would the U.S. economy look like if the UnitedStates had not implemented a certain trade agreement?”
Blue Diamond Growers10
Blue Diamond Growers is a nonprofit farmer-owned marketing cooperativethat markets almonds, hazelnuts, macadamia nuts, and pistachios for its
9 Benjamin Goodrich, Institute for International Economics, written submission tothe Commission, Jan. 3, 2003.
10 Susan Brauner, Director of Public Affairs, Blue Diamond Growers, writtensubmission to the Commission, Mar. 27, 2003.
F-10
members. The almonds are grown exclusively in California and are thelargest tree crop in the State. Almonds are the largest valued agriculturalexport from California. Over 75 percent of the world’s supply of almonds isproduced in California.
Tokyo Round and Uruguay RoundBlue Diamond Growers (BDG), and almonds in general, benefitted
significantly from the Tokyo and Uruguay Rounds. These agreements openedmarkets for almonds worldwide. As a result of these two agreements, U.S.almond exports increased by 25 percent to Europe, 1,100 percent to EasternEurope, 300 percent to the Middle East, and 200 percent to Asia during1996-2002.
U.S.-Israel Free Trade AgreementBDG, and almonds in general, benefitted from the United States-Israel Free
Trade Agreement until the agreement was renegotiated in 1995. U.S. almondexports were adversely affected by the 1995 changes which increased duties onU.S. exports of almonds to Israel by a factor of four thereby closing the marketfor U.S. exports. In 1997, a TRQ was applied which allowed limited access ofalmonds to Israel, but was too restrictive to provide meaningful amounts oftrade. BDG believes that if all barriers to trade with Israel were removed,almond exports to Israel would grow from about $10 million in 2002 to about$25 million within five years.
U.S.-Canada Free Trade AgreementBDG, and almonds in general, benefitted significantly from the
U.S.-Canada Free Trade Agreement which enhanced and stabilized marketaccess. The value of U.S. almond exports to Canada grew by 90 percent during1996-2002 reaching $37 million.
NAFTABDG, and almonds in general, benefitted significantly from NAFTA
because it enhanced and stabilized market access. The value of U.S. almondexports to Mexico grew by about 300 percent during 1996-2002, reachingabout $11 million.
F-11
Florida Citrus Mutual11
Florida Citrus Mutual (FCM) is a voluntary cooperative association whoseactive membership consists of more than 11,000 Florida growers of citrus forprocessing and fresh consumption. FCM accounts for as much as 80 percent ofall oranges grown in the United States for processing into juice and other citrusproducts. The 6-year staged reduction of U.S. tariffs on orange juice fromWTO-member countries under the URA, and the 15-year staged elimination ofthe U.S. tariff and tariff rate quota on orange juice from Mexico under NAFTAencouraged under-priced imports, which contributed directly to the erosion ofU.S. processing orange prices and grower earnings. FCM believes that thisdamage occurred without any counterbalancing positive effects on U.S. orangejuice exports.
Uruguay RoundThe URA has increased the inflow of under-priced Brazilian orange juice
into the U.S. market with severe negative consequences for the U.S. citrusindustry. Brazil, the world’s largest orange juice producer, was the primarybeneficiary of the United States’ URA commitment to reduce orange juicetariffs by 15 percent. These staged tariff reductions led to the plunging importunit value of Brazilian juice. In 2002, the average value per liter of importsfrom Brazil was 31 percent less than the average during the 5 years prior toURA implementation (1990-1994).
NAFTANAFTA has adversely affected U.S. orange growers by increasing Mexico’s
exports of orange juice to the United States. The United States has committedto a 15 year phase-out schedule for U.S. tariffs on Mexican orange juice. TheUnited States is Mexico’s largest export market for orange juice, and Mexicohas the ability to divert fruit from fresh domestic consumption into orangejuice processing. U.S. imports from Mexico have not risen as rapidly asexpected as a result of NAFTA, primarily owing to droughts and citrus diseasesin Mexico as well as the strong Mexican peso and heavy competition fromBrazil and CBERA-eligible orange juice. However, U.S. imports of frozenconcentrated orange juice from Mexico have exceeded the NAFTA TRQ inevery year, except 2001. The primary effect of Mexican imports has been toerode U.S. prices. In 2002, the average price from Mexico was 25 percent lessthan the average during the 5 years prior to NAFTA implementation(1989-1993).
11 Andrew Lavigne, Executive Vice President and CEO, Florida Citrus Mutual andMatthew T. McGrath, Barnes, Richardson & Colburn, on behalf of Florida CitrusMutual, written submission to the Commission, Mar. 31, 2003.
F-12
Florida Tomato Exchange12
The Florida Tomato Exchange (FTE) represents a substantial majority ofthe fresh tomatoes produced in the state of Florida.
During the winter months Florida produces most of the tomatoes growncommercially in the United States. The FTE supports free trade and openmarkets, but only provided such trade is fair. The growers represented by FTEare not subsidized, do not receive price supports, or deficiency payments, loanguarantees, or export credit assistance.
NAFTAMany years prior to passage of NAFTA, FTE presented statements to
Congress, USTR, and USITC that tomatoes were an import-sensitivecommodity and, without meaningful safeguard provisions regarding tomatoimports from Mexico, Florida’s tomato growers would be substantially harmed.NTE’s recommendations for safeguard provisions were not adopted, but ratherother “traditional” safeguard provisions were used. After NAFTA was enactedin 1994, Mexico flooded the U.S. market with fresh tomatoes. When NTEattempted to use the NAFTA safeguard provisions that were intended solely toassist Florida’s tomato and pepper growers, they were unsuccessful. Estimatesof the harm to NTE’s growers totaled approximately $125 million per winterseason, and over $1 billion to date. A major tomato packing house in Floridaclosed its door. The industry estimates that upwards of 10,000 workers inFlorida have lost their jobs as a direct result of NAFTA. The NTE filed anantidumping suit, and in 1995 the U.S. Department of Commerce preliminarilyfound that Mexican producer-exporters dumped tomatoes in the U.S. market. Asuspension agreement was negotiated and a second suspension agreement wasnegotiated by Commerce in December 2002. Although the NAFTA packageincluded transitional assistance for workers displaced by NAFTA, the monetaryand work assistance were deficient and many or most workers did not completethis training and others who followed and would have been eligible, did noteven try. The only relief that was useful to the industry was the long-standingantidumping statute.
12 Reginald L. Brown, Executive Vice President, Florida Tomato Exchange, writtensubmission to the Commission, Feb. 11, 2003.
F-13
Generic Pharmaceutical Association13
The Generic Pharmaceutical Association (GPA) represents more than 140companies that manufacture and support the generic pharmaceutical industryand whose membership accounts for more than 90 percent of generic drugsdispensed in the United States.
GPA supports the need for both pharmaceutical innovation and thepreservation of intellectual property rights, as provided for in the tradenegotiations conducted over the last two decades. The association notes,however, that their membership is uniquely impacted by the agreements onintellectual property, and as a consequence, increased oversight is required toinsure that its interests are appropriately addressed.
Under the Uruguay Round, the TRIPS agreement established a patent termof 20 years, for products patented after June 7, 1995. This agreement obligedthe United States to lengthen patent terms from 17 years to 20 years, thereby,increasing the time during which the consumer is denied access to lower-pricedpharmaceuticals. GPA cited a 1995 study that calculated “(t)he annual genericsavings lost by American consumers due to delayed generic entry will rangefrom $200 million in some years to $500 million in other years.”14 This studyalso calculated that the U.S. Government could lose $1.25 billion over the twoyears following the publication’s release, based on purchases for Medicaid,Medicare, the Veteran’s Administration, and the Department of Defense.
International IntellectualProperty Alliance15
The International Intellectual Property Alliance (IIPA) represents the U.S.copyright-based industries in bilateral and multilateral efforts to improveinternational protection of copyrighted materials. IIPA’s six member tradeassociations represent over 1,100 U.S. companies producing and distributingmaterials protected by copyright laws throughout the world.
13 Kathleen D. Jaeger, R.Ph., J.D, President & CEO, Generic PharmaceuticalAssociation, written submission to the Commission, Feb. 14, 2003.
14 Stephen W. Schondelmeyer, “Economic Impact of GATT Patent on CurrentlyMarketed Drugs,” PRIME Institute, College of Pharmacy, University , Mar. 1995.
15 Maria Strong, Vice President and General Counsel, International IntellectualProperty Alliance, written submission to the Commission, Feb. 14, 2003.
F-14
Both NAFTA and the Uruguay Round have played an important role inelevating the standards of copyright protection and enforcement around theworld although the NAFTA intellectual property provisions, which in severalways, provide better copyright protection than that of the Uruguay RoundTRIPS16 agreement. NAFTA’s Intellectual Property Rights chapter stillcontains problematic issues regarding secondary uses of sound recordings andCanada’s extension of its “cultural industries” exclusion to intellectual property.The multilateral reach of TRIPS and the regional reach of NAFTA haveprovided firm foundations for countries to improve their copyright laws andenforcement mechanisms to protect both domestic and foreign rightsholders.The TRIPS agreement achieved major obligations desired by the copyrightindustry. The enforcement obligations of the TRIPS agreement provide acomprehensive foundation for the development of the procedures and remediesnecessary for effective enforcement against copyright piracy.
National Association of Manufacturers17
The National Association of Manufacturers (NAM) represents about 14,000U.S. manufacturing companies, including approximately 10,000 small andmedium-sized firms, and more than 200 sector specific industrial tradeassociations.
All of the trade agreements under investigation have been “unambiguously”positive for the U.S. economy.
NAFTANAFTA has been an important source of U.S. manufacturing export
growth. “The U.S. merchandise trade deficit with Mexico is mainly caused byU.S. oil imports and U.S.-Mexico trade in the highly integrated automotivesector.” GDP in motor vehicles increased at an average annual rate of4.8 percent during 1995-99 (while the rest of GDP grew at 3.8 percent.) Inaddition, “NAFTA has contributed to making U.S. manufacturing firms moreglobally competitive by permitting easier access to cheaper industrial inputsand allowing bigger companies to reallocate resources in such a way as tofacilitate just-in-time manufacturing and outsource low-skill, low-pay activitiesto Mexico while retaining high-skill, high wage activities in the United States.”NAFTA has improved regional competitiveness by “facilitating the
16 Trade-related aspects of intellectual property rights.17 Frank Vargo, Vice President, International Economic Affairs, National
Association of Manufacturers, written submission to the Commission, Mar. 31, 2003.
F-15
improvement of North America’s transport infrastructure.” “NAFTA has notshifted U.S. foreign direct investment in manufacturing to Mexico andCanada.” “Foreign direct investment from other countries into Mexico andCanada, ... has increased under NAFTA” sustaining stable economies in thesecountries that “benefit U.S. economic and national security interests.”
Uruguay RoundThe URA has “benefitted U.S. manufacturing in multiple ways.” It has cut
industrial tariffs, most importantly in the zero-for-zero or tariff-harmonizationagreements that eliminated tariffs for major industrial sectors among a criticalmass of participating countries. It has also incorporated intellectual propertyright protection into the system of global trading rules; improved the GATTsubsidies code;
made progress in defining and proscribing the use of certain trade-relatedinvestment measures by governments; and established a binding disputemechanism for resolving government-government commercial disputes.Although the effects of the URA were generally positive, they failed toincrease “effective market access for U.S. manufactured exports to the newlyindustrializing economies of developing nations.”
National Electrical ManufacturersAssociation18
The National Electrical Manufacturers Association (NEMA) is the largesttrade association representing the interests of U.S. electrical industrymanufacturers. NEMA has more than 400 member companies, most of whichare small and medium-sized, that manufacture products used in the generation,transmission, distribution, control, and use of electricity.
NEMA supports world-wide elimination of tariffs on electrical, electronic,and medical imaging equipment through WTO zero-for-zero tariff elimination;through regional agreements; and through bilateral trade agreements.
NAFTAApproximately one-half of U.S. exports of NEMA-type products are
destined for Canada and Mexico, and NAFTA has been the motor driving thegrowth of these exports since 1994.
18 Statement by Timothy Richards, General Electric, on behalf of the NationalElectrical Manufacturers Association (NEMA), written submission to the Commission,Mar. 28, 2003.
F-16
Uruguay Round“The Uruguay Round (UR) did not go far enough in eliminating tariffs in
[NEMA’s] industries.” Many countries refused to sign the UR agreement toeliminate tariffs on medical equipment, and the medical equipment“zero-for-zero” did not cover some critical components and parts of medicaldevices. “High tariffs remain a major barrier” to NEMA’s member sales“outside the EU, NAFTA, and Japan,” “particularly in more advanceddeveloping countries that are rapidly industrializing.” Standards and technicalbarriers remain in the European Union (EU) and Japan which hamper the salesof NEMA members and although tariffs in these countries are still relativelylow they still cost NEMA members millions of dollars.
National Milk Producers Federation andU.S. Dairy Export Council19
The National Milk Producers Federation (NMPF) is a national farmcommodity organization that represents dairy farmers. The U.S. Dairy ExportCouncil (USDEC) is a non-profit organization that represents the export tradeinterests of U.S. milk producers, dairy cooperatives, proprietary processors,export traders, and industry suppliers.
Tokyo RoundThe Tokyo Round had only “marginal impact on global agricultural trade”
including dairy products. “Unlike the Uruguay Round, which succeeded it, theTokyo Round left most non-tariff trade barriers, export subsidies, and domesticsupport programs virtually untouched.” Tariffs and other import barriers werenegotiated on the basis of a request/offer approach, which resulted in many ofthe most sensitive products being subjected to minimal access improvements orbeing excluded from the negotiations altogether. The Tokyo Round also led topositive agreements, including the International Dairy Agreement and thecheese quota.
The International Dairy Agreement provided for minimum export prices forsome key dairy products in an attempt to bolster world prices although withinfour years of implementation, the EU developed a substantial domestic dairysurplus and began to export butter at below the minimum agreed prices. Inreaction, the United States withdrew from the Agreement.
19 Peter Vitaliano, Ph.D., Vice President, Economic Policy and Market Research,National Milk Producers Federation, written submission to the Commission, March 31,2003.
F-17
“The Tokyo Round agreement on U.S. cheese import quotas helped shieldthe industry from heavily subsidized European dairy imports” but also resultedin higher cheese imports because the United States established quotas aboveprevious import levels. Prior to this agreement, cheeses valued below certainfixed prices were permitted to enter the United States only with an importlicense, which allowed the government to restrict volumes below levels thatwould undermine the dairy price-support program. The Tokyo Roundinstitutionalized the large, subsidized dairy trade from the EU and consequentlya distorted world dairy trade situation overall.
The U.S.-Canada Free Trade AgreementAlthough the U.S.-Canada Free Trade Agreement (CFTA) phased out most
import restrictions and agricultural tariffs over a ten-year period, dairy wasexcluded from these commitments and U.S. dairy exporters have virtually noaccess to the Canadian market. Canada and the United States agreed tomaintain import quotas on dairy and certain other products.
NAFTA“NAFTA has had a positive qualitative and quantitative impact on U.S.
dairy producers and processors.” Under NAFTA, all non-tariff barriers toagricultural trade between the United States and Mexico were eliminated, andmost tariffs were eliminated over a ten-year period, including those applying todairy products. Unlike CFTA, NAFTA provides for the phased elimination ofall dairy tariffs between the United States and Mexico. Stringent rules of originwere written into NAFTA in order to ensure that the benefits of preferentialaccess would only accrue to those items produced in North America. Tariffs onall dairy products reduce to zero over a ten-year phase out period, except onskim milk powder exported from the United States to Mexico, which will beeliminated over 15 years.
U.S.-Israel Free Trade AgreementThe U.S.-Israel FTA “has not been beneficial to the U.S. dairy industry.”
Uruguay RoundThe Uruguay Round Agreements (URA) “achieved many of the objectives
for improving disciplines for global agricultural trade that could not beachieved in previous GATT negotiations.” The URA established internationaldiscipline that eased future negotiations although the United States paid aheavy price to accomplish the agreement in the form of tariff disparities amongcountries. “Perhaps the most significant accomplishment of the UR marketaccess agreement in agriculture was the conversion of all non-tariff measures
F-18
into tariffs” including U.S. Section 22 dairy import quotas, EU variable importlevies, and the Canadian and Japanese import licensing systems.
The URA also required countries to reduce agricultural export subsidies by21 percent in volume terms and 36 percent in budgetary outlays whichprimarily affected the EU which, even after the agreement, continues tomaintain about 72 percent of world dairy export subsidies. The export subsidiescommitment left a huge competitive advantage with the EU and helped thembuild a market in the United States at the expense of domestically producedcheese, butter, and milk protein powders.
Further, the URA required all countries to establish ceilings for the amountof support afforded producers through internal support mechanisms. Theagreement left the EU with a “huge competitive advantage” that has “harmedthe U.S. dairy industry.” “On the other hand, expenditures in programs such asthe de minimis clause as well as the green box have assisted the [U.S.] dairyindustry as well as the U.S. agriculture overall.”
Nucor Corporation and TXIChaparral Steel20
Nucor Corporation (Nucor) and TXI Chaparral Steel (Chaparral) are two ofthe largest steel producers in the United States. Nucor produces a variety offlat-rolled and long products and Chaparral produces only long products,including beams, hot-rolled bar, and rebar.
NAFTA and the URA have provided foreign exporters and investorsgreater access to the U.S. market, but reciprocating benefits for U.S. exportersand investors have not reached full potential. Nucor and Chaparral contend thatmany developing countries maintain high import tariffs on products such assteel even though their producers are in a position to effectively “competeinternationally without protection.” These producers have the advantage of aprotected home market from which to penetrate other markets, particularly theUnited States. Further, most developed countries have made it more difficult, ifnot impossible, for U.S. producers to enter their markets by replacing hightariffs with non-tariff barriers, including the use of restrictive technicalstandards and by tolerating anti-competitive practices by local industries. Untilthese nontariff barriers are effectively addressed, the U.S. industry willcontinue to reap far less advantage from trade agreements than intended.
20 Alan H. Price and John R. Shane, Wiley Rein and Fielding LLP, on behalf ofNucor Corporation and TXI Chaparral Steel written submission to the Commission,Mar. 31, 2003.
F-19
NAFTA has given rise to the “circumvention of antidumping orders.”Structural steel beams from Japan and Korea are being transshipped throughCanada to circumvent antidumping orders in the United States.21 Althoughthere is no production of beams in Canada, U.S. imports of product fromCanada were valued at $2.3 million and $2.1 million in 2001 and 2002,respectively. This is a two-fold problem that provides the means and incentivefor foreign producers and exporters to circumvent such U.S. duty orders bytransshipping subject merchandise through Canada and Mexico. First, NAFTAdoes not provide for common enforcement of antidumping and countervailingduty orders. Second, there are NAFTA rules for establishing NAFTA origin formerchandise, but there is no mechanism “for ensuring that the country of originmerchandise imported into one NAFTA country is not altered before themerchandise is re-exported to another NAFTA country.” Nucor and Chaparralrecommend amending NAFTA to correct these problems without relinquishingthe current practice of allowing NAFTA members to imposeantidumping/countervailing duties on imports from other NAFTA members.
Pharmaceutical Research andManufacturers of America22
The Pharmaceutical Research and Manufacturers of America (PhRMA) isthe national association representing the U.S. research-based pharmaceuticalindustry.
PhRMA is highly supportive of each of the subject trade agreements andPhRMA members have reaped enormous benefits from these trade agreementswhich have opened up foreign markets to U.S. exports. The industry benefittedgreatly from the improved intellectual property protection, reduced technicalbarriers to trade, and “the zero for zero” initiative of the United States thateliminated duties on many active ingredients and intermediates.
While the U.S. industry has fared well with these treaties, not all tradeagreements were created equal. The most acceptable agreement would be onethat provides intellectual property protection comparable to that found in theUnited States, whereas the TRIPS agreement established only a minimum level
21 The antidumping orders specifically cover merchandise that has been drilled,punched, notched, painted, coated, or clad and include products classified under theHarmonized Tariff Schedule numbers 7216.32, 7216.33, 7216.50-7216.99,7228.70.3040, and 7228.70.6000.
22 Andrew W. Shoyer, USITC hearing testimony on behalf of the PharmaceuticalResearch and Manufacturers of America, Jan. 14, 2003.
F-20
of protection for intellectual property protection. More recent multinationaland bilateral agreements have improved the protection for intellectualproperty rights that was initiated in the TRIPS agreement and extended andclarified in the NAFTA. For example, the U.S.-Jordan FTA provided forimproved data protection, allowed biotech products to be patentable, limitedcompulsory licensing, and extended the patent period to allow for time lostbecause of regulatory delays.
Other elements of the trade agreements have also been quite beneficial. TheWTO Agreement on Technical Barriers to Trade extended the work of theTokyo Round. The plurilateral Agreement on Government Procurement limitedthe ability of government procurement practices to create artificial barriers totrade. The Agreement on Government Standards reduced the ability ofcountries to use regulations, standards, and testing and certification proceduresas tools to restrict trade. The association supports measures that such as thoseembodied in the U.S.-Jordan FTA that protect the pharmaceutical industry fromparallel imports, a practice in which products are sold at a lower price in onecountry (usually a poor country) and then resold at a higher price, by a thirdparty, in another country (usually a richer country).
Specialty Steel Industry ofNorth America23
Specialty Steel Industry of North America (SSINA) is an associationrepresenting virtually all North American specialty steel producers. Specialtysteels are high technology, high value stainless and other specialty alloyproducts.
The objectives of the subject trade agreements–opening markets andadopting trade laws that ensure free and fair trade between these markets,including the zero for zero gradual phase-out of tariffs on steel products underthe Uruguay Round Agreements–have not been met for U.S. manufacturingindustries, including SSINA.
Tokyo RoundThe Tokyo Round Agreements were a major step in determining
international dumping and subsidy rules, and U.S. implementation of thisagreement afforded domestic specialty steel producers the opportunity to seekeffective redress against unfair trade practices.
23 David A. Hartquist and Kathleen W. Cannon, Collier Shannon Scott, PLLC, onbehalf of the Specialty Steel Industry of North America (SSINA), written submission tothe Commission, Mar. 31, 2003.
F-21
Uruguay RoundThe Tokyo Round trade laws governing dumping and subsidization have
been significantly modified and weakened to the detriment of U.S.manufacturing industries by subsequent Uruguay Round Agreements and bythe World Trade Organization (WTO) Dispute Settlement Body’s interpretationof the agreements. URA modifications have resulted in a noticeable reductionin dumping margins, permissible subsidy practices formerly prohibited, andearly termination of certain orders under sunset review. Further, the WTODispute Settlement Body has used the settlement process to legislate and makedecisions on issues not agreed to by GATT Contracting Parties during theUruguay Round negotiations, which overturn U.S. laws as well as manylong-established practices and methodologies. The U.S. Congress andAdministration should not permit further weakening of the laws addressingunfair trade practices as proposed in the current Doha Round of Negotiationsby a group of countries calling themselves by the misleading name of Friendsof Antidumping.
The Ranchers-Cattlemen Action LegalFund-United Stockgrowers of America24
The Ranchers-Cattlemen Action Legal Fund - United Stockgrowers ofAmerica (R-CALF USA) is a non-profit association that represents thousandsof U.S. cattle producers on issues concerning national and international tradeand marketing. R-CALF USA’s membership consists primarily of cow-calfoperators, cattle backgrounders, and feedlot owners. Its members are located in42 states, and the organization has over 30 local and state cattle associationaffiliates.
U.S.-Canada FTA and NAFTAFor live cattle, there was a significant increase in imports from Canada.
Prior to the USCFTA, imports of Canadian cattle into the United Statesremained flat and averaged 368,000 head per year from 1978 to 1988. In 1989,U.S. imports began a generally strong upward trend with imports during thepast five years averaging over 1,160,000 head annually. Live cattle importsfrom Mexico, on the other hand, have not increased. For the five years prior toNAFTA, imports from Mexico averaged 1,089,379 head annually, but for themost recent five year period averaged only about 938,177 annually. U.S.exports of live cattle to Canada are restricted, but a post-NAFTA agreement,
24 Leo R. McDonnell, Jr., President, R-CALF USA, written submission to theCommission, Feb. 14, 2003.
F-22
the Northwest Pilot Program, has led to increased exports when certainsanitary conditions are met. U.S. shipments of live cattle to Canada grewfrom 40,000 head in 1996 to 349,536 head in 2000. U.S. exports of livecattle to Mexico have generally increased since NAFTA, from 62,683 head in1994, to 363,887 head in 2001.
U.S. imports of beef from Canada increased markedly following theUSCFTA, growing from 81,138 metric tons in 1990 to 335,163 metric tons in2000. During the same time period, U.S. exports of beef to Canada remainedflat, slipping from 90,892 in 1991 to 87,480 metric tons in 2000. U.S. beefexports to Mexico have grown significantly following NAFTA. Since 1995,U.S. exports have risen steadily with export volumes some 2.5 times greaterthan in the years prior to NAFTA, to about 178,749 metric tons, and worthsome $531 million. U.S. beef imports from Mexico have increasedconsiderably since NAFTA, growing from 591,340 kilograms in 1994 to3,412,582 kilograms in 2001, worth about $15 million.
Prior to the USCFTA and NAFTA, U.S. tariffs on imports of Canadian andMexican beef limited access into the U.S. market. However, the U.S. MeatImport Law, which was replaced by a tariff rate quota during the UruguayRound, was even more important in controlling the amount of imported beefentering the U.S. market.
Tokyo RoundPrior to the completion of the Tokyo Round, Japan controlled imports of
beef through quotas. During the Tokyo Round, the United States sought alarger allotment within Japan’s quota for higher quality grain-fed beef. Anagreement was reached between the United States and Japan in 1978 and led toincreased access for U.S. beef in the Japanese market.
U.S. Israel Free Trade Area AgreementIn 1985, the United States and Israel signed an FTA calling for the phasing
out of tariffs by 1995. In 1996, the United States and Israel signed theAgreement on Trade in Agricultural Products (ATAP). The ATAP was set toexpire on Dec. 31, 2001. However, it was extended through 2002 with tariffsand tariff rate quotas maintained at 2001 levels. Despite the FTA, exports ofU.S. frozen beef to Israel were, as of 2001, subject to a TRQ of 8815 metrictons, and fresh and chilled U.S. beef was subject to a TRQ of 1,217 metrictons. In-quota imports of these products enter duty-free. U.S. beef exports toIsrael are small totaling only $203,000 in 2001, mostly frozen product. Animportant impediment to U.S. beef exports to Israel is the Israeli Kosher MeatImport Law of 1994, which bans the importation of any meat or meat productthat is not certified as kosher by Israel’s chief rabbinate.
F-23
Uruguay RoundThe Uruguay Round promoted U.S. exports of beef to Japan and Korea,
but not the EU. As part of the Uruguay Round, the United States and Japansigned the Beef-Citrus Agreement which phased out Japan’s import quota and25 percent tariff on beef. These were replaced with a 70 percent tariff in 1991,which was reduced to 60 percent in 1992 and 50 percent in 1993. The phasingout of Japan’s quota had a dramatic impact on U.S. exports of beef and offal toJapan, which rose by almost 90 percent by value from 1988 to 1990. Duringthis time, exports by volume rose by 50 percent. The Beef-Citrus Agreement,while not necessarily part of the formal Uruguay Round negotiations, wasnegotiated after the Uruguay Round began. Concessions made by Japan duringUruguay Round continue to benefit the U.S. beef industry. The United States isthe main beef exporter to Japan with 48 percent of Japan’s import market.
The Beef-Citrus Agreement between the United States and Japan served asa model for opening the Korean market to imports of U.S. beef. DuringUruguay Round negotiations, Korea and the United States reached agreementon global access to the Korean beef market. Under the Uruguay RoundAgreement on Agriculture, Korea agreed to increase its minimum imports ofbeef two-fold to 225,000 metric tons by 2000. Imports of beef by Korea wouldbe unrestricted as of 2001, but a tariff of 41.2 percent would be imposed onsuch imports, which would decrease to 40 percent in 2004. The U.S. beefindustry has benefitted from concessions made by Korea during UruguayRound negotiations. In 2001, U.S. exports to Korea constituted 57 percent ofKorea’s beef imports.
In contrast to Japan and Korea, the outcome of Uruguay Roundnegotiations with regard to cattle and beef with the EU has not been positivefor U.S. producers. Despite a finding of the WTO that the EU’s ban on theimportation of beef treated with growth promoting hormones violates the SPSAgreement, the EU continues to block shipments of most U.S. beef.Furthermore, while the EU made cuts in subsidies for the cattle and beefindustry as a result of the Uruguay Round, this sector retains stronggovernment support. The EU’s cattle producers remain heavily subsidized, andthe 2002 budget for the EU’s beef sector was approximately $8.2 billion, orabout 17 percent of the EU’s agricultural budget. As part of its Uruguay Roundcommitments, the EU agreed to reduce export subsidies for beef from 1.9billion ECUs in 1995 to 1.3 billion ECUs in 2000. This amounted to a 26percent cut in export subsidies for beef. According to the USDA, exportrefunds provided by the EU in 2000 for beef totaled $750 million. The U.S.live cattle industry, by contrast, receives little government support, and in 2000provided no beef export subsidies to producers.
F-24
Tile Council of America, Inc.25
The Tile Council of America, Inc. (TCA) is an association comprising over40 manufacturers of ceramic tiles and related products that manufacture over50 percent of the ceramic tile produced in the United States.
Despite a tripling in U.S. demand for ceramic tile since the Tokyo Round,the cumulative impact of the five trade agreements under study in thisinvestigation have contributed to the precarious condition of the U.S. ceramictile industry. The tariff reduction provisions of these agreements, particularlythe Uruguay Round Agreement and NAFTA have encouraged large quantitiesof low-priced imports and are a major factor in the severe erosion of the U.S.industry’s market share. Between 1979, the year before the Tokyo Roundagreements entered into force, and the third quarter of 2002, import penetrationfor ceramic tile increased by 31 percentage points in terms of quantity to arecord high of 77 percent. Since 1995, following the enactment of the UruguayRound Agreement and NAFTA, U.S. consumption of ceramic tile increased by46 percent and increased imports have captured 100 percent of this growth.The growth in import penetration is largely due to price-cutting by bothtraditional and newer import sources, as demonstrated by an 18-percentdecrease in the average unit value of glazed ceramic tile imports.
Longer term staged reductions for tariffs on ceramic tile were negotiatedunder the Uruguay Round Agreement and NAFTA, in part, to provide U.S.manufacturers a period of time to make significant competitive investments inan effort to differentiate their products and minimize competition withlow-priced commodity grade imports. The TCA now questions the viability andlikely payback of these investments in light of ever increasing low-pricedimports that have suppressed prices to the point of driving many U.S.producers out of business. They report that during 2001-2002, four U.S.producers have gone out of business and two additional plants have closed. TheU.S. ceramic tile council would be seriously prejudiced by further tariffreductions or concessions and should, therefore, be excluded from such futuretrade negotiations.
25 Juliana M. Cofrancesco and John F. Bruce, Howrey, Simon, Arnold, and White onbehalf of the Tile Council of America, Inc. (TCA) written submission to theCommission, Feb. 14, 2003.
F-25
United States Tuna Foundation26
The United States Tuna Foundation (USTF) is a trade associationrepresenting all U.S. canned tuna processors and tuna boat owners. USTF hasconsistently opposed inclusion of canned tuna in the trade agreementsexamined in this report. USTF notes that several ITC reports have describedthe “import sensitive” nature of the product, as well as the decline of the U.S.industry due to imports.
During the period under review, the canning sector has shrunk from 14establishments to four, and employment has declined from more than 26,000 toslightly more than 6,000 in 2002. All but one mainland-based establishmenthave closed, and only three remain in American Samoa and Puerto Rico. In theharvesting sector, the number of boats and employment thereon have similarlydeclined. During the last ten years, imports of canned tuna have risen by 10percent and imports of frozen tuna (which, along with frozen tuna delivered byharvesting vessels, is used by canners to make canned tuna) have risen by 67percent.
USTF notes that tariffs on canned tuna imports in other large marketsremain high, for example, the tariff is 24 percent ad valorem in the EU. Mostimports into both the United States and the EU come from low-wage countriesthat, in many cases, already have duty preferences (e.g., GSP, ATPA), andfurther declines in U.S. tariff protection for the industry would further weakenthe economic health of the canners and boats.
Western Economic Analysis Center27
Lower U.S. tariffs across the board have “adversely affected” the U.S.“basic copper industry by lowering the price to domestic users of importedcopper,” but they also helped to reduce U.S. production costs by “lowering thecosts of imported supplies and equipment used by domestic copper miningfirms.” Other government policies, both foreign and domestic, have had agreater negative impact on the industry than lower tariffs. For example,financial inducements to overseas investment and measures that have madecheaper capital available to competing foreign copper producers had a muchmore significant and harmful impact on domestic producers than any relaxingof trade barriers because they provided no advantageous offset for the domestic
26 Randi Parks Thomas, United States Tuna Foundation, written submission to theCommission, Mar. 31, 2003.
27 George F. Leaming, Director, Western Economic Analysis Center, writtensubmission to the Commission, Mar. 31, 2003.
F-26
industry. The compliance deadlines imposed by regulatory agencies requireda number of producers to take on large amounts of debt financing, whichforced certain economically viable operations out of business.
The competitiveness of the domestic copper industry has been furthereroded by Federal regulatory policies that create wilderness areas, whichprecluded the commercial use of economically viable copper deposits, andpollution controls that require large capital investments. Further, the lack of aneffective antitrust policy to enforce existing legislation has resulted in a rash ofmergers and acquisitions of copper producers by non-copper producers after1976 that seriously weakened the domestic industry. More recently, foreigncorporate and financial interests in U.S. production facilities have been allowedto make U.S. production decisions that do not necessarily benefit U.S. capital,labor, or consumer interests.


![Coeficiente OKUN Ecuador 3er Encuentro[1]](https://img.pdfslide.net/doc/110x75/5571f81549795991698c998c/coeficiente-okun-ecuador-3er-encuentro1.jpg)