Embed Size (px)
Citation preview
Geographic Information Systems in Gerontology
ResearchDeborah Dunn, MPH
DrPH Student College Of Public Health
Graduate Center of Gerontology
Capacity and Potential of GIS in Gerontology
Communities must start to recognize the needs of various older subpopulations• Identifying local resources to address those needs
Tasks are often complicated• Older population growth attributable to new elderly• Migration patterns of older cohorts• Population density and resource availability or
access• Integration of community resources and service
delivery systems• Barriers to service resources
Objective
Geographic Information systems (GIS) can assist researchers and practitioners engaged in community specific analyses that focuses on the older populations and their resource environments.
Agenda Briefly define GIS Community based gerontology study Challenges & opportunities in
application Questions and Answers
Defining GIS GIS allows us to map a wide variety
of geographical phenomena GIS links selected attribute
information with digital representations of features in space
• Economic, Social, Health, Nominal Data• Points, lines, polygons represent hospitals,
ADD, senior centers
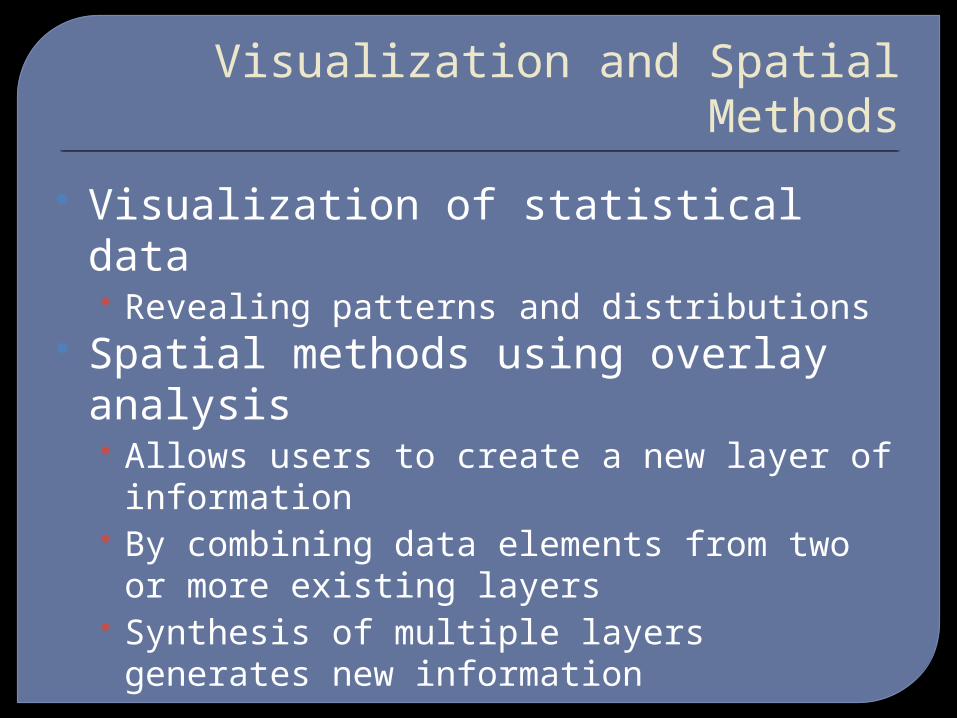
Visualization and Spatial Methods
Visualization of statistical data• Revealing patterns and distributions
Spatial methods using overlay analysis• Allows users to create a new layer of
information • By combining data elements from two or
more existing layers• Synthesis of multiple layers generates new
information
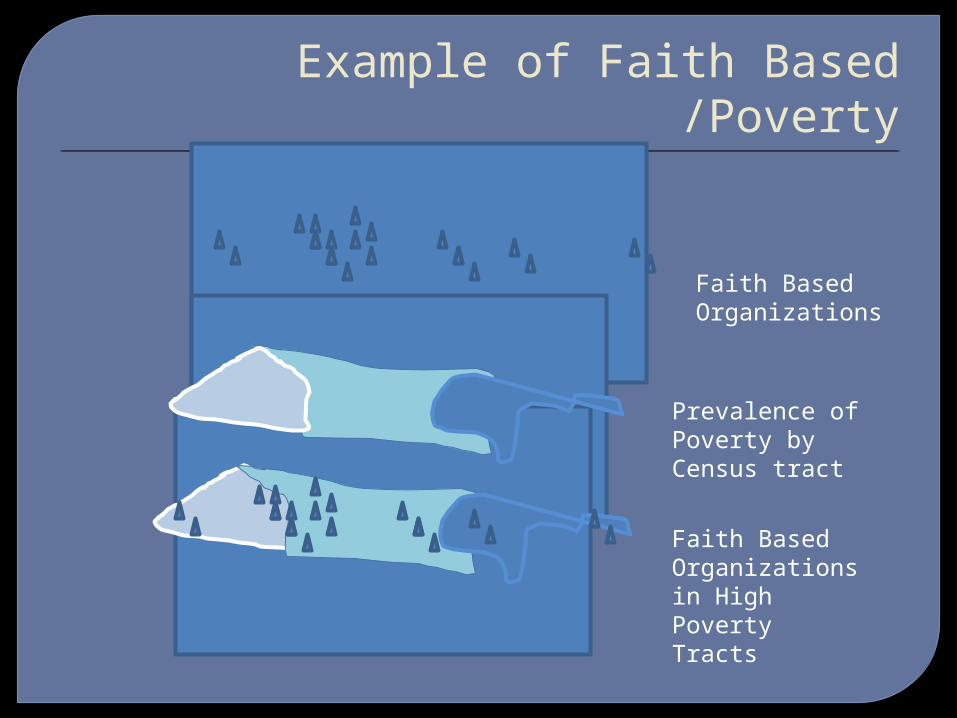
Example of Faith Based /Poverty
Faith Based Organizations
Prevalence of Poverty by Census tract
Faith Based Organizations in High Poverty Tracts
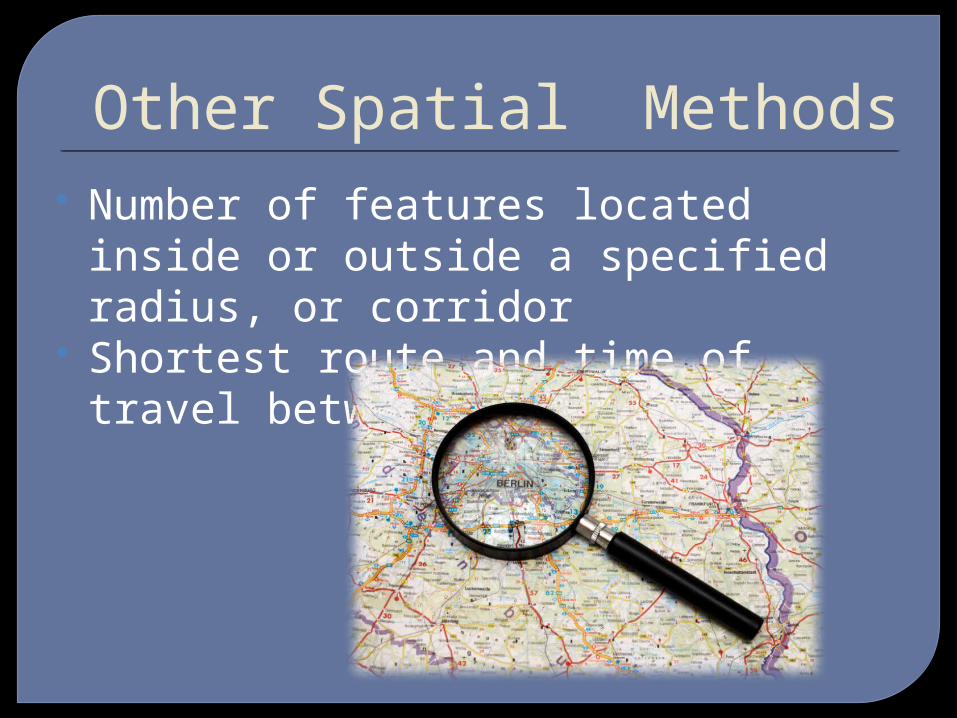
Other Spatial Methods Number of features located inside or
outside a specified radius, or corridor Shortest route and time of travel
between two points
GIS as a Research Tool Map longitudinal community data of
adults over age 65 Depict age-specific population
distribution and density patterns Identify geographic concentrations of
various elderly populations (ethnic minorities, older widows)
At risk populations with incomes below 125% of poverty
GIS as a Research Tool Locate community resources for older
people Evaluate the spatial relationship
between potentially at risk older and needed resources
Plan transportation routes Generate research questions and
hypotheses
Recent Research Multi-methodological study
conducted in KY Characteristics and needs of older
county residents and the adequacy of existing resources to meet those needs
Influx of older rural Appalachian residents to the urban city coupled with aging in place of baby boomers to predict resource adequacies
Study Objectives Validate and justify planning and
resource allocation directed at current and projected needs of community dwelling older county residents• Community based waiver
Make informed decisions regarding Capital development
Methods GIS was the first modality undertaken
• Provided important baseline information regarding key population characteristics of older county residents
• Located critical public and non profit and private sector county resources available
• Identified geographic gaps between older populations and community resources that might reflect an unmet need
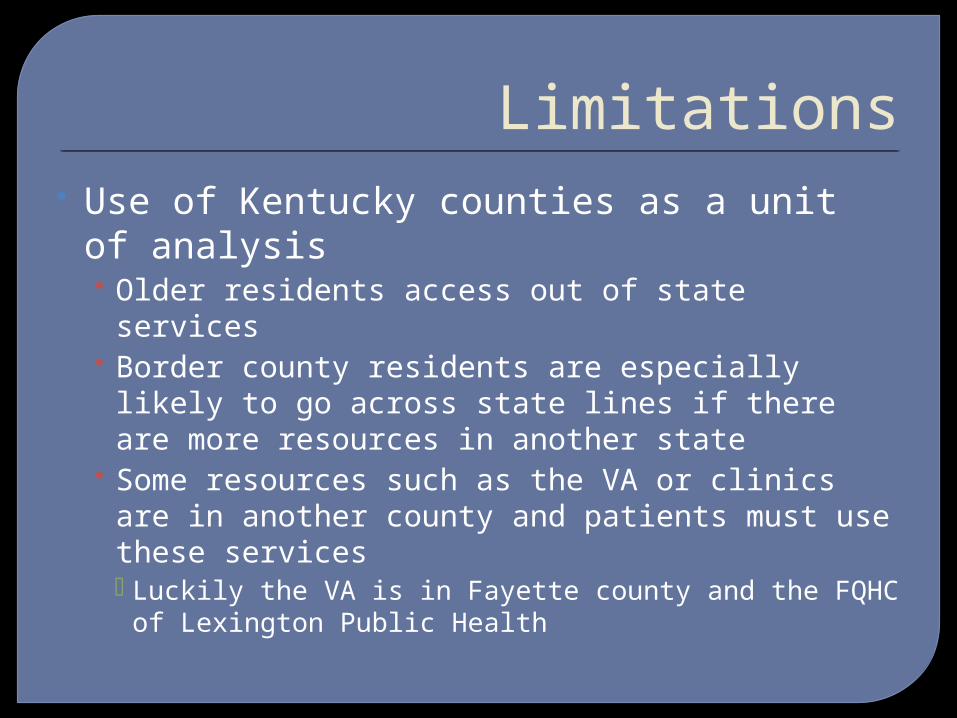
Limitations Use of Kentucky counties as a unit of
analysis • Older residents access out of state services• Border county residents are especially likely
to go across state lines if there are more resources in another state
• Some resources such as the VA or clinics are in another county and patients must use these services Luckily the VA is in Fayette county and the FQHC
of Lexington Public Health
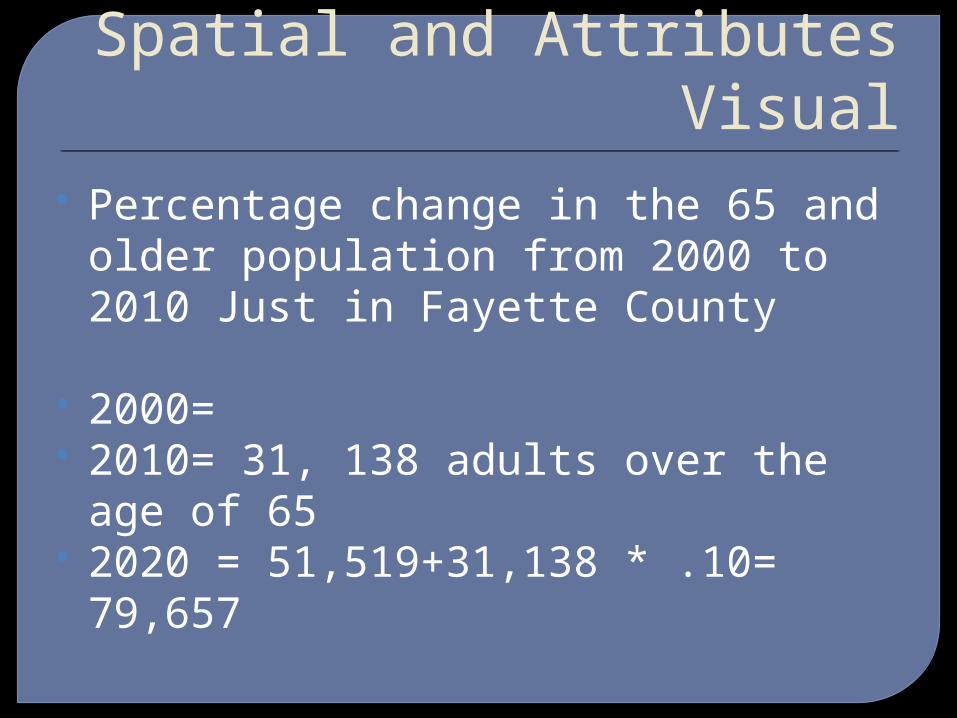
Spatial and Attributes Visual
Percentage change in the 65 and older population from 2000 to 2010 Just in Fayette County
2000= 2010= 31, 138 adults over the age of
65 2020 = 51,519+31,138 * .10=
79,657
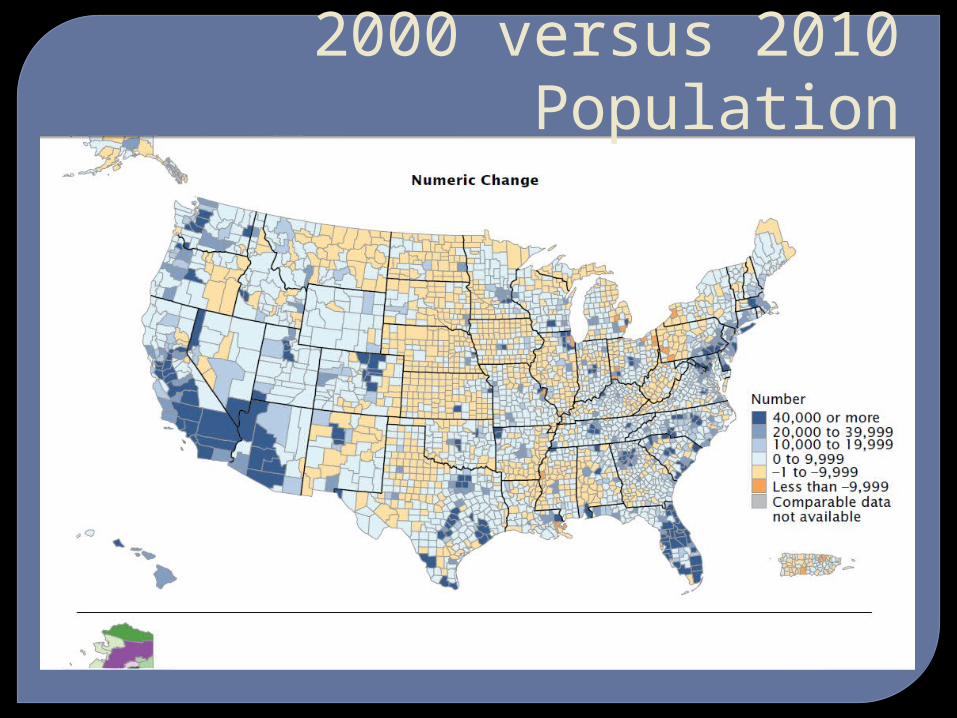
2000 versus 2010 Population
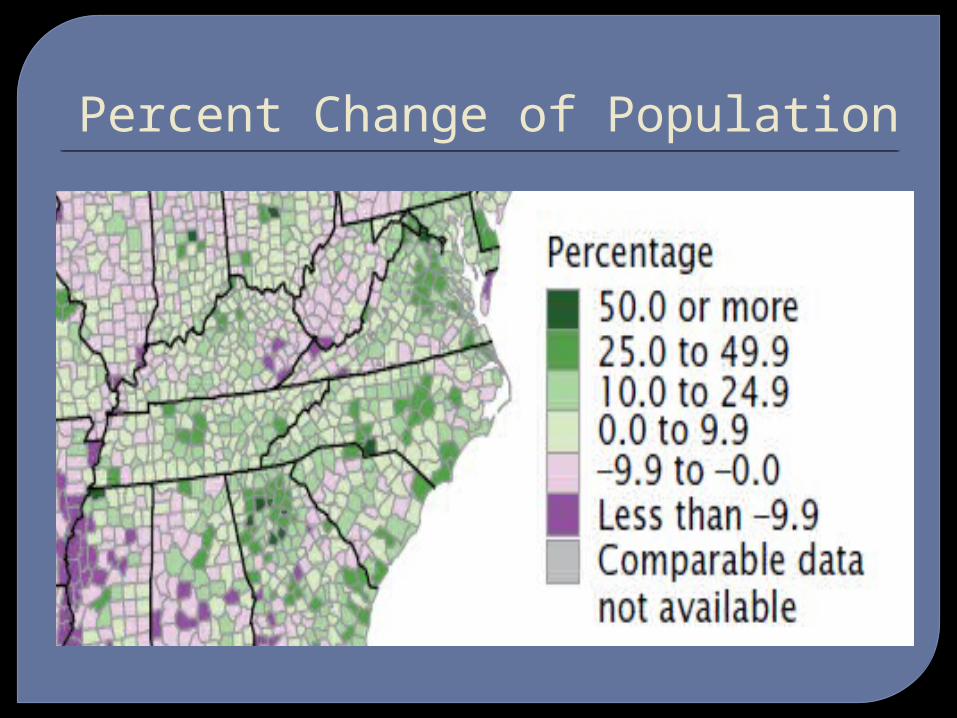
Percent Change of Population
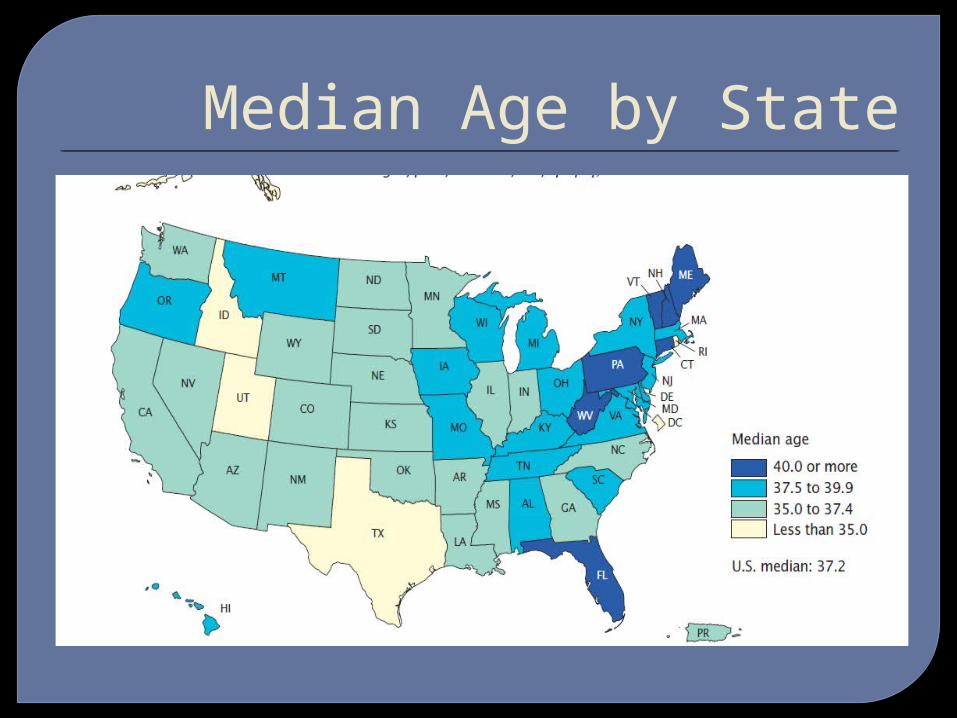
Median Age by State
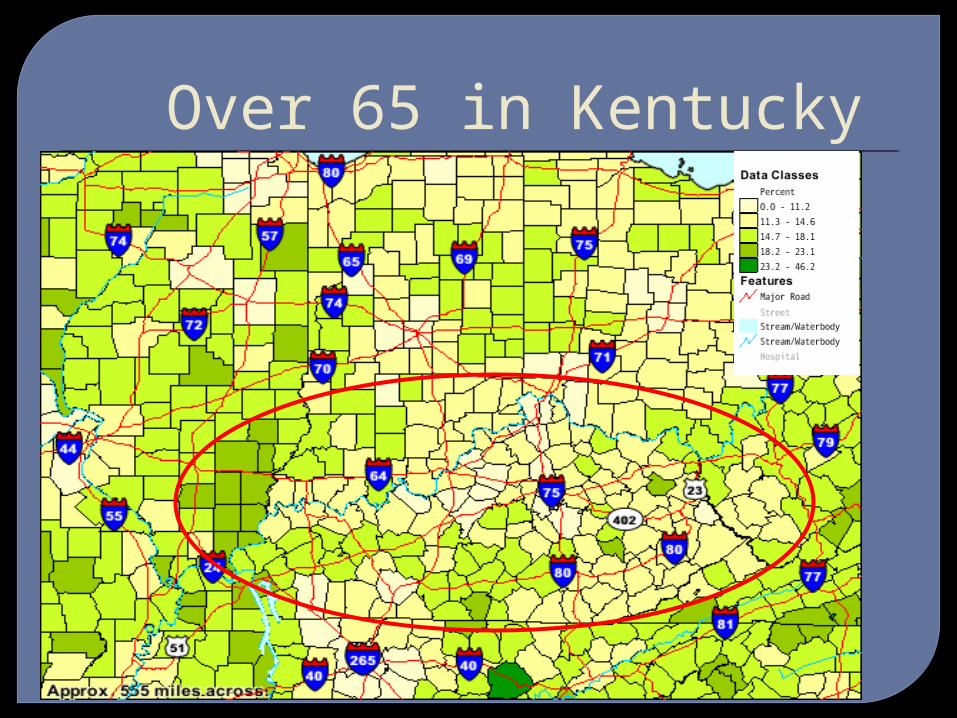
Over 65 in Kentucky
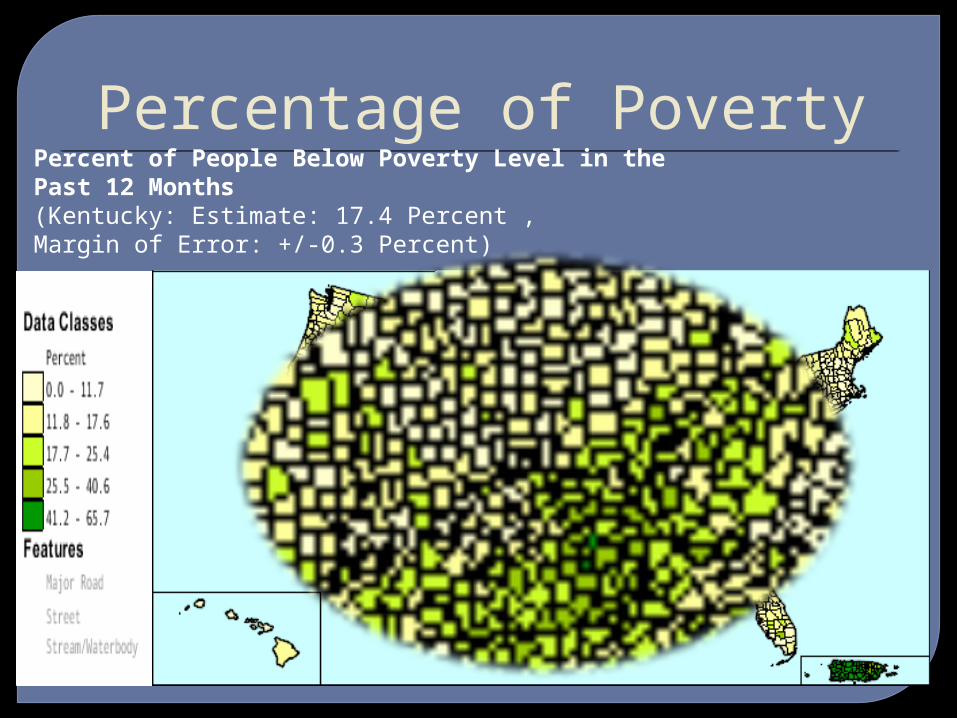
Percentage of PovertyPercent of People Below Poverty Level in the Past 12 Months(Kentucky: Estimate: 17.4 Percent ,Margin of Error: +/-0.3 Percent)
GIS Raises Awareness Questions that come out of mapping
can be further addressed in community forums
Complements other research modalities regularly used in studies of older community based populations
GIS products may raise specific research questions and aid in the formation of a hypothesis
Conclusion
Geographic Information systems (GIS) can assist researchers and practitioners engaged in community specific analyses that focuses on the older populations and their resource environments.

Questions Thank you for your attendance and
time Questions?
References Arnoff, S (1991). Geographic information
systems: A management perspective. Ottawa, Canada; WDL
Rowles, G. D. & Johansson, H.K. (1993). Persistent elderly poverty in rural Appalachia. Journal of applied gerontology. 12:349- 367.
Rowles, G. D.(1981) Geographical dimensions of social support in rural Appalachia. Aging and Milieu. San Diego
US Census Bureau (2010). Census of population and housing. Summary file. Washington DC. Tiger line files.