Embed Size (px)
Citation preview
Journal of Post Keynesian Economics / Summer 2014, Vol. 36, No. 4 781© 2014 M.E. Sharpe, Inc. All rights reserved. Permissions: www.copyright.com
ISSN 0160–3477 (print) / ISSN 1557–7821 (online)DOI: 10.2753/PKE0160-3477360409
JAKOB KAPELLER AND BERNHARD SCHÜTZ
Debt, boom, bust: a theory of Minsky–Veblen cycles
Abstract: This article reflects on the economic development leading to the recent crisis and interprets this development as a series of events within a Minsky–Veblen cycle. To illustrate this claim we introduce conspicuous con-sumption concerns, as described by Veblen, into a stock-flow-consistent post Keynesian model and demonstrate that, under these conditions, a decrease in income equality leads to a corresponding increase in debt-financed consump-tion demand. Here Minskian dynamics come into play: if perceived economic stability causes banks’ margins of safety to decrease sufficiently, increased credit demand is accommodated by credit supply giving rise to a debt-financed consumption boom. As the solvency of households decreases and interest rates move up, banks reduce lending, triggering household bankruptcies and, finally, a recession. What follows is a stable period of consolidation, where past debts are repaid, financial stability is regained and conspicuous consumption motives may gradually take over again. We illustrate this approach to the current crisis and its explanatory validity by extending our stock-flow-consistent model into a dynamic simulation.
Key words: financial instability, inequality, business cycle, stock-flow consistency, Minsky, Veblen.
JEL classifications: B52, D11, E12, E20, G01.
If one were asked by an educated layperson about the best way to under-stand the “current crisis,” which has already evolved from a financial or private debt crisis to a sovereign debt crisis, we claim that one legitimate answer would be the following: first, read Thorstein Veblen’s seminal book The Theory of the Leisure Class (especially chapters 4–5), and pay
Jakob Kapeller is an assistant professor in the Department of Philosophy and Theory of Science at the University of Linz. Bernhard Schütz is an assistant professor in the Department of Economics at the University of Linz. For helpful comments, the authors would like to thank Michael Landesmann, Martin Riese, Thomas Palley, Engelbert Stockhammer, and Octavio Fernández-Amador. Furthermore, we are greatly indebted to Miriam Rehm, who started us off on Minsky, and Stefan Steinerberger,whose patient advice guided us through our first steps in Mathematica. Remaining errors are ours.
782 JOURNAL OF POST KEYNESIAN ECONOMICS
attention to the remarkable increase in income inequality in the United States during the past decades. This might convince you that relative consumption concerns are an important factor for explaining why so many households were willing to take up so much debt. Second, read the book by Hyman Minsky called Stabilizing an Unstable Economy (in particular chapters 9–10), and you will understand which immanent forces breed the emergence of instruments such as credit default swaps (CDSs) and collateralized debt obligations (CDOs) within the banking system to meet additional credit demand and lead almost by necessity to ever riskier loan provision, thereby gradually moving the financial system from a state of relative stability to a state of extreme fragility and crisis. Finally, take a look at John Maynard Keynes’s The General Theory of Employment, Interest, and Money (chapter 3 should suffice, at least for the moment) to get a rough understanding of the principle of effective demand and the macroeconomic consequences of a sudden decrease in credit supply for employment and income.
Any reader instructed this way is possibly quite astonished when com-ing upon the publishing dates of these books (1899, 1986, 1936, respec-tively) and one is inclined to ask how such a crisis can emerge unnoticed if these books really pointed to what was to be expected.
The purpose of this article is to explore and to validate this story by illustrating how the U.S. economy finds itself in the middle of a Minsky–Veblen cycle. As a basic framework, we use the methodology of stock-flow-consistent modeling proposed by Lavoie and Godley (2002) and Godley and Lavoie (2007). By combining this framework with other concepts of different origin—the institutionary/ evolutionary concept of relative con-sumption concerns (Veblen) and Keynesian ideas on the nature of financial markets (Minsky)—this article contributes to a pluralist paradigm in the spirit of Dobusch and Kapeller (2012) that seeks to create new insights through the exploitation of complementary concepts as they are found in different schools of thought (see also Kapeller and Schütz, 2013).
Income inequality, debt, and crisis: theoretical perspectives and stylized facts
The pivotal role of the increase in income inequality in the United States as one of the main causes of the recent crisis is widely acknowledged and extensively discussed (see, e.g., Barba and Pivetti, 2009; Cynamon and Fazzari, 2008, 2013; Evans, 2009; ILO and IMF, 2010; Kumhof et al., 2012; Kumhof and Rancière, 2010; Rajan, 2010; Stiglitz, 2009; Stockhammer, 2012a, 2012b; UN Commission of Experts, 2009; van
DEBT, BOOM, BUST: A THEORY OF MINSKY–VEBLEN CYCLES 783
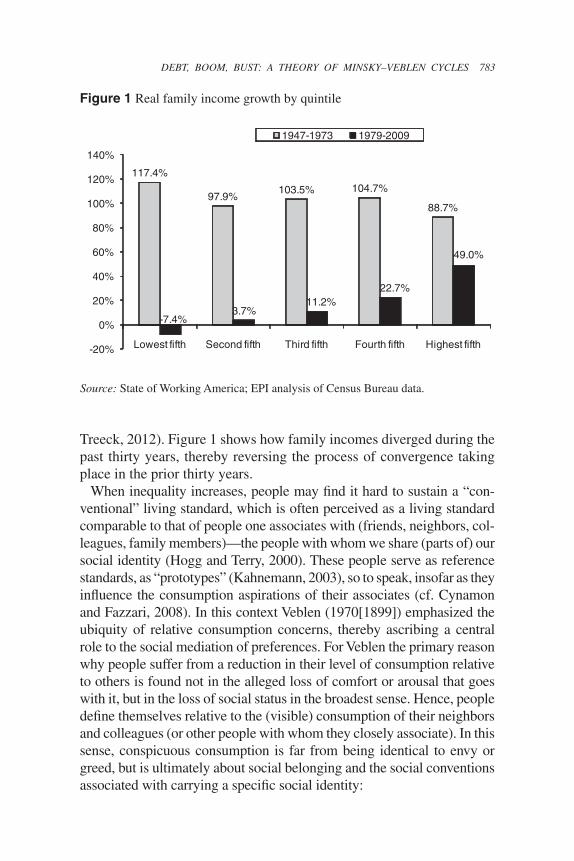
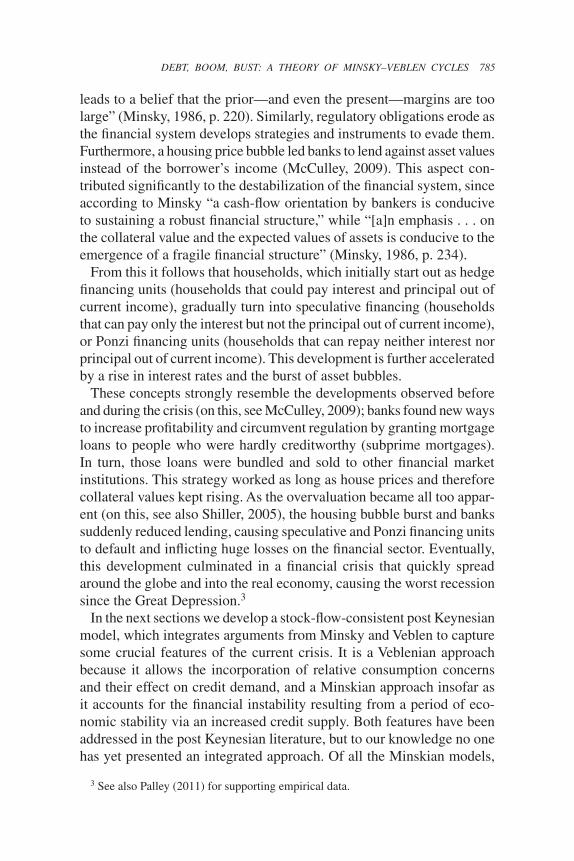
Treeck, 2012). Figure 1 shows how family incomes diverged during the past thirty years, thereby reversing the process of convergence taking place in the prior thirty years.
When inequality increases, people may find it hard to sustain a “con-ventional” living standard, which is often perceived as a living standard comparable to that of people one associates with (friends, neighbors, col-leagues, family members)—the people with whom we share (parts of) our social identity (Hogg and Terry, 2000). These people serve as reference standards, as “prototypes” (Kahnemann, 2003), so to speak, insofar as they influence the consumption aspirations of their associates (cf. Cynamon and Fazzari, 2008). In this context Veblen (1970[1899]) emphasized the ubiquity of relative consumption concerns, thereby ascribing a central role to the social mediation of preferences. For Veblen the primary reason why people suffer from a reduction in their level of consumption relative to others is found not in the alleged loss of comfort or arousal that goes with it, but in the loss of social status in the broadest sense. Hence, people define themselves relative to the (visible) consumption of their neighbors and colleagues (or other people with whom they closely associate). In this sense, conspicuous consumption is far from being identical to envy or greed, but is ultimately about social belonging and the social conventions associated with carrying a specific social identity:
Figure 1 Real family income growth by quintile
Source: State of Working America; EPI analysis of Census Bureau data.
117.4%
97.9%103.5% 104.7%
88.7%
-7.4%3.7%
11.2%22.7%
49.0%
-20%
0%
20%
40%
60%
80%
100%
120%
140%
Lowest fifth Second fifth Third fifth Fourth fifth Highest fifth
1947-1973 1979-2009
784 JOURNAL OF POST KEYNESIAN ECONOMICS
For the great body of people in any modern community, the proximate ground of expenditure in excess of what is required for physical comfort . . . is a desire to live up to the conventional standard of decency in the amount and grade of goods consumed. (Veblen, 1970[1899], p. 80)
Applying this argument to recent developments implies that an increase in income inequality will induce some of the disadvantaged people to reduce their saving rate or—if this is not sufficient to realize one’s con-sumption aspirations—go into debt.1 Furthermore, he argues that social comparisons across the social scale will exhibit an upward tendency, since “each class envies and emulates the class next above it in the social scale, while it rarely compares itself with those below or with those who are considerably in advance” (Veblen, 1970[1899], p. 81).
Evidence for the empirical relevance of conspicuous consumption and its connection to the increasing indebtedness of U.S. households can be found in Boushey and Weller (2006), Bowles and Park (2005), Christen and Morgan (2005), Krueger and Perri (2006), Neumark and Postlewaite (1998), Pollin (1988, 1990), and Schor (1998). See van Treeck (2012) for an accessible overview.
While these results imply that there was considerable demand for credit in the precrisis period, high demand for credit as such does not increase the fragility of the financial system if it is not accompanied by a correspond-ing increase in credit supply. This crisis has been called a Minsky moment on various occasions (see, e.g., Economist, 2009; Financial Times, 2007; McCulley, 2009; New Yorker, 2008; Wall Street Journal, 2007; Whalen, 2007), since both the deregulation of financial markets (culminating, e.g., in the repeal of the Glass–Steagall Act) and the rise of financial “innova-tions,” like CDSs and CDOs, allowing profit-seeking bankers to create an ever rising flow of loans to people who could not afford them, are strongly reminiscent of Minsky’s works. Following Minsky, this type of develop-ment is a quite natural aftermath of a period of relative stability.2 Margins of safety continuously decrease in a period of financial stability “as success
1 Half a century later Duesenberry (1962[1949]) arrived at a similar conclusion, though he argued that the fall in the saving rate is caused by the desire of people for superior goods, which stems from the continual improvement of consumption goods: “For any particular family the frequency of contact with superior goods will increase primarily as the consumption expenditures of others increase. When that occurs, im-pulses to increase expenditure will increase in frequency, and strength and resistance to them will be inadequate. The result will be an increase in expenditure at the ex-pense of saving” (Duesenberry, 1962[1949], p. 27). For a state of the art formulation of Duesenberry’s theory of consumption, see Palley (2010).
2 See also Kindleberger (1978) on how institutional innovations or rearrangements lead-ing to an increased supply of credit are a general feature of financial euphoria and crises.
DEBT, BOOM, BUST: A THEORY OF MINSKY–VEBLEN CYCLES 785
leads to a belief that the prior—and even the present—margins are too large” (Minsky, 1986, p. 220). Similarly, regulatory obligations erode as the financial system develops strategies and instruments to evade them. Furthermore, a housing price bubble led banks to lend against asset values instead of the borrower’s income (McCulley, 2009). This aspect con-tributed significantly to the destabilization of the financial system, since according to Minsky “a cash-flow orientation by bankers is conducive to sustaining a robust financial structure,” while “[a]n emphasis . . . on the collateral value and the expected values of assets is conducive to the emergence of a fragile financial structure” (Minsky, 1986, p. 234).
From this it follows that households, which initially start out as hedge financing units (households that could pay interest and principal out of current income), gradually turn into speculative financing (households that can pay only the interest but not the principal out of current income), or Ponzi financing units (households that can repay neither interest nor principal out of current income). This development is further accelerated by a rise in interest rates and the burst of asset bubbles.
These concepts strongly resemble the developments observed before and during the crisis (on this, see McCulley, 2009); banks found new ways to increase profitability and circumvent regulation by granting mortgage loans to people who were hardly creditworthy (subprime mortgages). In turn, those loans were bundled and sold to other financial market institutions. This strategy worked as long as house prices and therefore collateral values kept rising. As the overvaluation became all too appar-ent (on this, see also Shiller, 2005), the housing bubble burst and banks suddenly reduced lending, causing speculative and Ponzi financing units to default and inflicting huge losses on the financial sector. Eventually, this development culminated in a financial crisis that quickly spread around the globe and into the real economy, causing the worst recession since the Great Depression.3
In the next sections we develop a stock-flow-consistent post Keynesian model, which integrates arguments from Minsky and Veblen to capture some crucial features of the current crisis. It is a Veblenian approach because it allows the incorporation of relative consumption concerns and their effect on credit demand, and a Minskian approach insofar as it accounts for the financial instability resulting from a period of eco-nomic stability via an increased credit supply. Both features have been addressed in the post Keynesian literature, but to our knowledge no one has yet presented an integrated approach. Of all the Minskian models,
3 See also Palley (2011) for supporting empirical data.
786 JOURNAL OF POST KEYNESIAN ECONOMICS
we are aware of only Palley (1994) and Palley (1997)—where the latter builds on the former and adds endogenous money—who accounts for household debt and consumption demand as a main driving force, while the bulk of models focuses on corporate debt and investment demand.4 The tendency to neglect the household sector is already present in the work of Minsky, who did not take it much into account either (on this, see also Dymski, 2010). In contrast to Palley (1994), we assume an endog-enous credit money economy in which loan provision does not decrease the purchasing power of the lender and model credit supply and credit demand decisions separately to distinguish between situations of excess demand for loans (credit crunch) as well as overoptimistic loan provision. Furthermore, we introduce regime changes (credit crunch, bankruptcy), while in Palley (1994, 1997) interest transfers from debtor to creditor households as well as movements in the debt burden drive the cycle. The post Keynesian contributions addressing relative consumption concerns (e.g., Barba and Pivetti, 2009; Davanzati and Pacella, 2010; Dutt, 2005, 2006, 2008, 2012; Hein, 2012; Palley, 2010; and Zezza, 2008) do not explicitly link these concerns and their potential for creating household debt to a Minskian banking sector.5 In contrast to these models, we will explicitly model income inequality within the working class, thereby assuming that relative consumption concerns matter primarily within a certain socioeconomic group (i.e., among workers). Hence, we introduce a more realistic assumption on the social mediation of preferences.
Finally, we introduce a novel feature when allowing for the possibility of household bankruptcy. In our model, bankruptcy occurs within a sector once it becomes credit constrained and the disposable income is smaller than the sum of debt obligations and subsistence level consumption. In such a case, we assume that banks write off parts of the sector’s debt
4 Other Minskian models are, for example, Delli Gatti et al. (1994), Dos Santos (2005), Franke and Semmler (1989), Keen (1995, 2011), Meirelles and Lima (2006), Skott (1994), Taylor and O’Connell (1985), and Tymoigne (2006). Van Treeck (2009) provides a post Keynesian model that includes a banking sector as well as consumer debt, but does not include specifically Minskian features and relative consumption concerns.
5 It is sometimes assumed that Veblen (1970[1899]) used the term “conspicuous consumption” only to denote consumption activities of members of a specific group (the nouveaux riches of his times) devoted to signaling their wealth to others, which is why some people prefer to refer to Duesenberry (1962[1949]) when it comes to rela-tive consumption concerns (e.g., Palley, 2010). However, a close reading of Veblen (1970[1899], esp. ch. 4–5) shows Veblen’s explicit assertion that reputational concerns play a decisive role for all income groups and that the means of satisfying these con-cerns through conspicuous activities (consumption, leisure, etc.) vary over time.
DEBT, BOOM, BUST: A THEORY OF MINSKY–VEBLEN CYCLES 787
until debt reaches a manageable level. Since our bankruptcy condition relates to an aggregate of individual households, this partial repayment is to be interpreted as the average repayment of the sector as a whole (on this, see Goodhart and Tsomocos, 2011).
The economy in our model moves along the following pattern: Rising in-equality leads to rising demand for credit, while at the same time perceived economic stability assures credit supply. The subsequent boom reaches an upper limit when debt payments erode the solvency of households, and banks stop lending, causing a credit crunch. Households have to reduce consumption, leading to a substantial fall in output. On the other hand, this reduction in output is confined by the assumption that banks have to write off a part of the outstanding debts of insolvent households. While these “haircuts” obviously cause losses in the banking sector, they also reduce the debt burden to an amount that households can manage to repay. The repayment process in turn leads to a decline in indebtedness, a slow but gradual rise in consumption, steady output growth, and an increase in perceived stability, thereby paving the way for the next cycle.
A post Keynesian stock-flow-consistent framework without relative consumption concerns
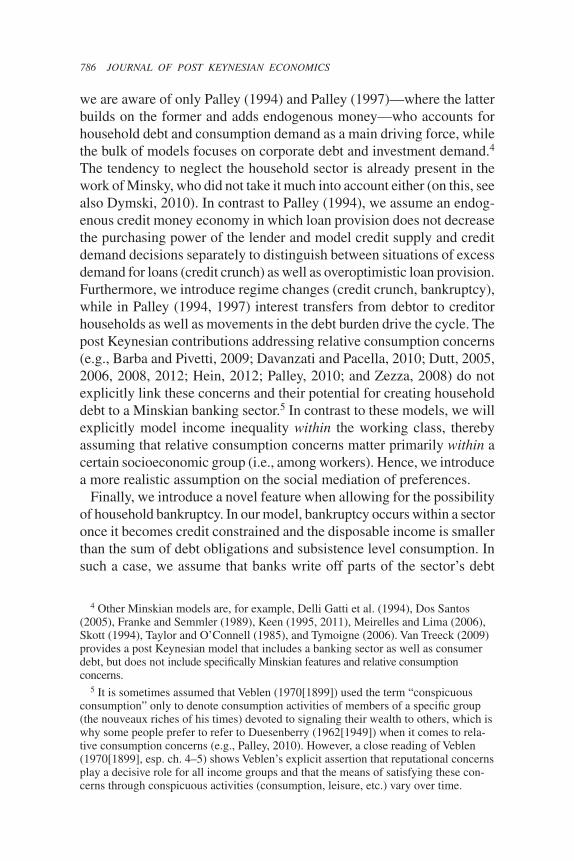
In this section we set up our basic model, leaving aside relative consumption concerns and Minskian features for the moment. In so doing we are using the method of stock-flow-consistent accounting advanced by Lavoie and Godley (2002) and Godley and Lavoie (2007), which allows us to keep track of stock developments and to ensure that all flows and money stocks within our model economy add up to zero, thereby avoiding model inconsisten-cies. The basic structure of the model is given by the equations presented below. In many cases the behavior of specific model components depends on whether certain inequalities are fulfilled. Specifically, some parameters change if a certain variable—such as profits or money deposits—falls below or increases above zero. To explain these properties clearly, we introduce a series of definitions, which are used consistently throughout the study. In addition, we represent all variables in tabular form in the Appendix.
Y(t) = Cd(t) + Id(t). (1)
Yi(t) = wiNdi(t) + Mi(t – 1), (2)
where for positive deposits
for negative deposits:
:.
r
r
D
L .
788 JOURNAL OF POST KEYNESIAN ECONOMICS
Yc(t) = f f(t) + b b(t) + Mc(t – 1), (3)
where f = 0 for f < 0 and b = 0 for b < 0.
N tY t
N tY t
N Nd d d d1 2 2 1
11 1
( )( )
( )( )
/ .=+
=+
=! " !
""
" (4)
C t a a Y t ad1 0 1 1 0
11
11
( ) ( ) .=+
+ !+
"#$
%&'( (
(5)
C t a a Y t ad2 0 1 2 01 1
( ) ( ) .=+
+ !+
"#$
%&'
((
((
(6)
Cdc(t) = b0 + b1[Yc(t) – b0]. (7)
Id(t) = i0 + i1z(t – 1) + i2R(t –1). (8)
z tY tY t
Y t K t( )( )( )
( ) ( ).= =!! " (9)
R tt
K tf( )( )
( ).=
! (10)
K(t) = K(t – 1) + Is(t – 1) – K(t – 1). (11)
f(t) = Y(t) – w1(t)Nd1(t) – w2(t)Nd
2(t) + Mf(t – 1). (12)
b(t) = –[rM1(t – 1) + rM2(t – 1) + rMc(t –1) + rMf(t – 1)] – cancel(t), (13)
where r
r
r
D
L
=!"#
$#
for positive deposits
for negative deposits
:
:..
Mi(t) = wi(t)Ni(t) + Mi(t – 1) – Cdi(t) + canceli(t) – Mi(t – 1), (14)
where = 0 for Mi 0.
Mc(t) = f f(t) + b b(t) + Mc(t – 1) – Cdc(t) + cancelc(t) – Mc (t – 1), (15)
where = 0 for Mc 0.
DEBT, BOOM, BUST: A THEORY OF MINSKY–VEBLEN CYCLES 789
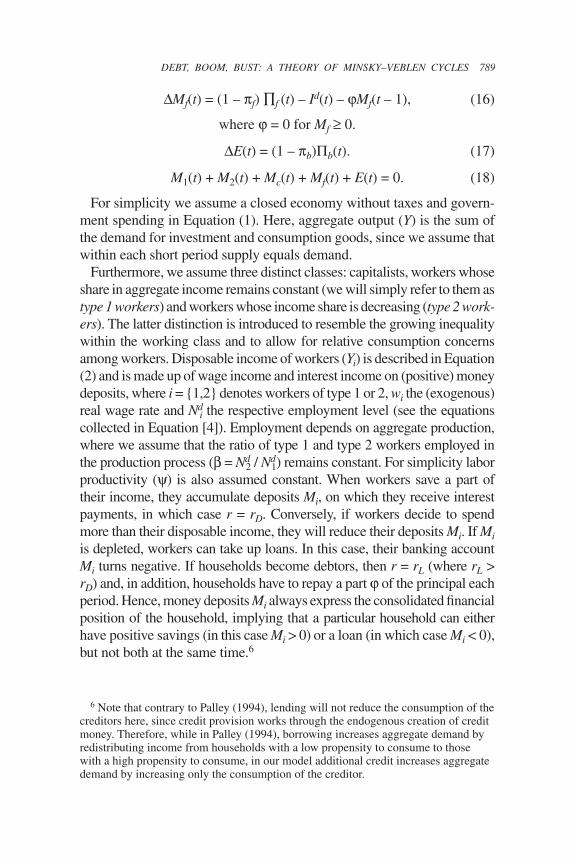
Mf(t) = (1 – f) f (t) – Id(t) – Mf(t – 1), (16)
where = 0 for Mf 0.
E(t) = (1 – b) b(t). (17)
M1(t) + M2(t) + Mc(t) + Mf(t) + E(t) = 0. (18)
For simplicity we assume a closed economy without taxes and govern-ment spending in Equation (1). Here, aggregate output (Y) is the sum of the demand for investment and consumption goods, since we assume that within each short period supply equals demand.
Furthermore, we assume three distinct classes: capitalists, workers whose share in aggregate income remains constant (we will simply refer to them as type 1 workers) and workers whose income share is decreasing (type 2 work-ers). The latter distinction is introduced to resemble the growing inequality within the working class and to allow for relative consumption concerns among workers. Disposable income of workers (Yi) is described in Equation (2) and is made up of wage income and interest income on (positive) money deposits, where i = {1,2} denotes workers of type 1 or 2, wi the (exogenous) real wage rate and Nd
i the respective employment level (see the equations collected in Equation [4]). Employment depends on aggregate production, where we assume that the ratio of type 1 and type 2 workers employed in the production process ( = Nd
2 / Nd1) remains constant. For simplicity labor
productivity ( ) is also assumed constant. When workers save a part of their income, they accumulate deposits Mi, on which they receive interest payments, in which case r = rD. Conversely, if workers decide to spend more than their disposable income, they will reduce their deposits Mi. If Mi is depleted, workers can take up loans. In this case, their banking account Mi turns negative. If households become debtors, then r = rL (where rL > rD) and, in addition, households have to repay a part of the principal each period. Hence, money deposits Mi always express the consolidated financial position of the household, implying that a particular household can either have positive savings (in this case Mi > 0) or a loan (in which case Mi < 0), but not both at the same time.6
6 Note that contrary to Palley (1994), lending will not reduce the consumption of the creditors here, since credit provision works through the endogenous creation of credit money. Therefore, while in Palley (1994), borrowing increases aggregate demand by redistributing income from households with a low propensity to consume to those with a high propensity to consume, in our model additional credit increases aggregate demand by increasing only the consumption of the creditor.
790 JOURNAL OF POST KEYNESIAN ECONOMICS
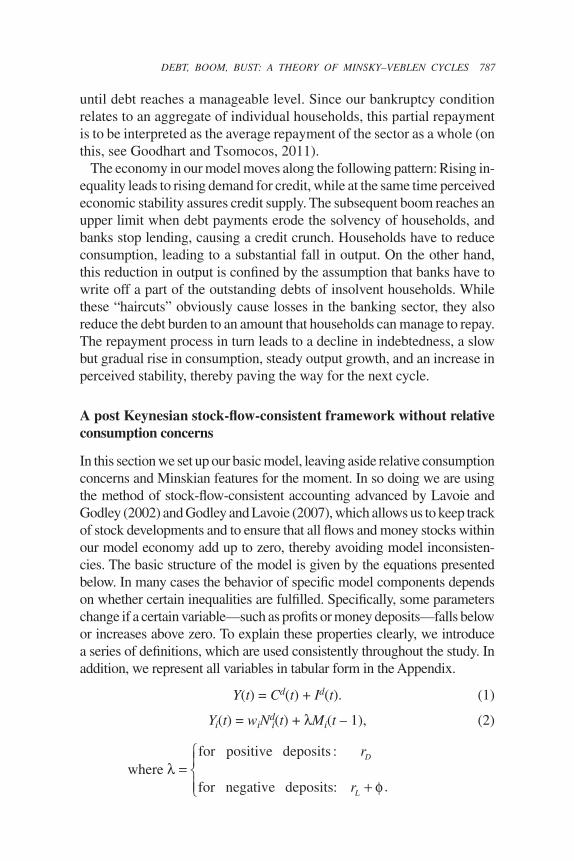
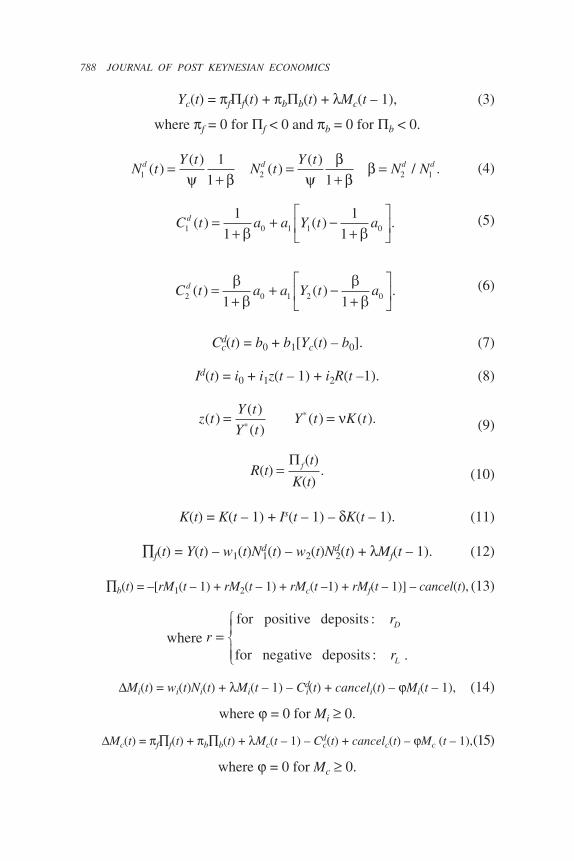
Capitalists, on the other hand, receive distributed profits from firms and banks as well as interest income on their (positive) deposits (see Equation [3]), where f and b are the ratios of distributed firm and bank profits, and f and b denote firm and bank profits. Unlike profits, losses remain within the firm or banking sector, which implies f = 0 if f < 0, as well as b = 0 if b < 0. Similar to workers, capitalists can also spend more than their disposable income by depleting their money deposits or taking up loans, in which case they too have to pay interest and repay part of the principal each period.
Equations (5) to (7) in turn define the consumer behavior of these distinct groups: Workers will always consume at least subsistence-level consumption, where a0 denotes the aggregate subsistence-level consumption of the working class (and therefore 1/(1 + )a0 and /(1 + )a0 account for the amounts of subsistence-level consumption of type 1 and type 2 workers, respectively). Furthermore, workers consume fraction a1 of disposable income exceeding the necessary amount for subsistence-level consumption. We assume that consumption demand cannot fall below the subsistence level, therefore, for example, Cd
1(t) = 1/(1 + )a 0 for Y1(t) < 1/(1 + )a 0. Capitalists, whose consumption demand is expressed in Equation (7), thereby have a lower marginal propensity to consume than workers (i.e., b1 < a1).
Equations (8) and (9) describe investment behavior and the development of the capital stock. Investment depends on the past utilization rate of the capital stock (z) and the past rate of return (R) as defined in Equations (9) and (10), where K denotes the capital stock and Y* full capacity output. The capital stock evolves over time following Equation (11), where denotes the depreciation rate.
Equations (12) and (13) express acquired profits in the firm and bank-ing sector. In the case of bank profits, cancel denotes debt cancellations in case of bankruptcies of clients (which start to play a role as soon as we introduce a Minskian financial sector). Generally, we assume that banks distribute all of their profits to capitalists’ households while firms retain 10 percent of their profits, while any losses are not passed on to capitalists but instead remain in the firm or banking sector.
Equations (14) to (16) describe the evolution of money deposits held by households and firms. Evidently, money deposits increase when units are net savers and decrease when spending exceeds income. If households are debtors (i.e., their deposit is negative), they have to repay part of the principal each period, which does not affect their net financial position (installment rates are paid out of wage income, but they also increase the household’s money deposit). Equation (17) defines the change in
DEBT, BOOM, BUST: A THEORY OF MINSKY–VEBLEN CYCLES 791
bank equity (E), which depends on the profits or losses acquired in the banking sector.
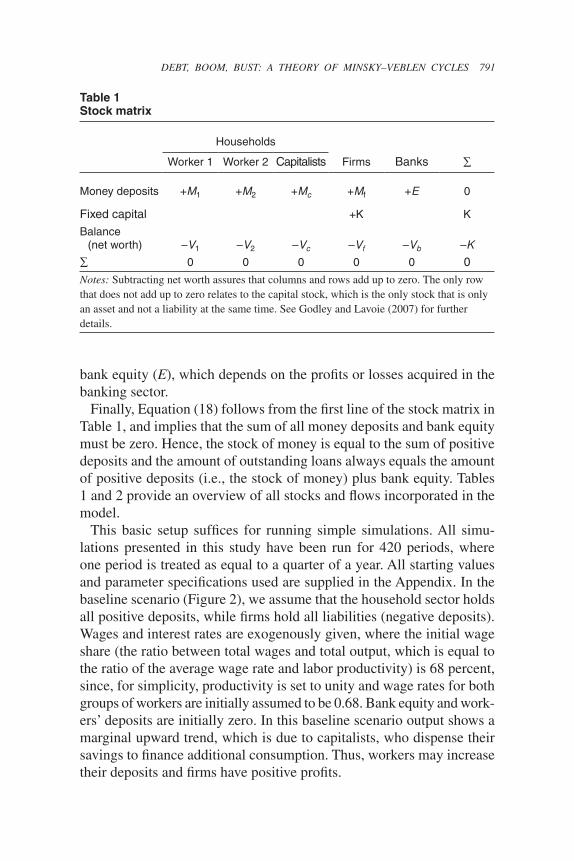
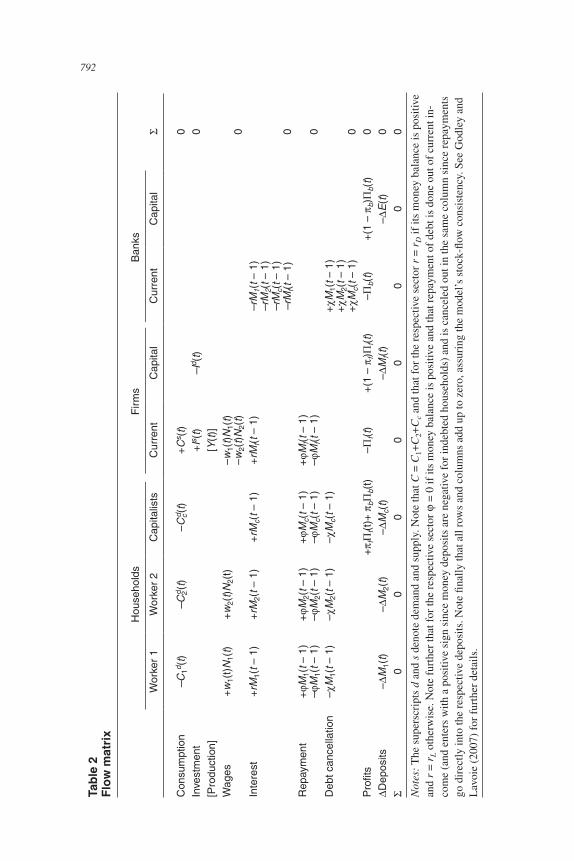
Finally, Equation (18) follows from the first line of the stock matrix in Table 1, and implies that the sum of all money deposits and bank equity must be zero. Hence, the stock of money is equal to the sum of positive deposits and the amount of outstanding loans always equals the amount of positive deposits (i.e., the stock of money) plus bank equity. Tables 1 and 2 provide an overview of all stocks and flows incorporated in the model.
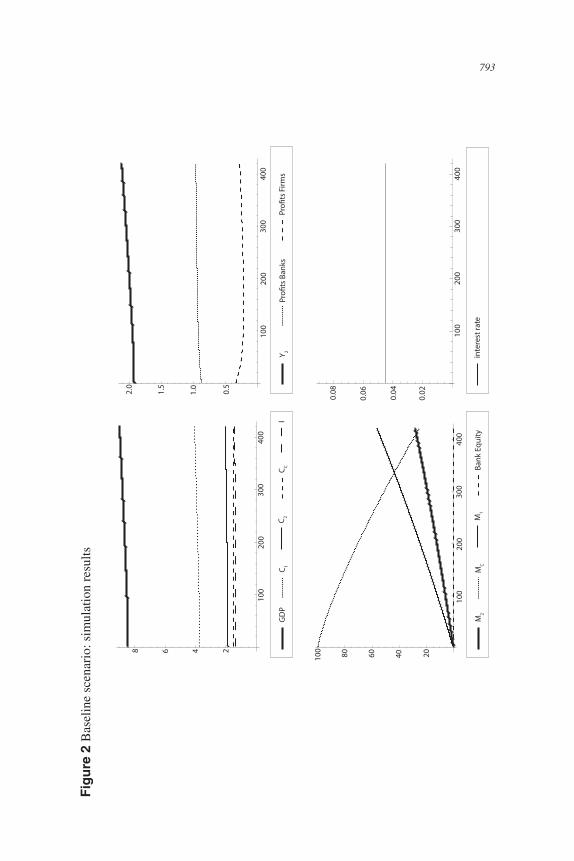
This basic setup suffices for running simple simulations. All simu-lations presented in this study have been run for 420 periods, where one period is treated as equal to a quarter of a year. All starting values and parameter specifications used are supplied in the Appendix. In the baseline scenario (Figure 2), we assume that the household sector holds all positive deposits, while firms hold all liabilities (negative deposits). Wages and interest rates are exogenously given, where the initial wage share (the ratio between total wages and total output, which is equal to the ratio of the average wage rate and labor productivity) is 68 percent, since, for simplicity, productivity is set to unity and wage rates for both groups of workers are initially assumed to be 0.68. Bank equity and work-ers’ deposits are initially zero. In this baseline scenario output shows a marginal upward trend, which is due to capitalists, who dispense their savings to finance additional consumption. Thus, workers may increase their deposits and firms have positive profits.
Table 1 Stock matrix
Households
Worker 1 Worker 2 Capitalists Firms Banks
Money deposits +M1 +M2 +Mc +Mf +E 0
Fixed capital +K K
Balance (net worth) –V1 –V2 –Vc –Vf –Vb –K
0 0 0 0 0 0Notes: Subtracting net worth assures that columns and rows add up to zero. The only row that does not add up to zero relates to the capital stock, which is the only stock that is only an asset and not a liability at the same time. See Godley and Lavoie (2007) for further details.
792 JOURNAL OF POST KEYNESIAN ECONOMICS
Tabl
e 2
Flow
mat
rix
Hou
seho
lds
Firm
sB
anks
Wor
ker
1W
orke
r 2
Cap
italis
tsC
urre
ntC
apita
lC
urre
ntC
apita
l
Con
sum
ptio
n–C
1d (t)
–C2d (
t)–C
cd (t)
+Cs (
t)0
Inve
stm
ent
+Is (
t)–I
d (t)
0[P
rodu
ctio
n][Y
(t)]
Wag
es+w
1(t)
N1(
t)+w
2(t)N
2(t)
–w1(
t)N1(
t) –w
2(t)N
2(t)
0In
tere
st+r
M1(
t – 1
)+r
M2(
t – 1
)+r
Mc(
t – 1
)+r
Mf(t
– 1
)–r
M1(
t – 1
)–r
M2(
t – 1
)–r
Mc(
t – 1
)–r
Mf(t
– 1
)0
Rep
aym
ent
+M
1(t –
1)
–M
1(t –
1)
+M
2(t –
1)
–M
2(t –
1)
+M
c(t –
1)
–M
c(t –
1)
+M
f(t –
1)
–M
f(t –
1)
0D
ebt c
ance
llatio
n–
M1(
t – 1
)–
M2(
t – 1
)–
Mc(
t – 1
)+
M1(
t – 1
)+
M2(
t – 1
)+
Mc(
t – 1
)0
Pro
fits
+f
f(t)+
b
b(t)
–f(t
)+(
1 –
f)f(t
)–
b(t)
+(1
– b)
b(t)
0D
epos
its–
M1(
t)–
M2(
t)–
Mc(
t)–
Mf(t
)–
E(t)
00
00
00
00
0
Not
es:
The
sup
ersc
ript
s d
and
s de
note
dem
and
and
supp
ly. N
ote
that
C =
C1+
C2+
Cc a
nd th
at fo
r the
resp
ectiv
e se
ctor
r =
rD
if it
s m
oney
bal
ance
is p
ositi
ve
and
r =
r L o
ther
wis
e. N
ote
furt
her t
hat f
or th
e re
spec
tive
sect
or
= 0
if it
s m
oney
bal
ance
is p
ositi
ve a
nd th
at re
paym
ent o
f deb
t is
done
out
of c
urre
nt in
-co
me
(and
ent
ers
with
a p
ositi
ve s
ign
sinc
e m
oney
dep
osits
are
neg
ativ
e fo
r ind
ebte
d ho
useh
olds
) and
is c
ance
led
out i
n th
e sa
me
colu
mn
sinc
e re
paym
ents
go
dir
ectly
into
the
resp
ectiv
e de
posi
ts. N
ote
final
ly th
at a
ll ro
ws
and
colu
mns
add
up
to z
ero,
ass
urin
g th
e m
odel
’s s
tock
-flow
con
sist
ency
. See
God
ley
and
Lav
oie
(200
7) fo
r fur
ther
det
ails
.
DEBT, BOOM, BUST: A THEORY OF MINSKY–VEBLEN CYCLES 793
Figu
re 2
Bas
elin
e sc
enar
io: s
imul
atio
n re
sults
68 4 2
100
200
300
400
GD
PC 1
C 2C C
IY 2
Pro!
ts B
anks
Pro!
ts F
irms
M2
MC
M1
Bank
Equ
ity
100
200
300
400
0.5
1.0
1.5
2.0
100
200
300
400
20406080100
100
200
300
400
inte
rest
rate
0.02
0.04
0.06
0.08
794 JOURNAL OF POST KEYNESIAN ECONOMICS
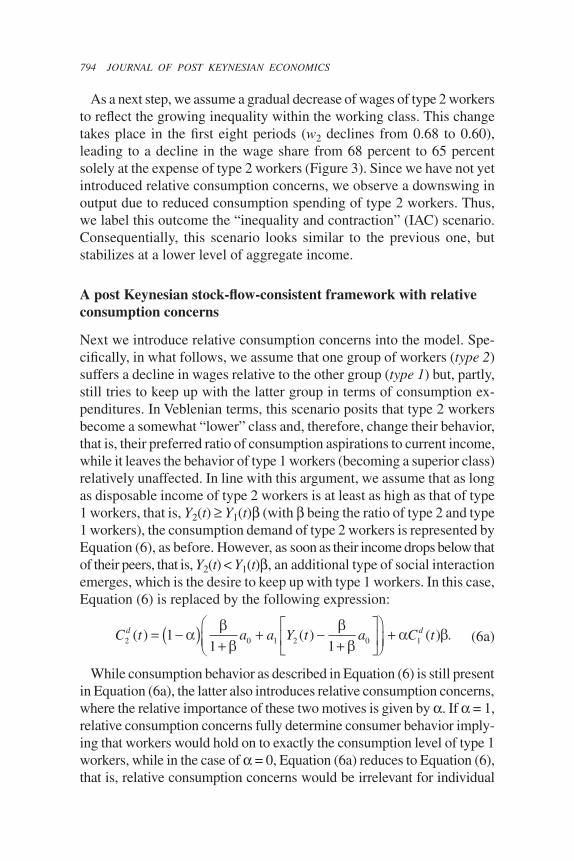
As a next step, we assume a gradual decrease of wages of type 2 workers to reflect the growing inequality within the working class. This change takes place in the first eight periods (w2 declines from 0.68 to 0.60), leading to a decline in the wage share from 68 percent to 65 percent solely at the expense of type 2 workers (Figure 3). Since we have not yet introduced relative consumption concerns, we observe a downswing in output due to reduced consumption spending of type 2 workers. Thus, we label this outcome the “inequality and contraction” (IAC) scenario. Consequentially, this scenario looks similar to the previous one, but stabilizes at a lower level of aggregate income.
A post Keynesian stock-flow-consistent framework with relative consumption concerns
Next we introduce relative consumption concerns into the model. Spe-cifically, in what follows, we assume that one group of workers (type 2) suffers a decline in wages relative to the other group (type 1) but, partly, still tries to keep up with the latter group in terms of consumption ex-penditures. In Veblenian terms, this scenario posits that type 2 workers become a somewhat “lower” class and, therefore, change their behavior, that is, their preferred ratio of consumption aspirations to current income, while it leaves the behavior of type 1 workers (becoming a superior class) relatively unaffected. In line with this argument, we assume that as long as disposable income of type 2 workers is at least as high as that of type 1 workers, that is, Y2(t) Y1(t) (with being the ratio of type 2 and type 1 workers), the consumption demand of type 2 workers is represented by Equation (6), as before. However, as soon as their income drops below that of their peers, that is, Y2(t) < Y1(t) , an additional type of social interaction emerges, which is the desire to keep up with type 1 workers. In this case, Equation (6) is replaced by the following expression:
C t a a Y t a C td d2 0 1 2 0 11
1 1( ) ( ) ( ) . (6a)
While consumption behavior as described in Equation (6) is still present in Equation (6a), the latter also introduces relative consumption concerns, where the relative importance of these two motives is given by . If = 1, relative consumption concerns fully determine consumer behavior imply-ing that workers would hold on to exactly the consumption level of type 1 workers, while in the case of = 0, Equation (6a) reduces to Equation (6), that is, relative consumption concerns would be irrelevant for individual
DEBT, BOOM, BUST: A THEORY OF MINSKY–VEBLEN CYCLES 795
Figu
re 3
Ine
qual
ity a
nd c
ontr
actio
n (I
AC
): s
imul
atio
n re
sults
100
200
300
400
20406080100
100
200
300
400
0.5
1.0
1.5
100
200
300
400
68 4 2
100
200
300
400
inte
rest
rate
0.02
0.04
0.06
0.08
GD
PC
1C
2C
CI
Y 2Pr
PrFi
rms
M2
MC
M1
Bank
Equ
ity
796 JOURNAL OF POST KEYNESIAN ECONOMICS
consumer behavior. In general, the higher the desire to keep up with the other group, the larger will be.
Note that we would obtain similar results if we abstained from modeling growing income inequality within the working class (i.e., assuming only one group of workers) and instead assumed that workers try to keep up with capitalists (as in Barba and Pivetti, 2009; Dutt, 2008). Though this may not matter much for the results, in our opinion it would ignore the argument that—as Veblen (1970[1899], p. 81) puts it—a class “rarely compares itself . . . with those who are considerably in advance” (see also Hogg and Terry, 2000).
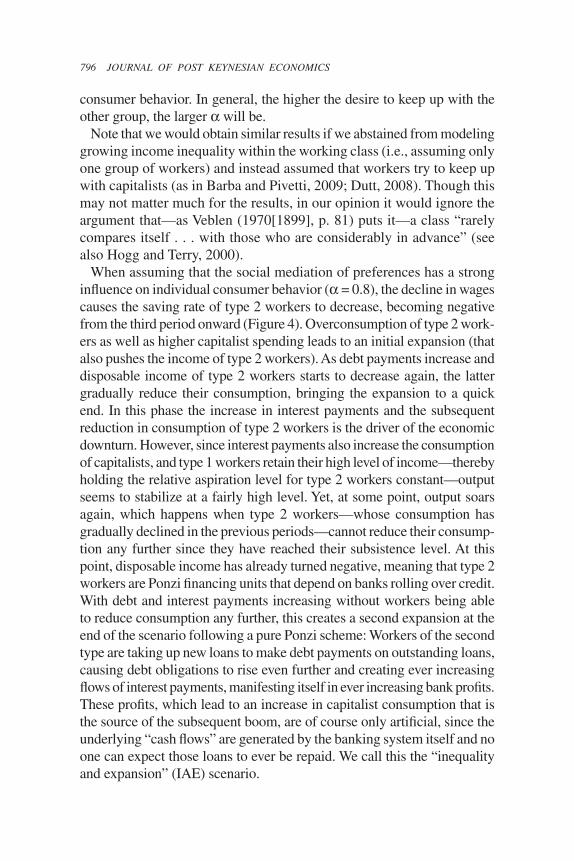
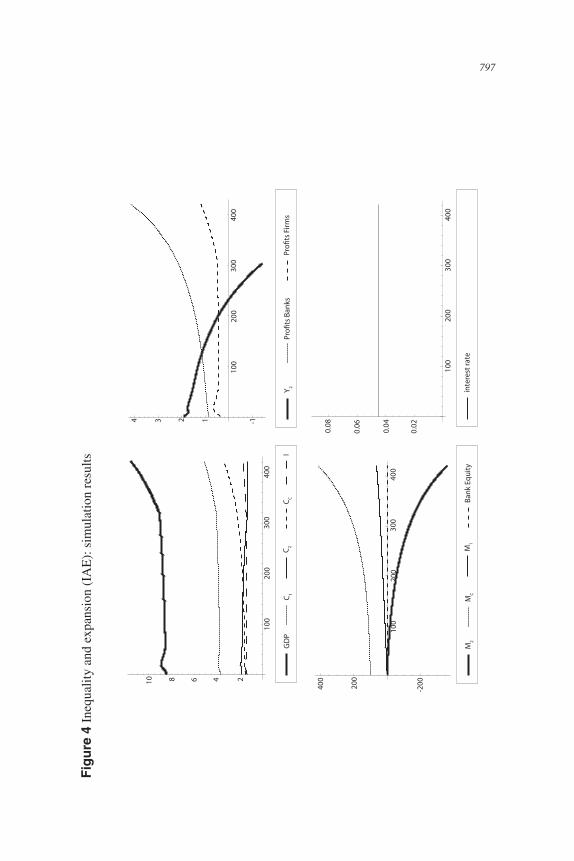
When assuming that the social mediation of preferences has a strong influence on individual consumer behavior ( = 0.8), the decline in wages causes the saving rate of type 2 workers to decrease, becoming negative from the third period onward (Figure 4). Overconsumption of type 2 work-ers as well as higher capitalist spending leads to an initial expansion (that also pushes the income of type 2 workers). As debt payments increase and disposable income of type 2 workers starts to decrease again, the latter gradually reduce their consumption, bringing the expansion to a quick end. In this phase the increase in interest payments and the subsequent reduction in consumption of type 2 workers is the driver of the economic downturn. However, since interest payments also increase the consumption of capitalists, and type 1 workers retain their high level of income—thereby holding the relative aspiration level for type 2 workers constant—output seems to stabilize at a fairly high level. Yet, at some point, output soars again, which happens when type 2 workers—whose consumption has gradually declined in the previous periods—cannot reduce their consump-tion any further since they have reached their subsistence level. At this point, disposable income has already turned negative, meaning that type 2 workers are Ponzi financing units that depend on banks rolling over credit. With debt and interest payments increasing without workers being able to reduce consumption any further, this creates a second expansion at the end of the scenario following a pure Ponzi scheme: Workers of the second type are taking up new loans to make debt payments on outstanding loans, causing debt obligations to rise even further and creating ever increasing flows of interest payments, manifesting itself in ever increasing bank profits. These profits, which lead to an increase in capitalist consumption that is the source of the subsequent boom, are of course only artificial, since the underlying “cash flows” are generated by the banking system itself and no one can expect those loans to ever be repaid. We call this the “inequality and expansion” (IAE) scenario.
DEBT, BOOM, BUST: A THEORY OF MINSKY–VEBLEN CYCLES 797
Figu
re 4
Ine
qual
ity a
nd e
xpan
sion
(IA
E):
sim
ulat
ion
resu
lts
100
200
300
400
-20040
0
200
100
200
300
400
1234 -1
68 4 210
100
200
300
400
100
200
300
400
inte
rest
rate
0.02
0.04
0.06
0.08
GD
PC
1C
2C
CI
Y 2Pr
PrFi
rms
M2
MC
M1
Bank
Equ
ity
798 JOURNAL OF POST KEYNESIAN ECONOMICS
A Minskian model with relative consumption concerns: the case of Minsky–Veblen cycles
In the previous scenario, workers received unlimited credit, which is un-likely to happen in reality. Therefore, we have to specify the loan supply behavior of banks. As indicated at the beginning, we are approaching this issue with a Minskian framework given by the following equations:
w t N t r t M t ti id
L i i( ) ( ) ( ) ( ) ( ).1 (19)
2 00
1( ) .a (20)
(t) = (t – 1)(1 + ) + L(t) (21)
where perceived stability
economic distress
:
:.
cancel2(t) = – M2(t), (22)
where credit constrained and
otherwise
Y t a2 01
0
( ) :
:
.
rL(t) = rL(t – 1) + L(t). (23)
Equation (19) specifies the conditions for households to incur debt. Here, we assume that loans are granted as long as workers’ income ex-ceeds payments on past loans plus a certain margin of safety .
Equations (20) and (21) describe the behavior of . For convenience, we express the initial margin of safety in multiples of subsistence-level consumption a0, such that in case of type 2 workers it is given by Equa-tion (20). Here larger values of imply more cautious banks. Banks are assumed to behave according to Minskian propositions, thereby (slowly) relaxing the margin of safety in times of perceived financial stability and (rapidly) increasing the very same margin in cases of financial distress (Equation [21]). Specifically, we assume that if no bankruptcies occur dur-ing a certain period, will decrease with rate , whereas in case of reported customer bankruptcies, it increases by rate (where >> ). This reflects the Minskian argument that during periods of perceived economic stabil-ity (here defined as the absence of bankruptcies), financial intermediaries become gradually less cautious until economic distress (represented here by reported bankruptcies) leads to a sudden readjustment of risk perceptions,
DEBT, BOOM, BUST: A THEORY OF MINSKY–VEBLEN CYCLES 799
thereby possibly creating a credit crunch. Futhermore, banks are assumed to become more cautious when the total amount of private debt (L), which is the absolute value of negative deposits, increases (and vice versa).7
If bankruptcies occur within the sector—meaning that the income of credit-constrained households is not sufficient to afford subsistence-level consumption as well as to meet debt obligations—we assume that banks write off a fixed proportion of their claims. This is specified in Equation (22) for the case of type 2 workers. These haircuts lead to losses in the banking sector, which decrease capitalist income and turn bank equity negative. The system will experience subsequent periods of bankruptcies, if previous haircuts cannot restore the solvency of debtors (i.e., if disposable income is still lower than subsistence level consumption). This implies that banks have to write off outstanding loans until debt reaches a level where debtors can again manage to orderly repay. Generally, workers will always consume at least subsistence-level consumption. If their income is not suf-ficient to afford subsistence-level consumption and debt payments, workers will first suspend debt repayments and then interest payments. Finally, the interest rate on loans also follows Minskian propositions by depending positively on the amount of debt in the economy (Equation [23]).
With this framework we can again run simulations. Assuming that = 1.2, meaning that at the beginning banks do grant loans as long
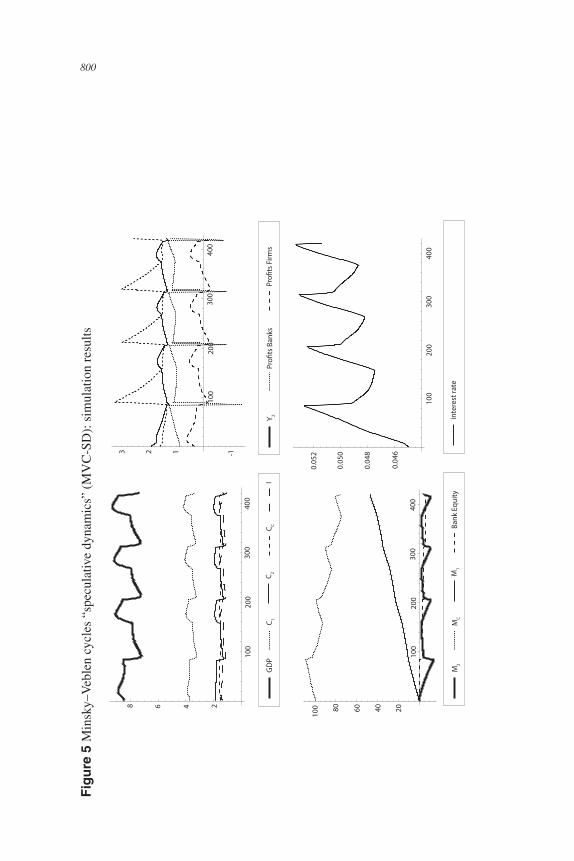
as type 2 workers have sufficient disposable income to pay for 1.2 times the amount of subsistence-level consumption, leads to our first exposition of Minsky–Veblen cycles depicted in Figure 5. We call this scenario Minsky–Veblen cycle “speculative dynamics” (MVC-SD), since households turn from hedge financing units into speculative financing units.
As in the scenario with unlimited credit supply, we get an initial debt-financed boom that is followed by a minor recession when debt payments increase and type 2 workers gradually reduce consumption. The decline in output is again only short-lived since relative consumption concerns keep the fall in workers consumption small, while interest payments in-
7 Note that we abstain from explicitly including asset prices in our analysis, al-though asset price bubbles play an important role in Minsky’s theory as well as in the recent crisis. According to Minsky, asset price bubbles come along with periods that are perceived as stable. They favor a climate in which current cash flows are con-ceived as relatively unimportant for decisions on loan provision, which implies that asset bubbles reduce the margin of safety. In this specific sense asset prices are implic-itly represented in our story, though an explicit attempt to model them is outside of the scope of this paper. See Zezza (2008) for a stock-flow consistent framework taking the role of asset price bubbles into account.
800 JOURNAL OF POST KEYNESIAN ECONOMICS
Figu
re 5
Min
sky–
Veb
len
cycl
es “
spec
ulat
ive
dyna
mic
s” (M
VC
-SD
): s
imul
atio
n re
sults
inte
rest
rate
100
200
300
400
68 4 210
020
030
040
0
-1123
100
200
300
400
20406080
100
100
200
300
400
0.05
2
0.04
6
0.05
0
0.04
8
GD
PC 1
C 2C C
IY 2
Pro!
ts B
anks
Pro!
ts F
irms
M2
MC
M1
Bank
Equ
ity
DEBT, BOOM, BUST: A THEORY OF MINSKY–VEBLEN CYCLES 801
crease the consumption of capitalists. Together, these two mechanisms—debt-based consumption induced by relative consumption concerns and increasing capitalist income—stabilize output at a relatively high level for some time. In this period of perceived stability, Minskian dynamics cause banks’ margin of safety to fall and thereby assure that credit supply continues. However, since loans of type 2 workers quickly accumulate and, correspondingly, the exposure of the banking sector increases, this downward trend in the margin of safety is gradually reversed, while at the same time disposable incomes of type 2 workers are decreasing (which is further accentuated by a gradual rise in the interest rate on loans). We call this the phase of compression (this phase may correspond to what Bernanke [2004] has called, quite unfortunately, a moderation). At some point disposable income has fallen and the margin of safety has risen suf-ficiently such that banks refuse to grant new loans to type 2 workers. In this simulation variant, households turn from hedge financing units into speculative financing units (unable to repay the principal but still able to pay interest out of current income), without ever becoming Ponzi units. However, in case of a tightening of credit supply, speculative financing units go bankrupt, since they already depend on rolling over debt (their wage bill is not enough to afford subsistence-level consumption and all debt payments). After bankruptcy, these households have no further access to credit because the margins of safety have risen dramatically. Therefore, they have no alternative but to reduce their consumption to subsistence level. This decline in consumption expenditures triggers a full-scale recession. While the gradual decrease in disposable income of type 2 workers (through debt payments) is responsible for the end of the expansion and the beginning of the compression phase, it is the credit rationing by banks that abruptly cuts off consumption and thereby causes panic on financial markets, leading to a sudden slump. Bankruptcies among type 2 workers force banks to write off part of their outstanding loans, thereby turning bank equity negative.8 In the first cycle, haircuts in five consecutive periods restore the solvency of debtor households (a one-time haircut is not enough to bring down interest rate payments to a manageable level for debtors), thereby enabling them to orderly repay the rest of their outstanding loans. However, these developments lead to a sharp increase in the margin of safety. In the following period of consolidation workers gradually repay the remaining loans, and interest rates go down again. As the level of debt declines, disposable income
8 Note that while in our model it is possible that parts of the household sector go bankrupt (e.g., type 2 workers), bankruptcies within the banking or firm sector are not possible.
802 JOURNAL OF POST KEYNESIAN ECONOMICS
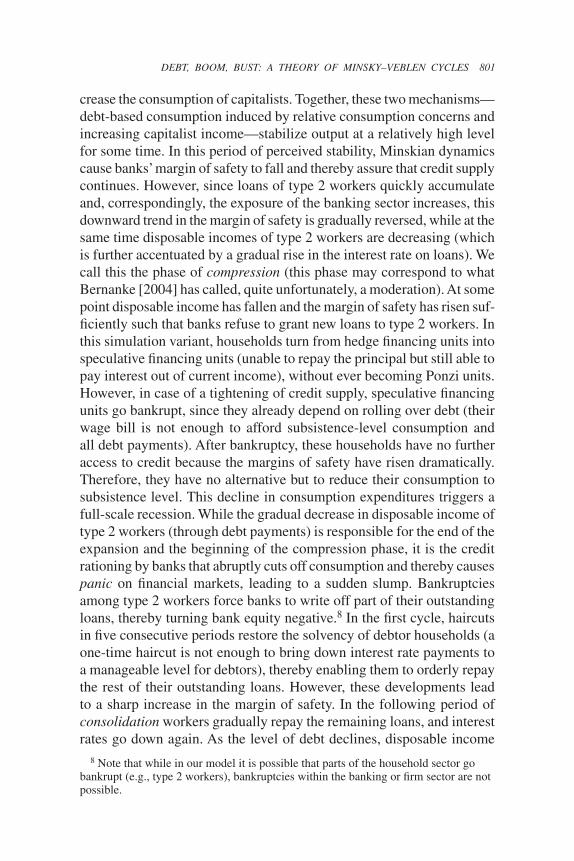
of type 2 workers gradually increases and so does their consumption. When decreasing debt levels and interest rates have led to a sufficient increase in disposable income of type 2 workers and Minskian dynam-ics have reduced the margin of safety, history will repeat itself. Figure 6 illustrates these four phases—the expansionary phase, the compression phase, where additional debt payments reduce consumption spending, the credit crunch (panic), and the consolidation phase—with respect to the simulation results of this scenario.
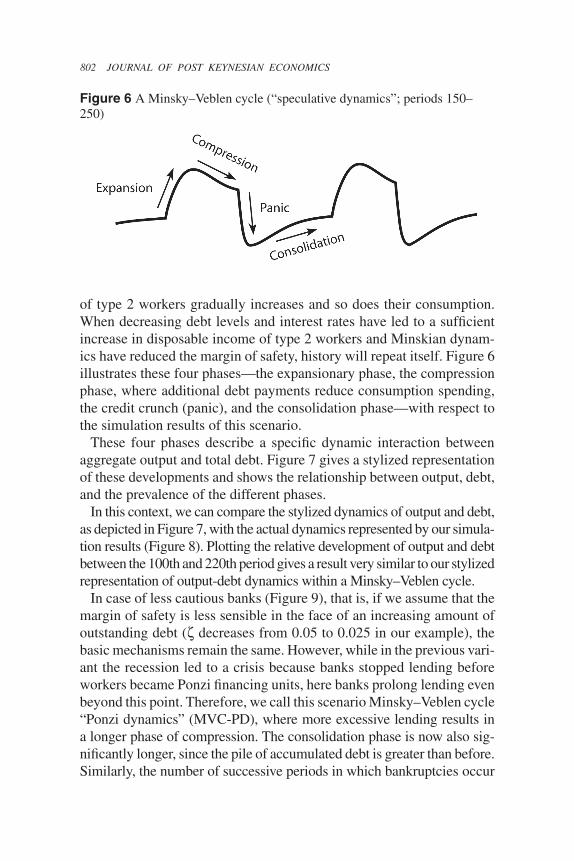
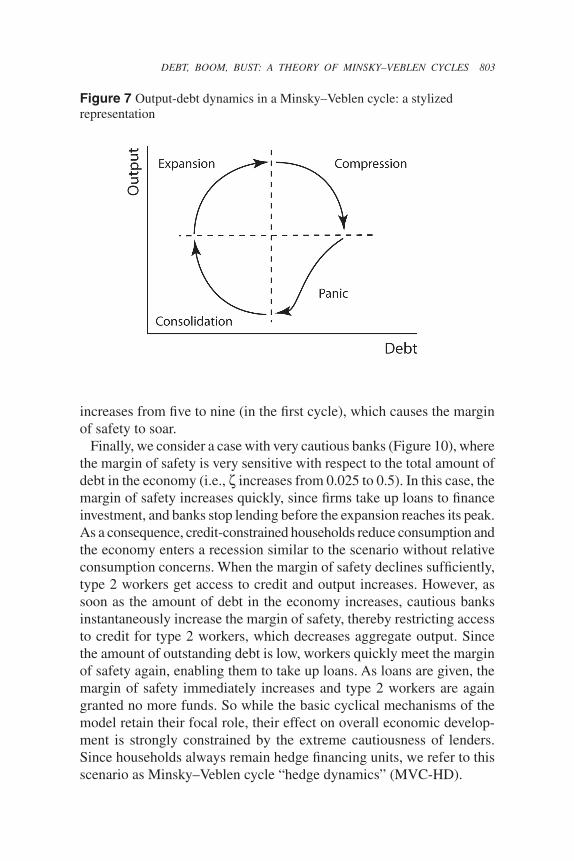
These four phases describe a specific dynamic interaction between aggregate output and total debt. Figure 7 gives a stylized representation of these developments and shows the relationship between output, debt, and the prevalence of the different phases.
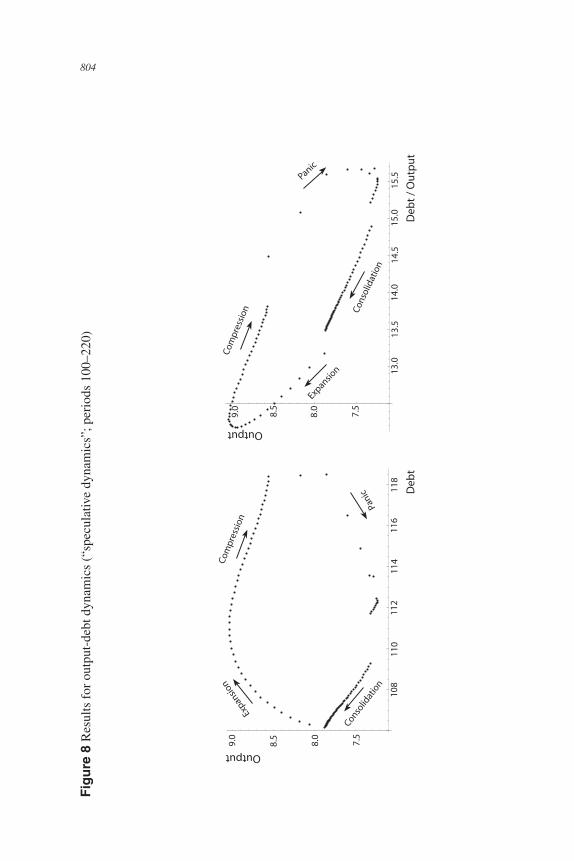
In this context, we can compare the stylized dynamics of output and debt, as depicted in Figure 7, with the actual dynamics represented by our simula-tion results (Figure 8). Plotting the relative development of output and debt between the 100th and 220th period gives a result very similar to our stylized representation of output-debt dynamics within a Minsky–Veblen cycle.
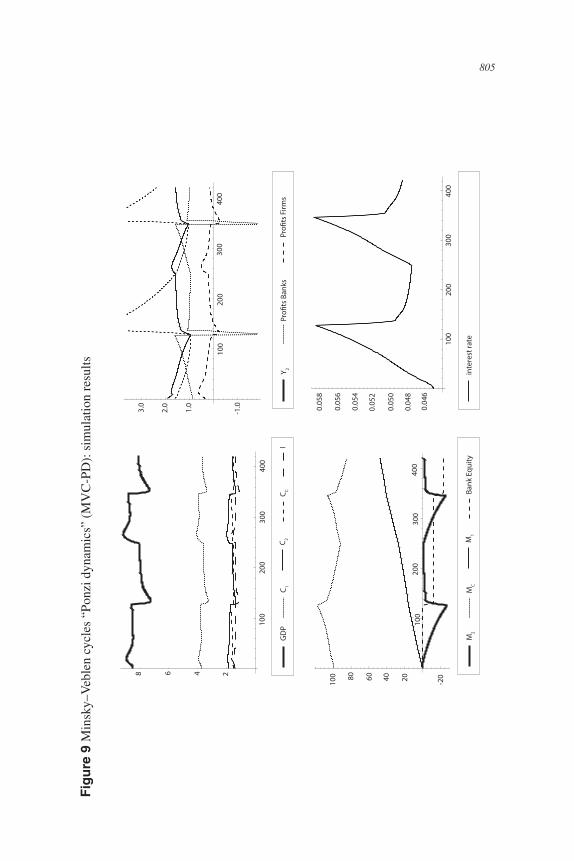
In case of less cautious banks (Figure 9), that is, if we assume that the margin of safety is less sensible in the face of an increasing amount of outstanding debt ( decreases from 0.05 to 0.025 in our example), the basic mechanisms remain the same. However, while in the previous vari-ant the recession led to a crisis because banks stopped lending before workers became Ponzi financing units, here banks prolong lending even beyond this point. Therefore, we call this scenario Minsky–Veblen cycle “Ponzi dynamics” (MVC-PD), where more excessive lending results in a longer phase of compression. The consolidation phase is now also sig-nificantly longer, since the pile of accumulated debt is greater than before. Similarly, the number of successive periods in which bankruptcies occur
Figure 6 A Minsky–Veblen cycle (“speculative dynamics”; periods 150–250)
DEBT, BOOM, BUST: A THEORY OF MINSKY–VEBLEN CYCLES 803
Figure 7 Output-debt dynamics in a Minsky–Veblen cycle: a stylized representation
increases from five to nine (in the first cycle), which causes the margin of safety to soar.
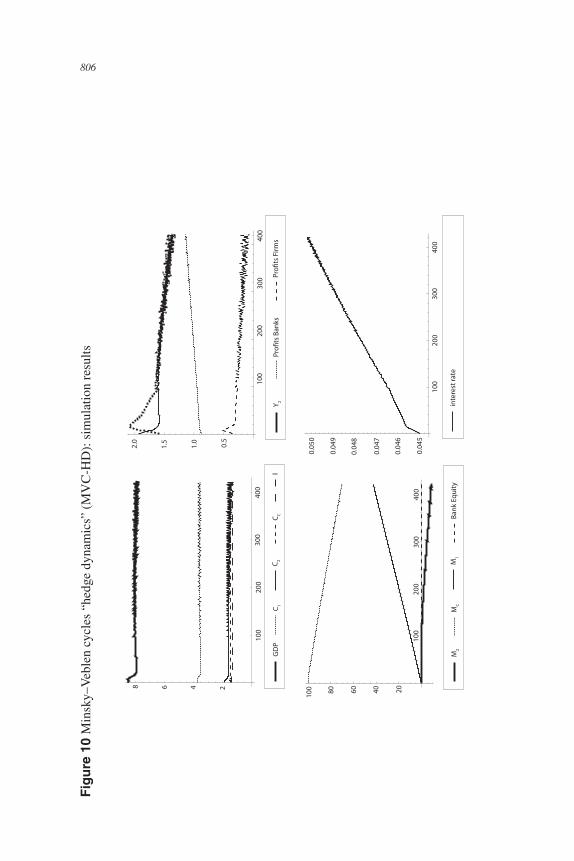
Finally, we consider a case with very cautious banks (Figure 10), where the margin of safety is very sensitive with respect to the total amount of debt in the economy (i.e., increases from 0.025 to 0.5). In this case, the margin of safety increases quickly, since firms take up loans to finance investment, and banks stop lending before the expansion reaches its peak. As a consequence, credit-constrained households reduce consumption and the economy enters a recession similar to the scenario without relative consumption concerns. When the margin of safety declines sufficiently, type 2 workers get access to credit and output increases. However, as soon as the amount of debt in the economy increases, cautious banks instantaneously increase the margin of safety, thereby restricting access to credit for type 2 workers, which decreases aggregate output. Since the amount of outstanding debt is low, workers quickly meet the margin of safety again, enabling them to take up loans. As loans are given, the margin of safety immediately increases and type 2 workers are again granted no more funds. So while the basic cyclical mechanisms of the model retain their focal role, their effect on overall economic develop-ment is strongly constrained by the extreme cautiousness of lenders. Since households always remain hedge financing units, we refer to this scenario as Minsky–Veblen cycle “hedge dynamics” (MVC-HD).
804 JOURNAL OF POST KEYNESIAN ECONOMICS
Figu
re 8
Res
ults
for o
utpu
t-de
bt d
ynam
ics
(“sp
ecul
ativ
e dy
nam
ics”
; per
iods
100
–220
)Output
Deb
t
7.5
8.0
8.5
9.0
108
110
112
114
116
118
Expan
sion
Com
pres
sion
Pani
c
Consolid
atio
n
7.5
8.0
8.5
9.0
13.0
13.5
14.0
14.5
15.0
15.5
OutputD
ebt /
Out
put
Expansio
n
Com
pres
sion
Panic
Cons
olid
atio
n
DEBT, BOOM, BUST: A THEORY OF MINSKY–VEBLEN CYCLES 805
Figu
re 9
Min
sky–
Veb
len
cycl
es “
Ponz
i dyn
amic
s” (M
VC
-PD
): s
imul
atio
n re
sults
inte
rest
rate
100
200
300
400
68 4 210
020
030
040
0
-1.01.0
2.0
3.0
100
200
300
400
20 -20
100
100
200
300
400
0.05
2
0.04
6
0.05
4
0.05
0
0.04
8
0.05
6
0.05
8
406080
M2
MC
M1
Bank
Equ
ity
GD
PC 1
C 2C C
IY 2
Pro!
ts B
anks
Pro!
ts F
irms
806 JOURNAL OF POST KEYNESIAN ECONOMICS
Figu
re 1
0 M
insk
y–V
eble
n cy
cles
“he
dge
dyna
mic
s” (M
VC
-HD
): s
imul
atio
n re
sults
100
200
300
400
68 4 2
100
200
300
400
0.5
1.0
1.5
2.0
100
200
300
400
80 20
100 60 40
100
200
300
400
0.04
8
0.04
5
0.04
9
0.04
7
0.04
6
0.05
0
inte
rest
rate
GD
PC 1
C 2C C
IY 2
Pro!
ts B
anks
Pro!
ts F
irms
M2
MC
M1
Bank
Equ
ity
DEBT, BOOM, BUST: A THEORY OF MINSKY–VEBLEN CYCLES 807
Concluding thoughts
In this article, we analyze the forces that contributed most significantly to the emergence and outbreak of the current crisis in the United States. This led us to a formulation of a theory of Minsky–Veblen cycles. These cycles typically start with an increase in income inequality that leads to a reduction in the saving rate as well as increasing demand for consumer credit. If institutional developments in general and the evolution of bank-ing practices in particular lead to a significant increase in credit supply, the result is a self-propagating boom. As increasing debt levels and growing interest rates decrease the solvency of households, households gradually reduce consumption—causing a recession and starting a phase of com-pression. Eventually, banks shorten credit supply, leading to bankruptcies and a severe crisis that is followed by a stable phase of consolidation in which households service their debt. But within this stable period, the destabilizing institutional dynamics, as described by Minsky, will gradu-ally take over to cause the next Minsky–Veblen cycle.
While our story stops with the financial crisis, it also leaves room to consider the current fiscal crisis in the context of this framework. In the simulations leading to our Minsky–Veblen cycles, we assumed that all bank profits are distributed to capitalists, while all losses show up in negative bank equity, which do not have to be borne by capitalists. While at first this seems like a convenient simplification, it is more or less what happens in reality: When bank equity turns negative, governments intro-duce huge rescue packages to keep the banking system from collapsing, ultimately leading to reallocation of negative balances from the banking sector to the governmental sector. Therefore, a realistic extension of the existing framework would be to introduce a governmental sector that absorbs these negative equity balances. However, a diligent incorporation of this aspect would also require adding a series of other features to our model (e.g., the role of fiscal policy), which lie outside the scope of this study but may provide an even richer theory of Minsky–Veblen cycles in the future. For now, it seems a good approximation to interpret those negative bank balances as representing what they will most likely bring forth in reality: debt created by banks and borne by the public.
REFERENCES
Barba, A., and M. Pivetti. “Rising Household Debt: Its Causes and Macroeconomic Impli-cations—A Long-Period Analysis.” Cambridge Journal of Economics, 2009, 33, 113–137.Bernanke, B.S. “The Great Moderation.” Paper presented at the meeting of the East-ern Economic Association, Washington, DC, February 20, 2004.
808 JOURNAL OF POST KEYNESIAN ECONOMICS
Boushey, H., and C. Weller. “Inequality and Household Economic Hardship in the United States of America.” DESA Working Paper, no. 18, 2006.Bowles, S., and Y. Park. “Emulation, Inequality, and Work Hours: Was Thorstein Veblen Right?” Economic Journal, 2005, 115 (507), 379–412.Christen, M., and R.M. Morgan. “Keeping Up with the Joneses: Analyzing the Effect of Income Inequality on Consumer Borrowing.” Quantitative Marketing and Econom-ics, 2005, 3, 145–173.Cynamon, B.Z., and S.M. Fazzari. “Household Debt in the Consumer Age: Source of Growth: Risk of Collapse.” Capitalism and Society, 2008, 3 (2), 1–30.———. “Inequality and Household Finance During the Consumer Age.” INET Re-search Notes no. 23, 2013. Davanzati, G.F., and A. Pacella. “Emulation, Indebtedness and Income Distribution: A Monetary Theory of Production Approach.” Interventioné. European Journal of Economics and Economic Policies, 2010, 7 (1), 147–165.Delli Gatti, D.; Gallegati, M.; and Minsky, H.P. “Financial Institutions, Economic Policy, and the Dynamic Behavior of the Economy.” Levy Economics Institute of Bard College, Working Paper no. 126, 1994.Dobusch, L., and J. Kapeller. “Heterodox United vs. Mainstream City: Sketching a Framework for Interested Pluralism in Economics.” Journal of Economic Issues, 2012, 46 (4), 1035–1058.Dos Santos, C. “A Stock-Flow Consistent General Framework for Minskyan Analyses of Closed Economies.” Journal of Post Keynesian Economics, 2005, 27 (4), 711–735.Duesenberry, J.S. Income, Saving and the Theory of Consumer Behavior. Cambridge, MA: Harvard University Press, 1962[1949].Dutt, A.K. “Conspicuous Consumption, Consumer Debt and Growth.” In M. Setter-field (ed.), Interactions in Analytical Political Economy: Theory, Policy and Applica-tions. Armonk, NY: M.E. Sharpe, 2005, pp. 155–178.———. “Maturity, Stagnation and Consumer Debt: A Steindlian Approach.” Metro-economica, 2006, 57 (3), 339–364.———. “The Dependence Effect, Consumption and Happiness: Galbraith Revisited.” Review of Political Economy, 2008, 20 (4), 527–550.———. “Growth, Distribution and Crisis.” In H. Herr, T. Niechoj, C. Thomasberger, A. Truger, and T. van Treeck (eds.), From Crisis to Growth? The Challenges of Imbal-ances and Debt. Marburg: Metropolis, 2012, pp. 33–60.Dymski, G.A. “Why the Subprime Crisis Is Different: A Minskyian Approach.” Cam-bridge Journal of Economics, 2010, 34, 239–255.Economist. “Minsky’s Moment.” 2009 (available at www.economist.com/node/13415233 [accessed July 23, 2012]).Evans, T. “The 2002–2007 US Economic Expansion and the Limits of Finance-Led Capitalism.” Studies in Political Economy, 2009, 83, 33–59.Financial Times. “What This Minsky Moment Means.” 2007 (available at www.ft.com/intl/cms/s/0/ddb7842c-50c2-11dc-86e2-0000779fd2ac.html#axzz21QerqSki [accessed July 23, 2012]).Franke, R., and W. Semmler. “Debt Financing of Firms, Stability, and Cycles in a Macroeconomic Growth Model.” In W. Semmler (ed.), Financial Dynamics and Busi-ness Cycles: New Perspectives. Armonk, NY: M.E. Sharpe, 1989, pp. 38–64.Godley, W., and M. Lavoie. Monetary Economics: An Integrated Approach to Credit, Money, Income, Production and Wealth. Basingstoke, UK: Palgrave Macmillan, 2007.Goodhart, C.A.E., and D.P. Tsomocos. “The Role of Default in Macroeconomics.” IMES Discussion Paper no. 2011-E-23, 2011.
DEBT, BOOM, BUST: A THEORY OF MINSKY–VEBLEN CYCLES 809
Hein, E. “Distribution ‘Financialization’ and the Financial and Economic Crisis: Im-plications for Post-Crisis Economic Policies.” IPE Working Paper, no. 09/2011, 2011. ———. “Finance-Dominated Capitalism, Re-Distribution, Household Debt and Financial Fragility in a Kaleckian Distribution Growth Model.” PSL Quarterly Review, 2012, 65 (260), 11–51.Hogg, M.A., and D.J. Terry. “Social Identity and Self-Categorization Process in Orga-nizational Contexts.” Academy of Management Review, 2000, 25 (1), 121–140.International Labor Organization (ILO) and International Monetary Fund (IMF). “The Challenges of Growth, Employment and Social Cohesion. Discussion Document.” Proceedings of the joint ILO–IMF conference in Oslo, Norway, September 13, 2010.Kahnemann, D. “Maps of Bounded Rationality: Psychology for Behavioral Econom-ics.” American Economic Review, 2003, 93 (5), 1449–1475.Kapeller, J., and B. Schütz. “Exploring Pluralist Economics: The Case of the Minsky–Veblen Cycles.” Journal of Economic Issues, 2013, 47 (2), 515–524.Keen, S. “Finance and Economic Breakdown: Modeling Minsky’s ‘Financial Instabil-ity Hypothesis.’” Journal of Post Keynesian Economics, 1995, 17 (4), 607–635.———. “A Monetary Minsky Model of the Great Moderation and the Great Re-cession.” Journal of Economic Behavior and Organization, 2011, doi:10.1016/j.jebo.2011.01.010.Keynes, J.M. The General Theory of Employment, Interest and Money. New York: Harcourt, Brace and World, 1936.Kindleberger, C.P. Manias, Panics and Crashes. London: Macmillan, 1978.Krueger, D., and F. Perri. “Does Income Inequality Lead to Consumption Inequality? Evidence and Theory.” Review of Economic Studies, 2006, 73 (1), 163–193.Kumhof, M., and R. Rancière. “Inequality, Leverage and the Crisis.” IMF Working Paper no. 10/268, 2010.Kumhof, M.; Lebarz, C.; Rannière, R.; Richter, A.W.; and Throckmorton, A. “Income Inequality and Current Account Imbalances.” IMF Working Paper no. 12/08, 2012.Lavoie, M., and W. Godley. “Kaleckian Models of Growth in a Coherent Stock-Flow Monetary Framework: A Kaldorian View.” Journal of Post Keynesian Economics, 2002, 24 (2), 277–311.McCulley, P. “The Shadow Banking System and Hyman Minsky’s Economic Jour-ney.” In L.B. Siegel (ed.), Insights into the Global Financial Crisis. Charlottesville, VA: Research Foundation of CFA Institute, 2009, pp. 257–268.Meirelles, J.A., and Lima, G.T. “Debt, Financial Fragility, and Economic Growth: A Post Keynesian Macromodel.” Journal of Post Keynesian Economics, 2006, 29 (1), 93–115.Minsky, H.P. Stabilizing an Unstable Economy. New Haven, CT: Yale University Press, 1986.Neumark, D., and A. Postlewaite. “Relative Income Concerns and the Rise in Married Women’s Employment.” Journal of Public Economics, 1998, 70, 157–183.New Yorker. “A Minsky Moment.” 2008 (available at www.newyorker.com/talk/comment/2008/02/04/080204taco_talk_cassidy [accessed July 23, 2012]).Palley, T.I. “Debt, Aggregate Demand, and the Business Cycle: An Analysis in the Spirit of Kaldor and Minsky.” Journal of Post Keynesian Economics, 1994, 16 (3), 371–390.———. “Endogenous Money and the Business Cycle.” Journal of Economics, 1997, 65 (2), 133–149.———. “The Relative Permanent Income Theory of Consumption: A Synthetic Keynes-Duesenberry-Friedman Model.” Review of Political Economy, 2010, 22 (1), 41–56.
810 JOURNAL OF POST KEYNESIAN ECONOMICS
———. “America’s Flawed Paradigm: Macroeconomic Causes of the Financial Crisis and Great Recession.” Empirica, 2011, 38, 3–17.Pollin, R. “The Growth of U.S. Household Debt: Demand-Side Influences.” Journal of Macroeconomics, 1988, 10 (2), 231–248.———. Deeper in Debt: The Changing Financial Conditions of U.S. Households. Washington, DC: Economic Policy Institute, 1990.Rajan, R.G. Fault Lines: How Hidden Fractures Still Threaten the World Economy. Princeton, NJ: Princeton University Press, 2010.Schor, J. B. The Overspent American: Why We Want What We Don’t Need. New York: Basic Books, 1998.Shiller, R.J. Irrational Exuberance. Princeton, NJ: Princeton University Press, 2005.Skott, P. “On the Modelling of Systemic Financial Fragility.” In A.K. Dutt (ed.), New Directions in Analytical Political Economy. Aldershot, UK: Edward Elgar, 1994, pp. 46–76.Stiglitz, J. “The Global Crisis, Social Protection and Jobs.” International Labour Review, 2009, 148 (1–2), 1–13.Stockhammer, E. “Rising Inequality as a Root Cause of the Present Crisis.” PERI Working Paper, no. 282, 2012a. ———. “Financialization, Income Distribution and the Crisis.” Investigación Económica, 2012b, 71 (279), 39–70.Taylor, L., and O’Connell, S. “A Minsky Crisis.” Quarterly Journal of Economics, 1985, 100 (Supplement), 871–885.Tymoigne, E. “The Minskyan System, Part III: System Dynamics of a Stock Flow-Consistent Minskyan Model.” Levy Economics Institute of Bard College, Working Paper no. 455, 2006.UN Commission of Experts. Report of the Commission of Experts of the President of the United Nations General Assembly on Reforms of the International Monetary and Financial System. New York, 2009.Van Treeck, T. “A Synthetic, Stock-Flow Consistent Macroeconomic Model of ‘Fi-nancialisation.’” Cambridge Journal of Economics, 2009, 33, 467–493.———. “Did Inequality Cause the U.S. Financial Crisis?” IMK Working Paper 91, 2012.Veblen, T. The Theory of the Leisure Class. London: Allen and Unwin, 1970[1899].Wall Street Journal. “In Time of Tumult, Obscure Economist Gains Currency.” 2007 (available at http://online.wsj.com/article/SB118736585456901047.html [accessed July 23, 2012]).Whalen, C.J. “The U.S. Credit Crunch of 2007: A Minsky Moment.” Levy Economics Institute of Bard College, Public Policy Brief no. 92, 2007.Zezza, G. “U.S. Growth, the Housing Market, and Distribution of Income.” Journal of Post Keynesian Economics, 2008, 30 (3), 375–401.
DEBT, BOOM, BUST: A THEORY OF MINSKY–VEBLEN CYCLES 811
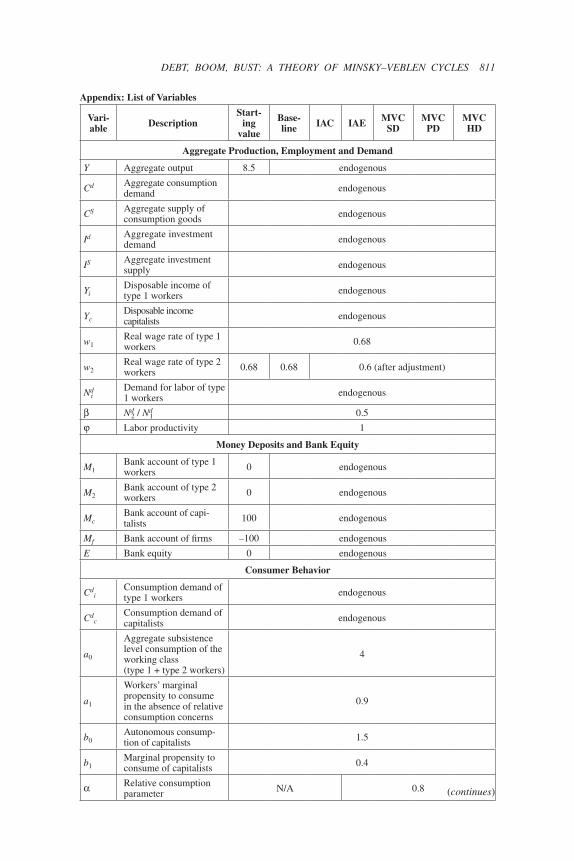
Appendix: List of Variables
Vari-able Description
Start-ing
value
Base-line IAC IAE MVC
SDMVC
PDMVCHD
Aggregate Production, Employment and Demand
Y Aggregate output 8.5 endogenous
Cd Aggregate consumption demand endogenous
CS Aggregate supply of consumption goods endogenous
Id Aggregate investment demand endogenous
IS Aggregate investment supply endogenous
YiDisposable income of type 1 workers endogenous
YcDisposable income capitalists endogenous
w1Real wage rate of type 1 workers 0.68
w2Real wage rate of type 2 workers 0.68 0.68 0.6 (after adjustment)
Ndi
Demand for labor of type 1 workers endogenous
Nd2 / Nd
1 0.5
Labor productivity 1
Money Deposits and Bank Equity
M1Bank account of type 1 workers 0 endogenous
M2Bank account of type 2 workers 0 endogenous
McBank account of capi-talists 100 endogenous
Mf Bank account of firms –100 endogenous
E Bank equity 0 endogenous
Consumer Behavior
Cdi
Consumption demand of type 1 workers endogenous
Cdc
Consumption demand of capitalists endogenous
a0
Aggregate subsistence level consumption of the working class (type 1 + type 2 workers)
4
a1
Workers’ marginal propensity to consume in the absence of relative consumption concerns
0.9
b0Autonomous consump-tion of capitalists 1.5
b1Marginal propensity to consume of capitalists 0.4
Relative consumption parameter N/A 0.8 (continues)
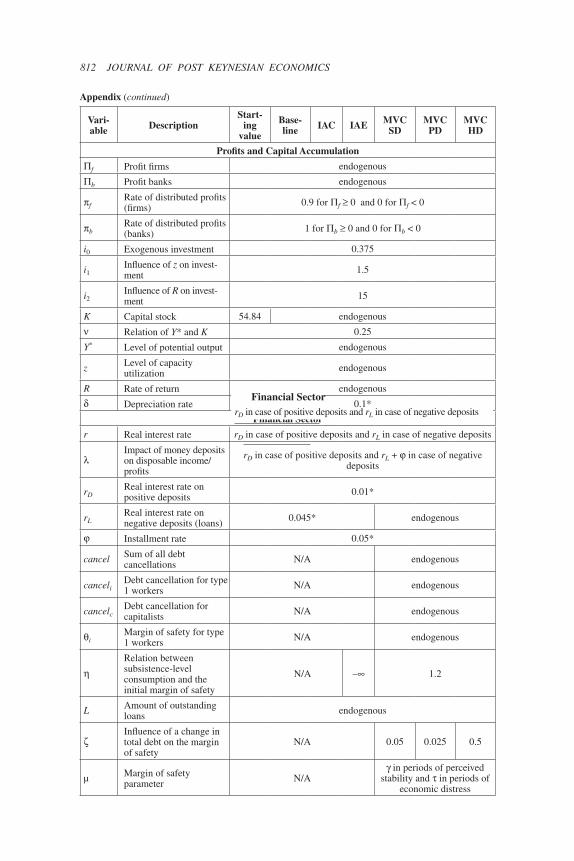
812 JOURNAL OF POST KEYNESIAN ECONOMICS
Vari-able Description
Start-ing
value
Base-line IAC IAE MVC
SDMVC
PDMVCHD
Profits and Capital Accumulation
f Profit firms endogenous
b Profit banks endogenous
fRate of distributed profits (firms) 0.9 for f 0 and 0 for f < 0
bRate of distributed profits (banks) 1 for b 0 and 0 for b < 0
i0 Exogenous investment 0.375
i1Influence of z on invest-ment 1.5
i2Influence of R on invest-ment 15
K Capital stock 54.84 endogenous
Relation of Y* and K 0.25
Y* Level of potential output endogenous
z Level of capacity utilization endogenous
R Rate of return endogenous
Depreciation rate 0.1*
Financial Sector
r Real interest rate rD in case of positive deposits and rL in case of negative deposits
Impact of money deposits on disposable income/profits
rD in case of positive deposits and rL + in case of negative deposits
rDReal interest rate on positive deposits 0.01*
rLReal interest rate on negative deposits (loans) 0.045* endogenous
Installment rate 0.05*
cancel Sum of all debt cancellations N/A endogenous
canceliDebt cancellation for type 1 workers N/A endogenous
cancelcDebt cancellation for capitalists N/A endogenous
iMargin of safety for type 1 workers N/A endogenous
Relation between subsistence-level consumption and the initial margin of safety
N/A – 1.2
L Amount of outstanding loans endogenous
Influence of a change in total debt on the margin of safety
N/A 0.05 0.025 0.5
µ Margin of safety parameter N/A
in periods of perceived stability and in periods of
economic distress
Appendix (continued)
Financial SectorrD in case of positive deposits and rL in case of negative deposits
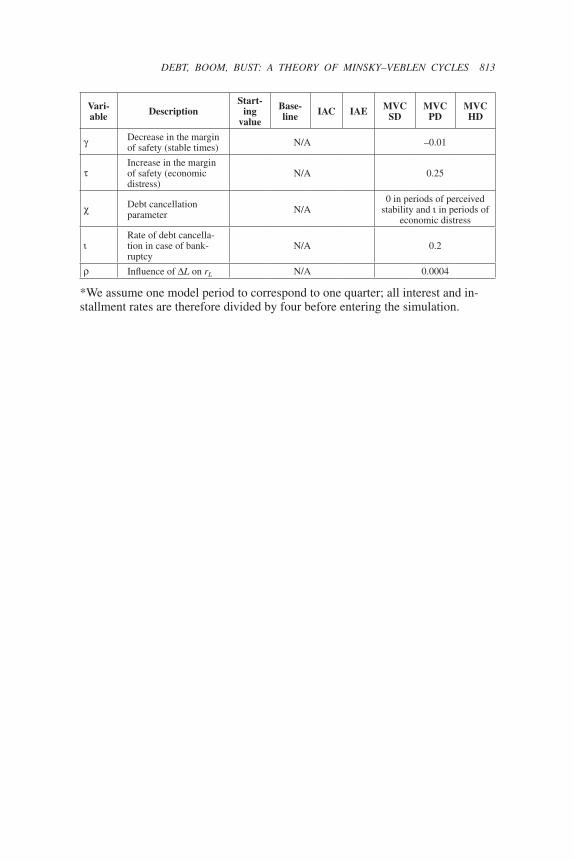
DEBT, BOOM, BUST: A THEORY OF MINSKY–VEBLEN CYCLES 813
Vari-able Description
Start-ing
value
Base-line IAC IAE MVC
SDMVC
PDMVCHD
Decrease in the margin of safety (stable times) N/A –0.01
Increase in the margin of safety (economic distress)
N/A 0.25
Debt cancellation parameter N/A
0 in periods of perceived stability and in periods of
economic distress
Rate of debt cancella-tion in case of bank-ruptcy
N/A 0.2
Influence of L on rL N/A 0.0004
*We assume one model period to correspond to one quarter; all interest and in-stallment rates are therefore divided by four before entering the simulation.