Embed Size (px)
Citation preview
Debt Capital for Estonian Regulated Undertakings
Prepared by Külli Haab, Mare Karotamm and Vivika Kruusmägi
From Estonian Competition Authority ([email protected])
Submitted for ERRA Regulatory Research Award 2017
October 2016
ESTONIAN COMPETITION AUTHORITY
2
CONTENTS
1 Introduction .............................................................................................................................. 3
2 Costs of long-term debt obligations included in the debt capital ......................................... 4
2.1 Cost of debt capital based on the WACC Manual.......................................................... 5
2.2 Costs of long-term debt obligations included in the debt capital .................................. 7
2.2.1 Compiling the sample.................................................................................................. 7
2.2.2 The actual costs of debt capital based on the information presented in the annual
reports ……………………………………………………………………………………. 9
3 Proportions of long-term debt obligations included in the debt capital ............................. 17
3.1 Proportion of debt capital based on the WACC Manual ............................................. 17
3.2 Proportions of long-term debt obligations included in the debt capital based on the
information presented in the annual reports ............................................................................ 19
4 Summary ................................................................................................................................ 22
5 References .............................................................................................................................. 25
Annex ............................................................................................................................................. 26
ESTONIAN COMPETITION AUTHORITY
3
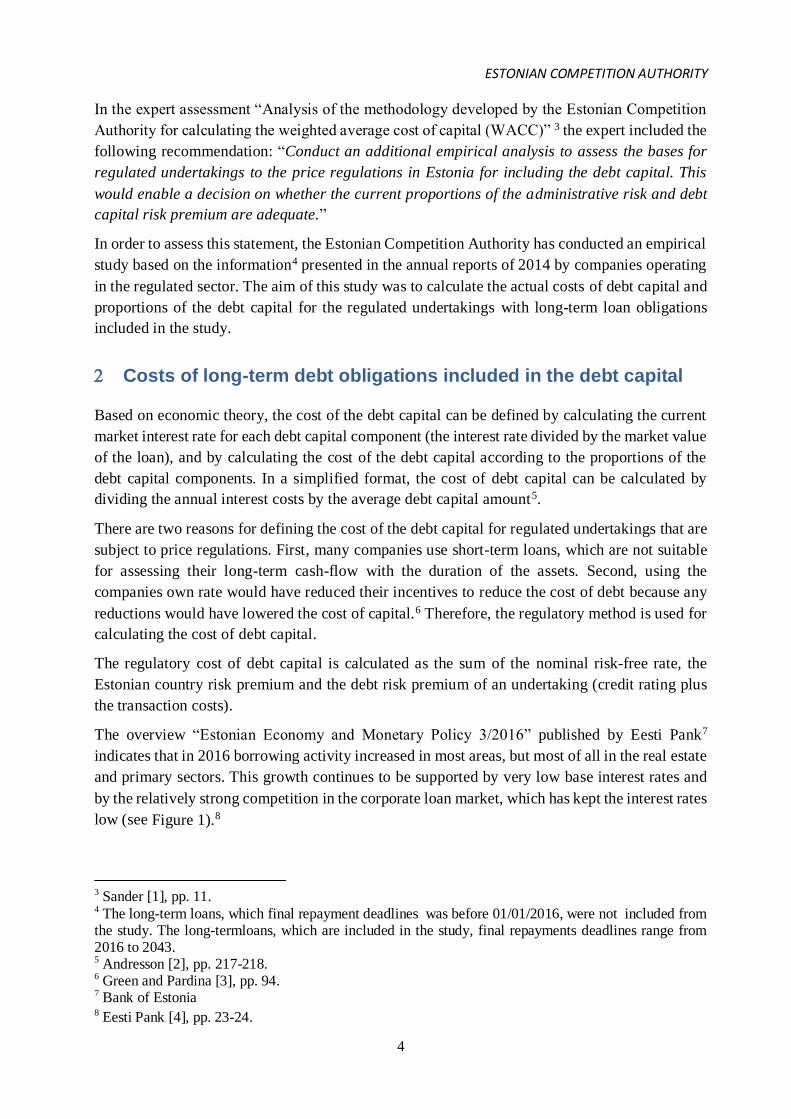
Introduction
There are special regulations1, specifying the principles for pricing, which are in place in Estonia
for the purpose of verifying the reasonability of the service pricing in regulated undertakings to
price regulations. The price of a service should cover the reasonable and effective costs, required
investments and a justified profit. Based on the common regulations it is appropriate to limit the
profit of regulated undertakings to the price regulation by using the weighted average cost of
capital (WACC), whereby it is important to assess the cost of the debt and the equity capital, as
well as the capital structure, i.e. the proportions of the debt and equity capital.
The Estonian Competition Authority has published a methodology guideline "Manual for
Calculating the Weighted Average Cost of Capital" (hereafter referred to as the WACC Manual),
which is used for calculating the justified profitability of the service pricing for administratively
regulated companies. Based on long-term regulatory practice, it is assumed that if the justified
return or operating profit2 does not exceed the WACC then the profit earned by the undertaking
is within a reasonable limit.
Calculating justified operating profit as a pricing component for monopoly services is necessary
to limit the profit of company and to avoid a situation where a company dominates the market
(e.g. an infrastructure company) and starts earning an extreme profit by selling their services. In
addition, the need to limit the profit is derived from the assumption that there is no competition
on the market, which would otherwise guarantee a justified profit as a result of the natural market
conditions. Companies operating in a free market cannot earn extreme profits, as increasing the
price of a service would lead to the consumers moving on to another competitor. If the capital
profitability of company operating on free market turns out to be more profitable than that of
company that dominates the market (a monopoly), then this is directly due to the risks applicable
to the business operations.
The aim of this empirical study is to define the actual costs and proportions for including debt
capital in regulated undertakings (heating undertakings, transmission and distribution network
operators, natural gas distribution network operators and water undertakings) as compared to the
indicators defined in the WACC Manual of the Estonian Competition Authority, and to assess
whether the cost of debt capital is sufficient for financing the undertakings by means of loans.
In Estonia, the regulated cost of debt capital is defined as the sum of the nominal risk-free rate,
the Estonian country risk premium and the debt risk premium of an undertaking. The regulative
proportion of the debt capital is 50%.
1 District Heating Act, Electricity Market Act, Natural Gas Act, Public Water Supply and Sewerage Act. 2 Justified return (operating profit), % = (justified profit, € / cost of fixed assets required for providing the
service, €) * 100%.
ESTONIAN COMPETITION AUTHORITY
4
In the expert assessment “Analysis of the methodology developed by the Estonian Competition
Authority for calculating the weighted average cost of capital (WACC)” 3 the expert included the
following recommendation: “Conduct an additional empirical analysis to assess the bases for
regulated undertakings to the price regulations in Estonia for including the debt capital. This
would enable a decision on whether the current proportions of the administrative risk and debt
capital risk premium are adequate.”
In order to assess this statement, the Estonian Competition Authority has conducted an empirical
study based on the information4 presented in the annual reports of 2014 by companies operating
in the regulated sector. The aim of this study was to calculate the actual costs of debt capital and
proportions of the debt capital for the regulated undertakings with long-term loan obligations
included in the study.
Costs of long-term debt obligations included in the debt capital
Based on economic theory, the cost of the debt capital can be defined by calculating the current
market interest rate for each debt capital component (the interest rate divided by the market value
of the loan), and by calculating the cost of the debt capital according to the proportions of the
debt capital components. In a simplified format, the cost of debt capital can be calculated by
dividing the annual interest costs by the average debt capital amount5.
There are two reasons for defining the cost of the debt capital for regulated undertakings that are
subject to price regulations. First, many companies use short-term loans, which are not suitable
for assessing their long-term cash-flow with the duration of the assets. Second, using the
companies own rate would have reduced their incentives to reduce the cost of debt because any
reductions would have lowered the cost of capital.6 Therefore, the regulatory method is used for
calculating the cost of debt capital.
The regulatory cost of debt capital is calculated as the sum of the nominal risk-free rate, the
Estonian country risk premium and the debt risk premium of an undertaking (credit rating plus
the transaction costs).
The overview “Estonian Economy and Monetary Policy 3/2016” published by Eesti Pank7
indicates that in 2016 borrowing activity increased in most areas, but most of all in the real estate
and primary sectors. This growth continues to be supported by very low base interest rates and
by the relatively strong competition in the corporate loan market, which has kept the interest rates
low (see Figure 1).8
3 Sander [1], pp. 11. 4 The long-term loans, which final repayment deadlines was before 01/01/2016, were not included from the study. The long-termloans, which are included in the study, final repayments deadlines range from 2016 to 2043. 5 Andresson [2], pp. 217-218. 6 Green and Pardina [3], pp. 94. 7 Bank of Estonia 8 Eesti Pank [4], pp. 23-24.
ESTONIAN COMPETITION AUTHORITY
5
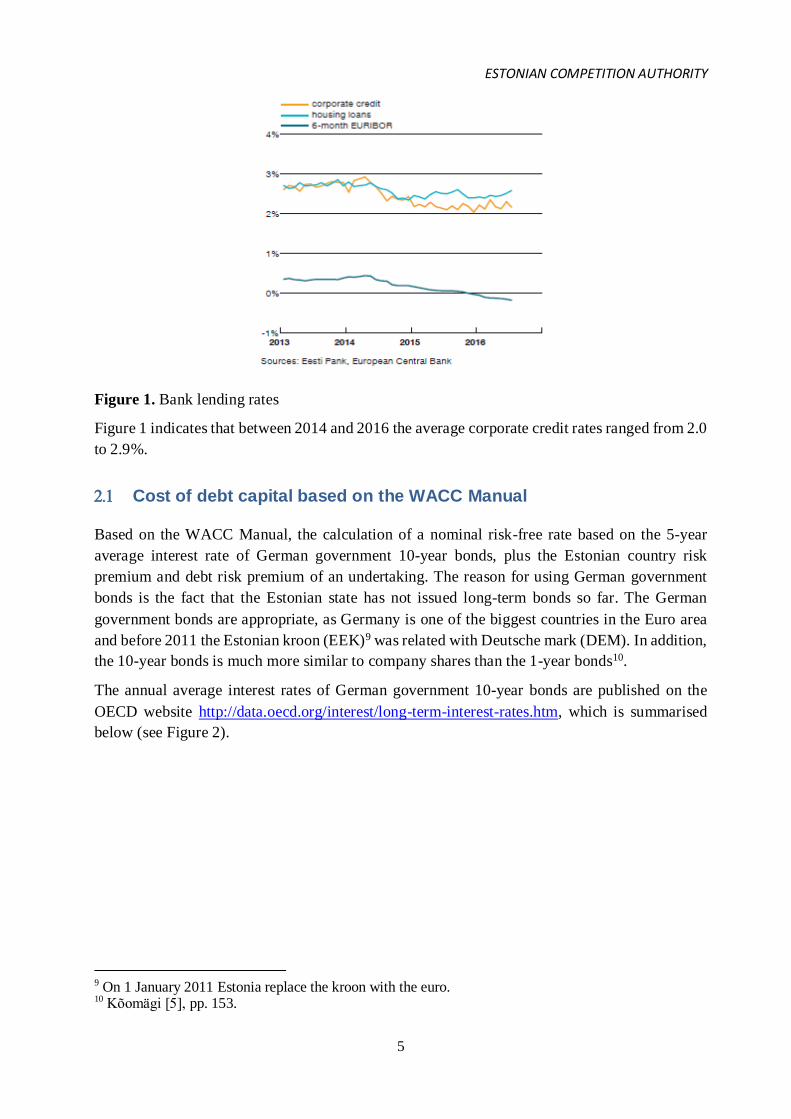
Figure 1. Bank lending rates
Figure 1 indicates that between 2014 and 2016 the average corporate credit rates ranged from 2.0
to 2.9%.
Cost of debt capital based on the WACC Manual
Based on the WACC Manual, the calculation of a nominal risk-free rate based on the 5-year
average interest rate of German government 10-year bonds, plus the Estonian country risk
premium and debt risk premium of an undertaking. The reason for using German government
bonds is the fact that the Estonian state has not issued long-term bonds so far. The German
government bonds are appropriate, as Germany is one of the biggest countries in the Euro area
and before 2011 the Estonian kroon (EEK)9 was related with Deutsche mark (DEM). In addition,
the 10-year bonds is much more similar to company shares than the 1-year bonds10.
The annual average interest rates of German government 10-year bonds are published on the
OECD website http://data.oecd.org/interest/long-term-interest-rates.htm, which is summarised
below (see Figure 2).
9 On 1 January 2011 Estonia replace the kroon with the euro. 10 Kõomägi [5], pp. 153.
ESTONIAN COMPETITION AUTHORITY
6
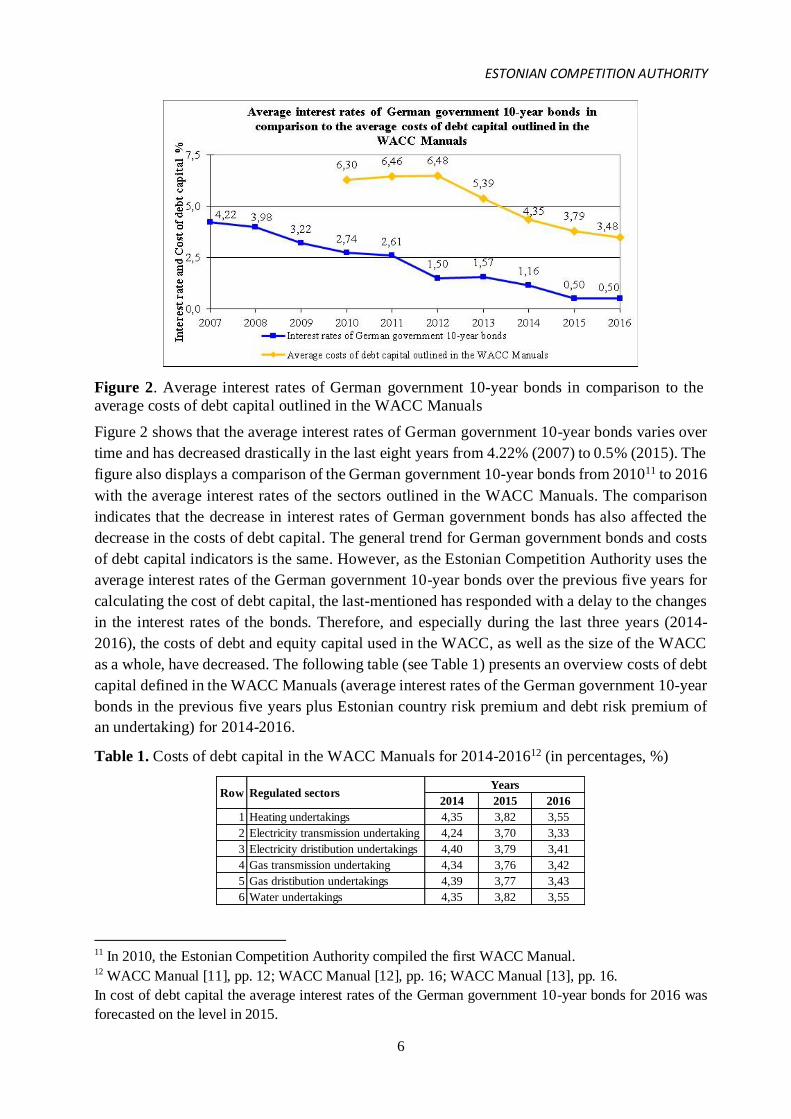
Figure 2. Average interest rates of German government 10-year bonds in comparison to the
average costs of debt capital outlined in the WACC Manuals
Figure 2 shows that the average interest rates of German government 10-year bonds varies over
time and has decreased drastically in the last eight years from 4.22% (2007) to 0.5% (2015). The
figure also displays a comparison of the German government 10-year bonds from 201011 to 2016
with the average interest rates of the sectors outlined in the WACC Manuals. The comparison
indicates that the decrease in interest rates of German government bonds has also affected the
decrease in the costs of debt capital. The general trend for German government bonds and costs
of debt capital indicators is the same. However, as the Estonian Competition Authority uses the
average interest rates of the German government 10-year bonds over the previous five years for
calculating the cost of debt capital, the last-mentioned has responded with a delay to the changes
in the interest rates of the bonds. Therefore, and especially during the last three years (2014-
2016), the costs of debt and equity capital used in the WACC, as well as the size of the WACC
as a whole, have decreased. The following table (see Table 1) presents an overview costs of debt
capital defined in the WACC Manuals (average interest rates of the German government 10-year
bonds in the previous five years plus Estonian country risk premium and debt risk premium of
an undertaking) for 2014-2016.
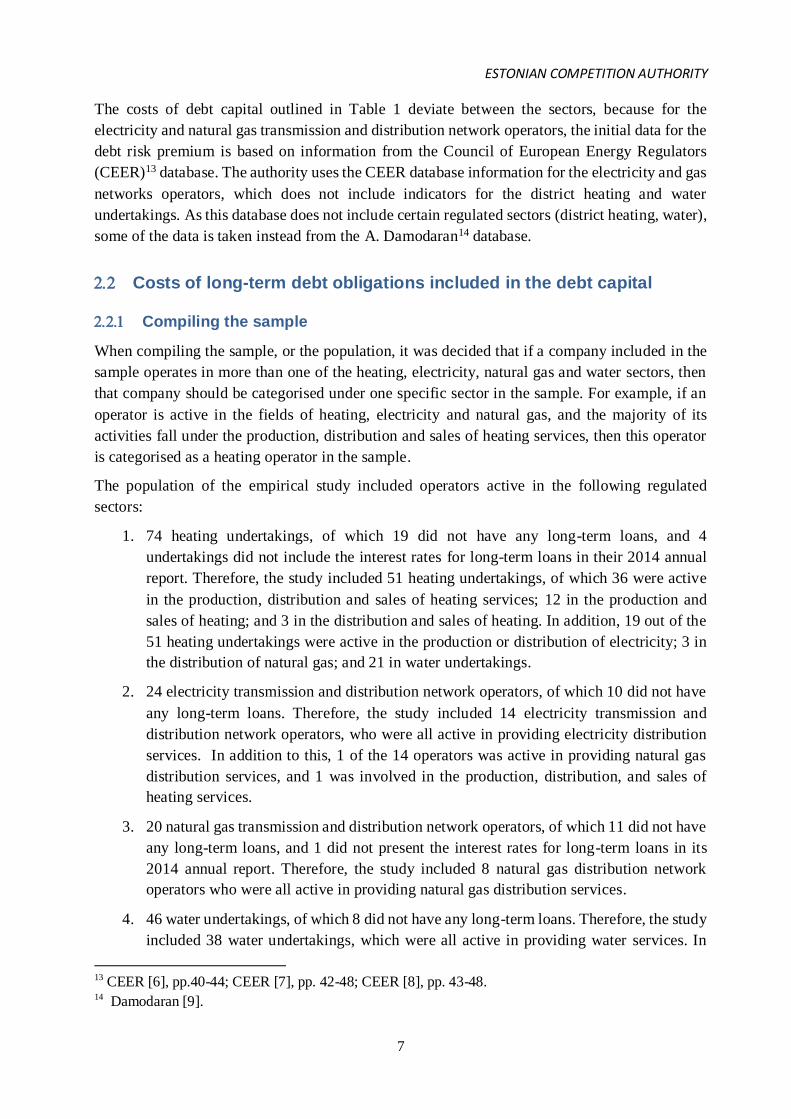
Table 1. Costs of debt capital in the WACC Manuals for 2014-201612 (in percentages, %)
11 In 2010, the Estonian Competition Authority compiled the first WACC Manual. 12 WACC Manual [11], pp. 12; WACC Manual [12], pp. 16; WACC Manual [13], pp. 16.
In cost of debt capital the average interest rates of the German government 10-year bonds for 2016 was
forecasted on the level in 2015.
2014 2015 2016
1 Heating undertakings 4,35 3,82 3,55
2 Electricity transmission undertaking 4,24 3,70 3,33
3 Electricity dristibution undertakings 4,40 3,79 3,41
4 Gas transmission undertaking 4,34 3,76 3,42
5 Gas dristibution undertakings 4,39 3,77 3,43
6 Water undertakings 4,35 3,82 3,55
Row Regulated sectorsYears
ESTONIAN COMPETITION AUTHORITY
7
The costs of debt capital outlined in Table 1 deviate between the sectors, because for the
electricity and natural gas transmission and distribution network operators, the initial data for the
debt risk premium is based on information from the Council of European Energy Regulators
(CEER)13 database. The authority uses the CEER database information for the electricity and gas
networks operators, which does not include indicators for the district heating and water
undertakings. As this database does not include certain regulated sectors (district heating, water),
some of the data is taken instead from the A. Damodaran14 database.
Costs of long-term debt obligations included in the debt capital
Compiling the sample
When compiling the sample, or the population, it was decided that if a company included in the
sample operates in more than one of the heating, electricity, natural gas and water sectors, then
that company should be categorised under one specific sector in the sample. For example, if an
operator is active in the fields of heating, electricity and natural gas, and the majority of its
activities fall under the production, distribution and sales of heating services, then this operator
is categorised as a heating operator in the sample.
The population of the empirical study included operators active in the following regulated
sectors:
1. 74 heating undertakings, of which 19 did not have any long-term loans, and 4
undertakings did not include the interest rates for long-term loans in their 2014 annual
report. Therefore, the study included 51 heating undertakings, of which 36 were active
in the production, distribution and sales of heating services; 12 in the production and
sales of heating; and 3 in the distribution and sales of heating. In addition, 19 out of the
51 heating undertakings were active in the production or distribution of electricity; 3 in
the distribution of natural gas; and 21 in water undertakings.
2. 24 electricity transmission and distribution network operators, of which 10 did not have
any long-term loans. Therefore, the study included 14 electricity transmission and
distribution network operators, who were all active in providing electricity distribution
services. In addition to this, 1 of the 14 operators was active in providing natural gas
distribution services, and 1 was involved in the production, distribution, and sales of
heating services.
3. 20 natural gas transmission and distribution network operators, of which 11 did not have
any long-term loans, and 1 did not present the interest rates for long-term loans in its
2014 annual report. Therefore, the study included 8 natural gas distribution network
operators who were all active in providing natural gas distribution services.
4. 46 water undertakings, of which 8 did not have any long-term loans. Therefore, the study
included 38 water undertakings, which were all active in providing water services. In
13 CEER [6], pp.40-44; CEER [7], pp. 42-48; CEER [8], pp. 43-48. 14 Damodaran [9].
ESTONIAN COMPETITION AUTHORITY
8
addition, 6 out of the 38 water undertakings were active in the production, distribution
and sales of heating services, and 1 was involved in electricity distribution services.
Estonian Competition Authority approves the prices for various services, which are based on the
justified sales volume and allowed sales revenue, and considers it appropriate to include a
reasonable profitability from the invested capital in the prices of the regulated activities. Because
of this the regulated undertakings from the different sectors included in the sample were divided
into groups based on their sales volume, which were in turn grouped by the balance sheet
amounts, as outlined in the table below (see Table 2).
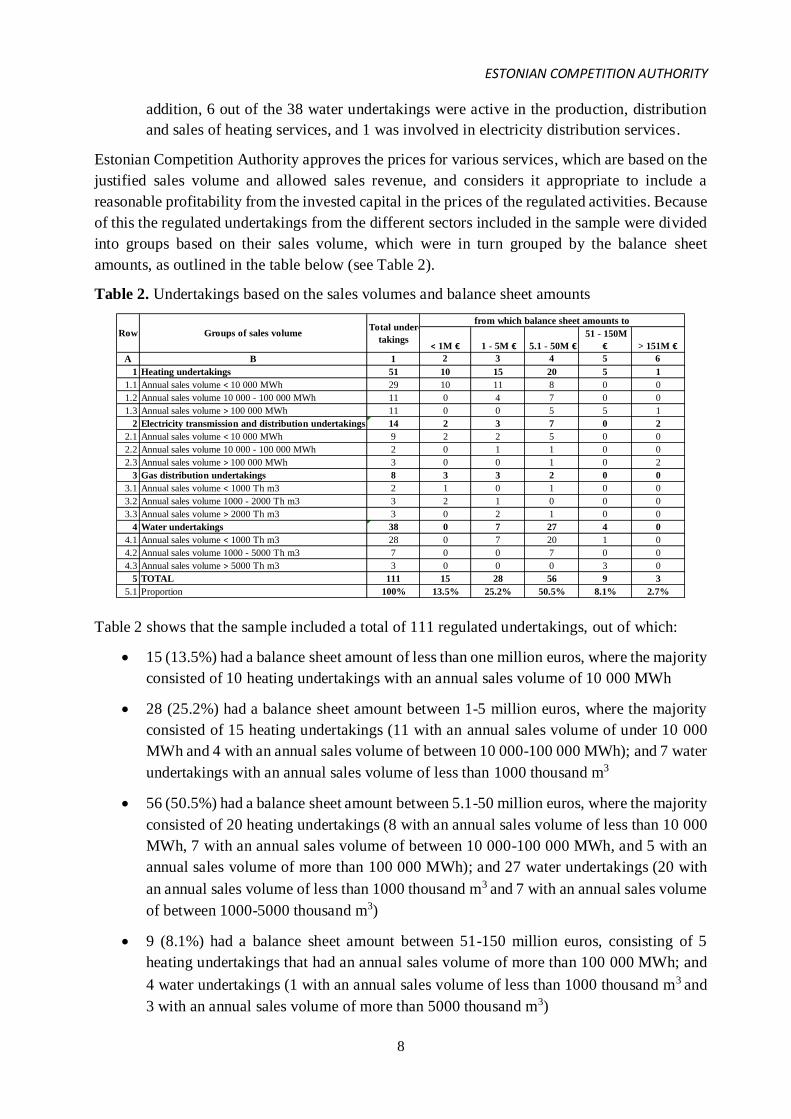
Table 2. Undertakings based on the sales volumes and balance sheet amounts
Table 2 shows that the sample included a total of 111 regulated undertakings, out of which:
15 (13.5%) had a balance sheet amount of less than one million euros, where the majority
consisted of 10 heating undertakings with an annual sales volume of 10 000 MWh
28 (25.2%) had a balance sheet amount between 1-5 million euros, where the majority
consisted of 15 heating undertakings (11 with an annual sales volume of under 10 000
MWh and 4 with an annual sales volume of between 10 000-100 000 MWh); and 7 water
undertakings with an annual sales volume of less than 1000 thousand m3
56 (50.5%) had a balance sheet amount between 5.1-50 million euros, where the majority
consisted of 20 heating undertakings (8 with an annual sales volume of less than 10 000
MWh, 7 with an annual sales volume of between 10 000-100 000 MWh, and 5 with an
annual sales volume of more than 100 000 MWh); and 27 water undertakings (20 with
an annual sales volume of less than 1000 thousand m3 and 7 with an annual sales volume
of between 1000-5000 thousand m3)
9 (8.1%) had a balance sheet amount between 51-150 million euros, consisting of 5
heating undertakings that had an annual sales volume of more than 100 000 MWh; and
4 water undertakings (1 with an annual sales volume of less than 1000 thousand m3 and
3 with an annual sales volume of more than 5000 thousand m3)
< 1M € 1 - 5M € 5.1 - 50M €
51 - 150M
€ > 151M €
A B 1 2 3 4 5 6
1 Heating undertakings 51 10 15 20 5 1
1.1 Annual sales volume < 10 000 MWh 29 10 11 8 0 0
1.2 Annual sales volume 10 000 - 100 000 MWh 11 0 4 7 0 0
1.3 Annual sales volume > 100 000 MWh 11 0 0 5 5 1
2 Electricity transmission and distribution undertakings 14 2 3 7 0 2
2.1 Annual sales volume < 10 000 MWh 9 2 2 5 0 0
2.2 Annual sales volume 10 000 - 100 000 MWh 2 0 1 1 0 0
2.3 Annual sales volume > 100 000 MWh 3 0 0 1 0 2
3 Gas distribution undertakings 8 3 3 2 0 0
3.1 Annual sales volume < 1000 Th m3 2 1 0 1 0 0
3.2 Annual sales volume 1000 - 2000 Th m3 3 2 1 0 0 0
3.3 Annual sales volume > 2000 Th m3 3 0 2 1 0 0
4 Water undertakings 38 0 7 27 4 0
4.1 Annual sales volume < 1000 Th m3 28 0 7 20 1 0
4.2 Annual sales volume 1000 - 5000 Th m3 7 0 0 7 0 0
4.3 Annual sales volume > 5000 Th m3 3 0 0 0 3 0
5 TOTAL 111 15 28 56 9 3
5.1 Proportion 100% 13.5% 25.2% 50.5% 8.1% 2.7%
Row Groups of sales volumeTotal under-
takings
from which balance sheet amounts to
ESTONIAN COMPETITION AUTHORITY
9
3 (2.7%) had a balance sheet amount more than 151 million euros, consisting of 2
electricity transmission and distribution network operators that had an annual sales
volume of more than 100 000 MWh; and 1 heating undertaking with an annual sales
volume of more than 100 000 MWh
This summary indicates that the study includes small, medium and large undertakings in the
Estonian market.
The next section presents an overview defining costs of debt capital related to the inclusion of
long-term loans.
The actual costs of debt capital based on the information presented in the
annual reports
The empiric study is derived from the information presented in the annual reports for 201415 from
undertakings active in the regulated sectors, which included:
a) The average interest rates (%) for long-term16 loans and capital leases from commercial
banks and the loan amounts (in euros)
b) The average interest rates (%) for long-term loans from the Environmental Investment
Centre (EIC) and the loan amounts (in euros)
c) The average interest rates (%) for long-term loans from the parent undertakings or owners
or local authorities (hereafter referred to as the integrated parties) and the loan amounts
(in euros)
If undertakings had more than one long-term debt obligation with different interest rates, then
the weighted average cost of debt capital for each undertaking was calculated first. After that an
average costs of debt capital was calculated separately for each sector and for the population
(111 undertakings) as a whole. The results of these calculations are presented in the following
tables (see Tables 3 and 4, and Figure 3).
15 If the financial year of an undertaking did not match with the calendar year, the annual reports for 2014/2015 were used. 16 For long-term loans, we have not considered derivative instruments (SWAPs), as these are not linked to the fixed asset investments required for providing services, but are used to mitigate the interest risk.
ESTONIAN COMPETITION AUTHORITY
10
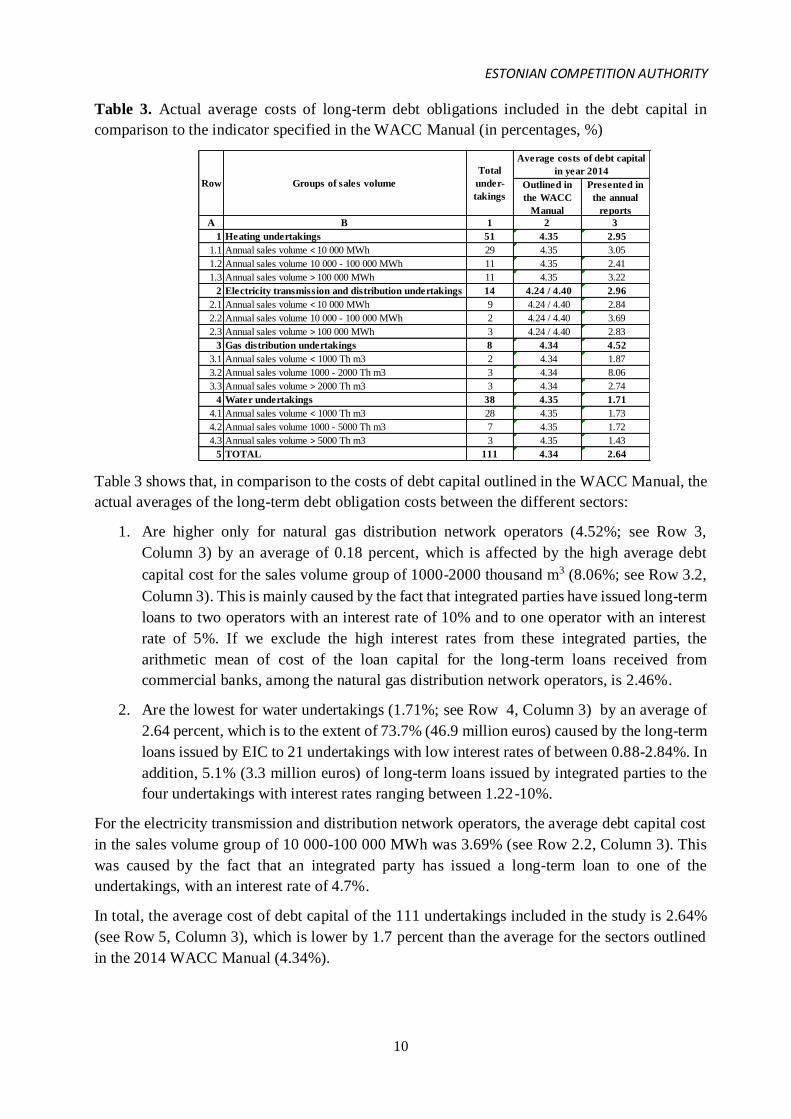
Table 3. Actual average costs of long-term debt obligations included in the debt capital in
comparison to the indicator specified in the WACC Manual (in percentages, %)
Table 3 shows that, in comparison to the costs of debt capital outlined in the WACC Manual, the
actual averages of the long-term debt obligation costs between the different sectors:
1. Are higher only for natural gas distribution network operators (4.52%; see Row 3,
Column 3) by an average of 0.18 percent, which is affected by the high average debt
capital cost for the sales volume group of 1000-2000 thousand m3 (8.06%; see Row 3.2,
Column 3). This is mainly caused by the fact that integrated parties have issued long-term
loans to two operators with an interest rate of 10% and to one operator with an interest
rate of 5%. If we exclude the high interest rates from these integrated parties, the
arithmetic mean of cost of the loan capital for the long-term loans received from
commercial banks, among the natural gas distribution network operators, is 2.46%.
2. Are the lowest for water undertakings (1.71%; see Row 4, Column 3) by an average of
2.64 percent, which is to the extent of 73.7% (46.9 million euros) caused by the long-term
loans issued by EIC to 21 undertakings with low interest rates of between 0.88-2.84%. In
addition, 5.1% (3.3 million euros) of long-term loans issued by integrated parties to the
four undertakings with interest rates ranging between 1.22-10%.
For the electricity transmission and distribution network operators, the average debt capital cost
in the sales volume group of 10 000-100 000 MWh was 3.69% (see Row 2.2, Column 3). This
was caused by the fact that an integrated party has issued a long-term loan to one of the
undertakings, with an interest rate of 4.7%.
In total, the average cost of debt capital of the 111 undertakings included in the study is 2.64%
(see Row 5, Column 3), which is lower by 1.7 percent than the average for the sectors outlined
in the 2014 WACC Manual (4.34%).
A B 1 2 3
1 Heating undertakings 51 4.35 2.95
1.1 Annual sales volume < 10 000 MWh 29 4.35 3.05
1.2 Annual sales volume 10 000 - 100 000 MWh 11 4.35 2.41
1.3 Annual sales volume > 100 000 MWh 11 4.35 3.22
2 Electricity transmission and distribution undertakings 14 4.24 / 4.40 2.96
2.1 Annual sales volume < 10 000 MWh 9 4.24 / 4.40 2.84
2.2 Annual sales volume 10 000 - 100 000 MWh 2 4.24 / 4.40 3.69
2.3 Annual sales volume > 100 000 MWh 3 4.24 / 4.40 2.83
3 Gas distribution undertakings 8 4.34 4.52
3.1 Annual sales volume < 1000 Th m3 2 4.34 1.87
3.2 Annual sales volume 1000 - 2000 Th m3 3 4.34 8.06
3.3 Annual sales volume > 2000 Th m3 3 4.34 2.74
4 Water undertakings 38 4.35 1.71
4.1 Annual sales volume < 1000 Th m3 28 4.35 1.73
4.2 Annual sales volume 1000 - 5000 Th m3 7 4.35 1.72
4.3 Annual sales volume > 5000 Th m3 3 4.35 1.43
5 TOTAL 111 4.34 2.64
Row Groups of sales volume
Total
under-
takings
Average costs of debt capital
in year 2014
Outlined in
the WACC
Manual
Presented in
the annual
reports
ESTONIAN COMPETITION AUTHORITY
11
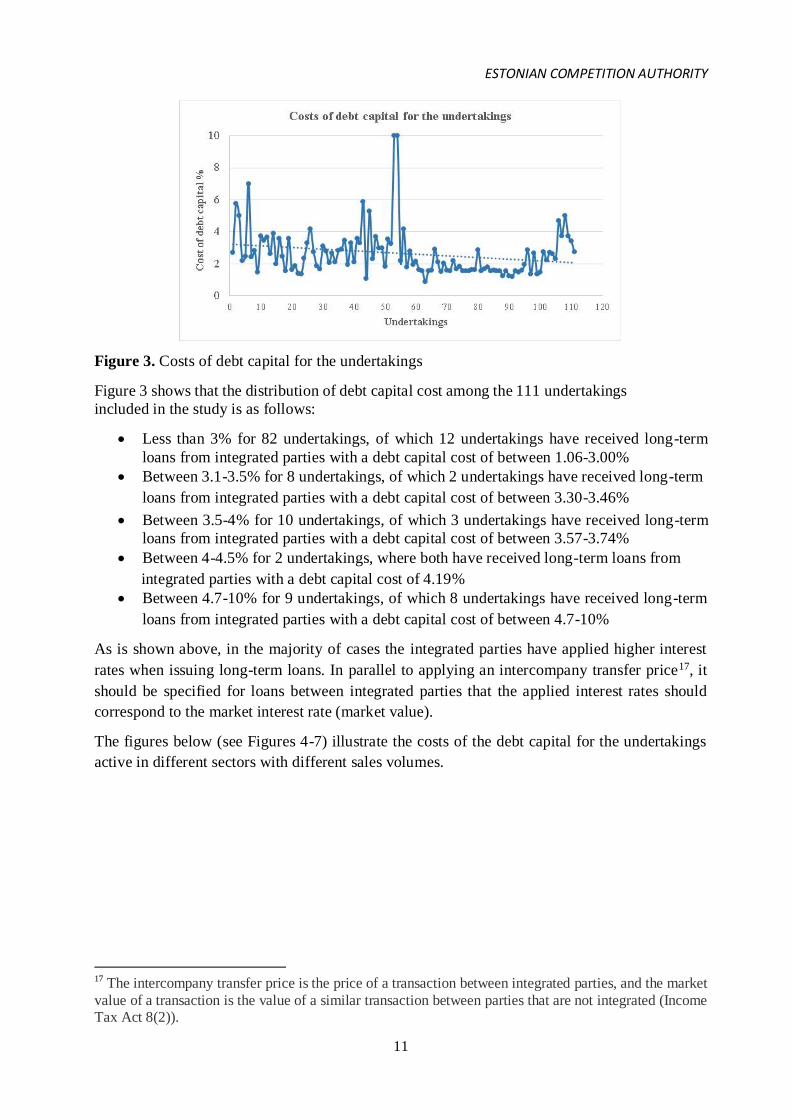
Figure 3. Costs of debt capital for the undertakings
Figure 3 shows that the distribution of debt capital cost among the 111 undertakings
included in the study is as follows:
Less than 3% for 82 undertakings, of which 12 undertakings have received long-term
loans from integrated parties with a debt capital cost of between 1.06-3.00%
Between 3.1-3.5% for 8 undertakings, of which 2 undertakings have received long-term
loans from integrated parties with a debt capital cost of between 3.30-3.46%
Between 3.5-4% for 10 undertakings, of which 3 undertakings have received long-term
loans from integrated parties with a debt capital cost of between 3.57-3.74%
Between 4-4.5% for 2 undertakings, where both have received long-term loans from
integrated parties with a debt capital cost of 4.19%
Between 4.7-10% for 9 undertakings, of which 8 undertakings have received long-term
loans from integrated parties with a debt capital cost of between 4.7-10%
As is shown above, in the majority of cases the integrated parties have applied higher interest
rates when issuing long-term loans. In parallel to applying an intercompany transfer price17, it
should be specified for loans between integrated parties that the applied interest rates should
correspond to the market interest rate (market value).
The figures below (see Figures 4-7) illustrate the costs of the debt capital for the undertakings
active in different sectors with different sales volumes.
17 The intercompany transfer price is the price of a transaction between integrated parties, and the market
value of a transaction is the value of a similar transaction between parties that are not integrated (Income Tax Act 8(2)).
ESTONIAN COMPETITION AUTHORITY
12
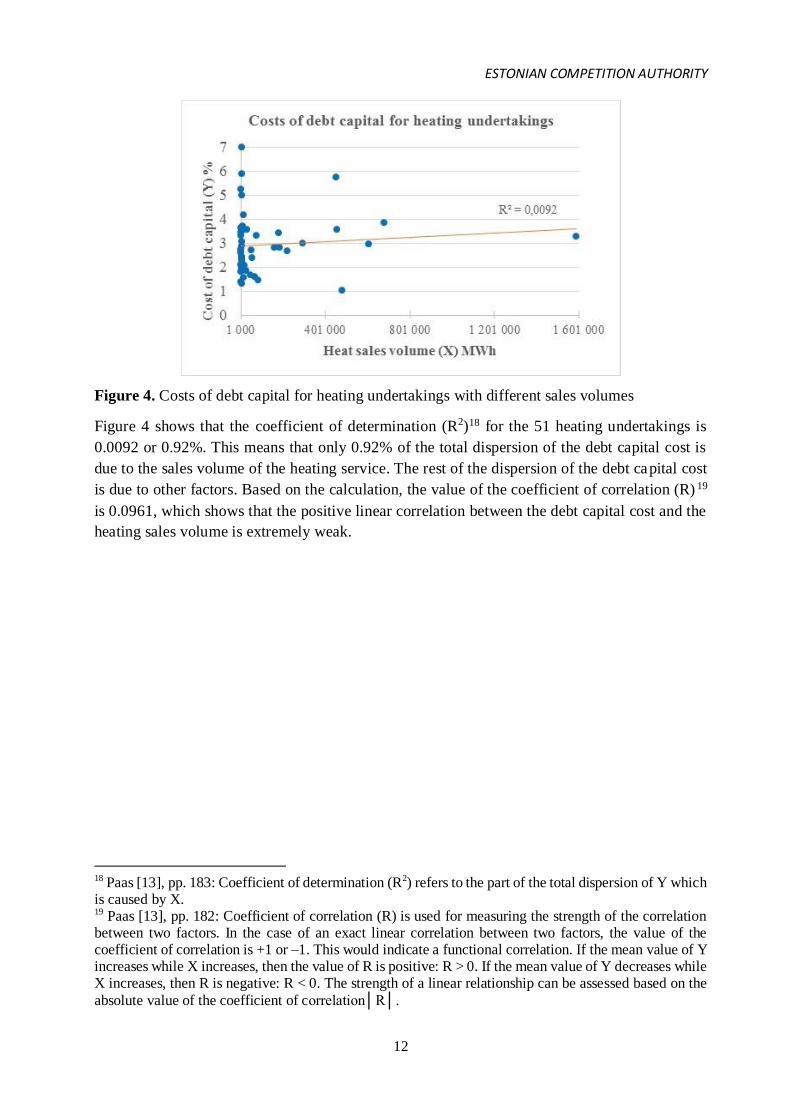
Figure 4. Costs of debt capital for heating undertakings with different sales volumes
Figure 4 shows that the coefficient of determination (R2)18 for the 51 heating undertakings is
0.0092 or 0.92%. This means that only 0.92% of the total dispersion of the debt capital cost is
due to the sales volume of the heating service. The rest of the dispersion of the debt capital cost
is due to other factors. Based on the calculation, the value of the coefficient of correlation (R) 19
is 0.0961, which shows that the positive linear correlation between the debt capital cost and the
heating sales volume is extremely weak.
18 Paas [13], pp. 183: Coefficient of determination (R2) refers to the part of the total dispersion of Y which is caused by X. 19 Paas [13], pp. 182: Coefficient of correlation (R) is used for measuring the strength of the correlation between two factors. In the case of an exact linear correlation between two factors, the value of the coefficient of correlation is +1 or –1. This would indicate a functional correlation. If the mean value of Y increases while X increases, then the value of R is positive: R > 0. If the mean value of Y decreases while X increases, then R is negative: R < 0. The strength of a linear relationship can be assessed based on the
absolute value of the coefficient of correlation│R│.
ESTONIAN COMPETITION AUTHORITY
13
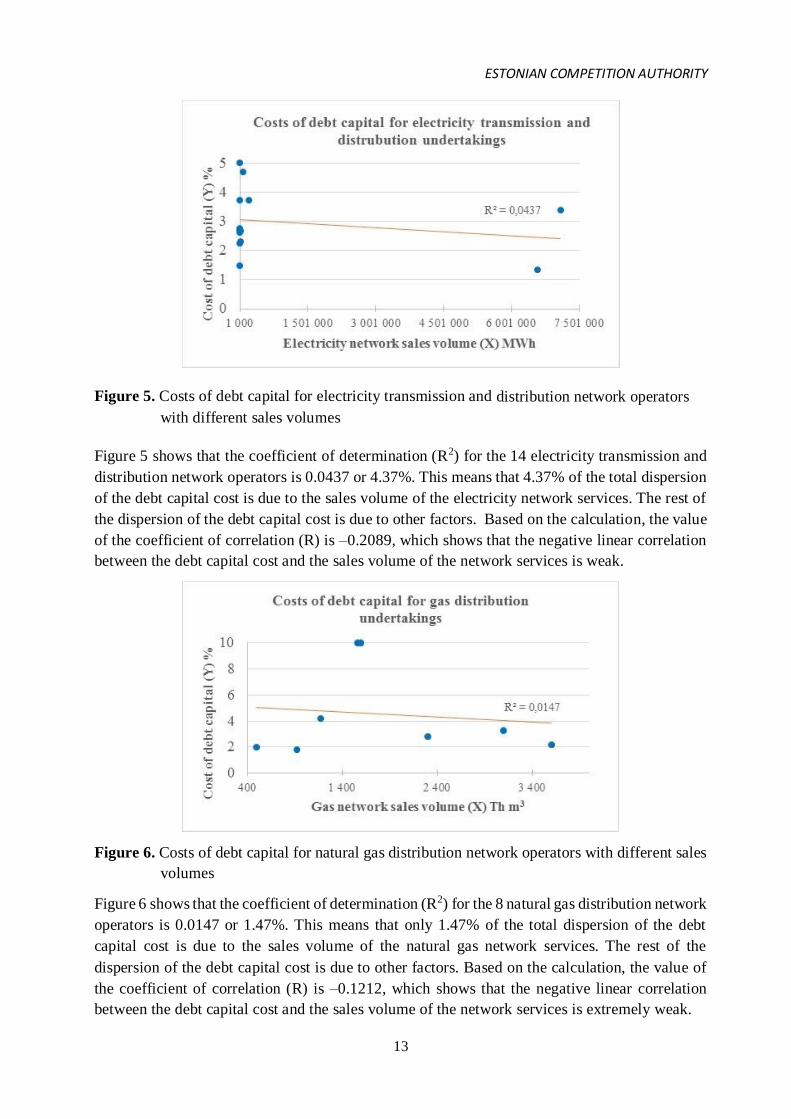
Figure 5. Costs of debt capital for electricity transmission and distribution network operators
with different sales volumes
Figure 5 shows that the coefficient of determination (R2) for the 14 electricity transmission and
distribution network operators is 0.0437 or 4.37%. This means that 4.37% of the total dispersion
of the debt capital cost is due to the sales volume of the electricity network services. The rest of
the dispersion of the debt capital cost is due to other factors. Based on the calculation, the value
of the coefficient of correlation (R) is –0.2089, which shows that the negative linear correlation
between the debt capital cost and the sales volume of the network services is weak.
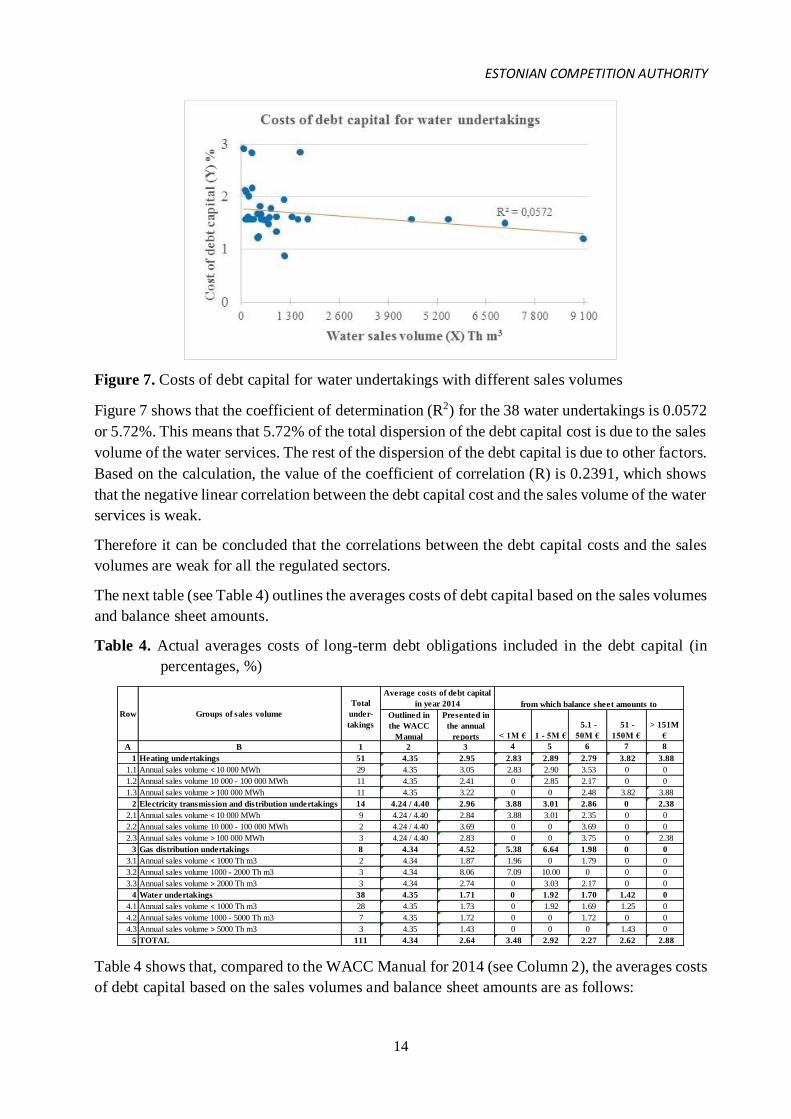
Figure 6. Costs of debt capital for natural gas distribution network operators with different sales
volumes
Figure 6 shows that the coefficient of determination (R2) for the 8 natural gas distribution network
operators is 0.0147 or 1.47%. This means that only 1.47% of the total dispersion of the debt
capital cost is due to the sales volume of the natural gas network services. The rest of the
dispersion of the debt capital cost is due to other factors. Based on the calculation, the value of
the coefficient of correlation (R) is –0.1212, which shows that the negative linear correlation
between the debt capital cost and the sales volume of the network services is extremely weak.
ESTONIAN COMPETITION AUTHORITY
14
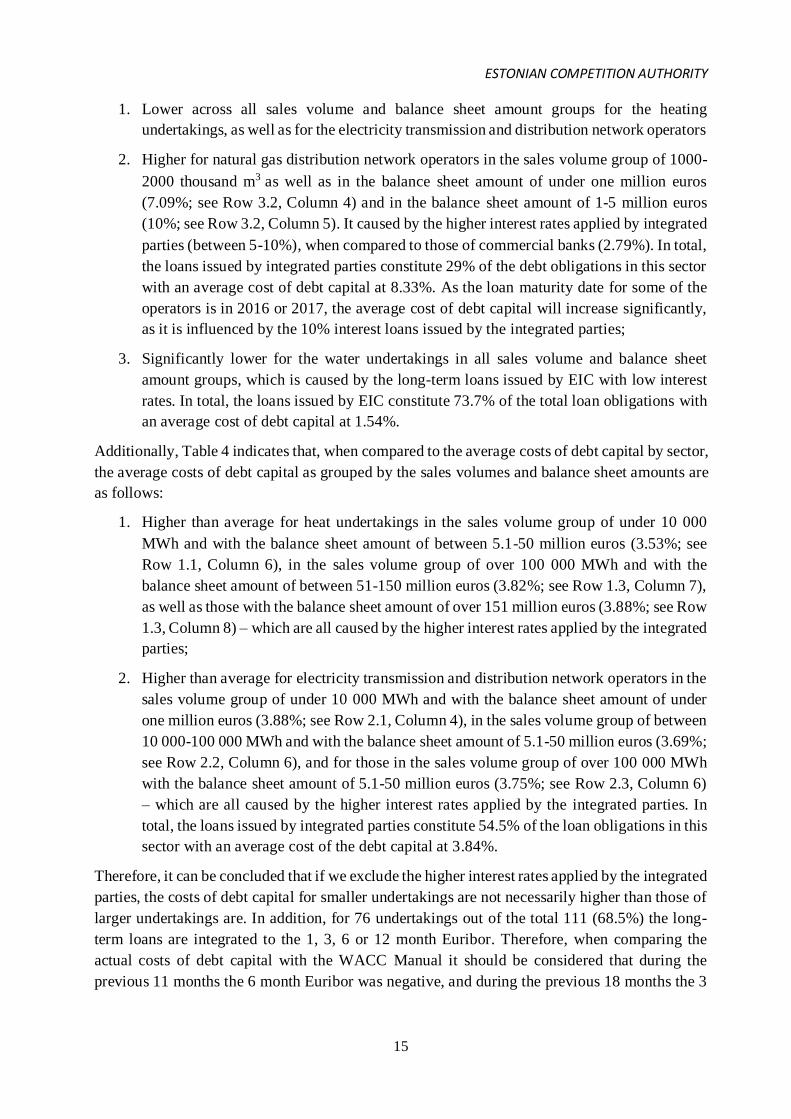
Figure 7. Costs of debt capital for water undertakings with different sales volumes
Figure 7 shows that the coefficient of determination (R2) for the 38 water undertakings is 0.0572
or 5.72%. This means that 5.72% of the total dispersion of the debt capital cost is due to the sales
volume of the water services. The rest of the dispersion of the debt capital is due to other factors.
Based on the calculation, the value of the coefficient of correlation (R) is 0.2391, which shows
that the negative linear correlation between the debt capital cost and the sales volume of the water
services is weak.
Therefore it can be concluded that the correlations between the debt capital costs and the sales
volumes are weak for all the regulated sectors.
The next table (see Table 4) outlines the averages costs of debt capital based on the sales volumes
and balance sheet amounts.
Table 4. Actual averages costs of long-term debt obligations included in the debt capital (in
percentages, %)
Table 4 shows that, compared to the WACC Manual for 2014 (see Column 2), the averages costs
of debt capital based on the sales volumes and balance sheet amounts are as follows:
A B 1 2 3 4 5 6 7 8
1 Heating undertakings 51 4.35 2.95 2.83 2.89 2.79 3.82 3.88
1.1 Annual sales volume < 10 000 MWh 29 4.35 3.05 2.83 2.90 3.53 0 0
1.2 Annual sales volume 10 000 - 100 000 MWh 11 4.35 2.41 0 2.85 2.17 0 0
1.3 Annual sales volume > 100 000 MWh 11 4.35 3.22 0 0 2.48 3.82 3.88
2 Electricity transmission and distribution undertakings 14 4.24 / 4.40 2.96 3.88 3.01 2.86 0 2.38
2.1 Annual sales volume < 10 000 MWh 9 4.24 / 4.40 2.84 3.88 3.01 2.35 0 0
2.2 Annual sales volume 10 000 - 100 000 MWh 2 4.24 / 4.40 3.69 0 0 3.69 0 0
2.3 Annual sales volume > 100 000 MWh 3 4.24 / 4.40 2.83 0 0 3.75 0 2.38
3 Gas distribution undertakings 8 4.34 4.52 5.38 6.64 1.98 0 0
3.1 Annual sales volume < 1000 Th m3 2 4.34 1.87 1.96 0 1.79 0 0
3.2 Annual sales volume 1000 - 2000 Th m3 3 4.34 8.06 7.09 10.00 0 0 0
3.3 Annual sales volume > 2000 Th m3 3 4.34 2.74 0 3.03 2.17 0 0
4 Water undertakings 38 4.35 1.71 0 1.92 1.70 1.42 0
4.1 Annual sales volume < 1000 Th m3 28 4.35 1.73 0 1.92 1.69 1.25 0
4.2 Annual sales volume 1000 - 5000 Th m3 7 4.35 1.72 0 0 1.72 0 0
4.3 Annual sales volume > 5000 Th m3 3 4.35 1.43 0 0 0 1.43 0
5 TOTAL 111 4.34 2.64 3.48 2.92 2.27 2.62 2.88
Row Groups of sales volume
Total
under-
takings
Average costs of debt capital
in year 2014 from which balance sheet amounts to
Outlined in
the WACC
Manual
Presented in
the annual
reports < 1M € 1 - 5M €
5.1 -
50M €
51 -
150M €
> 151M
€
ESTONIAN COMPETITION AUTHORITY
15
1. Lower across all sales volume and balance sheet amount groups for the heating
undertakings, as well as for the electricity transmission and distribution network operators
2. Higher for natural gas distribution network operators in the sales volume group of 1000-
2000 thousand m3 as well as in the balance sheet amount of under one million euros
(7.09%; see Row 3.2, Column 4) and in the balance sheet amount of 1-5 million euros
(10%; see Row 3.2, Column 5). It caused by the higher interest rates applied by integrated
parties (between 5-10%), when compared to those of commercial banks (2.79%). In total,
the loans issued by integrated parties constitute 29% of the debt obligations in this sector
with an average cost of debt capital at 8.33%. As the loan maturity date for some of the
operators is in 2016 or 2017, the average cost of debt capital will increase significantly,
as it is influenced by the 10% interest loans issued by the integrated parties;
3. Significantly lower for the water undertakings in all sales volume and balance sheet
amount groups, which is caused by the long-term loans issued by EIC with low interest
rates. In total, the loans issued by EIC constitute 73.7% of the total loan obligations with
an average cost of debt capital at 1.54%.
Additionally, Table 4 indicates that, when compared to the average costs of debt capital by sector,
the average costs of debt capital as grouped by the sales volumes and balance sheet amounts are
as follows:
1. Higher than average for heat undertakings in the sales volume group of under 10 000
MWh and with the balance sheet amount of between 5.1-50 million euros (3.53%; see
Row 1.1, Column 6), in the sales volume group of over 100 000 MWh and with the
balance sheet amount of between 51-150 million euros (3.82%; see Row 1.3, Column 7),
as well as those with the balance sheet amount of over 151 million euros (3.88%; see Row
1.3, Column 8) – which are all caused by the higher interest rates applied by the integrated
parties;
2. Higher than average for electricity transmission and distribution network operators in the
sales volume group of under 10 000 MWh and with the balance sheet amount of under
one million euros (3.88%; see Row 2.1, Column 4), in the sales volume group of between
10 000-100 000 MWh and with the balance sheet amount of 5.1-50 million euros (3.69%;
see Row 2.2, Column 6), and for those in the sales volume group of over 100 000 MWh
with the balance sheet amount of 5.1-50 million euros (3.75%; see Row 2.3, Column 6)
– which are all caused by the higher interest rates applied by the integrated parties. In
total, the loans issued by integrated parties constitute 54.5% of the loan obligations in this
sector with an average cost of the debt capital at 3.84%.
Therefore, it can be concluded that if we exclude the higher interest rates applied by the integrated
parties, the costs of debt capital for smaller undertakings are not necessarily higher than those of
larger undertakings are. In addition, for 76 undertakings out of the total 111 (68.5%) the long-
term loans are integrated to the 1, 3, 6 or 12 month Euribor. Therefore, when comparing the
actual costs of debt capital with the WACC Manual it should be considered that during the
previous 11 months the 6 month Euribor was negative, and during the previous 18 months the 3
ESTONIAN COMPETITION AUTHORITY
16
month Euribor was also negative (see Annex 120 and Annex 221). A negative Euribor means a
decreasing interest rate on the European money market, as well as a decreasing cost of the long-
term loans based on the Euribor for regulated undertakings in Estonia. In the case of a zero
Euribor, the average cost of the debt capital would decrease as follows:
for heating undertakings from 2.95% to 2.75%;
for electricity transmission and distribution network operators from 2.96% to 2.81%;
for natural gas distribution network operators from 4.52% to 4.42%; and
for water undertakings from 1.71% to 1.43%.
The next section presents an overview of defining the proportions of debt capital related to the
inclusion of long-term loans.
20 Euribor-rates.eu [14]; 1 month Euribor has been negative for the last 20 months; and the 12 month Euribor has been negative for the last 8 months (see Annex 1). 21 Eesti Pank [4], pp. 12.
ESTONIAN COMPETITION AUTHORITY
17
3 Proportions of long-term debt obligations included in the debt
capital
"Besides the impact of rate regulation on financing incentives, the regulator can more directly
intervene in financing decisions and dictate a certain capital structure or calculate rates with a
certain capital structure, leaving it up to the company to actually adjust to this capital structure
or not."22
"The capital structure has very little effect on the WACC, as the relationship between the debt
and the equity capital does not significantly influence the size of the WACC."23
3.1 Proportion of debt capital based on the WACC Manual
The justified profitability or operating profit of those regulated undertakings active within the
regulated sector is defined by multiplying the cost of the regulated assets used for providing the
service and the WACC.
In Estonia, the WACC is calculated based on the following formula24 (see Formula 1):
Formula 1. 𝑊𝐴𝐶𝐶 = 𝑘𝑒 ×𝐸𝐶
𝐷𝐶+𝐸𝐶+ 𝑘𝑑 ×
𝐷𝐶
𝐷𝐶+𝐸𝐶
Where:
k e – is the cost of equity capital (%);
k d – is the cost of debt capital (%);
EC – is the share of equity capital as defined by the regulator (%);
DC – is the share of the debt capital as defined by the regulator (%);
DC+EC – share of the debt capital and equity capital in total (%).
Based on the WACC Manual, all of the regulated undertakings active in the regulated sectors fall
under a capital structure whereby 50% is debt capital and 50% is equity capital.
The components DC / (DC+EC) and EC / (DC+EC) described in Formula 1 reflect the capital
structure, or the relationship of the debt and equity capital to the total capital, whereby total
capital is the sum of debt and equity capital shares. For example, if the proportions of the debt
and equity capital are both 50% then the total proportion is equal to 100%, and the relationship
of the debt capital and equity capital to the total capital is 0.5 (50%/100%=0.5) or 50%.
The relationship between optimal capital structure and the financial leverage25 is demonstrated
in the following Figure (see Figure 8).
22 Pedell [15], pp. 52. 23 Sander [1], pp. 4. 24 In countries with a classical income tax system, this formula uses a tax shield for the debt capital. This is currently lacking in Estonia. 25 Financial leverage indicates the relationship between the debt capital and the equity capital (DC/EC).
ESTONIAN COMPETITION AUTHORITY
18
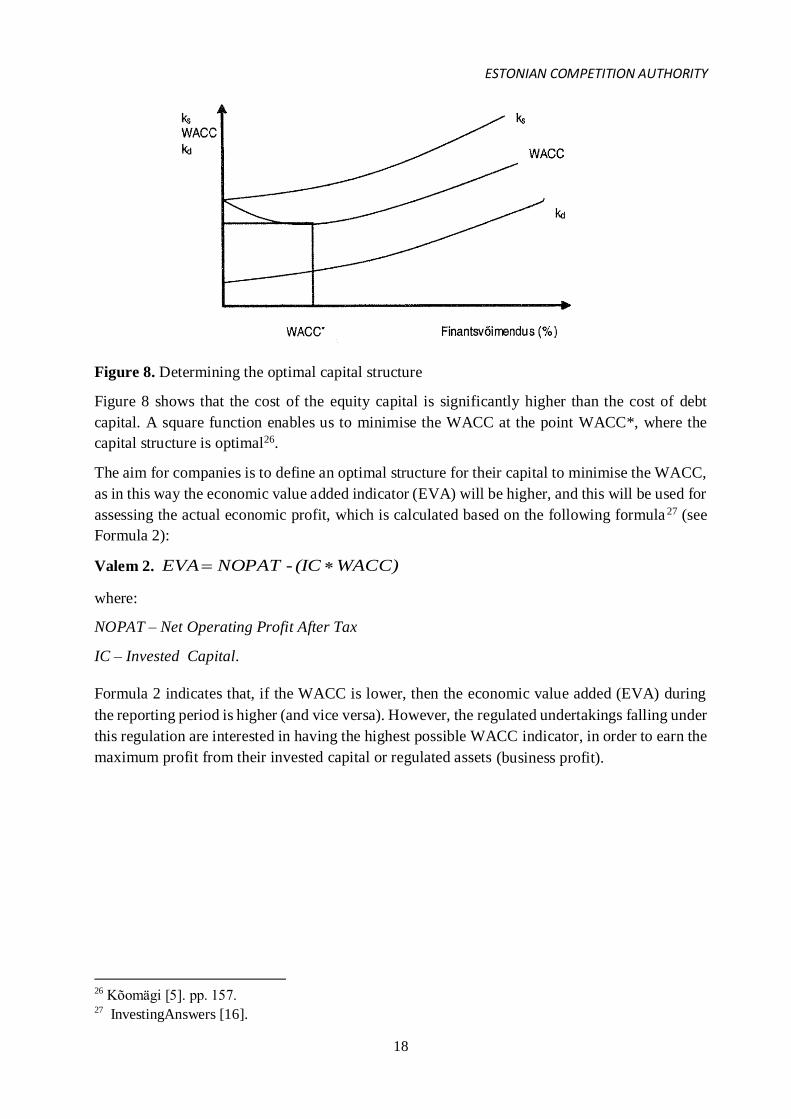
Figure 8. Determining the optimal capital structure
Figure 8 shows that the cost of the equity capital is significantly higher than the cost of debt
capital. A square function enables us to minimise the WACC at the point WACC*, where the
capital structure is optimal26.
The aim for companies is to define an optimal structure for their capital to minimise the WACC,
as in this way the economic value added indicator (EVA) will be higher, and this will be used for
assessing the actual economic profit, which is calculated based on the following formula 27 (see
Formula 2):
Valem 2.
where:
NOPAT – Net Operating Profit After Tax
IC – Invested Capital.
Formula 2 indicates that, if the WACC is lower, then the economic value added (EVA) during
the reporting period is higher (and vice versa). However, the regulated undertakings falling under
this regulation are interested in having the highest possible WACC indicator, in order to earn the
maximum profit from their invested capital or regulated assets (business profit).
26 Kõomägi [5]. pp. 157. 27 InvestingAnswers [16].
WACC)(IC - NOPAT EVA
ESTONIAN COMPETITION AUTHORITY
19
3.2 Proportions of long-term debt obligations included in the debt capital
based on the information presented in the annual reports
The samples used for the empirical study are the same as those described in Section 2.2.1. The
initial data for the study included the following information presented in the annual reports for
201428 by the companies active in the regulated sector:
a) Sizes of the long-term 29 loans and capital leases issued by commercial banks (in euros)
b) Sizes of the long-term loans issued by EIC (in euros)
c) Sizes of the long-term loans issued by integrated parties (in euros)
d) Size of the equity capital (in euros). Based on the accounting rules for water undertakings,
the equity capital for these regulated undertakings includes irrevocable aid (targeted
financing) as part of the financial means, which were issued for purchasing the fixed
assets required for providing the service. As the water undertakings received these
finances from the EIC and from local authorities in significant amounts, these amounts
have been excluded from the equity capital before calculating the proportions of debt
capital.
As a result of the calculations based on the initial data, the study defined the actual arithmetic
mean proportions for the loan commitments, which are presented in the following tables (see
Tables 5 and 6).
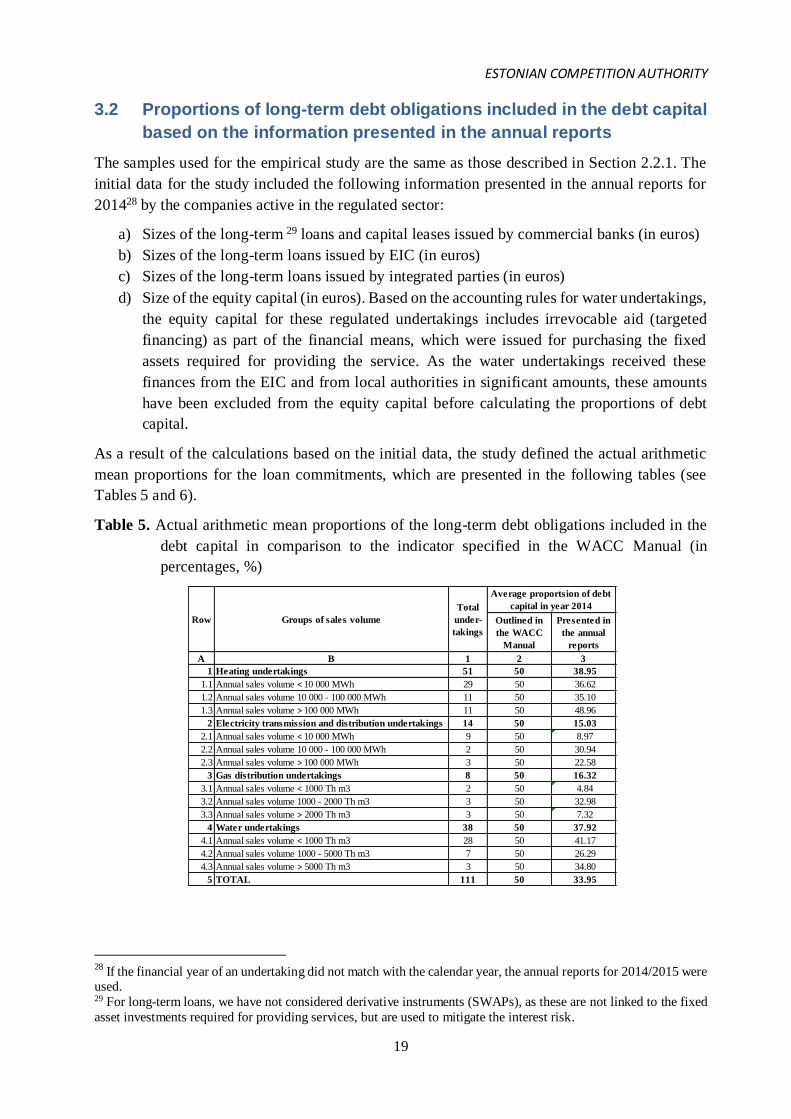
Table 5. Actual arithmetic mean proportions of the long-term debt obligations included in the
debt capital in comparison to the indicator specified in the WACC Manual (in
percentages, %)
28 If the financial year of an undertaking did not match with the calendar year, the annual reports for 2014/2015 were used. 29 For long-term loans, we have not considered derivative instruments (SWAPs), as these are not linked to the fixed
asset investments required for providing services, but are used to mitigate the interest risk.
Outlined in
the WACC
Manual
Presented in
the annual
reports
A B 1 2 3
1 Heating undertakings 51 50 38.95
1.1 Annual sales volume < 10 000 MWh 29 50 36.62
1.2 Annual sales volume 10 000 - 100 000 MWh 11 50 35.10
1.3 Annual sales volume > 100 000 MWh 11 50 48.96
2 Electricity transmission and distribution undertakings 14 50 15.03
2.1 Annual sales volume < 10 000 MWh 9 50 8.97
2.2 Annual sales volume 10 000 - 100 000 MWh 2 50 30.94
2.3 Annual sales volume > 100 000 MWh 3 50 22.58
3 Gas distribution undertakings 8 50 16.32
3.1 Annual sales volume < 1000 Th m3 2 50 4.84
3.2 Annual sales volume 1000 - 2000 Th m3 3 50 32.98
3.3 Annual sales volume > 2000 Th m3 3 50 7.32
4 Water undertakings 38 50 37.92
4.1 Annual sales volume < 1000 Th m3 28 50 41.17
4.2 Annual sales volume 1000 - 5000 Th m3 7 50 26.29
4.3 Annual sales volume > 5000 Th m3 3 50 34.80
5 TOTAL 111 50 33.95
Row Groups of sales volume
Total
under-
takings
Average proportsion of debt
capital in year 2014
ESTONIAN COMPETITION AUTHORITY
20
Table 5 shows that, in comparison to the proportions of debt capital outlined in the WACC
Manual (50%), the actual arithmetic mean proportions of the debt commitments are as follows:
1. Lower than 50% for all fields of activity.
2. Highest for the heat undertakings with an average of 38.95% (see Row 1, Column 3),
with the highest in sales volume group being over 100,000 MWh (48.96%; see Row 1.3,
Column 3).
3. An average of 37.92% for the water undertakings (see Row 4, Column 3) with the highest
in sales volume group being under 1000 thousand m3 (41.17%; see Row 4.1, Column 3).
4. An average of 15.03% for the electricity transmission and distribution network operators
(see Row 2, Column 3) with the highest in sales volume group being 10 000-100 000
MWh (30.94%; see Row 2.2, Column 3).
5. An average of 16.32% for the natural gas distribution network operators (see Row 3,
Column 3), with the highest in sales volume group being 1000-2000 thousand m3
(32.98%; see Row 3.2, Column 3). It should also be taken into consideration that the
consumers of this service have invested significant sums as joining fees for establishing
the gas lines, and therefore the loan commitments are smaller.
In total, the arithmetic mean of the debt capital share for the 111 regulated undertakings included
in the study was 33.95% (see Row 5, Column 3), which is lower by 16.05 percent than the average
outlined in the WACC Manual (50%).
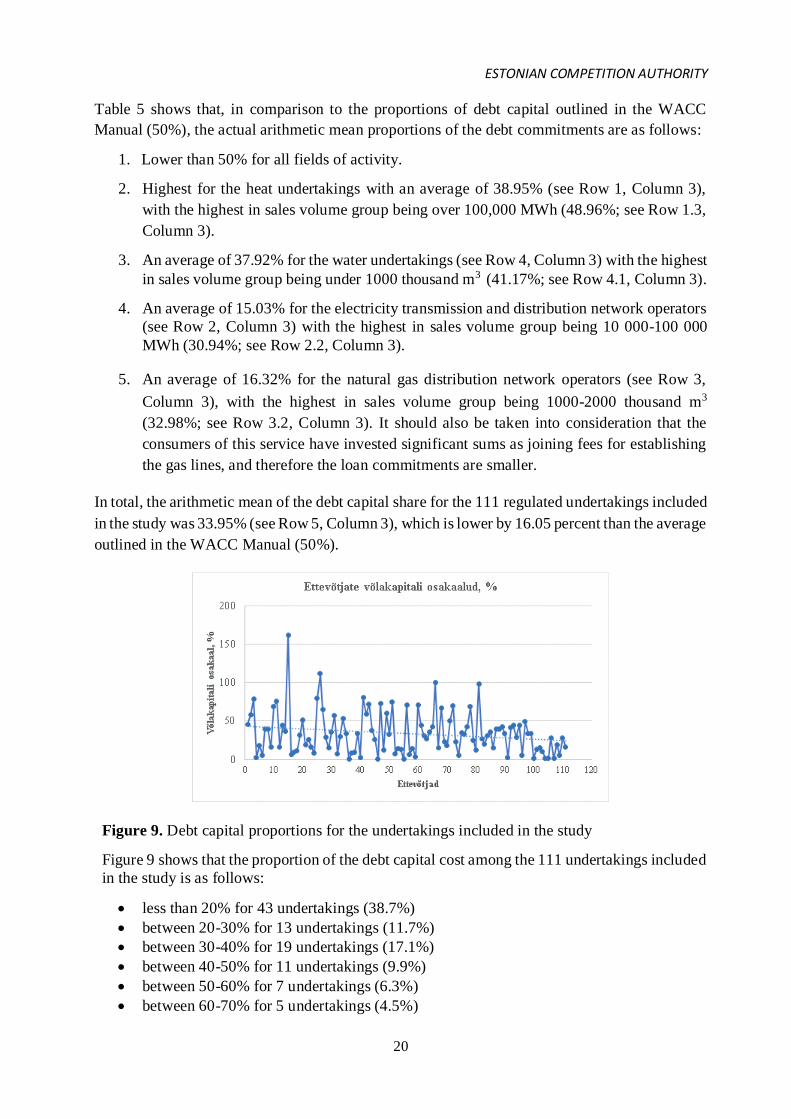
Figure 9. Debt capital proportions for the undertakings included in the study
Figure 9 shows that the proportion of the debt capital cost among the 111 undertakings included
in the study is as follows:
less than 20% for 43 undertakings (38.7%)
between 20-30% for 13 undertakings (11.7%)
between 30-40% for 19 undertakings (17.1%)
between 40-50% for 11 undertakings (9.9%)
between 50-60% for 7 undertakings (6.3%)
between 60-70% for 5 undertakings (4.5%)
ESTONIAN COMPETITION AUTHORITY
21
between 70-80% for 8 undertakings (7.2%)
over 80% for 5 undertakings (4.5%), 100% for 1 undertaking and more than 100% for 2
undertakings due to a negative equity capital.
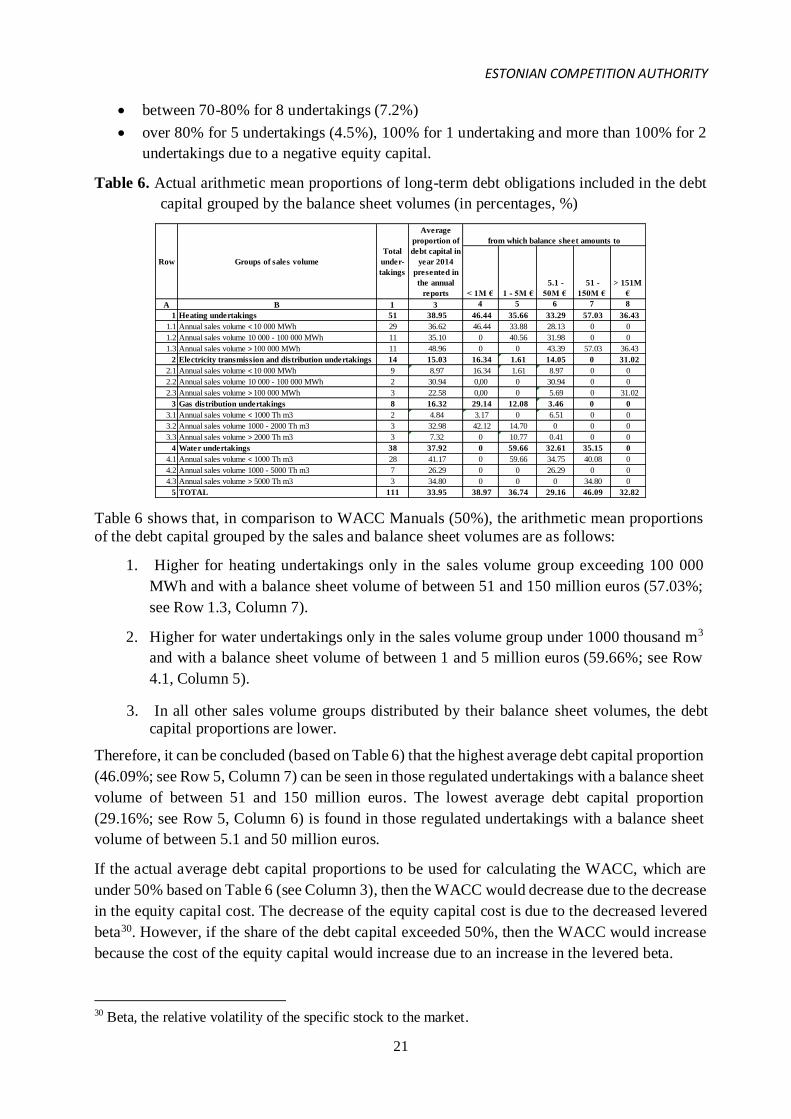
Table 6. Actual arithmetic mean proportions of long-term debt obligations included in the debt
capital grouped by the balance sheet volumes (in percentages, %)
Table 6 shows that, in comparison to WACC Manuals (50%), the arithmetic mean proportions
of the debt capital grouped by the sales and balance sheet volumes are as follows:
1. Higher for heating undertakings only in the sales volume group exceeding 100 000
MWh and with a balance sheet volume of between 51 and 150 million euros (57.03%;
see Row 1.3, Column 7).
2. Higher for water undertakings only in the sales volume group under 1000 thousand m3
and with a balance sheet volume of between 1 and 5 million euros (59.66%; see Row
4.1, Column 5).
3. In all other sales volume groups distributed by their balance sheet volumes, the debt capital proportions are lower.
Therefore, it can be concluded (based on Table 6) that the highest average debt capital proportion
(46.09%; see Row 5, Column 7) can be seen in those regulated undertakings with a balance sheet
volume of between 51 and 150 million euros. The lowest average debt capital proportion
(29.16%; see Row 5, Column 6) is found in those regulated undertakings with a balance sheet
volume of between 5.1 and 50 million euros.
If the actual average debt capital proportions to be used for calculating the WACC, which are
under 50% based on Table 6 (see Column 3), then the WACC would decrease due to the decrease
in the equity capital cost. The decrease of the equity capital cost is due to the decreased levered
beta30. However, if the share of the debt capital exceeded 50%, then the WACC would increase
because the cost of the equity capital would increase due to an increase in the levered beta.
30 Beta, the relative volatility of the specific stock to the market.
< 1M € 1 - 5M €
5.1 -
50M €
51 -
150M €
> 151M
€
A B 1 3 4 5 6 7 8
1 Heating undertakings 51 38.95 46.44 35.66 33.29 57.03 36.43
1.1 Annual sales volume < 10 000 MWh 29 36.62 46.44 33.88 28.13 0 0
1.2 Annual sales volume 10 000 - 100 000 MWh 11 35.10 0 40.56 31.98 0 0
1.3 Annual sales volume > 100 000 MWh 11 48.96 0 0 43.39 57.03 36.43
2 Electricity transmission and distribution undertakings 14 15.03 16.34 1.61 14.05 0 31.02
2.1 Annual sales volume < 10 000 MWh 9 8.97 16.34 1.61 8.97 0 0
2.2 Annual sales volume 10 000 - 100 000 MWh 2 30.94 0,00 0 30.94 0 0
2.3 Annual sales volume > 100 000 MWh 3 22.58 0,00 0 5.69 0 31.02
3 Gas distribution undertakings 8 16.32 29.14 12.08 3.46 0 0
3.1 Annual sales volume < 1000 Th m3 2 4.84 3.17 0 6.51 0 0
3.2 Annual sales volume 1000 - 2000 Th m3 3 32.98 42.12 14.70 0 0 0
3.3 Annual sales volume > 2000 Th m3 3 7.32 0 10.77 0.41 0 0
4 Water undertakings 38 37.92 0 59.66 32.61 35.15 0
4.1 Annual sales volume < 1000 Th m3 28 41.17 0 59.66 34.75 40.08 0
4.2 Annual sales volume 1000 - 5000 Th m3 7 26.29 0 0 26.29 0 0
4.3 Annual sales volume > 5000 Th m3 3 34.80 0 0 0 34.80 0
5 TOTAL 111 33.95 38.97 36.74 29.16 46.09 32.82
Row Groups of sales volume
Total
under-
takings
from which balance sheet amounts to
Average
proportion of
debt capital in
year 2014
presented in
the annual
reports
ESTONIAN COMPETITION AUTHORITY
22
4 Summary
The cost of the debt capital for regulated undertakings falling under the price regulations is
calculated based on the regulatory method, which includes the nominal risk-free rate and debt
risk premium31. Usually, the nominal risk-free rate is based on a long-term bonds issued by the
government. If a state does not have government bonds, then it is possible to use the bonds of
some other country plus the country risk premium and the debt risk premium of an undertaking.
This approach also used for calculating the debt capital cost for regulated undertakings under the
price regulations in Estonia. The Estonian government has not organised to issue the long-term
government bonds; and therefore, the average interest rate of German government 10- year bonds
is used as the risk-free rate, plus the country risk premium and the debt risk premium of an
undertaking.
The aim of this empirical study was to define the actual costs and proportions for including debt
capital in administratively regulated undertakings (such as heating undertakings, electricity
transmission and distribution network operators, natural gas distribution network operators and
water undertakings) as compared to the indicators defined in the regulatory WACC Manual of
the Estonian Competition Authority, and to assess whether the cost of debt capital is sufficient
for guaranteeing the servicing of bank loans.
The empirical study included regulated undertakings from the regulated sectors which can be
categorised as small, medium and large undertakings in Estonia. Their actual costs and their
proportions of debt capital were compared to the corresponding indicators defined in the
regulatory WACC Manual.
In total, 111 regulated undertakings from the regulated sector were included to the study,
including 51 heat undertakings, 14 electricity transmission and distribution network operators, 8
natural gas distribution network operators and 38 water undertakings.
Based on the results of the analysis outlined by the Estonian Competition Authority, it can be
concluded that the arithmetic mean of cost of the debt capital for the 111 regulated undertakings
according to the indicators present in the annual reports of 2014 was 2.64%, which is lower by
1.69% than the average regulatory indicator (4.33%) outlined in the WACC Manual for 2014.
The arithmetic means of costs of debt capital grouped by sectors are as follows:
2.95% for heat undertakings (compared to 4.35% in the WACC Manual of 2014),
including 3.05% for sales volumes of 10 000 MWh; 2.41% for sales volumes between 10
000 and 100 000 MWh; and 3.22% for sales volumes over 100,000;
2.96% for electricity transmission and distribution network operators (compared to an
average of 4.31% in the WACC Manual of 2014), including 2.84% for sales volumes of
under 10 000 MWh; 3.69% for sales volumes between 10 000 and 100 000 MWh; and
2.83% for sales volumes over 100,000 MWh;
4.52% for natural gas distribution network operators (compared to 4.34% in the WACC
Manual of 2014), including 1.87% for sales volumes of under 1000 thousand m3; 8.06%
31 Consisting of the Estonian country risk premium and the debt risk premium of an undertaking.
ESTONIAN COMPETITION AUTHORITY
23
for sales volumes between 1000 and 2000 thousand m3; and 2.74% for over sales volumes
2000 thousand m3;
1.71% for water undertakings (compared to 4.35% in the WACC Manual of 2014),
including 1.73% for sales volumes under 1000 thousand m3; 1.72% for sales volumes
between 1000 and 5000 thousand m3; and 1.43% for sales volumes over 5000 thousand
m3.
If the higher interest rates applied by the integrated parties are excluded, it can be concluded that
in Estonia, the debt capital costs of small enterprises do not differ significantly from the debt
capital costs of large enterprises.
Using the average interest rate of German 10-year bonds over five years increases the required
profitability margin in the case of decreasing interest rates, and decreases the margin for
increasing interest rates. However, considering the long service lifetime of the assets acquired by
the regulated undertakings falling under the price regulations, these inaccuracies are not
significant.32
Based on the results of the analysis outlined by the Estonian Competition Authority, it can be
concluded that the arithmetic mean of the proportions of debt capital for the 111 regulated
undertakings was 33.95%, which is lower by 16.05% than the proportion of debt capital outlined
in the WACC Manual (50%).
The arithmetic mean proportions of the debt capital grouped by sectors are as follows:
38.95% for heating undertakings
15.03% for electricity transmission and distribution network operators
16.32% for natural gas distribution network operators
37.92% for water undertakings
If the actual average debt capital proportions were to be used for calculating the WACC for the
aforementioned sectors, then the WACC would decrease due to the decreasing cost of the equity
capital, which is affected by a decrease in the levered beta.
Based on the results of this empirical study, it can be concluded that the sizes of the country risk
premium and the debt risk premium, used in the WACC Manual, are sufficient. Because the
resulting debt capital costs are generally (except for natural gas distribution network operators
due to the high interest rates applied by integrated parties) higher when compared to the actual
debt capital costs. However, the actual debt capital proportions are significantly lower when
compared to the proportions used in the WACC Manual.
It should also be considered that the administratively regulated undertakings are classified as low
risk businesses, with a guaranteed market and no sales risks for their services. In the case of a
decrease in the reasoned sales volume, the regulated undertakings can always apply for a service
price based on the lower sales volumes. In parallel to the aforementioned, and based on the cost-
orientation principle, it is reasonable to calculate the service prices by deriving them from the
32 Sander [1], pp. 7.
ESTONIAN COMPETITION AUTHORITY
24
principle that if the market-based initial data for the WACC decreases, then the size of the WACC
should also decrease (and vice versa).
ESTONIAN COMPETITION AUTHORITY
25
5 References
[1] P. Sander. (2014). Konkurentsiameti poolt väljatöötatud kaalutud keskmise kapitali hinna
(WACC) arvutamise metoodika analüüs [Online]. Available:
[http://www.konkurentsiamet.ee/index.php?id=18940].
[2] K. Andresson, Riskid Eesti ettevõtetes ja riskijuhtimine. Riskiarvestamine majandusliku
lisaväärtuse (EVA) leidmisel. Riskipreemia. Tartu: Ülikooli Kirjastus, 2002.
[3] R. Green and M. R. Pardina, Resetting Price Controls for Privatized Utilities. A Manual for Regulators. Washington, D. C.: World Bank, 1999.
[4] Eesti Pank. (2016). Estonian Economy and Monetary Policy 3/2016 [Online]. Available:
http://www.eestipank.ee/en/publication/estonian-economy-and-monetary-
policy/2016/estonian-economy-and-monetary-policy-32016 .
[5] M. Kõomägi, Ärirahandus. Tartu: Ülikooli Kirjastus, 2006.
[6] Council of European Energy Regulator (CEER), "Internal Report on Investment Conditions in European Countries," Ref. C14-IRB-23-03, Brussels, March 7, 2014.
[7] Council of European Energy Regulator (CEER), „Internal Report on Investment Conditions in European Countries," Ref. C13-IRB-16-03, Brussels, March 3, 2015.
[8] Council of European Energy Regulator (CEER), „Internal Report on Investment
Conditions in European Countries," Ref. C15-IRB-28-03, Brussels, March 14, 2016.
[9] A.Damodaran. (2016). Ratings, Spreads and Interest Coverage Ratios [Online]. Available: http://pages.stern.nyu.edu/~adamodar/ .
[10] Estonian Competition Authority. Manual for Calculation of Weighted Average Cost of
Capital ((WACC Manual), Juhend kaalutud keskmise kapitali hinna arvutamiseks).
Tallinn, 2014.
[11] Estonian Competition Authority. Manual for Calculation of Weighted Average Cost of
Capital ((WACC Manual), Juhend kaalutud keskmise kapitali hinna arvutamiseks). Tallinn, 2015.
[12] Estonian Competition Authority. Manual for Calculation of Weighted Average Cost of
Capital ((WACC Manual), Juhend kaalutud keskmise kapitali hinna arvutamiseks). Tallinn, 2016.
[13] T. Paas, Sissejuhatus ökonomeetriasse. Tartu: Ülikooli Kirjastus, 1995.
[14] Euribor-rates.eu. (2016). Euribor interest rates by 12 month, by 6 month, by 3 month
and by 1 month for 2014-2016 [Online]. Available: http://www.euribor-rates.eu/euribor-
2014.asp?i1=15&i2=15 , http://www.euribor-rates.eu/euribor-2015.asp?i1=15&i2=15 , http://www.euribor-rates.eu/euribor-2016.asp?i1=15&i2=1 .
[15] B. Pedell, Regulatory Risk and the Cost of Capital. Germany: Springer Berlin · Heidelberg 2006.
[16] InvestingAnswers. (2016). Economic value added (EVA) [Online]. Available:
http://www.investinganswers.com/financial- dictionary/financial-statement-analysis/economic-value-added-eva-2925.
ESTONIAN COMPETITION AUTHORITY
26
Annex
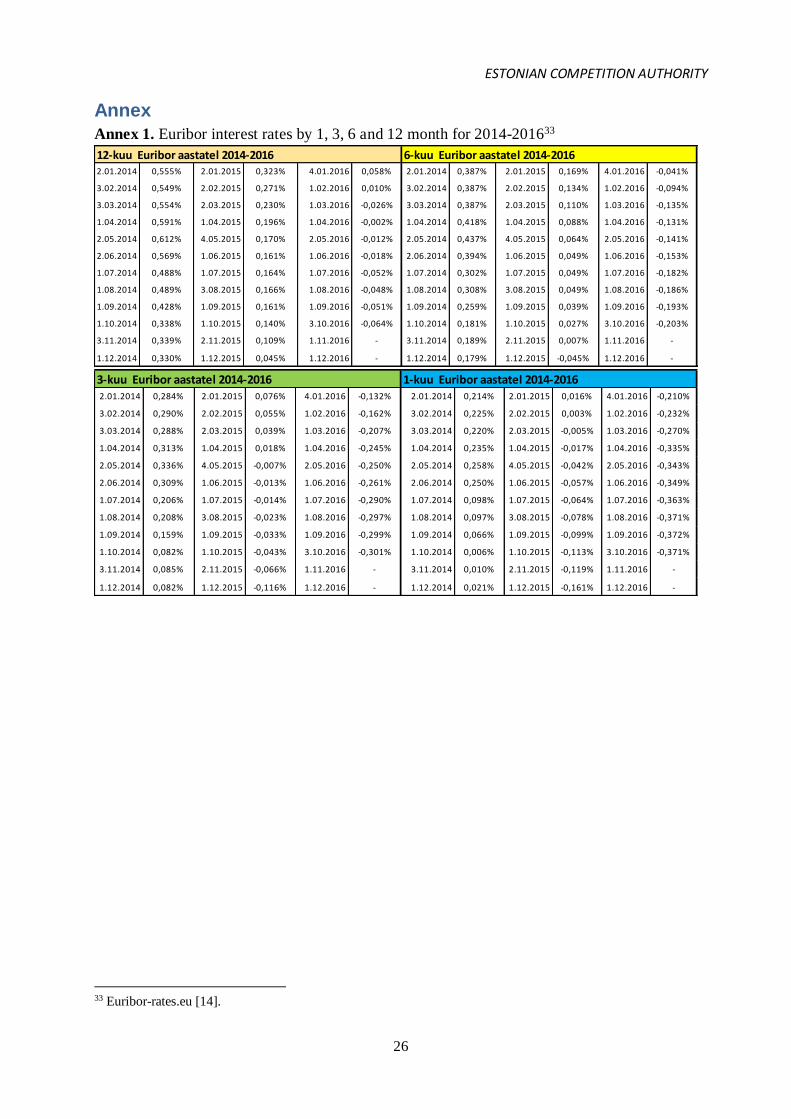
Annex 1. Euribor interest rates by 1, 3, 6 and 12 month for 2014-201633
33 Euribor-rates.eu [14].
12-kuu Euribor aastatel 2014-2016 6-kuu Euribor aastatel 2014-20162.01.2014 0,555% 2.01.2015 0,323% 4.01.2016 0,058% 2.01.2014 0,387% 2.01.2015 0,169% 4.01.2016 -0,041%
3.02.2014 0,549% 2.02.2015 0,271% 1.02.2016 0,010% 3.02.2014 0,387% 2.02.2015 0,134% 1.02.2016 -0,094%
3.03.2014 0,554% 2.03.2015 0,230% 1.03.2016 -0,026% 3.03.2014 0,387% 2.03.2015 0,110% 1.03.2016 -0,135%
1.04.2014 0,591% 1.04.2015 0,196% 1.04.2016 -0,002% 1.04.2014 0,418% 1.04.2015 0,088% 1.04.2016 -0,131%
2.05.2014 0,612% 4.05.2015 0,170% 2.05.2016 -0,012% 2.05.2014 0,437% 4.05.2015 0,064% 2.05.2016 -0,141%
2.06.2014 0,569% 1.06.2015 0,161% 1.06.2016 -0,018% 2.06.2014 0,394% 1.06.2015 0,049% 1.06.2016 -0,153%
1.07.2014 0,488% 1.07.2015 0,164% 1.07.2016 -0,052% 1.07.2014 0,302% 1.07.2015 0,049% 1.07.2016 -0,182%
1.08.2014 0,489% 3.08.2015 0,166% 1.08.2016 -0,048% 1.08.2014 0,308% 3.08.2015 0,049% 1.08.2016 -0,186%
1.09.2014 0,428% 1.09.2015 0,161% 1.09.2016 -0,051% 1.09.2014 0,259% 1.09.2015 0,039% 1.09.2016 -0,193%
1.10.2014 0,338% 1.10.2015 0,140% 3.10.2016 -0,064% 1.10.2014 0,181% 1.10.2015 0,027% 3.10.2016 -0,203%
3.11.2014 0,339% 2.11.2015 0,109% 1.11.2016 - 3.11.2014 0,189% 2.11.2015 0,007% 1.11.2016 -
1.12.2014 0,330% 1.12.2015 0,045% 1.12.2016 - 1.12.2014 0,179% 1.12.2015 -0,045% 1.12.2016 -
3-kuu Euribor aastatel 2014-2016 1-kuu Euribor aastatel 2014-20162.01.2014 0,284% 2.01.2015 0,076% 4.01.2016 -0,132% 2.01.2014 0,214% 2.01.2015 0,016% 4.01.2016 -0,210%
3.02.2014 0,290% 2.02.2015 0,055% 1.02.2016 -0,162% 3.02.2014 0,225% 2.02.2015 0,003% 1.02.2016 -0,232%
3.03.2014 0,288% 2.03.2015 0,039% 1.03.2016 -0,207% 3.03.2014 0,220% 2.03.2015 -0,005% 1.03.2016 -0,270%
1.04.2014 0,313% 1.04.2015 0,018% 1.04.2016 -0,245% 1.04.2014 0,235% 1.04.2015 -0,017% 1.04.2016 -0,335%
2.05.2014 0,336% 4.05.2015 -0,007% 2.05.2016 -0,250% 2.05.2014 0,258% 4.05.2015 -0,042% 2.05.2016 -0,343%
2.06.2014 0,309% 1.06.2015 -0,013% 1.06.2016 -0,261% 2.06.2014 0,250% 1.06.2015 -0,057% 1.06.2016 -0,349%
1.07.2014 0,206% 1.07.2015 -0,014% 1.07.2016 -0,290% 1.07.2014 0,098% 1.07.2015 -0,064% 1.07.2016 -0,363%
1.08.2014 0,208% 3.08.2015 -0,023% 1.08.2016 -0,297% 1.08.2014 0,097% 3.08.2015 -0,078% 1.08.2016 -0,371%
1.09.2014 0,159% 1.09.2015 -0,033% 1.09.2016 -0,299% 1.09.2014 0,066% 1.09.2015 -0,099% 1.09.2016 -0,372%
1.10.2014 0,082% 1.10.2015 -0,043% 3.10.2016 -0,301% 1.10.2014 0,006% 1.10.2015 -0,113% 3.10.2016 -0,371%
3.11.2014 0,085% 2.11.2015 -0,066% 1.11.2016 - 3.11.2014 0,010% 2.11.2015 -0,119% 1.11.2016 -
1.12.2014 0,082% 1.12.2015 -0,116% 1.12.2016 - 1.12.2014 0,021% 1.12.2015 -0,161% 1.12.2016 -
ESTONIAN COMPETITION AUTHORITY
27
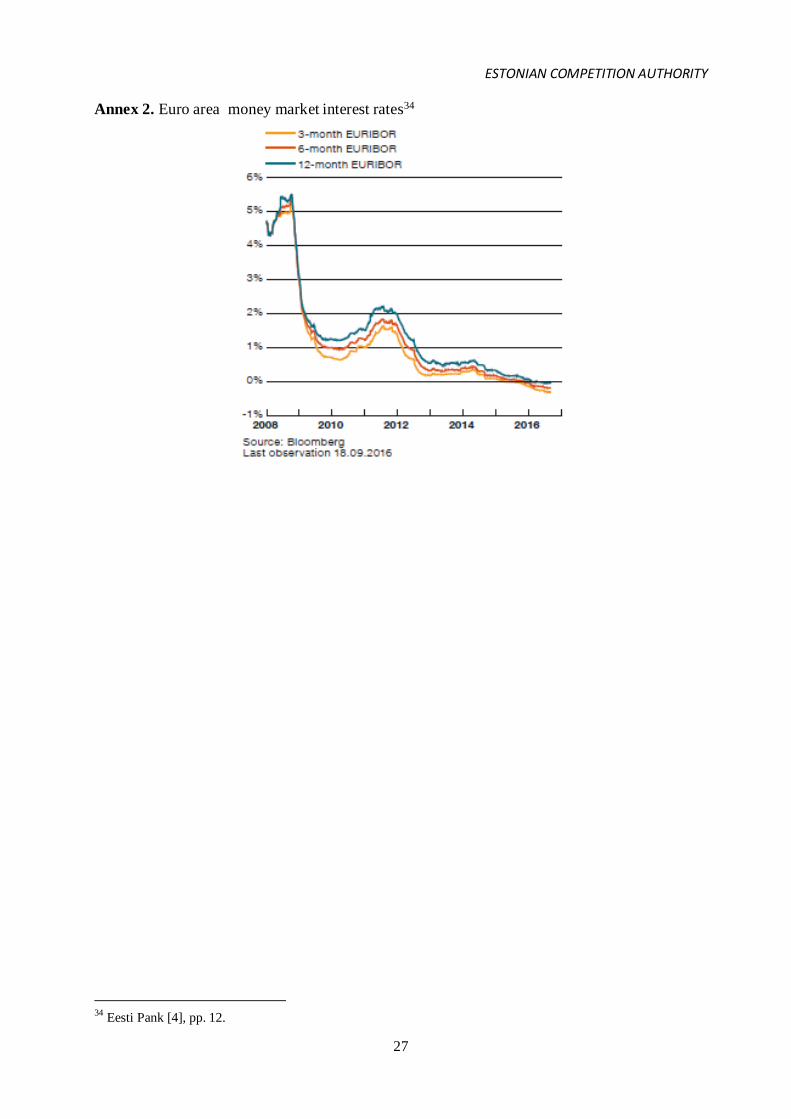
Annex 2. Euro area money market interest rates34
34 Eesti Pank [4], pp. 12.