Embed Size (px)
Citation preview


ERD TECHNICAL NOTE NO. 15
DEBT MANAGEMENT ANALYSIS
OF NEPAL’S PUBLIC DEBT
SUNGSUP RA, CHANGYONG RHEE, AND JOON-HO HAHM
December 2005
Sungsup Ra is Senior Economist in the South Asian Department, Asian Development Bank; Changyong Rhee isProfessor in the Department of Economics, Seoul National University; and Joon-Ho Hahm is Associate Professorat the Graduate School of International Studies, Yonsei University, Seoul, Republic of Korea.

Asian Development Bank6 ADB Avenue, Mandaluyong City1550 Metro Manila, Philippineswww.adb.org/economics
©2005 by Asian Development BankDecember 2005ISSN 1655-5236
The views expressed in this paperare those of the author(s) and do notnecessarily reflect the views or policiesof the Asian Development Bank.

FOREWORD
The ERD Technical Note Series deals with conceptual, analytical, ormethodological issues relating to project/program economic analysis orstatistical analysis. Papers in the Series are meant to enhance analytical rigorand quality in project/program preparation and economic evaluation, andimprove statistical data and development indicators. ERD Technical Notesare prepared mainly, but not exclusively, by staff of the Economics andResearch Department, their consultants, or resource persons primarily forinternal use, but may be made available to interested external parties.

CONTENTS
Abstract vii
I. Introduction 1
II. Outline of Methodology 3
III. Efficient Frontier and Benchmark Portfolio for Domestic Government Debt 4
A. The Data: Basic Profiles of Government Debt Portfolios in Nepal 4B. Obtaining the Efficient Portfolio Set Conditional
upon Existing Domestic Debt Structure 6C. Benchmark Portfolios and Optimal Borrowing Strategies 13
IV. Efficient Frontier and Benchmark Portfoliofor External Government Debt 13
A. The Data: Basic Profiles of External Debt Portfolios in Nepal 14B. Derivation of Efficient Portfolio Set Conditional
upon Existing External Debt Structure 14C. Benchmark Portfolios and Optimal Borrowing Strategies 17
V. Concluding Remarks 19
References 20
ABSTRACT
This paper estimates an optimal target portfolio of sovereign debt forNepal that minimizes long-term financing cost. In the analysis, a practicalframework is applied, which is built upon the traditional mean–varianceefficient frontier approach and simultaneously employs a relatively newconcept of cost-at-risk (CaR). The framework is flexible enough to incorporateother factors such as liquidity risk. Simulation results show that the Nepalieconomy needs to increase longer-term domestic borrowing instruments, andthat the maturity structure of domestic bonds should be simplified. Thesimulation also suggests an optimal currency composition of external debtsin Nepal.

11111ERD ERD ERD ERD ERD TTTTTECHNICALECHNICALECHNICALECHNICALECHNICAL N N N N NOTEOTEOTEOTEOTE S S S S SERIESERIESERIESERIESERIES N N N N NOOOOO..... 1515151515
I. INTRODUCTION
High levels of sovereign debt are a common feature of modern economies. With the increasedsophistication and liberalization of financial markets, this has made the problem of debt managementone of the most important issues in economic policy. In this paper, we take up the question of whatis a desirable scheme for Nepal’s sovereign debt management.
The optimal volume and sustainability of sovereign debt are important issues with regard tosovereign debt management.1 However, sustainability of sovereign debt may be more important thanits management, particularly for an underdeveloped economy with a relatively large burden of sovereigndebt such as Nepal. It should be also noted that effective sovereign debt management increasessustainability.
The Nepali economy relies heavily on short-term domestic debt and highly concessional foreignaid loans of long maturity. More than 60% of domestic debt has maturities of one year or shorter,and less than 9% of domestic debt has maturities of 10 years or longer. The bulk of the cheap foreignloans have maturities longer than 30 years and account for more than 57% of the financing of thebudget deficits in Nepal. Concessional foreign loans have been the best source of financing, but willnot be available forever. Therefore, the problem of debt management is increasingly important forthe Nepali economy.
Beyond the problem of debt sustainability, why does sovereign debt management matter? First,sovereign debt management has important effects on the real economy.2 The financial decisions ofa sovereign borrower may have an impact on the expected returns not only on government securitiesbut also on private assets, especially if the economy is large and/or restrictions exist on capital mobility.Changes in the relative supply of debt instruments may affect risk premia and, in particular, theexpected return that private investors require to hold equities and private debt. Through the financialmarket, government debt decisions may influence the cost of funds and, thus, total real investment.Second, debt management may redistribute risks. With incomplete markets for private financialassets, the introduction of a new government security instrument would lead to a reallocation ofrisks and would possibly open up new opportunities for individuals to share risk. Finally, debtmanagement matters because it affects taxation and changes the distribution of taxes across futurecontingencies. Taxes distort the investment and labor choices of private agents. High and variabletax rates reduce people’s incentives to work and produce.
1 For sustainability issues, see Cohen (1991) and Eaton (1992), among others.2 Only under restrictive assumptions about private agents’ altruism and rationality, completeness and efficiency of financial
markets, and type of taxes, does the sovereign debt management not matter. See Missale (1999, chapter 2).

22222 DDDDDECEMBERECEMBERECEMBERECEMBERECEMBER 20052005200520052005
DDDDDEBTEBTEBTEBTEBT M M M M MANAGEMENTANAGEMENTANAGEMENTANAGEMENTANAGEMENT AAAAANALNALNALNALNALYSISYSISYSISYSISYSIS
OFOFOFOFOF NNNNNEPEPEPEPEPALALALALAL’’’’’SSSSS P P P P PUBLICUBLICUBLICUBLICUBLIC D D D D DEBTEBTEBTEBTEBT
SSSSSUUUUUNGSUPNGSUPNGSUPNGSUPNGSUP R R R R RAAAAA,,,,, C C C C CHANGHANGHANGHANGHANG YYYYYONGONGONGONGONG R R R R RHEEHEEHEEHEEHEE,,,,, ANDANDANDANDAND J J J J JOONOONOONOONOON-H-H-H-H-HOOOOO H H H H HAHMAHMAHMAHMAHM
The ultimate objective of sovereign debt management is to minimize the long-term cost of debtgiven the trade-off between expected debt service costs and risks associated with various borrowingstrategies to finance the borrowing requirements of the government. The problem of debt managementinterpreted in this way is a common issue for most economies.3 In this study, the problem is to findan optimal target debt portfolio that minimizes the long-term cost of debt given the trade-off betweenexpected debt service costs.
In the analysis, we apply a practical analytical framework studied in Hahm and Kim (2003)to Nepali data and identify the target portfolio structure for managing sovereign debt. The analyticalframework is built upon the traditional mean–variance efficient frontier approach and employsa relatively new concept of cost-at-risk (CaR) to identify a target benchmark portfolio. Whilethe efficient frontier and CaR measures are estimated from the perspective of debt servicecost risk, the benchmarking framework is flexible enough to incorporate other factors suchas liquidity risks and counter-party asset structures as additional criteria in identifying thebenchmark portfolio.
Sovereign debt generally consists of domestic and foreign debts. Thus, one has to considerdomestic and foreign debts together in analyzing issues of sovereign debt. In the case of Nepal, however,we analyze portfolios of domestic and foreign debts separately due to the limited availability of data.
In analyzing portfolios of domestic debt, we focus on the maturity structure of the debt andseek answers to the following questions: First, how can we characterize the trade-off between expecteddebt service cost and risk given the current structure of the debt and borrowing requirements inthe future? Second, what is the optimal debt maturity structure given the cost and risk trade-offidentified in the first step? Finally, what is the best policy for debt issuance to obtain the benchmarkportfolio structure?
Reviewing the basic profiles of the Nepali central government domestic debts, we see twonoticeable features: First, short-term bonds with maturities of less than 5 years constitute about87% of the whole portfolio. Longer-term debt is usually associated with lower risk (volatility) buthas a higher average cost of borrowing. A shorter-term debt is associated with a lower average costof borrowing but with higher risk. The government needs to balance the cost and risk of borrowingby choosing an appropriate portfolio of borrowing. Second, there are various durations/maturitiesof bonds and the amount of bonds in each duration is small, implying that the market is fragmented,thus liquidity problems may arise. Our simulation analysis shows that the Nepali economy needsto move to longer-term domestic borrowing and that the issue profile of domestic bonds should besimplified.
On the other hand, in analyzing portfolios of foreign debt, we focus on the currency compositionof the debt and follow the same procedure as for analyzing portfolios of domestic debt. Due to limitedavailability of data we could not consider all the currencies. Also, for many currencies the loansare in the form of a multi-currency loan, for which we do not have enough data. In this report weconsider only four currencies: Saudi riyal (SAR), Kuwaiti dinar (KWD), United States dollar (USD),and Special Drawing Rights (SDR) relative to Nepali rupee (NRS).
3 See Carracedo and Dattels (1997) and Cassard and Folkerts-Landau (1997), among others, for surveys of the objectivesand practices of sovereign debt management in various countries.

33333ERD ERD ERD ERD ERD TTTTTECHNICALECHNICALECHNICALECHNICALECHNICAL N N N N NOTEOTEOTEOTEOTE S S S S SERIESERIESERIESERIESERIES N N N N NOOOOO..... 1515151515
SSSSSECTIONECTIONECTIONECTIONECTION II II II II IIOOOOOUTLINEUTLINEUTLINEUTLINEUTLINE OFOFOFOFOF M M M M METHODOLOGYETHODOLOGYETHODOLOGYETHODOLOGYETHODOLOGY
From our simulation study we obtained an optimal currency composition of 10% SAR,10% KWD, 80% USD, and 0% SDR. This result is consistent with statistical features of eachof the four currencies under study. That is, comparing the mean and variability of the borrowingcosts, we found that USD dominates in both mean and variance of the cost; SAR is betterthan KWD in the mean cost, but KWD is better than SAR in variability; and SDR is inferiorto all the other three in both mean and variance.
Our discussion proceeds as follows: In Section II, we explain the methodology of ouranalysis. Sections III and IV apply the method explained in Section II to Nepali sovereigndebt portfolios. For both domestic and external sovereign debt portfolios we identify targetdebt structures and derive optimal borrowing mixes. Section V concludes our analysis.
II. OUTLINE OF METHODOLOGY
We adopt the approach of Hahm and Kim (2003) for our analysis,4 i.e., we consider the problemof determining the sovereign debt portfolio as a portfolio optimization problem. As noted byClaessens (1992), the problem can be represented as a variant of the following stochasticdynamic programming:
Minimize E{f(s ; d)}, where d is in D (1)
where d stands for a sequence of decisions to be made, and D is the set of all acceptable decisions;E is an expectation operator and the function f is an objective function that serves as decision criteria.s provides a description of possible future environments when the consequences of the decisions dare evaluated. In a dynamic discrete time setting, where time 0 and 1 represent today and nextperiod and so on, the above problem can be restated as follows:
Find d = (d0, d1(s1), d2(s1,s2), …) (2)
such that d0 in D0,
d1(s1) in D1(s1; d0),
d2(s1,s2) in D2(s1,s2; d0,d1(s1)), ………..
which minimizes E{f(s1,s2,…; d0,d1,……)}
In the context of sovereign debt management, d may correspond to decisions on thematurity structure of the government debt portfolio or on the currency composition in thecase of external sovereign debt. The vector of random variables s may correspond to the termstructure of interest rates, exchange rates, GDP growth rates, and so forth. The choice setD represents the range of possible decisions and reflects policy constraints such as the minimumexposure to a specific currency or the maximum percentage of refinancing. The subsequentchoice set D in the future depends upon the realizations of random variables as well as previousdecisions. For instance, the debt portfolio structure to be realized 5 years from now (2006–
4 Hahm and Kim (2003) provide an excellent exposition of the method that we employ in this paper. This section islargely based on Hahm and Kim (2003).
44444 DDDDDECEMBERECEMBERECEMBERECEMBERECEMBER 20052005200520052005
DDDDDEBTEBTEBTEBTEBT M M M M MANAGEMENTANAGEMENTANAGEMENTANAGEMENTANAGEMENT AAAAANALNALNALNALNALYSISYSISYSISYSISYSIS
OFOFOFOFOF NNNNNEPEPEPEPEPALALALALAL’’’’’SSSSS P P P P PUBLICUBLICUBLICUBLICUBLIC D D D D DEBTEBTEBTEBTEBT
SSSSSUUUUUNGSUPNGSUPNGSUPNGSUPNGSUP R R R R RAAAAA,,,,, C C C C CHANGHANGHANGHANGHANG YYYYYONGONGONGONGONG R R R R RHEEHEEHEEHEEHEE,,,,, ANDANDANDANDAND J J J J JOONOONOONOONOON-H-H-H-H-HOOOOO H H H H HAHMAHMAHMAHMAHM
2010) will depend upon realizations of term structures, fiscal requirements, refinancing policiesof maturing debts, and interim borrowing mixes to finance borrowing requirements over thenext 5 years. The control function f can be specified in various forms and necessarily involvesan attribute of the debt portfolio depending upon which risk is to be more actively managed.For instance, nominal values, market values, or debt service costs of the government debtcan serve as arguments of the control function depending upon the detailed objectives ofgovernment debt management. The control function usually involves a target risk measureand is often represented in the form of a penalty function. For more details, see Hahm and Kim(2003).
The objective and horizon of government debt management differ from those of privateinstitutions. For this reason, the types of risks actively managed at the sovereign level also differfrom those of the private sector. Since most governments tend to hold debts up to maturity and donot frequently liquidate and reconstruct debt portfolios, sovereign debt managers are more concernedabout debt service costs, which directly affect government budget expenses, rather than day-to-dayfluctuations in the market value of debt portfolios. Hence, in the present paper, we assume that thedebt service cost risk is a primary concern for the government in managing sovereign debts.
Also, as noted in Hahm and Kim (2003), the debt service cost of a debt portfolio in any givenyear depends upon the interest rates and debt issuance up to that year. Given the government borrowingrequirements over the debt management horizon and the description of stochastic processes of randomvariables during the horizon, we can solve the above problem to identify an optimal debt strategy.More specifically, once the government’s fiscal requirement over the debt management horizon isgiven, the first step in benchmarking is to identify the expected cost–risk trade-off over variousborrowing strategies satisfying the government financing requirements. This step corresponds toidentifying the decision choice sets D1, D2… into the future. An efficient portfolio set at theend of the debt management horizon is derived as a summary of the expected cost-risk trade-off based upon full-blown term structure simulations over the horizon. In the next step, weemploy a control function f, and based upon exogenously given control targets, an optimalbenchmark portfolio is identified from the efficient portfolio set.
III. EFFICIENT FRONTIER AND BENCHMARK PORTFOLIOFOR DOMESTIC GOVERNMENT DEBT
A. The Data: Basic Profiles of Government Debt Portfolios in Nepal
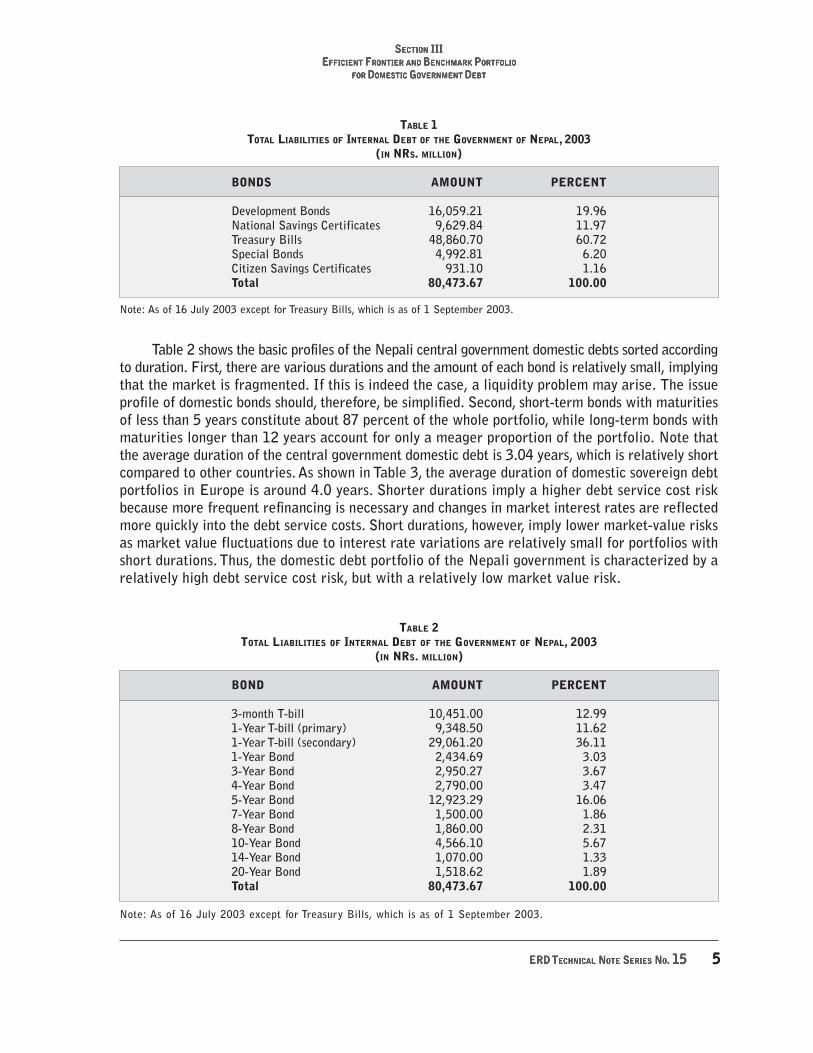
Table 1 summarizes the basic profiles of domestic debt of the central government in Nepalby category as of 16 July 2003. The domestic debt portfolio consists of treasury bills,development bonds, national saving certificates, special bonds, and citizen savings certificates.Treasury bills account for the largest share of the domestic debt portfolio, and developmentbonds and national savings certificates also represent relatively large shares.
55555ERD ERD ERD ERD ERD TTTTTECHNICALECHNICALECHNICALECHNICALECHNICAL N N N N NOTEOTEOTEOTEOTE S S S S SERIESERIESERIESERIESERIES N N N N NOOOOO..... 1515151515
SSSSSECTIONECTIONECTIONECTIONECTION III III III III IIIEEEEEFFICIENTFFICIENTFFICIENTFFICIENTFFICIENT F F F F FRONTIERRONTIERRONTIERRONTIERRONTIER ANDANDANDANDAND B B B B BENCHMARKENCHMARKENCHMARKENCHMARKENCHMARK P P P P PORTFOLIOORTFOLIOORTFOLIOORTFOLIOORTFOLIO
FORFORFORFORFOR D D D D DOMESTICOMESTICOMESTICOMESTICOMESTIC G G G G GOVERNMENTOVERNMENTOVERNMENTOVERNMENTOVERNMENT D D D D DEBTEBTEBTEBTEBT
TABLE 1TOTAL LIABILITIES OF INTERNAL DEBT OF THE GOVERNMENT OF NEPAL, 2003
(IN NRS. MILLION)
BONDS AMOUNT PERCENT
Development Bonds 16,059.21 19.96National Savings Certificates 9,629.84 11.97Treasury Bills 48,860.70 60.72Special Bonds 4,992.81 6.20Citizen Savings Certificates 931.10 1.16Total 80,473.67 100.00
Note: As of 16 July 2003 except for Treasury Bills, which is as of 1 September 2003.
Table 2 shows the basic profiles of the Nepali central government domestic debts sorted accordingto duration. First, there are various durations and the amount of each bond is relatively small, implyingthat the market is fragmented. If this is indeed the case, a liquidity problem may arise. The issueprofile of domestic bonds should, therefore, be simplified. Second, short-term bonds with maturitiesof less than 5 years constitute about 87 percent of the whole portfolio, while long-term bonds withmaturities longer than 12 years account for only a meager proportion of the portfolio. Note thatthe average duration of the central government domestic debt is 3.04 years, which is relatively shortcompared to other countries. As shown in Table 3, the average duration of domestic sovereign debtportfolios in Europe is around 4.0 years. Shorter durations imply a higher debt service cost riskbecause more frequent refinancing is necessary and changes in market interest rates are reflectedmore quickly into the debt service costs. Short durations, however, imply lower market-value risksas market value fluctuations due to interest rate variations are relatively small for portfolios withshort durations. Thus, the domestic debt portfolio of the Nepali government is characterized by arelatively high debt service cost risk, but with a relatively low market value risk.
TABLE 2TOTAL LIABILITIES OF INTERNAL DEBT OF THE GOVERNMENT OF NEPAL, 2003
(IN NRS. MILLION)
BOND AMOUNT PERCENT
3-month T-bill 10,451.00 12.991-Year T-bill (primary) 9,348.50 11.621-Year T-bill (secondary) 29,061.20 36.111-Year Bond 2,434.69 3.033-Year Bond 2,950.27 3.674-Year Bond 2,790.00 3.475-Year Bond 12,923.29 16.067-Year Bond 1,500.00 1.868-Year Bond 1,860.00 2.3110-Year Bond 4,566.10 5.6714-Year Bond 1,070.00 1.3320-Year Bond 1,518.62 1.89Total 80,473.67 100.00
Note: As of 16 July 2003 except for Treasury Bills, which is as of 1 September 2003.

66666 DDDDDECEMBERECEMBERECEMBERECEMBERECEMBER 20052005200520052005
DDDDDEBTEBTEBTEBTEBT M M M M MANAGEMENTANAGEMENTANAGEMENTANAGEMENTANAGEMENT AAAAANALNALNALNALNALYSISYSISYSISYSISYSIS
OFOFOFOFOF NNNNNEPEPEPEPEPALALALALAL’’’’’SSSSS P P P P PUBLICUBLICUBLICUBLICUBLIC D D D D DEBTEBTEBTEBTEBT
SSSSSUUUUUNGSUPNGSUPNGSUPNGSUPNGSUP R R R R RAAAAA,,,,, C C C C CHANGHANGHANGHANGHANG YYYYYONGONGONGONGONG R R R R RHEEHEEHEEHEEHEE,,,,, ANDANDANDANDAND J J J J JOONOONOONOONOON-H-H-H-H-HOOOOO H H H H HAHMAHMAHMAHMAHM
5 This is just for convenience of indexation in the analysis. As the analysis is based on the accrual data up to 16 July2003, we are in the early part of 3Q2003. Therefore, for readers who are keen at counting dates, the actual periodsin the following analysis should be half a year back.
TABLE 3DURATION OF SOVEREIGN DEBT PORTFOLIOS, 1999–2000
DOMESTIC EXTERNALDEBT DEBT
COUNTRY PORTFOLIO PORTFOLIO
Austria 4.5 _Belgium 4.2 2.2Denmark 4.1 2Finland 3.9 _Italy 2.5 _Portugal 3 3.1Spain 3.2 _United Kingdom 6.8 _Average 4.0 2.4
Sources: World Bank (1999) and Hahm and Kim (2003).
Below, we conduct empirical analysis to obtain a set of efficient cost-risk trade-offs and toidentify the optimal benchmark portfolio. The analysis is based on actual Nepali government debtdata up to 16 July 2003. We suppose that we are at the end of period 4Q2003 (t=4Q2003),and the plan period or debt management horizon is assumed to be 9 years, 1Q2004–4Q2012(N=36).5 The decision interval or time unit of the analysis is assumed to be one quarter because3-month treasury bills are considered.
B. Obtaining the Efficient Portfolio Set Conditional upon Existing DomesticDebt Structure
The set of efficient portfolios for domestic government debt at the end of 4Q2012 isobtained from the set of expected cost–risk trade-offs. We obtain the efficient frontier in twodifferent cases. In Case 1, the instruments considered are the 3-month and 1-year treasurybills, and 3- and 5-year bonds. In Case 2, they are the 3-month and 1-year treasury bills; and3-, 5-, and 10-year bonds. There are bonds of 11 different maturities in our data set, but tosimplify our analysis, we assume that there are four and five different maturities, respectively,in Case 1 and in Case 2. To further simplify the analysis, we assume that both the principalamounts of maturing bonds and the interest payments on all existing bonds are refinancedby the same types of bonds.
We first need to get the values of the primary budget deficit in the period underconsideration. They are obtained based on a large macro model of the Nepali economy andare presented in Table 4.

77777ERD ERD ERD ERD ERD TTTTTECHNICALECHNICALECHNICALECHNICALECHNICAL N N N N NOTEOTEOTEOTEOTE S S S S SERIESERIESERIESERIESERIES N N N N NOOOOO..... 1515151515
TABLE 4PRIMARY BUDGET DEFICIT UNDER BASIC SCENARIO
(IN NRS MILLION)
2004 2005 2006 2007 2008 2009 2010 2011 2012
23,181 26,195 30,079 34,757 40,314 46,810 54,764 64,548 76,646
We obtain values for the quarterly primary budget deficits over the debt management horizon(N=36) by dividing each annual value by four. We multiply a certain fraction θ =0.4218 to the amountof the budget deficit in a period to get the amount of domestic financing in the period. The fractionθ =0.4218 is the average ratio of the amount of domestic financing to the total budget deficit ineach year in the period 1975–2002. We denote the values of quarterly primary budget deficitsby {Pt+1, Pt+2, …, Pt+36}.
We consider Case 1 below. The same analysis applies to Case 2. In Case 1, the borrowing strategyof the government is a combination of borrowings of four maturities: 3-month and 1-year treasurybills, and 3- and 5-year bonds. We denote it by a vector of weights, w=(w1/4, w1, w3, w5), which sumto unity, where wj is the weight of the j-year bond. We assume that each borrowing strategy is time-invariant, implying that the same weights are maintained throughout the debt management horizon.
We denote the existing government debt portfolio at the end of period t by a vector
Zt t1/4
t1
t-11
t-21
t-31
t3
t-13
t-23
t-113= ( , , , , , , , , , ,z z z z z z z z z z tt
5t-15
t-25
t-195, z z z, , , ) ,
where a typical element zt-ij is the balance of the j-year bond issued in the period t-i. The elements
in Zt are determined by the Nepali central government’s domestic debt portfolio as of July 2003.
Now, for a given borrowing strategy w, the government’s total financing requirement for the next
year, Bt+1 , can be represented as the sum of primary budget deficit Pt+1 and the refinancing amount
αYt+1 , where α ∈[ , ]0 1 is the fraction of refinancing and Yt +1 is the sum of principals of maturingdebt and interest costs to be paid in period t+1. In the simulation, we assume that α =1, whichmeans 100% of maturing debt principals and interest expenses are refinanced.
SSSSSECTIONECTIONECTIONECTIONECTION III III III III IIIEEEEEFFICIENTFFICIENTFFICIENTFFICIENTFFICIENT F F F F FRONTIERRONTIERRONTIERRONTIERRONTIER ANDANDANDANDAND B B B B BENCHMARKENCHMARKENCHMARKENCHMARKENCHMARK P P P P PORTFOLIOORTFOLIOORTFOLIOORTFOLIOORTFOLIO
FORFORFORFORFOR D D D D DOMESTICOMESTICOMESTICOMESTICOMESTIC G G G G GOVERNMENTOVERNMENTOVERNMENTOVERNMENTOVERNMENT D D D D DEBTEBTEBTEBTEBT

88888 DDDDDECEMBERECEMBERECEMBERECEMBERECEMBER 20052005200520052005
DDDDDEBTEBTEBTEBTEBT M M M M MANAGEMENTANAGEMENTANAGEMENTANAGEMENTANAGEMENT AAAAANALNALNALNALNALYSISYSISYSISYSISYSIS
OFOFOFOFOF NNNNNEPEPEPEPEPALALALALAL’’’’’SSSSS P P P P PUBLICUBLICUBLICUBLICUBLIC D D D D DEBTEBTEBTEBTEBT
SSSSSUUUUUNGSUPNGSUPNGSUPNGSUPNGSUP R R R R RAAAAA,,,,, C C C C CHANGHANGHANGHANGHANG YYYYYONGONGONGONGONG R R R R RHEEHEEHEEHEEHEE,,,,, ANDANDANDANDAND J J J J JOONOONOONOONOON-H-H-H-H-HOOOOO H H H H HAHMAHMAHMAHMAHM
B P Y
Y z i z
z i z
t+1 t+1 t+1
t+1 t t t
t-31
t-31
t
where
= +
= +
+ +
α
( )
(
/ / /1 4 1 4 1 4
--3 t-21
t-21
t-11
t-11
t t
t t t t
1 1 1
113
113
113
+ + +
+ + +− − −
i z i z i z
z i z i
)
( −− − − −
− − − −
+ + +
+ + +10
310
31
31
3 3 3
195
195
195
1
z i z i z
z i z zt t t t t
t t t t
)
( 885
185
15
15 5 5z i z i zt t t t t− − −+ + + )
Note that i tj is the interest rate on the j-year bond issued in period t. Under the borrowing
strategy w, the actual issue amount for J respective maturity bonds in the year t+1 can becomputed as follows:
( , , , ) ( , , , )//z z z z B w w w wt t t t t+ + + + +=1
1 41
11
31
51 1 4 1 3 5
Now by the same logic, the total financing requirement for period t+2 and the actual issuanceamount for each bond in period t+2 under the time-invariant borrowing strategy w can be representedas follows.
B P Y
Y z i z
z i
t + + +
+ + + +
−
= +
= +
+ +
2 2 2
2 11 4
11 4
11 4
21
t t
t t t t
t
where
α
( )
(
/ / /
tt t t t t t t t
t t t
− − − − + +
− − −
+ + +
+ +2
12
11
11
1 1 11
11
1
103
103
z i z i z i z
z i z
)
( 1103
93
93 3 3
13
13
185
185
185
+ + + +
+ + +− − + +
− − −
i z i z i z
z i zt t t t t t
t t t
)
( zz z i z i z
z z z
t t t t t t
t t tand
− − + +
+ + +
+ + +175
175 5 5
15
15
21 4
21
23
)
( , , ,/ zz B w w w wt t+ +=25
2 1 4 1 3 5) ( , , , )/
Note that we are at the end of period t, and that Bt+2 is a random variable as interest
rates in the period t+1, ( , , , )/i i i it t t t+ + + +11 4
11
13
15 , are not observed at t. Note also that the actual
amount of bond issuance in period t+2 is determined by the amount borrowed in period t+1.Hence, the issuance amount of each bond in any given period is a function of the borrowingstrategy itself as well as the actual term structure of interest rates up to that period. The processcan be repeated until period t+N. A specific debt portfolio will emerge depending on the pathof term structures during the N periods.
For yield curve simulations, we assume that the yields of government bonds are random
variables that have a multivariate normal distribution.6 Thus, letting it+i t+i1/4
t+i1
t+i3
t+i5=(i , i , i , i ) , we
have it+i ~ ( , )N µ ∑ . We estimate µ µ µ µ µ by the average yield to maturities of Nepali governmentbonds. Due to the lack of data in Nepal, the variance–covariance matrix ∑ is estimated usingthe daily yield curve data on Korean bonds from 30 October 2000 to 28 November 2003.
6 We need much richer data in our analysis to allow possible non-normality, in which case we need to employ a moreor less sophisticated method such as bootstrapping.
(3)
(4)

99999ERD ERD ERD ERD ERD TTTTTECHNICALECHNICALECHNICALECHNICALECHNICAL N N N N NOTEOTEOTEOTEOTE S S S S SERIESERIESERIESERIESERIES N N N N NOOOOO..... 1515151515
Given a stochastic process of the term structure of interest rates and given a borrowingstrategy w, we can obtain a conditional distribution of the debt service costs on the debt portfoliothat emerges at the end of the horizon by conducting simulations on the term structure ofinterest rates. Each borrowing strategy is characterized by the mean and standard deviationof debt service costs and/or by the cost at the 95th percentile associated with the resultingdebt portfolio. By conducting 1,000 iterations of the simulation for each of the borrowingstrategies, in Figure 1(a), we can obtain all period-end portfolios in the space of the meanand standard deviation, from which we can identify the efficient portfolio set conditional uponthe existing debt portfolio (Case 1). Figure 1(b) plots the mean and the standard deviationof period-end debt portfolios with the emphasis on those at the lower left corner of Figure1(a). The efficient frontier is then constructed in Figure 2 along with the choice of a benchmarkportfolio for domestic debt following the procedure in the next section. The same analysis appliesto Case 2, and the results are in Figures 3 and 4.
The figures show negative trade-offs between expected cost and risk. With the usualupward sloping yield curves, shorter-term financing implies lower expected debt service costbut higher volatility than longer-term financing. There are two reasons for this. First, short-term interest rates are more volatile than long-term interest rates, and short-term financingrequires more frequent refinancing in a debt management horizon. Second, under the liquiditypreference theory of term structures, longer-term financing tends to be associated with higherexpected average annual debt service cost but with lower conditional variance of the averageannual cost. We can obtain the efficient portfolio set by selecting portfolios that yield the lowestexpected cost at each level of standard deviation.
SSSSSECTIONECTIONECTIONECTIONECTION III III III III IIIEEEEEFFICIENTFFICIENTFFICIENTFFICIENTFFICIENT F F F F FRONTIERRONTIERRONTIERRONTIERRONTIER ANDANDANDANDAND B B B B BENCHMARKENCHMARKENCHMARKENCHMARKENCHMARK P P P P PORTFOLIOORTFOLIOORTFOLIOORTFOLIOORTFOLIO
FORFORFORFORFOR D D D D DOMESTICOMESTICOMESTICOMESTICOMESTIC G G G G GOVERNMENTOVERNMENTOVERNMENTOVERNMENTOVERNMENT D D D D DEBTEBTEBTEBTEBT
FIGURE 1
WHOLE PORTFOLIOS FOR DOMESTIC DEBT (IN RS. MILLION)CASE 1:
0.0 0.2 0.4 0.6 0.8 1.0 1.20
1
2
3
4
5
6
Expecte
dD
ebt
Serv
ice
Cost
x1
05
Risk
(a)X 10
7

1010101010 DDDDDECEMBERECEMBERECEMBERECEMBERECEMBER 20052005200520052005
DDDDDEBTEBTEBTEBTEBT M M M M MANAGEMENTANAGEMENTANAGEMENTANAGEMENTANAGEMENT AAAAANALNALNALNALNALYSISYSISYSISYSISYSIS
OFOFOFOFOF NNNNNEPEPEPEPEPALALALALAL’’’’’SSSSS P P P P PUBLICUBLICUBLICUBLICUBLIC D D D D DEBTEBTEBTEBTEBT
SSSSSUUUUUNGSUPNGSUPNGSUPNGSUPNGSUP R R R R RAAAAA,,,,, C C C C CHANGHANGHANGHANGHANG YYYYYONGONGONGONGONG R R R R RHEEHEEHEEHEEHEE,,,,, ANDANDANDANDAND J J J J JOONOONOONOONOON-H-H-H-H-HOOOOO H H H H HAHMAHMAHMAHMAHM
0 1 2 3 4 5 6 7 80.0
0.2
0.4
0.8
1.0
1.4
1.6
1.8
2.0
1.2
Risk
(b)X 10
5
Expecte
dD
ebt
Serv
ice
Cost
x10
5
0.6
4.4
4.0
3.6
3.2
2.8
2.4
2.07.0 7.4 7.8 8.2 8.6 9.0 9.4
X 104
9.8
Risk
Expecte
dD
ebt
Serv
ice
Cost
x1
04
FIGURE 2
EFFICIENT FRONTIER AND BENCHMARK PORTFOLIO
FOR DOMESTIC DEBT (IN RS. MILLION)
CASE 1:
Optimal Portfolio

1111111111ERD ERD ERD ERD ERD TTTTTECHNICALECHNICALECHNICALECHNICALECHNICAL N N N N NOTEOTEOTEOTEOTE S S S S SERIESERIESERIESERIESERIES N N N N NOOOOO..... 1515151515
SSSSSECTIONECTIONECTIONECTIONECTION III III III III IIIEEEEEFFICIENTFFICIENTFFICIENTFFICIENTFFICIENT F F F F FRONTIERRONTIERRONTIERRONTIERRONTIER ANDANDANDANDAND B B B B BENCHMARKENCHMARKENCHMARKENCHMARKENCHMARK P P P P PORTFOLIOORTFOLIOORTFOLIOORTFOLIOORTFOLIO
FORFORFORFORFOR D D D D DOMESTICOMESTICOMESTICOMESTICOMESTIC G G G G GOVERNMENTOVERNMENTOVERNMENTOVERNMENTOVERNMENT D D D D DEBTEBTEBTEBTEBT
3
2
1
0
-1
-50.0 0.2 0.4 0.6 1.0 1.2 1.4
X 107
Risk
(a)
Expecte
dD
ebt
Serv
ice
Cost
x10
5
FIGURE 3
WHOLE PORTFOLIOS FOR DOMESTIC DEBT (IN RS. MILLION)CASE 2:
-2
-3
-4
0.8
0.5 1.0 1.5 2.0 3.0 3.5 4.0
X 105
Risk
(b)
2.5 4.5
1.4
1.2
1.0
0.8
0.0
Expecte
dD
ebt
Servic
eC
ost
x10
5
0.6
0.4
0.2

1212121212 DDDDDECEMBERECEMBERECEMBERECEMBERECEMBER 20052005200520052005
DDDDDEBTEBTEBTEBTEBT M M M M MANAGEMENTANAGEMENTANAGEMENTANAGEMENTANAGEMENT AAAAANALNALNALNALNALYSISYSISYSISYSISYSIS
OFOFOFOFOF NNNNNEPEPEPEPEPALALALALAL’’’’’SSSSS P P P P PUBLICUBLICUBLICUBLICUBLIC D D D D DEBTEBTEBTEBTEBT
SSSSSUUUUUNGSUPNGSUPNGSUPNGSUPNGSUP R R R R RAAAAA,,,,, C C C C CHANGHANGHANGHANGHANG YYYYYONGONGONGONGONG R R R R RHEEHEEHEEHEEHEE,,,,, ANDANDANDANDAND J J J J JOONOONOONOONOON-H-H-H-H-HOOOOO H H H H HAHMAHMAHMAHMAHM
1
0
-1
-2
-50.0 0.2 0.4 0.6 1.0 1.2 1.4
X 107Risk
(a)
Expecte
dD
ebt
Serv
ice
Cost
x10
5
FIGURE 4
EFFICIENT FRONTIER AND BENCHMARK PORTFOLIO
FOR DOMESTIC DEBT (IN RS. MILLION)
CASE 2:
-3
-4
0.8
Risk
(b)
Optimal Portfolio
2.4 2.82.01.61.20.80.40.4
0.8
1.2
1.6
2.0
2.4
2.8
3.2
3.6
Expecte
dD
ebt
Serv
ice
Cost
x10
4
X 105
3.2 3.6

1313131313ERD ERD ERD ERD ERD TTTTTECHNICALECHNICALECHNICALECHNICALECHNICAL N N N N NOTEOTEOTEOTEOTE S S S S SERIESERIESERIESERIESERIES N N N N NOOOOO..... 1515151515
SSSSSECTIONECTIONECTIONECTIONECTION IV IV IV IV IVEEEEEFFICIENTFFICIENTFFICIENTFFICIENTFFICIENT F F F F FRONTIERRONTIERRONTIERRONTIERRONTIER ANDANDANDANDAND B B B B BENCHMARKENCHMARKENCHMARKENCHMARKENCHMARK P P P P PORTFOLIOORTFOLIOORTFOLIOORTFOLIOORTFOLIO
FORFORFORFORFOR E E E E EXTERNALXTERNALXTERNALXTERNALXTERNAL G G G G GOVERNMENTOVERNMENTOVERNMENTOVERNMENTOVERNMENT D D D D DEBTEBTEBTEBTEBT
C. Benchmark Portfolios and Optimal Borrowing Strategies
Given the efficient frontier, the next step is to identify a benchmark (or optimal) portfolio fromthe feasible choice set. Given the feasible efficient portfolio set and exogenous risk targets, a portfoliothat minimizes deviations from the exogenous targets can be selected as the benchmark portfolio.That is, the benchmark portfolio is identified by minimizing a penalty function defined as a weightedaverage of deviations from the respective risk targets. An example of exogenous targets is the costat risk (CaR) of a portfolio. A simple penalty function is one that only considers CaR for the target.Thus, letting CaR (95%) be the 95% CaR from a portfolio, we have a penalty function: f =CaR (95%).7 The value of 95% CaR for a borrowing strategy or portfolio is the 95th percentilein the distribution of debt service costs from the strategy. In our simulation study, we obtainthe distribution for each borrowing strategy from a set of 1,000 iterations. A portfolio thathas the minimum value of CaR (95%) is selected as the benchmark portfolio. The circled onein Figure 2 is the benchmark portfolio for domestic debt in Case 1. The same analysis appliesto Case 2, and the benchmark portfolio is circled in Figure 4.
Optimal borrowing strategies for Case 1 and Case 2 are summarized in Table 5. For Case1, the optimal debt issuance mix is 40% 3-month treasury bills, 0% 1-year treasury bills, 0%3-year bonds, and 60% five-year bonds. For Case 2, the optimal debt issuance mix is 30%3-month treasury bills, 10% 1-year treasury bills, 0% 3-year bonds, 0% 5-year bonds, and60% 10-year bonds. These results imply that it would be better for the Nepali economy tochoose a portfolio with longer-term debts to reduce the debt service cost risk and to simplifythe issue profile of domestic bonds.
TABLE 5OPTIMAL BORROWING STRATEGIES FOR DOMESTIC GOVERNMENT DEBT
BOND MATURITY (PERCENT)
3-MONTH 1-YEAR 3-YEAR 5-YEAR 10-YEAR
Case 1 40 0 0 60 –Case 2 30 10 0 0 60
IV. EFFICIENT FRONTIER AND BENCHMARK PORTFOLIOFOR EXTERNAL GOVERNMENT DEBT
What financial instruments are available to manage external risks? An important one for hedgingis the currency mix of foreign debt. This is particularly true for developing countries. Many developingcountries lack access to futures and options markets to hedge the enormous risks arising from thecurrency exposure of their foreign debt. Even if these markets are accessible, the maturities areoften too short compared to the maturities of long-term debts. In this section, we study the optimalcurrency mix of Nepali external debt based on the approach used in the previous section.
7 Alternatively, as in Hahm and Kim (2003), we can add duration targets in an attempt to control medium-term marketrisks as well as liquidity risks. In this case, the penalty function is a weighted average of deviations from an exogenousduration target and CaR.

1414141414 DDDDDECEMBERECEMBERECEMBERECEMBERECEMBER 20052005200520052005
DDDDDEBTEBTEBTEBTEBT M M M M MANAGEMENTANAGEMENTANAGEMENTANAGEMENTANAGEMENT AAAAANALNALNALNALNALYSISYSISYSISYSISYSIS
OFOFOFOFOF NNNNNEPEPEPEPEPALALALALAL’’’’’SSSSS P P P P PUBLICUBLICUBLICUBLICUBLIC D D D D DEBTEBTEBTEBTEBT
SSSSSUUUUUNGSUPNGSUPNGSUPNGSUPNGSUP R R R R RAAAAA,,,,, C C C C CHANGHANGHANGHANGHANG YYYYYONGONGONGONGONG R R R R RHEEHEEHEEHEEHEE,,,,, ANDANDANDANDAND J J J J JOONOONOONOONOON-H-H-H-H-HOOOOO H H H H HAHMAHMAHMAHMAHM
8 We do not consider multicurrency loans here due to insufficiency of data. Examples are loans in Euro and Japaneseyen.
A. The Data: Basic Profiles of External Debt Portfolios in Nepal
Table 6 shows the basic profiles of the government external debt by currency as of 30September 2002. The borrowing currencies are Nepali rupee, Saudi riyal, Kuwaiti dinar, USdollar, and Special Drawing Rights.8
TABLE 6TOTAL LIABILITIES OF EXTERNAL DEBT OF NEPAL, 2002
AMOUNT IN EACH AMOUNT INCURRENCY NATIONAL CURRENCY NEPALI RUPEES PERCENT
Nepal rupees (NRs) 19,073,535 19,073,535 0.01Saudi riyals (SAR) 184,399,830 3,857,867,974 2.58Kuwaiti dinars (KWD) 14,550,000 3,766,995,000 2.52US dollars (USD) 293,062,000 22,992,046,000 15.37Special Drawing Rights (SDR) 1,148,450,000 118,933,482,000 79.52
Total 149,569,464,509 100.00
Note: Amounts in NRs are calculated using the exchange rates of 30 September 2002.
In this section, we use the same methodology as in the previous section to identify theefficient cost–risk trade-offs and optimal benchmark portfolios for external debt. Note, however,that this time we use the currency composition (instead of the maturity structure of the debtportfolio) as the decision variable. The analysis is conducted based upon the actual Nepaligovernment external debt data as of 30 September 2002. Suppose that we are at the endof period 4Q2002 (t=4Q2002). The plan period or debt management horizon is 10 years 1Q2003to 4Q2012 (N=40). The decision interval or time unit of the analysis is a quarter.
B. Derivation of Efficient Portfolio Set Conditionalupon Existing External Debt Structure
The efficient frontier set for external government debt as of the end of 4Q2012 is derivedas a summary of the expected cost–risk trade-off. The currencies available for borrowingare the Saudi riyal, Kuwaiti dinar, US dollar, and Special Drawing Rights. We assume that thepayments of principal and interest on all outstanding bonds are refinanced by borrowing inany of these four currencies. We also assume that the maturities of loans are all 40 years andthat interest payments are made semiannually.
The primary budget deficit under the basic scenario is shown in Table 7.

1515151515ERD ERD ERD ERD ERD TTTTTECHNICALECHNICALECHNICALECHNICALECHNICAL N N N N NOTEOTEOTEOTEOTE S S S S SERIESERIESERIESERIESERIES N N N N NOOOOO..... 1515151515
TABLE 7FOREIGN FINANCING OF PRIMARY BUDGET DEFICIT UNDER BASIC SCENARIO
(IN NRS. MILLION)
2003 2004 2005 2006 2007 2008 2009 2010 2011 2012
11,594 13,403 15,146 17,392 20,097 23,310 27,066 31,664 37,322 44,317
From the annual budget deficit series above, the forecast of quarterly primary budgetdeficits over the debt management horizon from 1Q2003 to 4Q2012 (N=40) is obtained bydividing the annual data by four. These quarterly primary budget deficit series are exogenous
variables and are denoted by { , , , }P P Pt t t+ + +1 2 40 .
The government is considering a combination of SAR, KWD, USD, and SDR loans tofinance the primary budget deficits and to rollover maturing debts given the existing debtportfolio at the end of period 4Q2002. A borrowing strategy is denoted by a composition ofloans in these four currencies represented as a vector of weights, w = ( , , , )w w w wSAR KWD USD SDR ,which sum to unity. wj is the weight of the j-th currency. We assume that each borrowingstrategy is time-invariant, implying that under the borrowing strategy, the same weights ofrespective currencies are maintained throughout the debt management horizon.
In the case of external debts, it would be desirable to conduct a full-blown simulationwith respect to yield curves, exchange rates, and sovereign risk premia for Nepali governmentdebt. Such multivariate simulations covering all those factors, however, are not feasible andextremely costly. Our simulation study focuses on the exchange rate since our objective is tofind the currency composition of liabilities that minimizes risk stemming from the variabilityin values of foreign liability debt service. For this purpose, we assume that there is no sovereignrisk premium and that the semiannual interest rate for each currency loan is 3%. Then, theeffective interest rate on the loan from the j-th country can be written as follows:
( ) ( )( )*1 1 4+ = + +i i
E e
etj
ttj
tj (5)
where jti is the interest rate on the j-th currency issued in period t; i* and
E e
etj
tj
( )+4 are,
respectively, the foreign interest rate and rate of depreciation of the domestic currency relativeto currency j.
Note that the existing government external debt portfolio at the end of period t issummarized as a vector
Zt t t t t t t tz z z z z z z= − − − −( , , , , , , , ,SAR SAR SAR KWD KWD KWD1 159 1 159
UUSD USD KWD SDR SDR SDR, , , , , , , )z z z z zt t t t t− − − −1 159 1 159
where zt ij− is the balance of j-th currency loans borrowed in period t-i; the number 159 indicates
SSSSSECTIONECTIONECTIONECTIONECTION IV IV IV IV IVEEEEEFFICIENTFFICIENTFFICIENTFFICIENTFFICIENT F F F F FRONTIERRONTIERRONTIERRONTIERRONTIER ANDANDANDANDAND B B B B BENCHMARKENCHMARKENCHMARKENCHMARKENCHMARK P P P P PORTFOLIOORTFOLIOORTFOLIOORTFOLIOORTFOLIO
FORFORFORFORFOR E E E E EXTERNALXTERNALXTERNALXTERNALXTERNAL G G G G GOVERNMENTOVERNMENTOVERNMENTOVERNMENTOVERNMENT D D D D DEBTEBTEBTEBTEBT

1616161616 DDDDDECEMBERECEMBERECEMBERECEMBERECEMBER 20052005200520052005
DDDDDEBTEBTEBTEBTEBT M M M M MANAGEMENTANAGEMENTANAGEMENTANAGEMENTANAGEMENT AAAAANALNALNALNALNALYSISYSISYSISYSISYSIS
OFOFOFOFOF NNNNNEPEPEPEPEPALALALALAL’’’’’SSSSS P P P P PUBLICUBLICUBLICUBLICUBLIC D D D D DEBTEBTEBTEBTEBT
SSSSSUUUUUNGSUPNGSUPNGSUPNGSUPNGSUP R R R R RAAAAA,,,,, C C C C CHANGHANGHANGHANGHANG YYYYYONGONGONGONGONG R R R R RHEEHEEHEEHEEHEE,,,,, ANDANDANDANDAND J J J J JOONOONOONOONOON-H-H-H-H-HOOOOO H H H H HAHMAHMAHMAHMAHM
the last quarter at the end of 40 years. As in the case of domestic debt, the elements in Ztare determined by the Nepali central government’s external debt portfolio as of July 2003.Now, for a given borrowing strategy w, the government’s total financing requirement for thenext year, Bt+1, can be represented as the sum of the primary budget deficit Pt+1 and therefinancing amount αYt+1, where α∈[0,1] is the fraction of refinancing and Yt+1 is the sum ofprincipal and interest to be paid in period t+1. In simulation, we assume that 50% of principalpayments and interest expenses are refinanced every quarter (α = 0.5).
B P Y
Y i zkj
kj
t t t
t t twhere
+ + +
+ + −==
+
= +
= +⎛⎝⎜
⎞⎠⎟∑∑
1 1 1
1 1 21
80
1
4
1180
α
−−2kj
where k runs through 80, the number of half-year periods in 40 years.
We assume that a constant fraction of the principal of maturing bonds as well as interest paymentson all existing bonds is refinanced every quarter, and the remaining fraction is repaid from thegovernment budget. The actual issuance amount in year t+1 is a function of the borrowing strategyw:
( , , , ) ( , , ,z z z z B w w w wt t t t t+ + + + +=1 1 1 1 1SAR KWD USD SDR
SAR KWD USD SDR)) (7)
Now, by the same logic, the total financing requirement for period t+2 and the actualissuance amount for each bond in period t+2 under the time-invariant borrowing strategy wcan be represented as follows:
B P Y
Y i z
t t t
t t kj
kjt
+ + +
+ + −==
+
= +
= +⎛⎝⎜
⎞⎠⎟∑∑
2 2 2
2 2 21
80
1
4
2180
α
where −−
+ + + + +=
2
1 1 1 1 2
kj
t t t t tz z z z B w w wand SAR KWD USD SDRSAR KWD( , , , ) ( , , UUSD SDR, )w
Note that we are at the end of period t, so that Bt+2 is a random variable as exchange
rates and effective interest rates in period t+1, ( , , , )i i i it t t t+ + + +1 1 1 1SAR KWD USD SDR , are not observed at t.
Note also that the actual amount of bond issuance in period t+2 is determined by the borrowingamount in period t+1. Hence, the issuance amount of each bond in any given period is a functionof the borrowing strategy itself as well as the actual exchange rates up to that period. Theprocess can be repeated until period t+N. A specific debt portfolio will emerge depending onthe path of exchange rates during the N periods and the given specific borrowing strategy.
For simulating out of sample exchange rates, we employ the bootstrap method based on quarterlyexchange rate data from 1Q1957 to 2Q2003. The idea behind bootstrapping is to obtain anestimate of the small sample distribution of parameters without assuming that the innovationterms are Gaussian. We use a vector autoregression of order one in our bootstrap procedure.A VAR(1) is estimated for each series of exchange rates; NRs/SAR, NRs/KWD, NRs/USD, andNRS/SDR. We take a random draw from the fitted residuals for the exchange rates NRs/SAR,
(8)
(6)

1717171717ERD ERD ERD ERD ERD TTTTTECHNICALECHNICALECHNICALECHNICALECHNICAL N N N N NOTEOTEOTEOTEOTE S S S S SERIESERIESERIESERIESERIES N N N N NOOOOO..... 1515151515
NRs/KWD, NRs/USD, and NRs/SDR and use it to construct the first year innovation in an artificialsample. The draw is continued with replacement to obtain a full sample exchange rate seriesfor the next 10 years, i.e., 40 quarters. Given a series of simulated exchange rates, actualportfolio evolution is traced for a given specific borrowing strategy. The debt service cost iscalculated for the resulting portfolio at the end of 40 quarters, i.e., 4Q2012. Next, we generatea second set of draws from the fitted residuals and calculate another debt service cost forthe resulting portfolio for the same borrowing strategy. As in the case of government domesticdebt, a set of 1,000 iterations of such a simulation was undertaken for each borrowing strategy.The mean, standard deviation, and 95% CaR value are obtained from the distribution of the1,000 debt service costs for each borrowing strategy.
By conducting 1,000 iterations of the simulation for each of the borrowing strategies,we can represent all period-end portfolios in the space of the mean and standard deviation.In turn, we can identify the efficient portfolio set conditional upon the existing debt portfolio.The simulation results are summarized in Figure 5, which shows a clear negative trade-offbetween expected cost and risk. In Figure 6, we have an efficient portfolio frontier obtainedby selecting portfolios that yield the lowest expected costs at each level of the standard deviationin Figure 5.
C. Benchmark Portfolios and Optimal Borrowing Strategies
The benchmark portfolio for external debt is identified from the set of efficient portfolios basedon the same penalty function as in Section III. Therefore, an optimal benchmark portfolio is identifiedfrom the efficient set by minimizing the 95% CaR. The circled one in Figure 6 is the benchmarkportfolio for external debt. The optimal borrowing strategy is summarized in Table 8. The optimalcurrency composition is 10% SAR, 10% KWD, 80% USD, and 0% SDR.
TABLE 8OPTIMAL BORROWING STRATEGIES FOR EXTERNAL GOVERNMENT DEBT
CURRENCY SAR KWD USD SDR
Percent 10 10 80 0
Why do we have the above results of optimal borrowing mixes for foreign debt portfolio? Theabove result has much to do with the statistical characteristics of each currency, in particularthe mean cost and risks contained in each currency. In Table 9 below we report mean and
variability of ∆eet
t. Notice that
∆eet
t is main determinant of the cost of borrowing in our study
as expresed in the interest rate parity equation (5). We can see that USD dominates in bothmean and variance of the cost; SAR is better than KWD in the mean cost, but KWD is betterthan SAR in variability; and SDR is inferior to all the other three currencies in both meanand variance. The statistics in Table 9, therefore, are consistent with the chosen benchmarkportfolio in Table 8.
SSSSSECTIONECTIONECTIONECTIONECTION IV IV IV IV IVEEEEEFFICIENTFFICIENTFFICIENTFFICIENTFFICIENT F F F F FRONTIERRONTIERRONTIERRONTIERRONTIER ANDANDANDANDAND B B B B BENCHMARKENCHMARKENCHMARKENCHMARKENCHMARK P P P P PORTFOLIOORTFOLIOORTFOLIOORTFOLIOORTFOLIO
FORFORFORFORFOR E E E E EXTERNALXTERNALXTERNALXTERNALXTERNAL G G G G GOVERNMENTOVERNMENTOVERNMENTOVERNMENTOVERNMENT D D D D DEBTEBTEBTEBTEBT

1818181818 DDDDDECEMBERECEMBERECEMBERECEMBERECEMBER 20052005200520052005
DDDDDEBTEBTEBTEBTEBT M M M M MANAGEMENTANAGEMENTANAGEMENTANAGEMENTANAGEMENT AAAAANALNALNALNALNALYSISYSISYSISYSISYSIS
OFOFOFOFOF NNNNNEPEPEPEPEPALALALALAL’’’’’SSSSS P P P P PUBLICUBLICUBLICUBLICUBLIC D D D D DEBTEBTEBTEBTEBT
SSSSSUUUUUNGSUPNGSUPNGSUPNGSUPNGSUP R R R R RAAAAA,,,,, C C C C CHANGHANGHANGHANGHANG YYYYYONGONGONGONGONG R R R R RHEEHEEHEEHEEHEE,,,,, ANDANDANDANDAND J J J J JOONOONOONOONOON-H-H-H-H-HOOOOO H H H H HAHMAHMAHMAHMAHM
TABLE 9MEAN AND VARIABILITY OF
∆ee
EXCHANGE RATE (e) NRs/SAR NRs/KWD NRs/USD NRs/SDR
Mean of ∆ee
0.0296 0.0316 0.0294 0.0336
Variance of ∆ee
0.0042 0.0041 0.0037 0.0048
Standard Deviation of ∆ee
0.0647 0.0641 0.0611 0.0695
By the results summarized in Tables 8 and 9 we can conclude that it is desirable to have alarger portion of the currency whose exchange rate relative to the Nepali rupee has lower average
rate of change, ∆eet
t , and smaller variability of rate of change than the other currencies.
In the above study we are confined to the situation where the mean and volatility of the borrowingcost are the only factors considered in portfolio selection. In such a case the optimal portfolio isthe one that has the lowest mean cost and the smallest variance of the cost. If we have other factorssuch as the interest rates on loans, term structure of loans, and the sovereign risk premium in oursimulation, we can perform richer analysis.
2.370
2.365
2.360
2.3451.0
X 108Risk
(a)
Expecte
dD
ebt
Serv
ice
Cost
x10
10
FIGURE 5
WHOLE PORTFOLIOS FOR EXTERNAL DEBT
2.355
2.350
2.375
1.2 1.4 1.6 1.8 2.0 2.2 2.4 2.6

1919191919ERD ERD ERD ERD ERD TTTTTECHNICALECHNICALECHNICALECHNICALECHNICAL N N N N NOTEOTEOTEOTEOTE S S S S SERIESERIESERIESERIESERIES N N N N NOOOOO..... 1515151515
SSSSSECTIONECTIONECTIONECTIONECTION VVVVVCCCCCONCLUDINGONCLUDINGONCLUDINGONCLUDINGONCLUDING R R R R REMARKSEMARKSEMARKSEMARKSEMARKS
V. CONCLUDING REMARKS
We have studied the problem of debt management for the Nepali economy by applyingthe framework studied in Hahm and Kim (2003). Some important conclusions from the analysisof the Nepali debt data are drawn. The analysis of domestic debt suggests that the Nepalieconomy needs to move to longer-term domestic borrowing, and that the issue profile ofdomestic bonds of Nepal should be simplified. From the analysis of foreign debt we have foundthat it is desirable to have a larger portion of the currency whose exchange rate relative tothe Nepali rupee has a lower average rate of change and smaller variability of rate of changethan the other currencies.
The analytical approach used in the study can be easily applied for other countries toidentify their benchmark government debt portfolios. The empirical exercise for the Nepalidata is only an example. As is noted in the previous sections, the empirical analysis for theNepali data is constrained due to limited availability of data. A richer and more informativedata set has to be accumulated to analyze more interesting issues and perform detailed analysisof debt management in Nepal in the future.
2.3515
2.3505
2.3495
2.34751.0
X 108Risk
Expecte
dD
ebt
Serv
ice
Cost
x10
10
FIGURE 6
EFFICIENT FRONTIER AND BENCHMARK PORTFOLIO FOR EXTERNAL DEBT
2.3485
2.3525
1.2 1.4 1.6 1.8 2.0 2.2
Optimal Portfolio

2020202020 DDDDDECEMBERECEMBERECEMBERECEMBERECEMBER 20052005200520052005
DDDDDEBTEBTEBTEBTEBT M M M M MANAGEMENTANAGEMENTANAGEMENTANAGEMENTANAGEMENT AAAAANALNALNALNALNALYSISYSISYSISYSISYSIS
OFOFOFOFOF NNNNNEPEPEPEPEPALALALALAL’’’’’SSSSS P P P P PUBLICUBLICUBLICUBLICUBLIC D D D D DEBTEBTEBTEBTEBT
SSSSSUUUUUNGSUPNGSUPNGSUPNGSUPNGSUP R R R R RAAAAA,,,,, C C C C CHANGHANGHANGHANGHANG YYYYYONGONGONGONGONG R R R R RHEEHEEHEEHEEHEE,,,,, ANDANDANDANDAND J J J J JOONOONOONOONOON-H-H-H-H-HOOOOO H H H H HAHMAHMAHMAHMAHM
REFERENCES
Carracedo, M., and P. Dattels. 1997. “Survey of Public Debt Management Frameworks in Selected Countries.”In V. Sundararajan et al. eds., Coordinating Public Debt and Monetary Management. InternationalMonetary Fund, Washington, DC.
Cassard, M., and D. Folkerts-Landau. 1997. Risk Management of Sovereign Asset and Liability. IMF WorkingPaper WP/97/166, International Monetary Fund, Washington, DC
Claessens, S. 1992. “The Optimal Currency Composition of External Debt: Theory and Applications to Mexicoand Brazil.” The World Bank Economic Review 6(3, September).
Cohen, D. 1991. Private Lending to Sovereign States. Cambridge, MA: MIT Press.Eaton, J. 1992. Sovereign Debt: A Primer. World Bank Working Paper No. WPS 855, Washington, DC.Hahm, J., and J. Kim. 2003. “Cost-at-Risk and Benchmark Government Debt Portfolio in Korea.” International
Economic Journal 17(2):79-103.Missale, A. 1999. Public Debt Management. Oxford (London): Oxford University Press.World Bank. 1999. Second Sovereign Debt Management Forum: Compilation of Presentations. World Bank,
Washington, DC.

21
PUBLICATIONS FROM THEECONOMICS AND RESEARCH DEPARTMENT
No. 9 Setting User Charges for Public Services: Policiesand Practice at the Asian Development Bank—David Dole, December 2003
No. 10 Beyond Cost Recovery: Setting User Charges forFinancial, Economic, and Social Goals—David Dole and Ian Bartlett, January 2004
No. 11 Shadow Exchange Rates for Project EconomicAnalysis: Toward Improving Practice at the AsianDevelopment Bank—Anneli Lagman-Martin, February 2004
No. 12 Improving the Relevance and Feasibility ofAgriculture and Rural Development OperationalDesigns: How Economic Analyses Can Help—Richard Bolt, September 2005
No. 13 Assessing the Use of Project Distribution andPoverty Impact Analyses at the Asian DevelopmentBank—Franklin D. De Guzman, October 2005
No. 14 Assessing Aid for a Sector Development Plan:Economic Analysis of a Sector Loan—David Dole, November 2005
No. 15 Debt Management Analysis of Nepal’s Public Debt—Sungsup Ra, Changyong Rhee, and Joon-HoHahm, December 2005
ERD TECHNICAL NOTE SERIES (TNS)(Published in-house; Available through ADB Office of External Relations; Free of Charge)
No. 1 Contingency Calculations for EnvironmentalImpacts with Unknown Monetary Values—David Dole, February 2002
No. 2 Integrating Risk into ADB’s Economic Analysisof Projects—Nigel Rayner, Anneli Lagman-Martin,
and Keith Ward, June 2002No. 3 Measuring Willingness to Pay for Electricity
—Peter Choynowski, July 2002No. 4 Economic Issues in the Design and Analysis of a
Wastewater Treatment Project—David Dole, July 2002
No. 5 An Analysis and Case Study of the Role ofEnvironmental Economics at the AsianDevelopment Bank—David Dole and Piya Abeygunawardena,September 2002
No. 6 Economic Analysis of Health Projects: A Case Studyin Cambodia—Erik Bloom and Peter Choynowski, May 2003
No. 7 Strengthening the Economic Analysis of NaturalResource Management Projects—Keith Ward, September 2003
No. 8 Testing Savings Product Innovations Using anExperimental Methodology—Nava Ashraf, Dean S. Karlan, and Wesley Yin,November 2003
ERD POLICY BRIEF SERIES (PBS)(Published in-house; Available through ADB Office of External Relations; Free of charge)
No. 1 Is Growth Good Enough for the Poor?—Ernesto M. Pernia, October 2001
No. 2 India’s Economic ReformsWhat Has Been Accomplished?What Remains to Be Done?—Arvind Panagariya, November 2001
No. 3 Unequal Benefits of Growth in Viet Nam—Indu Bhushan, Erik Bloom, and Nguyen MinhThang, January 2002
No. 4 Is Volatility Built into Today’s World Economy?—J. Malcolm Dowling and J.P. Verbiest,February 2002
No. 5 What Else Besides Growth Matters to PovertyReduction? Philippines—Arsenio M. Balisacan and Ernesto M. Pernia,February 2002
No. 6 Achieving the Twin Objectives of Efficiency andEquity: Contracting Health Services in Cambodia—Indu Bhushan, Sheryl Keller, and Brad Schwartz,March 2002
No. 7 Causes of the 1997 Asian Financial Crisis: WhatCan an Early Warning System Model Tell Us?—Juzhong Zhuang and Malcolm Dowling,June 2002
No. 8 The Role of Preferential Trading Arrangementsin Asia—Christopher Edmonds and Jean-Pierre Verbiest,July 2002
No. 9 The Doha Round: A Development Perspective—Jean-Pierre Verbiest, Jeffrey Liang, and LeaSumulong, July 2002
No. 10 Is Economic Openness Good for RegionalDevelopment and Poverty Reduction? ThePhilippines—E. M. Pernia and Pilipinas Quising, October2002
No. 11 Implications of a US Dollar Depreciation for AsianDeveloping Countries—Emma Fan, July 2002
No. 12 Dangers of Deflation—D. Brooks and Pilipinas Quising, December 2002
No. 13 Infrastructure and Poverty Reduction—What is the Connection?—Ifzal Ali and Ernesto Pernia, January 2003
No. 14 Infrastructure and Poverty Reduction—Making Markets Work for the Poor—Xianbin Yao, May 2003
No. 15 SARS: Economic Impacts and Implications—Emma Xiaoqin Fan, May 2003
No. 16 Emerging Tax Issues: Implications of Globalizationand Technology—Kanokpan Lao Araya, May 2003
No. 17 Pro-Poor Growth: What is It and Why is ItImportant?—Ernesto M. Pernia, May 2003

22
No. 1 Capitalizing on Globalization—Barry Eichengreen, January 2002
No. 2 Policy-based Lending and Poverty Reduction:An Overview of Processes, Assessmentand Options—Richard Bolt and Manabu Fujimura, January2002
No. 3 The Automotive Supply Chain: Global Trendsand Asian Perspectives—Francisco Veloso and Rajiv Kumar, January 2002
No. 4 International Competitiveness of Asian Firms:An Analytical Framework—Rajiv Kumar and Doren Chadee, February 2002
No. 5 The International Competitiveness of AsianEconomies in the Apparel Commodity Chain—Gary Gereffi, February 2002
No. 6 Monetary and Financial Cooperation in EastAsia—The Chiang Mai Initiative and Beyond—Pradumna B. Rana, February 2002
No. 7 Probing Beneath Cross-national Averages: Poverty,Inequality, and Growth in the Philippines—Arsenio M. Balisacan and Ernesto M. Pernia,March 2002
No. 8 Poverty, Growth, and Inequality in Thailand—Anil B. Deolalikar, April 2002
No. 9 Microfinance in Northeast Thailand: Who Benefitsand How Much?—Brett E. Coleman, April 2002
No. 10 Poverty Reduction and the Role of Institutions in
Developing Asia—Anil B. Deolalikar, Alex B. Brilliantes, Jr.,Raghav Gaiha, Ernesto M. Pernia, Mary Raceliswith the assistance of Marita Concepcion Castro-Guevara, Liza L. Lim, Pilipinas F. Quising, May2002
No. 11 The European Social Model: Lessons forDeveloping Countries—Assar Lindbeck, May 2002
No. 12 Costs and Benefits of a Common Currency forASEAN—Srinivasa Madhur, May 2002
No. 13 Monetary Cooperation in East Asia: A Survey—Raul Fabella, May 2002
No. 14 Toward A Political Economy Approachto Policy-based Lending—George Abonyi, May 2002
No. 15 A Framework for Establishing Priorities in aCountry Poverty Reduction Strategy—Ron Duncan and Steve Pollard, June 2002
No. 16 The Role of Infrastructure in Land-use Dynamicsand Rice Production in Viet Nam’s Mekong RiverDelta—Christopher Edmonds, July 2002
No. 17 Effect of Decentralization Strategy onMacroeconomic Stability in Thailand—Kanokpan Lao-Araya, August 2002
No. 18 Poverty and Patterns of Growth—Rana Hasan and M. G. Quibria, August 2002
ERD WORKING PAPER SERIES (WPS)(Published in-house; Available through ADB Office of External Relations; Free of Charge)
No. 18 Public–Private Partnership for Competitiveness—Jesus Felipe, June 2003
No. 19 Reviving Asian Economic Growth Requires FurtherReforms—Ifzal Ali, June 2003
No. 20 The Millennium Development Goals and Poverty:Are We Counting the World’s Poor Right?—M. G. Quibria, July 2003
No. 21 Trade and Poverty: What are the Connections?—Douglas H. Brooks, July 2003
No. 22 Adapting Education to the Global Economy—Olivier Dupriez, September 2003
No. 23 Avian Flu: An Economic Assessment for SelectedDeveloping Countries in Asia—Jean-Pierre Verbiest and Charissa Castillo,March 2004
No. 25 Purchasing Power Parities and the InternationalComparison Program in a Globalized World—Bishnu Pant, March 2004
No. 26 A Note on Dual/Multiple Exchange Rates—Emma Xiaoqin Fan, May 2004
No. 27 Inclusive Growth for Sustainable Poverty Reductionin Developing Asia: The Enabling Role ofInfrastructure Development—Ifzal Ali and Xianbin Yao, May 2004
No. 28 Higher Oil Prices: Asian Perspectives andImplications for 2004-2005—Cyn-Young Park, June 2004
No. 29 Accelerating Agriculture and Rural Development forInclusive Growth: Policy Implications forDeveloping Asia—Richard Bolt, July 2004
No. 30 Living with Higher Interest Rates: Is Asia Ready?—Cyn-Young Park, August 2004
No. 31 Reserve Accumulation, Sterilization, and PolicyDilemma—Akiko Terada-Hagiwara, October 2004
No. 32 The Primacy of Reforms in the Emergence ofPeople’s Republic of China and India
—Ifzal Ali and Emma Xiaoqin Fan, November2004
No. 33 Population Health and Foreign Direct Investment:Does Poor Health Signal Poor GovernmentEffectiveness?—Ajay Tandon, January 2005
No. 34 Financing Infrastructure Development: AsianDeveloping Countries Need to Tap Bond MarketsMore Rigorously—Yun-Hwan Kim, February 2005
No. 35 Attaining Millennium Development Goals inHealth: Isn’t Economic Growth Enough?—Ajay Tandon, March 2005
No. 36 Instilling Credit Culture in State-owned Banks—Experience from Lao PDR—Robert Boumphrey, Paul Dickie, and SamiuelaTukuafu, April 2005
No. 37 Coping with Global Imbalances and AsianCurrencies—Cyn-Young Park, May 2005
No. 38 Asia’s Long-term Growth and Integration:Reaching beyond Trade Policy Barriers—Douglas H. Brooks, David Roland-Holst, and FanZhai, September 2005
No. 39 Competition Policy and Development—Douglas H. Brooks, October 2005
No. 40 Highlighting Poverty as Vulnerability: The 2005Earthquake in Pakistan—Rana Hasan and Ajay Tandon, October 2005
No. 41 Conceptualizing and Measuring Poverty asVulnerability: Does It Make a Difference?—Ajay Tandon and Rana Hasan, October 2005
No. 42 Potential Economic Impact of an Avian FluPandemic on Asia—Erik Bloom, Vincent de Wit, and Mary JaneCarangal-San Jose, November 2005
No. 43 Creating Better and More Jobs in Indonesia: ABlueprint for Policy Action—Guntur Sugiyarto, December 2005
23
No. 19 Why are Some Countries Richer than Others?A Reassessment of Mankiw-Romer-Weil’s Test ofthe Neoclassical Growth Model—Jesus Felipe and John McCombie, August 2002
No. 20 Modernization and Son Preference in People’sRepublic of China—Robin Burgess and Juzhong Zhuang, September2002
No. 21 The Doha Agenda and Development: A View fromthe Uruguay Round—J. Michael Finger, September 2002
No. 22 Conceptual Issues in the Role of EducationDecentralization in Promoting Effective Schooling inAsian Developing Countries—Jere R. Behrman, Anil B. Deolalikar, and Lee-Ying Son, September 2002
No. 23 Promoting Effective Schooling through EducationDecentralization in Bangladesh, Indonesia, andPhilippines—Jere R. Behrman, Anil B. Deolalikar, and Lee-Ying Son, September 2002
No. 24 Financial Opening under the WTO Agreement inSelected Asian Countries: Progress and Issues—Yun-Hwan Kim, September 2002
No. 25 Revisiting Growth and Poverty Reduction inIndonesia: What Do Subnational Data Show?—Arsenio M. Balisacan, Ernesto M. Pernia, and Abuzar Asra, October 2002
No. 26 Causes of the 1997 Asian Financial Crisis: WhatCan an Early Warning System Model Tell Us?—Juzhong Zhuang and J. Malcolm Dowling,October 2002
No. 27 Digital Divide: Determinants and Policies withSpecial Reference to Asia—M. G. Quibria, Shamsun N. Ahmed, TedTschang, and Mari-Len Reyes-Macasaquit, October2002
No. 28 Regional Cooperation in Asia: Long-term Progress,Recent Retrogression, and the Way Forward—Ramgopal Agarwala and Brahm Prakash,October 2002
No. 29 How can Cambodia, Lao PDR, Myanmar, and VietNam Cope with Revenue Lost Due to AFTA TariffReductions?—Kanokpan Lao-Araya, November 2002
No. 30 Asian Regionalism and Its Effects on Trade in the1980s and 1990s—Ramon Clarete, Christopher Edmonds, andJessica Seddon Wallack, November 2002
No. 31 New Economy and the Effects of IndustrialStructures on International Equity MarketCorrelations—Cyn-Young Park and Jaejoon Woo, December2002
No. 32 Leading Indicators of Business Cycles in Malaysiaand the Philippines—Wenda Zhang and Juzhong Zhuang, December2002
No. 33 Technological Spillovers from Foreign DirectInvestment—A Survey—Emma Xiaoqin Fan, December 2002
No. 34 Economic Openness and Regional Development inthe Philippines—Ernesto M. Pernia and Pilipinas F. Quising,January 2003
No. 35 Bond Market Development in East Asia:Issues and Challenges—Raul Fabella and Srinivasa Madhur, January2003
No. 36 Environment Statistics in Central Asia: Progressand Prospects—Robert Ballance and Bishnu D. Pant, March2003
No. 37 Electricity Demand in the People’s Republic of
China: Investment Requirement andEnvironmental Impact—Bo Q. Lin, March 2003
No. 38 Foreign Direct Investment in Developing Asia:Trends, Effects, and Likely Issues for theForthcoming WTO Negotiations—Douglas H. Brooks, Emma Xiaoqin Fan,and Lea R. Sumulong, April 2003
No. 39 The Political Economy of Good Governance forPoverty Alleviation Policies—Narayan Lakshman, April 2003
No. 40 The Puzzle of Social CapitalA Critical Review—M. G. Quibria, May 2003
No. 41 Industrial Structure, Technical Change, and theRole of Government in Development of theElectronics and Information Industry inTaipei,China—Yeo Lin, May 2003
No. 42 Economic Growth and Poverty Reductionin Viet Nam—Arsenio M. Balisacan, Ernesto M. Pernia, andGemma Esther B. Estrada, June 2003
No. 43 Why Has Income Inequality in ThailandIncreased? An Analysis Using 1975-1998 Surveys—Taizo Motonishi, June 2003
No. 44 Welfare Impacts of Electricity Generation SectorReform in the Philippines—Natsuko Toba, June 2003
No. 45 A Review of Commitment Savings Products inDeveloping Countries—Nava Ashraf, Nathalie Gons, Dean S. Karlan,and Wesley Yin, July 2003
No. 46 Local Government Finance, Private Resources,and Local Credit Markets in Asia—Roberto de Vera and Yun-Hwan Kim, October2003
No. 47 Excess Investment and Efficiency Loss DuringReforms: The Case of Provincial-level Fixed-AssetInvestment in People’s Republic of China—Duo Qin and Haiyan Song, October 2003
No. 48 Is Export-led Growth Passe? Implications forDeveloping Asia—Jesus Felipe, December 2003
No. 49 Changing Bank Lending Behavior and CorporateFinancing in Asia—Some Research Issues—Emma Xiaoqin Fan and Akiko Terada-Hagiwara,December 2003
No. 50 Is People’s Republic of China’s Rising ServicesSector Leading to Cost Disease?—Duo Qin, March 2004
No. 51 Poverty Estimates in India: Some Key Issues—Savita Sharma, May 2004
No. 52 Restructuring and Regulatory Reform in the PowerSector: Review of Experience and Issues—Peter Choynowski, May 2004
No. 53 Competitiveness, Income Distribution, and Growthin the Philippines: What Does the Long-runEvidence Show?—Jesus Felipe and Grace C. Sipin, June 2004
No. 54 Practices of Poverty Measurement and PovertyProfile of Bangladesh—Faizuddin Ahmed, August 2004
No. 55 Experience of Asian Asset ManagementCompanies: Do They Increase Moral Hazard?—Evidence from Thailand—Akiko Terada-Hagiwara and Gloria Pasadilla,September 2004
No. 56 Viet Nam: Foreign Direct Investment andPostcrisis Regional Integration—Vittorio Leproux and Douglas H. Brooks,September 2004
No. 57 Practices of Poverty Measurement and PovertyProfile of Nepal

24
1. Improving Domestic Resource Mobilization ThroughFinancial Development: Overview September 1985
2. Improving Domestic Resource Mobilization ThroughFinancial Development: Bangladesh July 1986
3. Improving Domestic Resource Mobilization ThroughFinancial Development: Sri Lanka April 1987
4. Improving Domestic Resource Mobilization ThroughFinancial Development: India December 1987
5. Financing Public Sector Development Expenditurein Selected Countries: Overview January 1988
6. Study of Selected Industries: A Brief ReportApril 1988
7. Financing Public Sector Development Expenditurein Selected Countries: Bangladesh June 1988
8. Financing Public Sector Development Expenditurein Selected Countries: India June 1988
9. Financing Public Sector Development Expenditurein Selected Countries: Indonesia June 1988
10. Financing Public Sector Development Expenditurein Selected Countries: Nepal June 1988
11. Financing Public Sector Development Expenditurein Selected Countries: Pakistan June 1988
12. Financing Public Sector Development Expenditurein Selected Countries: Philippines June 1988
13. Financing Public Sector Development Expenditurein Selected Countries: Thailand June 1988
14. Towards Regional Cooperation in South Asia:ADB/EWC Symposium on Regional Cooperationin South Asia February 1988
15. Evaluating Rice Market Intervention Policies:Some Asian Examples April 1988
16. Improving Domestic Resource Mobilization ThroughFinancial Development: Nepal November 1988
17. Foreign Trade Barriers and Export Growth September1988
18. The Role of Small and Medium-Scale Industries in theIndustrial Development of the Philippines April 1989
19. The Role of Small and Medium-Scale ManufacturingIndustries in Industrial Development: The Experience ofSelected Asian Countries January 1990
20. National Accounts of Vanuatu, 1983-1987 January1990
21. National Accounts of Western Samoa, 1984-1986February 1990
22. Human Resource Policy and Economic Development:Selected Country Studies July 1990
23. Export Finance: Some Asian Examples September 199024. National Accounts of the Cook Islands, 1982-1986
September 199025. Framework for the Economic and Financial Appraisal of
Urban Development Sector Projects January 199426. Framework and Criteria for the Appraisal and
Socioeconomic Justification of Education ProjectsJanuary 1994
27. Investing in Asia 1997 (Co-published with OECD)28. The Future of Asia in the World Economy 1998 (Co-
published with OECD)29. Financial Liberalisation in Asia: Analysis and Prospects
1999 (Co-published with OECD)30. Sustainable Recovery in Asia: Mobilizing Resources for
Development 2000 (Co-published with OECD)31. Technology and Poverty Reduction in Asia and the Pacific
2001 (Co-published with OECD)32. Asia and Europe 2002 (Co-published with OECD)33. Economic Analysis: Retrospective 200334. Economic Analysis: Retrospective: 2003 Update 200435. Development Indicators Reference Manual: Concepts and
Definitions 2004
SPECIAL STUDIES, COMPLIMENTARY(Available through ADB Office of External Relations)
—Devendra Chhetry, September 2004No. 58 Monetary Poverty Estimates in Sri Lanka:
Selected Issues—Neranjana Gunetilleke and DinushkaSenanayake, October 2004
No. 59 Labor Market Distortions, Rural-Urban Inequality,and the Opening of People’s Republic of China’sEconomy—Thomas Hertel and Fan Zhai, November 2004
No. 60 Measuring Competitiveness in the World’s SmallestEconomies: Introducing the SSMECI—Ganeshan Wignaraja and David Joiner, November2004
No. 61 Foreign Exchange Reserves, Exchange RateRegimes, and Monetary Policy: Issues in Asia—Akiko Terada-Hagiwara, January 2005
No. 62 A Small Macroeconometric Model of the PhilippineEconomy—Geoffrey Ducanes, Marie Anne Cagas, Duo Qin,Pilipinas Quising, and Nedelyn Magtibay-Ramos,January 2005
No. 63 Developing the Market for Local Currency Bondsby Foreign Issuers: Lessons from Asia—Tobias Hoschka, February 2005
No. 64 Empirical Assessment of Sustainability andFeasibility of Government Debt: The PhilippinesCase—Duo Qin, Marie Anne Cagas, Geoffrey Ducanes,Nedelyn Magtibay-Ramos, and Pilipinas Quising,February 2005
No. 65 Poverty and Foreign AidEvidence from Cross-Country Data—Abuzar Asra, Gemma Estrada, Yangseom Kim,and M. G. Quibria, March 2005
No. 66 Measuring Efficiency of Macro Systems: AnApplication to Millennium Development GoalAttainment—Ajay Tandon, March 2005
No. 67 Banks and Corporate Debt Market Development—Paul Dickie and Emma Xiaoqin Fan, April 2005
No. 68 Local Currency Financing—The Next Frontier forMDBs?—Tobias C. Hoschka, April 2005
No. 69 Export or Domestic-Led Growth in Asia?—Jesus Felipe and Joseph Lim, May 2005
No. 70 Policy Reform in Viet Nam and the AsianDevelopment Bank’s State-owned EnterpriseReform and Corporate Governance Program Loan—George Abonyi, August 2005
No. 71 Policy Reform in Thailand and the Asian Develop-ment Bank’s Agricultural Sector Program Loan—George Abonyi, September 2005
No. 72 Can the Poor Benefit from the Doha Agenda? TheCase of Indonesia—Douglas H. Brooks and Guntur Sugiyarto,October 2005
No. 73 Impacts of the Doha Development Agenda onPeople’s Republic of China: The Role ofComplementary Education Reforms—Fan Zhai and Thomas Hertel, October 2005
No. 74 Growth and Trade Horizons for Asia: Long-termForecasts for Regional Integration—David Roland-Holst, Jean-Pierre Verbiest, andFan Zhai, November 2005
No. 75 Macroeconomic Impact of HIV/AIDS in the Asianand Pacific Region—Ajay Tandon, November 2005

25
OLD MONOGRAPH SERIES(Available through ADB Office of External Relations; Free of charge)
EDRC REPORT SERIES (ER)
No. 1 ASEAN and the Asian Development Bank—Seiji Naya, April 1982
No. 2 Development Issues for the Developing Eastand Southeast Asian Countriesand International Cooperation—Seiji Naya and Graham Abbott, April 1982
No. 3 Aid, Savings, and Growth in the Asian Region—J. Malcolm Dowling and Ulrich Hiemenz,
April 1982No. 4 Development-oriented Foreign Investment
and the Role of ADB—Kiyoshi Kojima, April 1982
No. 5 The Multilateral Development Banksand the International Economy’s MissingPublic Sector—John Lewis, June 1982
No. 6 Notes on External Debt of DMCs—Evelyn Go, July 1982
No. 7 Grant Element in Bank Loans—Dal Hyun Kim, July 1982
No. 8 Shadow Exchange Rates and StandardConversion Factors in Project Evaluation—Peter Warr, September 1982
No. 9 Small and Medium-Scale ManufacturingEstablishments in ASEAN Countries:Perspectives and Policy Issues—Mathias Bruch and Ulrich Hiemenz, January1983
No. 10 A Note on the Third Ministerial Meeting of GATT—Jungsoo Lee, January 1983
No. 11 Macroeconomic Forecasts for the Republicof China, Hong Kong, and Republic of Korea—J.M. Dowling, January 1983
No. 12 ASEAN: Economic Situation and Prospects—Seiji Naya, March 1983
No. 13 The Future Prospects for the DevelopingCountries of Asia—Seiji Naya, March 1983
No. 14 Energy and Structural Change in the Asia-Pacific Region, Summary of the ThirteenthPacific Trade and Development Conference—Seiji Naya, March 1983
No. 15 A Survey of Empirical Studies on Demandfor Electricity with Special Emphasis on PriceElasticity of Demand—Wisarn Pupphavesa, June 1983
No. 16 Determinants of Paddy Production in Indonesia:1972-1981–A Simultaneous Equation ModelApproach—T.K. Jayaraman, June 1983
No. 17 The Philippine Economy: EconomicForecasts for 1983 and 1984—J.M. Dowling, E. Go, and C.N. Castillo, June1983
No. 18 Economic Forecast for Indonesia—J.M. Dowling, H.Y. Kim, Y.K. Wang,
and C.N. Castillo, June 1983No. 19 Relative External Debt Situation of Asian
Developing Countries: An Applicationof Ranking Method—Jungsoo Lee, June 1983
No. 20 New Evidence on Yields, Fertilizer Application,and Prices in Asian Rice Production—William James and Teresita Ramirez, July 1983
No. 21 Inflationary Effects of Exchange RateChanges in Nine Asian LDCs—Pradumna B. Rana and J. Malcolm Dowling, Jr.,December 1983
No. 22 Effects of External Shocks on the Balanceof Payments, Policy Responses, and DebtProblems of Asian Developing Countries—Seiji Naya, December 1983
No. 23 Changing Trade Patterns and Policy Issues:The Prospects for East and Southeast AsianDeveloping Countries—Seiji Naya and Ulrich Hiemenz, February 1984
No. 24 Small-Scale Industries in Asian EconomicDevelopment: Problems and Prospects—Seiji Naya, February 1984
No. 25 A Study on the External Debt IndicatorsApplying Logit Analysis—Jungsoo Lee and Clarita Barretto, February 1984
No. 26 Alternatives to Institutional Credit Programsin the Agricultural Sector of Low-IncomeCountries—Jennifer Sour, March 1984
No. 27 Economic Scene in Asia and Its Special Features—Kedar N. Kohli, November 1984
No. 28 The Effect of Terms of Trade Changes on theBalance of Payments and Real NationalIncome of Asian Developing Countries—Jungsoo Lee and Lutgarda Labios, January 1985
No. 29 Cause and Effect in the World Sugar Market:Some Empirical Findings 1951-1982—Yoshihiro Iwasaki, February 1985
No. 30 Sources of Balance of Payments Problemin the 1970s: The Asian Experience—Pradumna Rana, February 1985
No. 31 India’s Manufactured Exports: An Analysisof Supply Sectors—Ifzal Ali, February 1985
No. 32 Meeting Basic Human Needs in AsianDeveloping Countries—Jungsoo Lee and Emma Banaria, March 1985
No. 33 The Impact of Foreign Capital Inflowon Investment and Economic Growthin Developing Asia—Evelyn Go, May 1985
No. 34 The Climate for Energy Developmentin the Pacific and Asian Region:Priorities and Perspectives—V.V. Desai, April 1986
No. 35 Impact of Appreciation of the Yen onDeveloping Member Countries of the Bank—Jungsoo Lee, Pradumna Rana, and Ifzal Ali,May 1986
No. 36 Smuggling and Domestic Economic Policiesin Developing Countries—A.H.M.N. Chowdhury, October 1986
No. 37 Public Investment Criteria: Economic InternalRate of Return and Equalizing Discount Rate—Ifzal Ali, November 1986
No. 38 Review of the Theory of Neoclassical PoliticalEconomy: An Application to Trade Policies—M.G. Quibria, December 1986
No. 39 Factors Influencing the Choice of Location:Local and Foreign Firms in the Philippines—E.M. Pernia and A.N. Herrin, February 1987
No. 40 A Demographic Perspective on DevelopingAsia and Its Relevance to the Bank—E.M. Pernia, May 1987
No. 41 Emerging Issues in Asia and Social CostBenefit Analysis—I. Ali, September 1988
No. 42 Shifting Revealed Comparative Advantage:Experiences of Asian and Pacific Developing

26
No. 1 International Reserves:Factors Determining Needs and Adequacy—Evelyn Go, May 1981
No. 2 Domestic Savings in Selected DevelopingAsian Countries—Basil Moore, assisted by A.H.M. NuruddinChowdhury, September 1981
No. 3 Changes in Consumption, Imports and Exportsof Oil Since 1973: A Preliminary Survey ofthe Developing Member Countriesof the Asian Development Bank—Dal Hyun Kim and Graham Abbott, September1981
No. 4 By-Passed Areas, Regional Inequalities,and Development Policies in SelectedSoutheast Asian Countries—William James, October 1981
No. 5 Asian Agriculture and Economic Development—William James, March 1982
No. 6 Inflation in Developing Member Countries:An Analysis of Recent Trends—A.H.M. Nuruddin Chowdhury and J. MalcolmDowling, March 1982
No. 7 Industrial Growth and Employment inDeveloping Asian Countries: Issues andPerspectives for the Coming Decade
ECONOMIC STAFF PAPERS (ES)
Countries—P.B. Rana, November 1988
No. 43 Agricultural Price Policy in Asia:Issues and Areas of Reforms—I. Ali, November 1988
No. 44 Service Trade and Asian Developing Economies—M.G. Quibria, October 1989
No. 45 A Review of the Economic Analysis of PowerProjects in Asia and Identification of Areasof Improvement—I. Ali, November 1989
No. 46 Growth Perspective and Challenges for Asia:Areas for Policy Review and Research—I. Ali, November 1989
No. 47 An Approach to Estimating the PovertyAlleviation Impact of an Agricultural Project—I. Ali, January 1990
No. 48 Economic Growth Performance of Indonesia,the Philippines, and Thailand:The Human Resource Dimension—E.M. Pernia, January 1990
No. 49 Foreign Exchange and Fiscal Impact of a Project:A Methodological Framework for Estimation—I. Ali, February 1990
No. 50 Public Investment Criteria: Financialand Economic Internal Rates of Return—I. Ali, April 1990
No. 51 Evaluation of Water Supply Projects:An Economic Framework—Arlene M. Tadle, June 1990
No. 52 Interrelationship Between Shadow Prices, ProjectInvestment, and Policy Reforms:An Analytical Framework—I. Ali, November 1990
No. 53 Issues in Assessing the Impact of Projectand Sector Adjustment Lending—I. Ali, December 1990
No. 54 Some Aspects of Urbanizationand the Environment in Southeast Asia—Ernesto M. Pernia, January 1991
No. 55 Financial Sector and EconomicDevelopment: A Survey—Jungsoo Lee, September 1991
No. 56 A Framework for Justifying Bank-AssistedEducation Projects in Asia: A Reviewof the Socioeconomic Analysisand Identification of Areas of Improvement—Etienne Van De Walle, February 1992
No. 57 Medium-term Growth-StabilizationRelationship in Asian Developing Countriesand Some Policy Considerations—Yun-Hwan Kim, February 1993
No. 58 Urbanization, Population Distribution,and Economic Development in Asia—Ernesto M. Pernia, February 1993
No. 59 The Need for Fiscal Consolidation in Nepal:The Results of a Simulation—Filippo di Mauro and Ronald Antonio Butiong,July 1993
No. 60 A Computable General Equilibrium Modelof Nepal—Timothy Buehrer and Filippo di Mauro, October1993
No. 61 The Role of Government in Export Expansionin the Republic of Korea: A Revisit—Yun-Hwan Kim, February 1994
No. 62 Rural Reforms, Structural Change,and Agricultural Growth inthe People’s Republic of China—Bo Lin, August 1994
No. 63 Incentives and Regulation for Pollution Abatementwith an Application to Waste Water Treatment—Sudipto Mundle, U. Shankar, and ShekharMehta, October 1995
No. 64 Saving Transitions in Southeast Asia—Frank Harrigan, February 1996
No. 65 Total Factor Productivity Growth in East Asia:A Critical Survey—Jesus Felipe, September 1997
No. 66 Foreign Direct Investment in Pakistan:Policy Issues and Operational Implications—Ashfaque H. Khan and Yun-Hwan Kim, July1999
No. 67 Fiscal Policy, Income Distribution and Growth—Sailesh K. Jha, November 1999
—Ulrich Hiemenz, March 1982No. 8 Petrodollar Recycling 1973-1980.
Part 1: Regional Adjustments andthe World Economy—Burnham Campbell, April 1982
No. 9 Developing Asia: The Importanceof Domestic Policies—Economics Office Staff under the direction of SeijiNaya, May 1982
No. 10 Financial Development and HouseholdSavings: Issues in Domestic ResourceMobilization in Asian Developing Countries—Wan-Soon Kim, July 1982
No. 11 Industrial Development: Role of SpecializedFinancial Institutions—Kedar N. Kohli, August 1982
No. 12 Petrodollar Recycling 1973-1980.Part II: Debt Problems and an Evaluationof Suggested Remedies—Burnham Campbell, September 1982
No. 13 Credit Rationing, Rural Savings, and FinancialPolicy in Developing Countries—William James, September 1982
No. 14 Small and Medium-Scale ManufacturingEstablishments in ASEAN Countries:Perspectives and Policy Issues

27
—Mathias Bruch and Ulrich Hiemenz, March 1983No. 15 Income Distribution and Economic
Growth in Developing Asian Countries—J. Malcolm Dowling and David Soo, March 1983
No. 16 Long-Run Debt-Servicing Capacity ofAsian Developing Countries: An Applicationof Critical Interest Rate Approach—Jungsoo Lee, June 1983
No. 17 External Shocks, Energy Policy,and Macroeconomic Performance of AsianDeveloping Countries: A Policy Analysis—William James, July 1983
No. 18 The Impact of the Current Exchange RateSystem on Trade and Inflation of SelectedDeveloping Member Countries—Pradumna Rana, September 1983
No. 19 Asian Agriculture in Transition: Key Policy Issues—William James, September 1983
No. 20 The Transition to an Industrial Economyin Monsoon Asia—Harry T. Oshima, October 1983
No. 21 The Significance of Off-Farm Employmentand Incomes in Post-War East Asian Growth—Harry T. Oshima, January 1984
No. 22 Income Distribution and Poverty in SelectedAsian Countries—John Malcolm Dowling, Jr., November 1984
No. 23 ASEAN Economies and ASEAN EconomicCooperation—Narongchai Akrasanee, November 1984
No. 24 Economic Analysis of Power Projects—Nitin Desai, January 1985
No. 25 Exports and Economic Growth in the Asian Region—Pradumna Rana, February 1985
No. 26 Patterns of External Financing of DMCs—E. Go, May 1985
No. 27 Industrial Technology Developmentthe Republic of Korea—S.Y. Lo, July 1985
No. 28 Risk Analysis and Project Selection:A Review of Practical Issues—J.K. Johnson, August 1985
No. 29 Rice in Indonesia: Price Policy and ComparativeAdvantage—I. Ali, January 1986
No. 30 Effects of Foreign Capital Inflowson Developing Countries of Asia—Jungsoo Lee, Pradumna B. Rana, and YoshihiroIwasaki, April 1986
No. 31 Economic Analysis of the EnvironmentalImpacts of Development Projects—John A. Dixon et al., EAPI, East-West Center,August 1986
No. 32 Science and Technology for Development:Role of the Bank—Kedar N. Kohli and Ifzal Ali, November 1986
No. 33 Satellite Remote Sensing in the Asianand Pacific Region—Mohan Sundara Rajan, December 1986
No. 34 Changes in the Export Patterns of Asian andPacific Developing Countries: An EmpiricalOverview—Pradumna B. Rana, January 1987
No. 35 Agricultural Price Policy in Nepal—Gerald C. Nelson, March 1987
No. 36 Implications of Falling Primary CommodityPrices for Agricultural Strategy in the Philippines—Ifzal Ali, September 1987
No. 37 Determining Irrigation Charges: A Framework—Prabhakar B. Ghate, October 1987
No. 38 The Role of Fertilizer Subsidies in AgriculturalProduction: A Review of Select Issues—M.G. Quibria, October 1987
No. 39 Domestic Adjustment to External Shocksin Developing Asia—Jungsoo Lee, October 1987
No. 40 Improving Domestic Resource Mobilizationthrough Financial Development: Indonesia—Philip Erquiaga, November 1987
No. 41 Recent Trends and Issues on Foreign DirectInvestment in Asian and Pacific DevelopingCountries—P.B. Rana, March 1988
No. 42 Manufactured Exports from the Philippines:A Sector Profile and an Agenda for Reform—I. Ali, September 1988
No. 43 A Framework for Evaluating the EconomicBenefits of Power Projects—I. Ali, August 1989
No. 44 Promotion of Manufactured Exports in Pakistan—Jungsoo Lee and Yoshihiro Iwasaki, September1989
No. 45 Education and Labor Markets in Indonesia:A Sector Survey—Ernesto M. Pernia and David N. Wilson,September 1989
No. 46 Industrial Technology Capabilitiesand Policies in Selected ADCs—Hiroshi Kakazu, June 1990
No. 47 Designing Strategies and Policiesfor Managing Structural Change in Asia—Ifzal Ali, June 1990
No. 48 The Completion of the Single European CommunityMarket in 1992: A Tentative Assessment of itsImpact on Asian Developing Countries—J.P. Verbiest and Min Tang, June 1991
No. 49 Economic Analysis of Investment in Power Systems—Ifzal Ali, June 1991
No. 50 External Finance and the Role of MultilateralFinancial Institutions in South Asia:Changing Patterns, Prospects, and Challenges—Jungsoo Lee, November 1991
No. 51 The Gender and Poverty Nexus: Issues andPolicies—M.G. Quibria, November 1993
No. 52 The Role of the State in Economic Development:Theory, the East Asian Experience,and the Malaysian Case—Jason Brown, December 1993
No. 53 The Economic Benefits of Potable Water SupplyProjects to Households in Developing Countries—Dale Whittington and Venkateswarlu Swarna,January 1994
No. 54 Growth Triangles: Conceptual Issuesand Operational Problems—Min Tang and Myo Thant, February 1994
No. 55 The Emerging Global Trading Environmentand Developing Asia—Arvind Panagariya, M.G. Quibria, and NarhariRao, July 1996
No. 56 Aspects of Urban Water and Sanitation inthe Context of Rapid Urbanization inDeveloping Asia—Ernesto M. Pernia and Stella LF. Alabastro,September 1997
No. 57 Challenges for Asia’s Trade and Environment—Douglas H. Brooks, January 1998
No. 58 Economic Analysis of Health Sector Projects-A Review of Issues, Methods, and Approaches—Ramesh Adhikari, Paul Gertler, and AnneliLagman, March 1999
No. 59 The Asian Crisis: An Alternate View—Rajiv Kumar and Bibek Debroy, July 1999
No. 60 Social Consequences of the Financial Crisis inAsia—James C. Knowles, Ernesto M. Pernia, and MaryRacelis, November 1999

28
No. 1 Estimates of the Total External Debt ofthe Developing Member Countries of ADB:1981-1983—I.P. David, September 1984
No. 2 Multivariate Statistical and GraphicalClassification Techniques Appliedto the Problem of Grouping Countries—I.P. David and D.S. Maligalig, March 1985
No. 3 Gross National Product (GNP) MeasurementIssues in South Pacific Developing MemberCountries of ADB—S.G. Tiwari, September 1985
No. 4 Estimates of Comparable Savings in SelectedDMCs—Hananto Sigit, December 1985
No. 5 Keeping Sample Survey Designand Analysis Simple—I.P. David, December 1985
No. 6 External Debt Situation in AsianDeveloping Countries—I.P. David and Jungsoo Lee, March 1986
No. 7 Study of GNP Measurement Issues in theSouth Pacific Developing Member Countries.Part I: Existing National Accountsof SPDMCs–Analysis of Methodologyand Application of SNA Concepts—P. Hodgkinson, October 1986
No. 8 Study of GNP Measurement Issues in the SouthPacific Developing Member Countries.Part II: Factors Affecting IntercountryComparability of Per Capita GNP—P. Hodgkinson, October 1986
No. 9 Survey of the External Debt Situation
STATISTICAL REPORT SERIES (SR)
in Asian Developing Countries, 1985—Jungsoo Lee and I.P. David, April 1987
No. 10 A Survey of the External Debt Situationin Asian Developing Countries, 1986—Jungsoo Lee and I.P. David, April 1988
No. 11 Changing Pattern of Financial Flows to Asianand Pacific Developing Countries—Jungsoo Lee and I.P. David, March 1989
No. 12 The State of Agricultural Statistics inSoutheast Asia—I.P. David, March 1989
No. 13 A Survey of the External Debt Situationin Asian and Pacific Developing Countries:1987-1988—Jungsoo Lee and I.P. David, July 1989
No. 14 A Survey of the External Debt Situation inAsian and Pacific Developing Countries: 1988-1989—Jungsoo Lee, May 1990
No. 15 A Survey of the External Debt Situationin Asian and Pacific Developing Countries: 1989-1992—Min Tang, June 1991
No. 16 Recent Trends and Prospects of External DebtSituation and Financial Flows to Asianand Pacific Developing Countries—Min Tang and Aludia Pardo, June 1992
No. 17 Purchasing Power Parity in Asian DevelopingCountries: A Co-Integration Test—Min Tang and Ronald Q. Butiong, April 1994
No. 18 Capital Flows to Asian and Pacific DevelopingCountries: Recent Trends and Future Prospects—Min Tang and James Villafuerte, October 1995
No. 1 Poverty in the People’s Republic of China:Recent Developments and Scopefor Bank Assistance—K.H. Moinuddin, November 1992
No. 2 The Eastern Islands of Indonesia: An Overviewof Development Needs and Potential—Brien K. Parkinson, January 1993
No. 3 Rural Institutional Finance in Bangladeshand Nepal: Review and Agenda for Reforms—A.H.M.N. Chowdhury and Marcelia C. Garcia,November 1993
No. 4 Fiscal Deficits and Current Account Imbalancesof the South Pacific Countries:A Case Study of Vanuatu—T.K. Jayaraman, December 1993
No. 5 Reforms in the Transitional Economies of Asia—Pradumna B. Rana, December 1993
No. 6 Environmental Challenges in the People’s Republicof China and Scope for Bank Assistance—Elisabetta Capannelli and Omkar L. Shrestha,December 1993
No. 7 Sustainable Development Environmentand Poverty Nexus—K.F. Jalal, December 1993
No. 8 Intermediate Services and EconomicDevelopment: The Malaysian Example—Sutanu Behuria and Rahul Khullar, May 1994
No. 9 Interest Rate Deregulation: A Brief Surveyof the Policy Issues and the Asian Experience—Carlos J. Glower, July 1994
No. 10 Some Aspects of Land Administrationin Indonesia: Implications for Bank Operations—Sutanu Behuria, July 1994
No. 11 Demographic and Socioeconomic Determinantsof Contraceptive Use among Urban Women inthe Melanesian Countries in the South Pacific:A Case Study of Port Vila Town in Vanuatu—T.K. Jayaraman, February 1995
No. 12 Managing Development throughInstitution Building— Hilton L. Root, October 1995
No. 13 Growth, Structural Change, and OptimalPoverty Interventions—Shiladitya Chatterjee, November 1995
No. 14 Private Investment and MacroeconomicEnvironment in the South Pacific IslandCountries: A Cross-Country Analysis—T.K. Jayaraman, October 1996
No. 15 The Rural-Urban Transition in Viet Nam:Some Selected Issues—Sudipto Mundle and Brian Van Arkadie, October1997
No. 16 A New Approach to Setting the FutureTransport Agenda—Roger Allport, Geoff Key, and Charles Melhuish,June 1998
No. 17 Adjustment and Distribution:The Indian Experience—Sudipto Mundle and V.B. Tulasidhar, June 1998
No. 18 Tax Reforms in Viet Nam: A Selective Analysis—Sudipto Mundle, December 1998
No. 19 Surges and Volatility of Private Capital Flows toAsian Developing Countries: Implicationsfor Multilateral Development Banks—Pradumna B. Rana, December 1998
No. 20 The Millennium Round and the Asian Economies:An Introduction—Dilip K. Das, October 1999
No. 21 Occupational Segregation and the GenderEarnings Gap—Joseph E. Zveglich, Jr. and Yana van der MeulenRodgers, December 1999
No. 22 Information Technology: Next Locomotive ofGrowth?—Dilip K. Das, June 2000
OCCASIONAL PAPERS (OP)

29
SERIALS(Available commercially through ADB Office of External Relations)
1. Asian Development Outlook (ADO; annual)$36.00 (paperback)
2. Key Indicators of Developing Asian and Pacific Countries (KI; annual)$35.00 (paperback)
3. Asian Development Review (ADR; semiannual)$5.00 per issue; $8.00 per year (2 issues)
FROM OXFORD UNIVERSITY PRESS:Oxford University Press (China) Ltd18th Floor, Warwick House EastTaikoo Place, 979 King’s RoadQuarry Bay, Hong KongTel (852) 2516 3222Fax (852) 2565 8491E-mail: [email protected]: www.oupchina.com.hk
1. Informal Finance: Some Findings from AsiaPrabhu Ghate et. al., 1992$15.00 (paperback)
2. Mongolia: A Centrally Planned Economyin TransitionAsian Development Bank, 1992$15.00 (paperback)
3. Rural Poverty in Asia, Priority Issues and PolicyOptionsEdited by M.G. Quibria, 1994$25.00 (paperback)
4. Growth Triangles in Asia: A New Approachto Regional Economic CooperationEdited by Myo Thant, Min Tang, and Hiroshi Kakazu1st ed., 1994 $36.00 (hardbound)Revised ed., 1998 $55.00 (hardbound)
5. Urban Poverty in Asia: A Survey of Critical IssuesEdited by Ernesto Pernia, 1994$18.00 (paperback)
6. Critical Issues in Asian Development:Theories, Experiences, and PoliciesEdited by M.G. Quibria, 1995$15.00 (paperback)$36.00 (hardbound)
7. Financial Sector Development in AsiaEdited by Shahid N. Zahid, 1995$50.00 (hardbound)
8. Financial Sector Development in Asia: Country StudiesEdited by Shahid N. Zahid, 1995$55.00 (hardbound)
9. Fiscal Management and Economic Reformin the People’s Republic of ChinaChristine P.W. Wong, Christopher Heady, and Wing T.Woo, 1995$15.00 (paperback)
10. From Centrally Planned to Market Economies:The Asian ApproachEdited by Pradumna B. Rana and Naved Hamid, 1995Vol. 1: Overview$36.00 (hardbound)Vol. 2: People’s Republic of China and Mongolia$50.00 (hardbound)Vol. 3: Lao PDR, Myanmar, and Viet Nam$50.00 (hardbound)
11. Current Issues in Economic Development:An Asian PerspectiveEdited by M.G. Quibria and J. Malcolm Dowling, 1996$50.00 (hardbound)
12. The Bangladesh Economy in TransitionEdited by M.G. Quibria, 1997$20.00 (hardbound)
13. The Global Trading System and Developing AsiaEdited by Arvind Panagariya, M.G. Quibria,and Narhari Rao, 1997$55.00 (hardbound)
14. Social Sector Issues in Transitional Economies of AsiaEdited by Douglas H. Brooks and Myo Thant, 1998$25.00 (paperback)$55.00 (hardbound)
15. Intergovernmental Fiscal Transfers in Asia: CurrentPractice and Challenges for the FutureEdited by Yun-Hwan Kim and Paul Smoke, 2003$15.00 (paperback)
16. Local Government Finance and Bond MarketsEdited by Yun-Hwan Kim, 2003$15.00 (paperback)
FROM EDWARD ELGAR:Marston Book Services LimitedPO Box 269, AbingdonOxon OX14 4YN, United KingdomTel +44 1235 465500Fax +44 1235 465555Email: [email protected]: www.marston.co.uk
1. Reducing Poverty in Asia: Emerging Issues in Growth,Targeting, and MeasurementEdited by Christopher M. Edmonds, 2003
FROM PALGRAVE MACMILLAN:Palgrave Macmillan LtdHoundmills, BasingstokeHampshire RG21 6XS, United KingdomTel: +44 (0)1256 329242Fax: +44 (0)1256 479476Email: [email protected]: www.palgrave.com/home/
1. Competition Policy and Development in AsiaEdited by Douglas H. Brooks and Simon Evenett, 2005
2. Managing FDI in a Globalizing EconomyAsian ExperiencesEdited by Douglas H. Brooks and Hal Hill, 2004
3. Poverty, Growth, and Institutions in Developing AsiaEdited by Ernesto M. Pernia and Anil B. Deolalikar,2003
SPECIAL STUDIES, CO-PUBLISHED(Available commercially through Oxford University Press Offices, Edward Elgar Publishing, andPalgrave MacMillan)

30
1. Rural Poverty in Developing AsiaEdited by M.G. QuibriaVol. 1: Bangladesh, India, and Sri Lanka, 1994$35.00 (paperback)Vol. 2: Indonesia, Republic of Korea, Philippines,and Thailand, 1996$35.00 (paperback)
2. Gender Indicators of Developing Asian and PacificCountriesAsian Development Bank, 1993$25.00 (paperback)
3. External Shocks and Policy Adjustments: Lessons fromthe Gulf CrisisEdited by Naved Hamid and Shahid N. Zahid, 1995$15.00 (paperback)
4. Indonesia-Malaysia-Thailand Growth Triangle:Theory to PracticeEdited by Myo Thant and Min Tang, 1996$15.00 (paperback)
5. Emerging Asia: Changes and ChallengesAsian Development Bank, 1997$30.00 (paperback)
6. Asian ExportsEdited by Dilip Das, 1999$35.00 (paperback)$55.00 (hardbound)
7. Development of Environment Statistics in DevelopingAsian and Pacific CountriesAsian Development Bank, 1999$30.00 (paperback)
8. Mortgage-Backed Securities Markets in AsiaEdited by S.Ghon Rhee & Yutaka Shimomoto, 1999$35.00 (paperback)
9. Rising to the Challenge in Asia: A Study of FinancialMarketsAsian Development BankVol. 1: An Overview, 2000 $20.00 (paperback)Vol. 2: Special Issues, 1999 $15.00 (paperback)Vol. 3: Sound Practices, 2000 $25.00 (paperback)Vol. 4: People’s Republic of China, 1999 $20.00(paperback)Vol. 5: India, 1999 $30.00 (paperback)Vol. 6: Indonesia, 1999 $30.00 (paperback)Vol. 7: Republic of Korea, 1999 $30.00 (paperback)Vol. 8: Malaysia, 1999 $20.00 (paperback)Vol. 9: Pakistan, 1999 $30.00 (paperback)Vol. 10: Philippines, 1999 $30.00 (paperback)Vol. 11: Thailand, 1999 $30.00 (paperback)Vol. 12: Socialist Republic of Viet Nam, 1999 $30.00(paperback)
10. Corporate Governance and Finance in East Asia:A Study of Indonesia, Republic of Korea, Malaysia,Philippines and ThailandJ. Zhuang, David Edwards, D. Webb, & Ma. VirginitaCapulong
Vol. 1: A Consolidated Report, 2000 $10.00 (paperback)Vol. 2: Country Studies, 2001 $15.00 (paperback)
11. Financial Management and Governance IssuesAsian Development Bank, 2000Cambodia $10.00 (paperback)People’s Republic of China $10.00 (paperback)Mongolia $10.00 (paperback)Pakistan $10.00 (paperback)Papua New Guinea $10.00 (paperback)Uzbekistan $10.00 (paperback)Viet Nam $10.00 (paperback)Selected Developing Member Countries $10.00 (paperback)
12. Government Bond Market Development in AsiaEdited by Yun-Hwan Kim, 2001$25.00 (paperback)
13. Intergovernmental Fiscal Transfers in Asia: Current Practiceand Challenges for the FutureEdited by Paul Smoke and Yun-Hwan Kim, 2002$15.00 (paperback)
14. Guidelines for the Economic Analysis of ProjectsAsian Development Bank, 1997$10.00 (paperback)
15. Guidelines for the Economic Analysis ofTelecommunications ProjectsAsian Development Bank, 1997$10.00 (paperback)
16. Handbook for the Economic Analysis of Water Supply ProjectsAsian Development Bank, 1999$10.00 (hardbound)
17. Handbook for the Economic Analysis of Health Sector ProjectsAsian Development Bank, 2000$10.00 (paperback)
18. Handbook for Integrating Povery Impact Assessment inthe Economic Analysis of ProjectsAsian Development Bank, 2001$10.00 (paperback)
19. Handbook for Integrating Risk Analysis in the EconomicAnalysis of ProjectsAsian Development Bank, 2002$10.00 (paperback)
20. Handbook on Environment StatisticsAsian Development Bank, 2002$10.00 (hardback)
21. Defining an Agenda for Poverty Reduction, Volume 1Edited by Christopher Edmonds and Sara Medina, 2002$15.00 (paperback)
22. Defining an Agenda for Poverty Reduction, Volume 2Edited by Isabel Ortiz, 2002$15.00 (paperback)
23. Economic Analysis of Policy-based Operations: KeyDimensionsAsian Development Bank, 2003$10.00 (paperback)
SPECIAL STUDIES, IN-HOUSE(Available commercially through ADB Office of External Relations)