Embed Size (px)
Citation preview

University of Pretoria
Department of Economics Working Paper Series
Debt Sustainability and Financial Crises in South Africa Ruthira Naraidoo University of Pretoria
Leroi Raputsoane South African Reserve Bank
Working Paper: 2013-52
September 2013
__________________________________________________________
Department of Economics
University of Pretoria
0002, Pretoria
South Africa
Tel: +27 12 420 2413

0
Debt sustainability and financial crises in South Africa
Ruthira Naraidoo*
and
Leroi Raputsoane**
September 2013
Abstract
This study assesses debt sustainability in South Africa allowing for possible nonlinearities in
the form of threshold behaviour by fiscal authorities. A long historical data series on the debt-
to-GDP ratio and models with fixed and time-varying thresholds allowing the level of debt to
vary relative to its recent history and the occurrence of financial crises are used in the
analysis. First, the results reveal that fiscal consolidation occurs at a much lower debt-to-GDP
ratio of 46 percent in the period 1946 to 2010 compared to 65 percent in the period 1865 to
1945. Secondly, the results provide evidence of a statistically insignificant fiscal
consolidation below these threshold levels. Thirdly, the results reveal that fiscal consolidation
occur at a higher debt-to-GDP ratio during financial crises periods.
JEL: C22, C51, E62, H63
Keywords: Sovereign debt, thresholds, financial crisis
* Department of Economics, University of Pretoria, Pretoria, 0002, South Africa. Phone: +27
12 420 3729, Fax: +27 12 362 5207. E-mail: [email protected]
** Research Department, South African Reserve Bank, Pretoria, 0001, South Africa. Phone:
+27 12 313 3273, Fax: +27 12 313 3925. E-mail: [email protected]

1
1. Introduction
The recent sovereign debt crisis has drawn attention to the excessive and unsustainable debt
levels in many countries. The rising debt levels are attributed to the massive bailouts of
financial institutions and the responses by governments to stimulate economic growth
following the recent financial crisis. They are also attributed to the high public sector wage
and pension commitments and the generally imprudent fiscal management in some countries.
The rising sovereign bond yields due to high debt levels brought some European countries to
the brink of default. The bond yields in these countries rose substantially making it
impossible to repay or roll over government debt necessitating assistance of third parties. The
essential ingredient of debt sustainability is solvency or the ability of a country to service its
debt in the long run. Bohn (2007, 2008) argues that sustainability of the intertemporal
government budget requires government policies to be consistent with the present value of
the budget constraint such that the present value of government expenditures equals the
present value of its revenues.
Policymakers, lenders and borrowers are consistently confronted with the difficulty of
determining the optimal level of indebtedness for the economy. According to Cecchetti et al.
(2011), this is because government debt as a percentage of GDP has historically been high in
many countries while economies have continued to grow providing the means to raise the
revenues to finance the debt obligations, ensuring debt sustainability. Cottarelli et al. (2010)
also argue that debt related vulnerabilities are also not homogeneous across countries at a
given level of the ratio of debt to GDP. Some countries default at relatively low debt levels
while others are able to sustain much higher debt levels with little risk of default. The debt
sustainability assessment program of the World Bank and the International Monetary Fund

2
classifies countries into different categories and uses indicative thresholds for debt burden
based on the countries’ policy performance. This is because countries with weak policies and
institutions tend to face debt repayment problems at lower levels of debt burden. The
composition of domestic and externally held debt as well as the countries’ membership in a
monetary union have also been cited as important indicators of sustainability of sovereign
debt by Gros (2011) and Bolton and Jeanne (2011), respectively.
The world’s biggest credit ratings agencies Standard and Poor’s, Moody’s and Fitch have
recently downgraded South Africa’s sovereign debt rating citing the weak government's
institutional strength, weak economic performance, labour tensions coupled with high
unemployment, increasing external imbalances as potential threats to fiscal consolidation.
Although there is evidence of relatively sound fiscal outcomes in the last decade, South
Africa has historically recorded high debt levels with the general government gross debt as a
percentage of GDP reaching levels above 140 percent in 1900 and just below 120 percent
during World War II based on the Carmen Reinhart and Rogoff data. The International
Monetary Fund world economic outlook database of April 2013 shows that, in the past
decade, South Africa’s government net borrowing as a percentage of GDP averaged 2.0
percent, while the gross debt averaged about 34.5 percent. It projects a slight improvement in
general government borrowing but remains sceptical about the government gross
indebtedness going forward, predicting that it is likely to reach 44.8 percent in 2016.
This study assesses debt sustainability in South Africa allowing for possible nonlinearities in
the form of threshold behaviour by fiscal authorities. It uses a long historical data series on
the debt-to-GDP ratio for South Africa and estimates models with fixed and time-varying
thresholds allowing the level of debt to vary relative to its recent history and the occurrence

3
of financial crises. The occurrence of financial crises is captured using a composite measure
of the world financial crises that takes into account the incidences of instability in banking,
currency, stock markets, debt, and inflation. Sarno (2001) argues that linear models are likely
to be too restrictive to adequately capture the asymmetries that may exist in the debt to GDP
ratio and suggests the use of non-linear debt sustainability methods. As a result, the nonlinear
approach to estimating government debt sustainability has gained popularity in empirical
literature. Chortareas et al. (2008) use the nonlinear unit root tests, Arghyrou and Luintel
(2007) use threshold revenue-expenditure models, while Yilanci and Ozcan (2008) use the
threshold autoregressive model. Legrenzi and Milas (2010) use non-linear error-correction
models. Time-varying coefficients fiscal sustainability models are used by Fincke and
Greiner (2011). Legrenzi and Milas (2011) and Chang and Chiang (2012) use smooth
transition models, while Baum et al. (2013) use a dynamic threshold panel methods.
The subject of the threshold beyond which government debt consolidation should occur is
contested in academic and policy circles. This debate has recently been reignited by Herndon
et al. (2013) who found a calculation error in the study by Reinhart and Rogoff (2010) whose
results suggest that real GDP growth begins to fall when government debt to GDP ratios
exceed 90 percent and when external debt reaches 60 percent of GDP in advanced and
emerging economies. A relook at the thresholds levels by Reinhart and Rogoff (2012) and
Reinhart et al. (2012) suggest that economic growth declines by 1.0 percent in the US and
averages 2.3 percent at debt to GDP ratios above 90 percent in advanced economies
compared to the average of 2.2 percent obtained by Herndon et al. (2013). The findings in
Reinhart and Rogoff (2010) are consistent with the findings in most of the literature that
measure debt sustainability thresholds. This includes Cordella et al. (2005) whose results
reveal that the level of indebtedness above which the marginal effect of government debt on
4
economic growth becomes negative, or debt overhang threshold, is between 15 and 30
percent and the level above which the marginal effect of debt on growth becomes zero, or the
debt irrelevance threshold, is around 70 to 80 percent.
The findings in Reinhart and Rogoff (2010a) are also consistent with Cecchetti et al. (2011)
who suggest that the threshold at which indebtedness begins to be hazardous to an economy
is 85 percent of GDP for government and households, while it is around 90 percent for
corporates in 18 OECD countries. Checherita and Rother (2010) provide evidence of a
turning point beyond which the ratio of government debt to GDP has negative impact on
long-term growth is at the thresholds of about 90 to 100 percent of GDP growth in twelve
EMU countries. Legrenzi and Milas (2011) measure debt sustainability for GIIPS countries
and find thresholds close to Reinhart and Rogoff (2010a) of 88 percent for Greece and 93
percent for Italy. The empirical results by Baum et al. (2013) suggest that GDP growth
decreases to around zero and loses significance at debt to GDP ratios above 67 percent and
that additional debt has a negative impact on economic activity at debt to GDP ratios above
95 percent. Using a variant to the Reinhart and Rogoff dataset and nonlinear threshold
models, Egert (2012) provide evidence that the negative nonlinear effect begins at much
lower levels of the ratio of public debt to GDP between 20 percent and 60 percent.
Several empirical studies provide evidence of historically sustainable fiscal policy in South
Africa. Among these studies, Lusinyan and Thornton (2009) provide evidence that
government revenue and spending supports the presence of a weak deficit sustainability
condition using unit root and cointegration tests. Jibao et al. (2012) test the asymmetry
between fiscal revenue and expenditure using the extended linear intertemporal budget
constraint rule and a smooth transition error correction framework. They find that

5
government responds faster to budget deficits than surpluses and that stabilisation measures
are neutral at deficit levels of 4 percent of GDP. Burger et al. (2012) estimate a fiscal reaction
function to establish how the government reacts to debt and provide evidence that a
sustainable fiscal policy was achieved by reducing the primary deficit and increasing the
surplus in response to rising debt. This paper contributes to the existing literature, firstly, by
using a long historical data series on the debt-to-GDP ratio for South Africa and secondly, by
employing models with fixed and time-varying thresholds that allow the level of debt to vary
relative to its recent history and the occurrence of financial crises.
The next section outlines the methodology and Section 3 discusses the data. Section 4
discusses the empirical results, while section 5 concludes.
2. Empirical debt sustainability models
The nonlinear adjustment of debt-to-GDP ratio when debt grows too high relative to a
threshold, which is not necessarily fixed, is assessed by specifying the following non-linear
models proposed by Terasvirta (1994) and surveyed by Terasvirta (1998) and van Dijk et al.
(2002). Linear unit root tests suggest that the debt-to-GDP ratio is non-stationary. These
results are not reported. However, the details are available from authors upon request. Given
the non-stationarity of debt to GDP ratio, the model is specified as Model 1
( ) ( )( )1 10 1 1 1 2 1 1 1; , 1 ; , ( ) ,t tt t t t t l t td d d d d L dθ θβ β γ τ β γ τ β ε− −− − − − −∆ = + + − + ∆ +
(1)

6
where td is the debt-to-GDP ratio. 1
1 2( ) ...n
l l l l nL L Lβ β β β −= + + + is a measure of persistence
in debt to GDP ratio where 1 1(1)l l
β β≡ . The function ( )1 1; ,t tdθ γ τ− − is the weight on debt to
GDP ratio in period (t-1). τ is the threshold value as defined in (2) such that debt adjustment
is allowed to differ between debt regimes. 1β measures the behavior of policymakers in
period t when debt-to-GDP ratio in the previous period 1td − is expected to be below the
threshold τ , while 2β measures the behavior of policymakers when 1td − is greater than the
threshold τ . A priori, both 1β and 2β are expected to be negative if mean reversion in debt
levels is expected. In the event that 1 2β β= , the model simplifies to a linear specification,
while a there is a tendency for greater reaction to higher debt values when1 2
β β< .
The weight ( )1 1; ,t tdθ γ τ− − is modelled using the following logistic function discussed in van
Dijk et al. (2002)
( )1 ( )1
1 ( )/1 1
11
1; , Pr{ } ,
t dtt dt t
ed d
γ τ σθ τγ τ
− −− −− − −
= −+
= <
(2)
where γ >0 is the smoothness parameter that determines the smoothness of the transition
between regimes. γ is made dimension free by dividing it by the standard deviation of 1td −
following Granger and Terasvirta (1993) and Terasvirta (1994). The transition between
regimes is endogenously determined given that both γ and the threshold τ are estimated
jointly with the remaining parameters.

7
The models specified above assume that changes in the policy makers’ reaction to debt levels
are driven by some fixed debt threshold level. However, this need not be the case. As an
example, at the recent conference hosted by the ECB on the optimal design of fiscal
consolidation programmes (2013), fiscal consolidation was made inevitable in most euro area
countries due to the risk to fiscal sustainability following the sovereign debt crisis. However,
the aggressive fiscal consolidation has resulted in plummeting economic activity and rising
unemployment in some countries. Thus instead of aggressively bringing debt to a particular
threshold level, smoother corrective action towards a time-varying threshold may be
warranted.
To allow for a smoother, rather than abrupt, corrective action, a variant of Model 1, which is
denoted Model 2, is considered. This model is specified as follows
( ) ( )( )1 10 1 1 1 2 1 1 1; , 1 ; , ( ) ,t tt t t t t t t l t td d d d d L dθ θβ β γ τ β γ τ β ε− −− − − − −∆ = + + − + ∆ +
(3)
where the time-varying threshold is of the form
1
1
1(1 )
n
t t j
j
dn
τ µτ µ − −=
= + −
∑ , (4)
This threshold is a linear function of some fixed threshold level of debt-to-GDP ratio and the
lagged debt-to-GDP ratio with corresponding weight of [0,1]µ ∈ and (1 )µ− respectively.
The time-varying threshold implies that the policy maker uses a combination of a fixed
reference level for debt-to-GDP ratio and a moving average of past debt-to-GDP ratio in
evaluating changes in its response to debt. n measures the number years a particular

8
government holds office and runs the economic programs. 5n = is used given that it is
consistent with general practice in South Africa. The values of n up to 8 years were
experimented with but yielded unsatisfactory results. The corresponding logistic function is
as follows
( )1 ( )1
1 ( )/1 1 1
1
11
1
1; , Pr{ (1 ) } ,
t t dtt d
n
t t t t j
j ed d d
nγ τ σ
θ γ τ µτ µ− −
− −− − − − −=
= −+
= < + −
∑
(5)
Fiscal retrenchment can also occur during world financial crises. This is because there may
be reasons in favour of raising the debt threshold in the fear of a greater recession following
financial crises. The risk of a further downgrade by credit rating agencies could lead to a
lower debt ceiling due to possible debt refinancing constraints. To capture this phenomenon,
the time-varying threshold of the following form is posited for Model 3
0 1 _t tfinancial crisisτ τ τ= + , (6)
where 0τ is a fixed threshold similar to that in equation (1). When 1 0τ > , debt is allowed to
bridge its threshold level before corrective action is taken while a 1 0τ < allows for a lower
debt ceiling before debt consolidation is effected. The corresponding logistic function is
specified as follows
( )1 ( )1
1 ( )/1 1 0 1
11
1; , Pr{ _ } ,
t t dtt dt t t t
ed d financial crisis
γ τ σθ γ τ τ τ
− −− −− − −
= −+
= < +
(7)
3. Data description

9
Annual data spanning the period 1865 to 2010 is used. This data is sourced from the Carmen
Reinhart and Kenneth Rogoff website at www.reinhartandrogoff.com/data. Debt to GDP ratio
for South Africa is total gross central government debt. The composite world financial crises
index approximates the occurrence of financial crises by pooling together the world’s 20
largest economies weighted by their relative purchasing power parity based GDP share of
total world GDP. The world financial crises index takes into account the incidences of
instability in banking, currency, stock markets, debt, and inflation. A detailed explanation on
the construction of the variables is available in Reinhart and Rogoff (2009, 2011). The
evolution of the main variables is shown in Figure 1. The descriptive statistics are provided in
Table 1 over the full sample and the two sub-samples spanning 1865 to 1945 and 1946 to
2010.
According to Figure 1, South Africa’s total gross central government debt as a percentage of
GDP reached levels above 140 percent in 1900 and just below 120 percent during the World
War II. The high debt levels declined markedly post World War II reaching a low of 30.6
percent in 1981 and 46.3 percent during the democratic transition in 1994. Debt started rising
again in 1990 and reached a peak of 48.5 percent in 1997. However, it was successfully
reduced to 26.7 percent in 2008 resulting in Government gross debt average of about 34.5
percent between 2000 and 2010. According to Reinhart and Rogoff (2010b) and Caprio and
Klingebiel (2003), South Africa experienced banking crises in 1977 and again during the
recession in 1989, while the national government’s external default episodes occurred in
1985-1987, 1989 and 1993. In post-World War II era, the world financial crises index point
to incidences of financial distress during the banking crisis in 1974, the East European
banking crisis of 1990 and the Asian of 1998. Incidences of financial distress were also

10
experienced during the Argentine banking collapse and the accounting scandals of 2002 as
well as during the recent financial crisis of 2008.
South Africa has achieved relatively sound fiscal outcomes since the political transition and
was able to successfully accomplish fiscal consolidation despite the socio-economic pressures
that came with the democratic transition. Over and above the normal fluctuations in
commodity prices and business cycles, the factors that contributed to volatility in fiscal
outcomes before the political transition include the pre-transition political instability and the
international financial and trade sanctions. However, post the political transition, factors such
as the weak government's institutional strength, the weak economic performance, labour
tensions coupled with high unemployment and increasing external imbalances are some of
the factors that threaten fiscal consolidation according to the world’s biggest credit ratings
agencies Standard and Poor’s, Moody’s and Fitch.
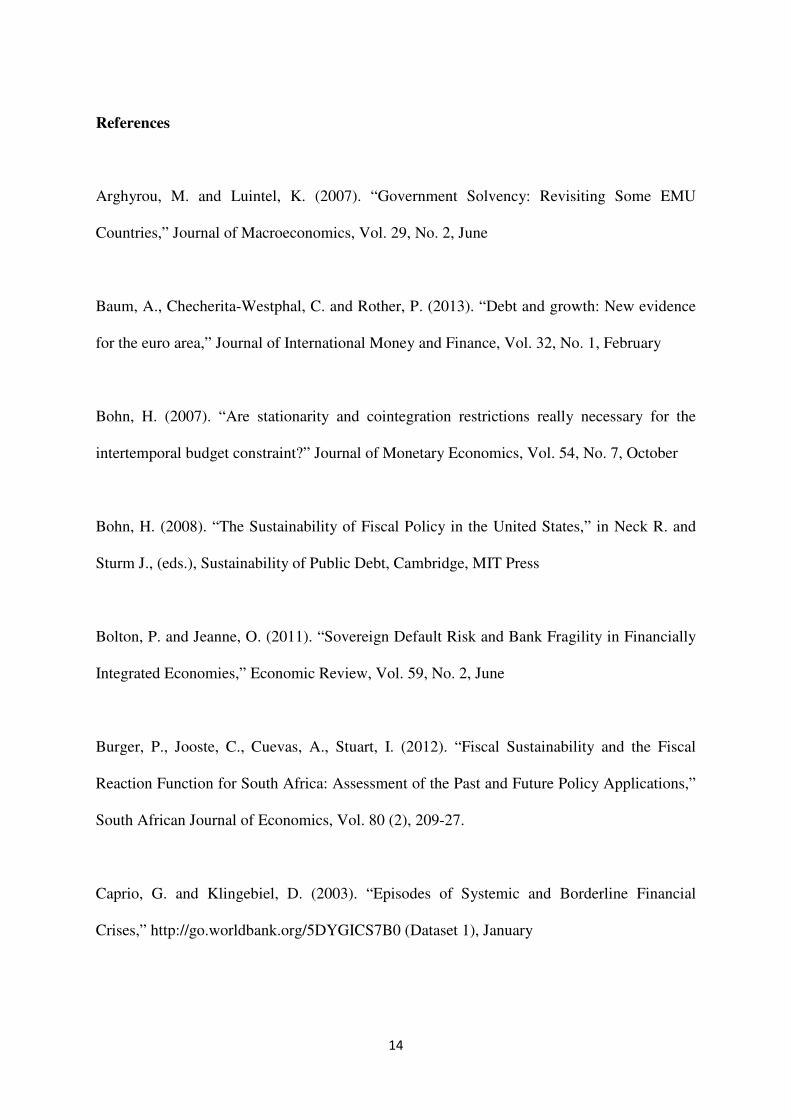
4. Empirical results
The emprirical results are reported in Table 2. The estimation sample is divided into two
sub-samples for the periods 1865 to 1945 and 1946 to 2010. The split in the sample
differentiates the differences in corrective action by fiscal authorities in pre and post-World
War II eras. The results for Model 1, for the sub-ample 1865 to 1945, show a statistically
significant threshold of debt-to-GDP ratio of 65 percent and the threshold of 46 percent for
the sub-sample 1946 to 2010. This represents a remarkable 20 percent difference in the
thresholds of debt-to-GDP ratio above which the fiscal authorities consider fiscal
consolidation. Corrective action to decreasing debt-to-GDP ratio below these thresholds is
statistically insignificant at 5 percent level of significance, while the thresholds above which

11
corrective action by the fiscal authorities takes place is statistically significant in the two sub-
samples as well as the full sample. The fiscal authorities implement corrective action when
debt-to-GDP ratio is above the threshold of 65 percent by decreasing the debt-to-GDP ratio
by 13 percent per annum in the period 1865 to 1945. This is contrary to the period 1946 to
2010 where fiscal adjustment is at the rate of 9 percent per annum when debt-to-GDP ratio is
above the threshold 46 percent. Thus corrective action is greater when debt-to-GDP ratio
increases beyond the threshold level in the period preceding World War II compared to the
post World War II period.
The estimates of Model 2, for sub-sample of 1946-2010, provide empirical results for the
model with time-varying threshold similar to Model 1. The results show that South Africa
maintained the debt-to-GDP threshold of 64 percent over the pre-1946 sub-sample with a 40
percent weight on past debt-GDP ratios against a slightly higher weight of 55 percent to past
debt-to-GDP ratios in the 1946 to 2010 sub-sample.
The empirical results of Model 3, for sample period 1865 to 2010, show the estimates of debt
adjustment in the face of financial crises. These results indicate that the debt ceiling was
raised tremendously during a financial crises (i.e., 1τ =10.1), particularly in the period 1865 to
1945 compared to 1τ =1.02 in the period 1946 to 2010. This contrasts with the stylized fact
that financial crises scenarios have been more prevalent in the post-1945 era. It is also worth
noting that the empirical estimates of the models over the entire sample yield thresholds
estimates of around 56 percent above which the fiscal authorities implement corrective
measures with respect to debt. The models of the post-World War II era are consistently the
preferred models given the higher adjusted 2R and the lower standard error of the regression,
while Model 3, with time-varying threshold and the financial crises variable, is the best

12
model based on the same model selection criteria. All models are robust to the Lin and
Terasvirta (1994) parameter stability test.
Fiscal retrenchment at debt-to-GDP ratio of 46 percent is in stark contrast to the evidence in
many countries. This is particularly the case in developed countries that have maintained
debt-to-GDP ratios well above 100 percent. The International Monetary Fund regards a debt-
to-GDP ratio of 60 percent as a prudential limit in developed countries, while 40 per cent is
the debt-to-GDP ratio that should not be breached on a long-term basis in developing and
emerging economies. The estimated debt-to-GDP ratio threshold of 46 percent for the period
1946 to 2010 is well within the 30 to 50 percent threshold that the International Monetary
Fund recommends for developing countries depending on strength of policies and institutions
in these countries. Although no study explicitly estimates the thresholds above which fiscal
consolidation begins to take effect in South Africa, the findings in this study are consistent
with the view that South Africa has achieved relatively sound fiscal outcomes in the recent
past. For instance, among others, Burger et al. (2012) conclude that the South African
government has run a sustainable fiscal policy by reducing the primary deficit or increasing
the surplus in response to rising debt since 1946, while Jibao et al. (2012) provide evidence
that the South African government responds faster to budget deficits than to surpluses.
5. Conclusion
This study assessed fiscal sustainability in South Africa allowing for possible nonlinearities
in the form of threshold behaviour by policy makers. A long historical data series on the debt-
to-GDP ratio for South Africa spanning the period 1865 to 2010 was used. Models with fixed
and time-varying thresholds that allow the level of debt to vary relative to its recent history

13
and the occurrence of financial crises were estimated. The sample was split into two sub-
sapmples for the period 1865 to 1945 and 1946 to 2010 to distinguish between the corrective
action by fiscal authorities in pre and post-World War II eras. The empirical results reveal a
statistically significant threshold of debt-to-GDP ratio of 65 percent during the period 1865 to
1945, 46 percent in the post-World War era and 56 percent for the full sample period.
The results further provide evidence that the debt ceiling is raised during financial crises,
particularly in the 1865 to 1945 era. This contrasts with the stylised fact that financial crises
scenarios are more prevalent in the post-World War II era. There is evidence of a greater
emphasis on fiscal sustainability in the period preceding 1946 where an increase in debt-to-
GDP ratio above the threshold resulted in stronger fiscal consolidation. Overall, the results
indicate greater fiscal prudence in South Africa and are consistent with the view that South
Africa has achieved relatively sound fiscal outcomes in the recent past despite the socio-
economic pressures that came with the political transition. However, factors such as the weak
government's institutional strength, the weak economic performance, the labour tensions,
high unemployment and increasing external imbalances are threats to fiscal sustainability
according to the world’s biggest credit ratings agencies Standard and Poor’s, Moody’s and
Fitch.
14
References
Arghyrou, M. and Luintel, K. (2007). “Government Solvency: Revisiting Some EMU
Countries,” Journal of Macroeconomics, Vol. 29, No. 2, June
Baum, A., Checherita-Westphal, C. and Rother, P. (2013). “Debt and growth: New evidence
for the euro area,” Journal of International Money and Finance, Vol. 32, No. 1, February
Bohn, H. (2007). “Are stationarity and cointegration restrictions really necessary for the
intertemporal budget constraint?” Journal of Monetary Economics, Vol. 54, No. 7, October
Bohn, H. (2008). “The Sustainability of Fiscal Policy in the United States,” in Neck R. and
Sturm J., (eds.), Sustainability of Public Debt, Cambridge, MIT Press
Bolton, P. and Jeanne, O. (2011). “Sovereign Default Risk and Bank Fragility in Financially
Integrated Economies,” Economic Review, Vol. 59, No. 2, June
Burger, P., Jooste, C., Cuevas, A., Stuart, I. (2012). “Fiscal Sustainability and the Fiscal
Reaction Function for South Africa: Assessment of the Past and Future Policy Applications,”
South African Journal of Economics, Vol. 80 (2), 209-27.
Caprio, G. and Klingebiel, D. (2003). “Episodes of Systemic and Borderline Financial
Crises,” http://go.worldbank.org/5DYGICS7B0 (Dataset 1), January

15
Cecchetti, S., Mohanty, M. and Zampolli, F. (2010). “The Future of Public Debt: Prospects
and Implications,” Working Papers, No. 300, Basel: Bank of International Settlements,
March
Cecchetti, S., Mohanty, M. and Zampolli, F. (2011). “The Real Effects of Debt,” BIS
Working Paper, No. 352, Basel: Bank if International Settlements, September
Chang, T. and Chiang, G. (2012). “Transitional Behavior of Government Debt Ratio on
Growth: The Case of OECD Countries,” Journal for Economic Forecasting, Vol. 15, (2), June
Checherita, C. and Rother, P. (2010). “The impact of high and growing government debt on
economic growth: an empirical investigation for the euro area,” European Economic Review,
Vol. 56, No. 7, October
Chortareas, G., Kapetanios G. and Uctum, M. (2008). “Nonlinear Alternatives to Unit Root
Tests and Public Finances Sustainability: Some Evidence from Latin American and
Caribbean Countries,” Oxford Bulletin of Economics and Statistics, Vol. 70, No. 5, October
Cottarelli, C., Forni, L., Gottschalk, J. and Mauro, P. (2010). “Default in Today’s Advanced
Economies: Unnecessary, Undesirable, and Unlikely,” Staff Position Papers, Washington
DC: International Monetary Fund, September
Cordella, T., Ricci, L. and Ruiz-Arranz, M. (2005). “Debt Overhang or Debt Irrelevance?
Revisiting the Debt Growth Link,” Working Paper, No. 05/223, Washington DC:
International Monetary Fund, December

16
Egert, B. (2012). “Public Debt, Economic Growth and Nonlinear Effects,” Working Paper,
No. 993, Paris: Organisation for Economic Co-operation and Development,
European Central Bank. (2013). “High-Level Roundtable on the Optimal Design of Fiscal
Consolidation Programmes,” Conferences and Seminars, Frankfurt: European Central Bank,
April
Fincke, B. and Greiner, A. (2011). “Debt Sustainability in Selected Euro Area Countries:
Empirical Evidence Estimating Time-Varying Parameters,” Studies in Nonlinear Dynamics
and Econometrics, Vol. 15, No. 3
Granger, C. and Terasvirta, T. (1993). “Modelling Nonlinear Economic Relationships,”
London: Oxford Economic Press
Gros, D. (2011). “External versus Domestic Debt in the Euro Crisis,” Policy brief, No. 243,
Brussels: Centre for European Policy Studies, May
Herndon, T., Ash, M. and Pollin, R. (2013). “Does High Public Debt Consistently Stifle
Economic Growth? A Critique of Reinhart and Rogoff,” Working Paper, No. 322,
Massachusetts: University of Massachusetts Amherst
Jibao, S., Schoeman, N. and Naraidoo, R. (2012). “Fiscal Regime Changes and the
Sustainability of Fiscal Imbalance in South Africa; A Smooth Transition Error-Correction

17
Approach,” South African Journal of Economic and Management Sciences, Vol. 15, No. 2,
112-127. June
Legrenzi, G. and Milas, C. (2011). “Debt Sustainability and Financial Crises: Evidence from
the GIIPS,” Working Paper, No. 42_11, Rimini: The Rimini Centre for Economic Analysis
Legrenzi, G. and Milas, C. (2010). “Spend-and-Tax Adjustments and the Sustainability of the
Government's Intertemporal Budget Constraint,” Working Paper, No. 2926, Munich: CESifo
Group, January
Lin, J. and Terasvirta, T. (1994). “Testing the constancy of regression parameters against
continuous structural change,” Journal of Econometrics, Vol. 62, No. 2, June
Lusinyan, L. and Thorton, J. (2010). “The sustainability of South African fiscal policy: an
historical perspective,” Applied Economics, Vol. 41, No. 7, January
Reinhart, C. and Rogoff, K. (2009). “This Time is Different: Eight Centuries of Financial
Folly," New Jersey: Princeton University Press, July
Reinhart, C. and Rogoff, K. (2010a). “Growth in a Time of Debt,” American Economic
Review, Vol. 100, No. 2, May
Reinhart, C. and Rogoff, K. (2010b). “This Time Is Different Chartbook: Country Histories
on Debt, Default, and Financial Crises,” Working Paper, No. 15815, Massachusetts: National
Bureau of Economic Research, March

18
Reinhart, C. and Rogoff, K. (2011). “From Financial Crash to Debt Crisis,” American
Economic Review, Vol. 101, No. 5, August
Reinhart, C. and Rogoff, K. (2012). “Public Debt Overhangs: Advanced Economy Episodes
Since 1800,” Journal of Economic Perspectives, Vol. 26. No. 3, Summer
Reinhart, C., Reinhart, V. and Rogoff, K. (2012). “Debt Overhangs: Past and Present,”
Working Paper, No. 18015, National Bureau of Economic Research, April
Sarno, L. (2001). “The behavior of US public debt: a nonlinear perspective,” Economics
Letters, Vol. 74, No. 1, December
Terasvirta, T. (1994). “Specification, Estimation and Evaluation of Smooth Transition
Autoregressive Models,” Journal of the American Statistical Association, Vol. 89, No. 425,
March
Terasvirta, T. (1998). “Modelling economic relationships with smooth transition
regressions,” in A. Ullah and D.E.A. Giles (eds.), Handbook of Applied Economic Statistics,
New York: Marcel Dekker, February
Van Dijk, D., Teräsvirta, T. and Franses, P.H. (2002). Smooth Transition Autoregressive
Models: A Survey of Recent Developments. Econometric Reviews, Vol. 21, No. 1

19
Yilanci, V. and Ozcan, B. (2008). “External Debt Sustainability of Turkey: A Nonlinear
Approach,” International Research Journal of Finance and Economics, Vol. 20, October

20
Appendix
Table 1: Descriptive statistics of the main variables
Debt to GDP
ratio
1865-2010
Debt to GDP
ratio
1865-1945
Debt to GDP
ratio
1946-2010
Financial
crises index
1865-2010
Financial
crises index
1865-1945
Financial
crises index
1946-2010
Mean 56.36528 67.53544 43.22121 0.732483 0.743968 0.718172
Median 50.70000 72.70000 43.30000 0.607004 0.605051 0.618900
Maximum 143.4000 143.4000 72.20000 2.436317 2.142546 2.436317
Minimum 8.60000 8.60000 26.90000 0.000000 0.000000 0.007279
Std. Dev. 24.05258 26.52378 10.24238 0.504235 0.523138 0.483296
Skewness 0.503098 -4028800 0.770468 0.999489 0.734495 1.400959
Kurtosis 3.282968 3.440037 3.488916 3.837505 2.934161 5.385688
Jarque-Bera 6.555017 2.774487 7.187179 28.57542 7.297643 36.67691
Probability 0.037722 0.249763 0.027499 0.000001 0.026022 0.000000
21
Table 2: Models estimates
Model 1 1865-1945 1946-2010 1865-2010
0β 6.902 (5.53) 3.618 (2.58) 6.611 (3.92)
1β 0.008 (0.13) -0.097 (0.05) -0.118 (0.10)
2β -0.127 (0.06) -0.091 (0.04) -0.114 (0.05)
lβ 0.023 (0.11) 0.257 (0.12) 0.023 (0.08)
τ 65.21 (30.11) 46.32 (20.91) 56.66 (20.34)
γ 10.53 (-)* 11.69 (-)* 10.95 (-)*
Regression standard error 13.96 2.49 10.783 2R 0.093 0.12 0.04
Parameter stability (p-value) 0.11 0.09 0.10
Model 2 1865-1945 1946-2010 1865-2010
0β 15.428(6.34) 4.017 (2.64) 6.652 (2.56)
1β -0.206 (0.13) -0.109 (0.07) 0.168 (0.40)
2β -0.215 (0.07) -0.097 (0.04) -0.120 (0.04)
lβ 0.051 (0.14) 0.247 (0.118) 0.036 (0.09)
τ 64.32 (20.56) 45.48 (21.56) 57.68 (25.23)
γ 11.23 (-)* 10.21 (-)* 10.01 (-)*
µ 0.60 (-)* 0.55 (-)* 0.40 (-)*
Regression standard error 14.38 2.48 10.90
2R 0.088 0.125 0.045
Parameter stability (p-value) 0.10 0.09 0.11

22
Model 3 1865-1945 1946-2010 1865-2010
0β 7.417 (5.14) 4.479 (2.54) 4.850 (3.88)
1β -0.035 (0.10) -0.122 (0.07) -0.066 (0.09)
2β -0.145 (0.06) -0.105 (0.05) -0.097 (0.04)
lβ 0.370 (0.11) 0.261 (0.12) 0.019 (0.08)
τ 64.12 (25.23) 45.92 (22.56) 57.01 (22.36)
γ 10.66 (-)* 10.15 (-)* 10.55 (-)*
1τ 10.05 (4.69) 1.02 (0.43) 5.52 (2.26)
Regression standard error 13.92 2.47 10.77
2R 0.10 0.128 0.041
Parameter stability (p-value) 0.10 0.10 0.09
Notes: Model 1 is the model with fixed threshold τ and Model 2 and Model 3 are the models with time-
varying thresholds 1
1
1(1 )
n
t t j
j
dn
τ µτ µ − −=
= + −
∑
and 0 1 _t tfinancial crisisτ τ τ= + respectively. Numbers in
parentheses are standard errors. *Imposed value. Van Dijk et al. (2002) argue that the likelihood function is very
insensitive to γ , suggesting that precise estimation of this parameter is unlikely. For this reason, we run a grid
search in the range [0.1, 250] and fix the γ parameter to the one that delivers the best fit of the estimated
models. We set l=1 and n=5 above. In Model 2, estimates of µ are based on a grid search in the [0.1, 0.99]
range. Parameter stability is an F test of parameter stability (see Lin and Terasvirta, 1994).

23
Figure 1: Evolution of the main variables
0
20
40
60
80
100
120
140
160
50 60 70 80 90 00 10 20 30 40 50 60 70 80 90 00 10
Debt-to-GDP (%), 1865-2010
0.0
0.5
1.0
1.5
2.0
2.5
50 60 70 80 90 00 10 20 30 40 50 60 70 80 90 00 10
Index of Financial Crises, 1850-2010