Embed Size (px)
Citation preview
August 2014
Document # LTRT-28704
Session Border Controllers (SBC)
Multi-Service Business Routers (MSBR)
VoIP Analog & Digital Media Gateways
Configuration Note Debug Recording Procedures

Configuration Note Contents
Document #: LTRT-28704 3 Mediant SBCs, Gateways & MSBRs
Table of Contents 1 Introduction ......................................................................................................... 7
2 Debug Recording Modes .................................................................................... 9
2.1 DSP Recording ........................................................................................................ 9 2.1.1 DSP Recording for Mediant 800 MSBR .................................................................. 10
2.2 PSTN Traces .......................................................................................................... 11 2.2.1 ISDN Traces ............................................................................................................ 11 2.2.2 CAS Traces ............................................................................................................. 13 2.2.3 Control Traces ......................................................................................................... 13 2.2.4 Network Traces ........................................................................................................ 13
3 Debug Recording Using Web Interface ........................................................... 15
3.1 Configuring and Activating Debug Recording Server ............................................. 15 3.2 Configuring Debug and Syslog Filtering Rules ...................................................... 16
3.2.1 Filtering IP Network Traces ..................................................................................... 18
4 Debug Recording Using Command Shell ....................................................... 19
4.1 Activating Debug Recording (DR) .......................................................................... 19 4.2 Capturing DSP Traces ........................................................................................... 20 4.3 Capturing ISDN Traces .......................................................................................... 20
4.3.1 Enabling PSTN Traces per Trunk ............................................................................ 21 4.3.1.1 Using the Web Interface ...........................................................................21 4.3.1.2 Using the CLI ............................................................................................21 4.3.1.3 Using the INI File ......................................................................................21
4.4 Capturing Control Packets ..................................................................................... 22 4.5 Capturing T.38 Traffic ............................................................................................ 22 4.6 Capturing SCTP Traffic .......................................................................................... 22 4.7 DR Command Reference ....................................................................................... 23
4.7.1 Client Setup Commands .......................................................................................... 23 4.7.2 Trace Rule Commands ............................................................................................ 23 4.7.3 DR Activation Commands........................................................................................ 26
5 Collecting Debug Recording ............................................................................ 27
5.1 Collecting DR Messages from Device Startup ....................................................... 27 5.2 Collecting DR Messages in Wireshark ................................................................... 27 5.3 Saving DR Messages into Local PCAP File (into Device’s RAM) .......................... 29
Configuration Note 4 Document #: LTRT-28704
Debug Recording
List of Figures Figure 2-1: DSP Record Points ................................................................................................................ 9 Figure 2-2: ISDN Trace Graph in Wireshark .......................................................................................... 11 Figure 3-1: Logging Settings Page ......................................................................................................... 15 Figure 3-2: Logging Filters Table - Add Record Dialog Box ................................................................... 16 Figure 5-1: Viewing DR Messages in Wireshark .................................................................................... 28 Figure 5-2: AFT ...................................................................................................................................... 29 Figure 5-3: AFT-50 ................................................................................................................................. 29 Figure 5-4: DR File From RAM ............................................................................................................... 30 Figure 5-5: Save PCAP File ................................................................................................................... 30
List of Tables Table 3-1: Debug Recording Parameters ............................................................................................... 15 Table 4-1: Client Setup Commands ....................................................................................................... 23 Table 4-2: Trace Rule Commands ......................................................................................................... 23 Table 4-3: DR Activation Commands ..................................................................................................... 26
Configuration Note Notices
Document #: LTRT-28704 5 Mediant SBCs, Gateways & MSBRs
Notice This document describes the Debug Recording functionality. Information contained in this document is believed to be accurate and reliable at the time of printing. However, due to ongoing product improvements and revisions, AudioCodes cannot guarantee the accuracy of printed material after the Date Published nor can it accept responsibility for errors or omissions. Updates to this document and other documents can be viewed by registered customers at http://www.audiocodes.com/downloads.
© Copyright 2014 AudioCodes Ltd. All rights reserved. This document is subject to change without notice.
Date Published: August-25-2014
Trademarks AudioCodes, AC, AudioCoded, Ardito, CTI2, CTI², CTI Squared, HD VoIP, HD VoIP Sounds Better, InTouch, IPmedia, Mediant, MediaPack, NetCoder, Netrake, Nuera, Open Solutions Network, OSN, Stretto, TrunkPack, VMAS, VoicePacketizer, VoIPerfect, VoIPerfectHD, What’s Inside Matters, Your Gateway To VoIP and 3GX are trademarks or registered trademarks of AudioCodes Limited. All other products or trademarks are property of their respective owners. Product specifications are subject to change without notice.
WEEE EU Directive Pursuant to the WEEE EU Directive, electronic and electrical waste must not be disposed of with unsorted waste. Please contact your local recycling authority for disposal of this product.
Customer Support Customer technical support and service are generally provided by AudioCodes’ Distributors, Partners, and Resellers from whom the product was purchased. For technical support for products purchased directly from AudioCodes, or for customers subscribed to AudioCodes Customer Technical Support (ACTS), contact [email protected].
Abbreviations and Terminology Each abbreviation, unless widely used, is spelled out in full when first used.
Documentation Feedback AudioCodes continually strives to produce high quality documentation. If you have any comments (suggestions or errors) regarding this document, please fill out the Documentation Feedback form on our Web site at http://www.audiocodes.com/downloads.

Configuration Note 6 Document #: LTRT-28704
Debug Recording
This page is intentionally left blank
Configuration Note 1. Introduction
Document #: LTRT-28704 7 Mediant SBCs, Gateways & MSBRs
1 Introduction The device enables you to activate debug recording and send debug recording packets to a defined capturing server. When the debug recording is activated, the Debug Recording (DR) mechanism duplicates all messages that are sent and/or received by the device and sends them to an external IP address or file. It is used for advanced debugging when it is required to analyze internal messages and signals. In addition, DR is useful for recording network traffic in environments in which hub / port mirroring isn’t available and to record internal traffic between two endpoints on the same gateway. DR can be used to capture the following message types: Digital signal processor (DSP) recording (see Section 2.1 on page 9):
• RTP/RTCP streams that are sent and/or received by the device. • The actual voice signal (pulse-code modulation / PCM) that:
♦ Arrives from the PSTN/PBX, before it enters the DSP. ♦ Sent from the DSP to the PSTN/PBX.
• Other internal information (such as DSP events and commands). PSTN trace - received/transmitted ISDN, CAS, and SS7 messages (see Section 2.2
on page 11). Control messages – SIP (see Section 2.2.3 on page 13). Networking streams (such as T.38, HTTP and SCTP (see Section 2.2.4 on page 13).
Notes:
• DSP, PSTN, Control and IP recording can be performed simultaneously. • All DR rules that are defined through the CLI are deleted after the device is reset. • DR can be used on a “live” device for debugging. For normal operation (unless
otherwise requested by AudioCodes’ support), DR must be disabled. • DR doesn’t require DSP channels and therefore, can be used when the device
operates at full capacity. • Debug recording is collected only on the device's OAMP interface. • The configuration described in this document is relevant for version 6.6 and
above.

Configuration Note 8 Document #: LTRT-28704
Debug Recording
This page is intentionally left blank.
Configuration Note 2. Debug Recording Modes
Document #: LTRT-28704 9 Mediant SBCs, Gateways & MSBRs
2 Debug Recording Modes This section describes the different DR modes of operation.
2.1 DSP Recording DSP recording should be used for analyzing voice-related issues such as: poor voice quality, echo, and fax / modem transmission. The following messages are recorded per channel: Internal DSP packets and events. Incoming and outgoing RTP / RTCP streams (in the actual voice coder that is used by
the channel). PCM - voice signal that arrives from and are sent to the TDM (before it enters the
DSP). The two streams are sent in G.711 A-law.
Note: DSP recording cannot be used to record T.38 messages. To record T.38 messages, use the AddIPTrafficTrace command (see Section 2.2.4 on page 13).
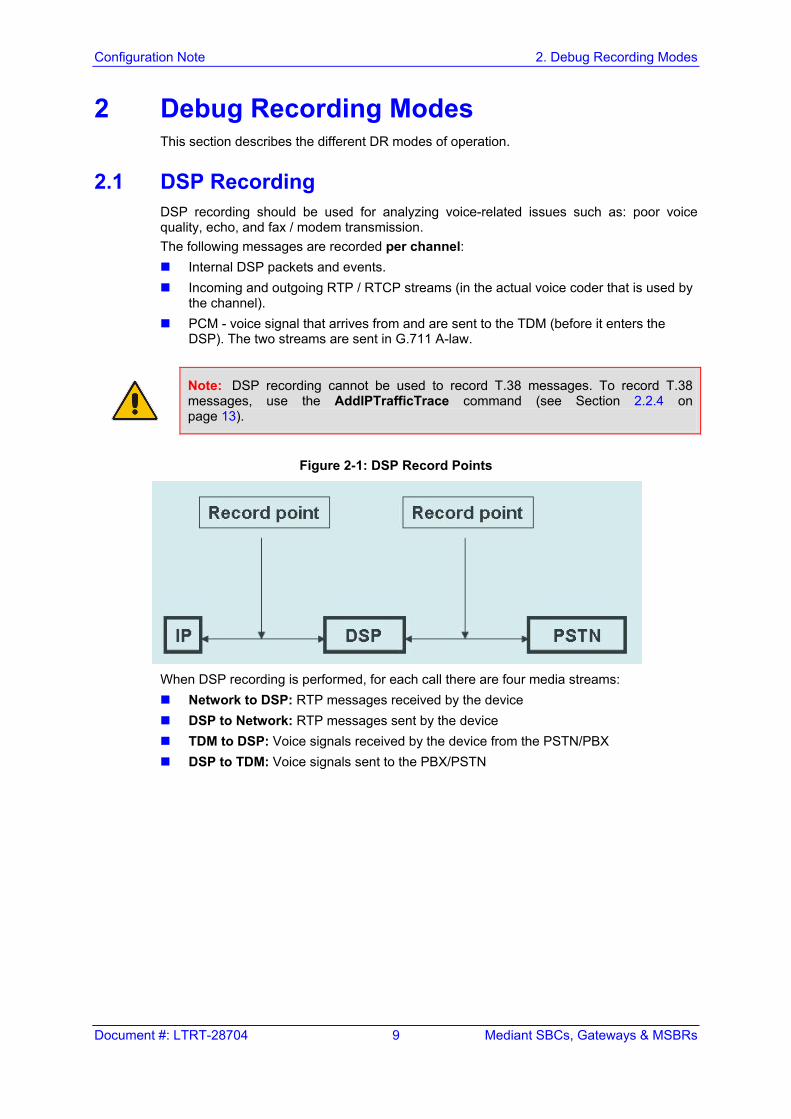
Figure 2-1: DSP Record Points
When DSP recording is performed, for each call there are four media streams: Network to DSP: RTP messages received by the device DSP to Network: RTP messages sent by the device TDM to DSP: Voice signals received by the device from the PSTN/PBX DSP to TDM: Voice signals sent to the PBX/PSTN
Configuration Note 10 Document #: LTRT-28704
Debug Recording
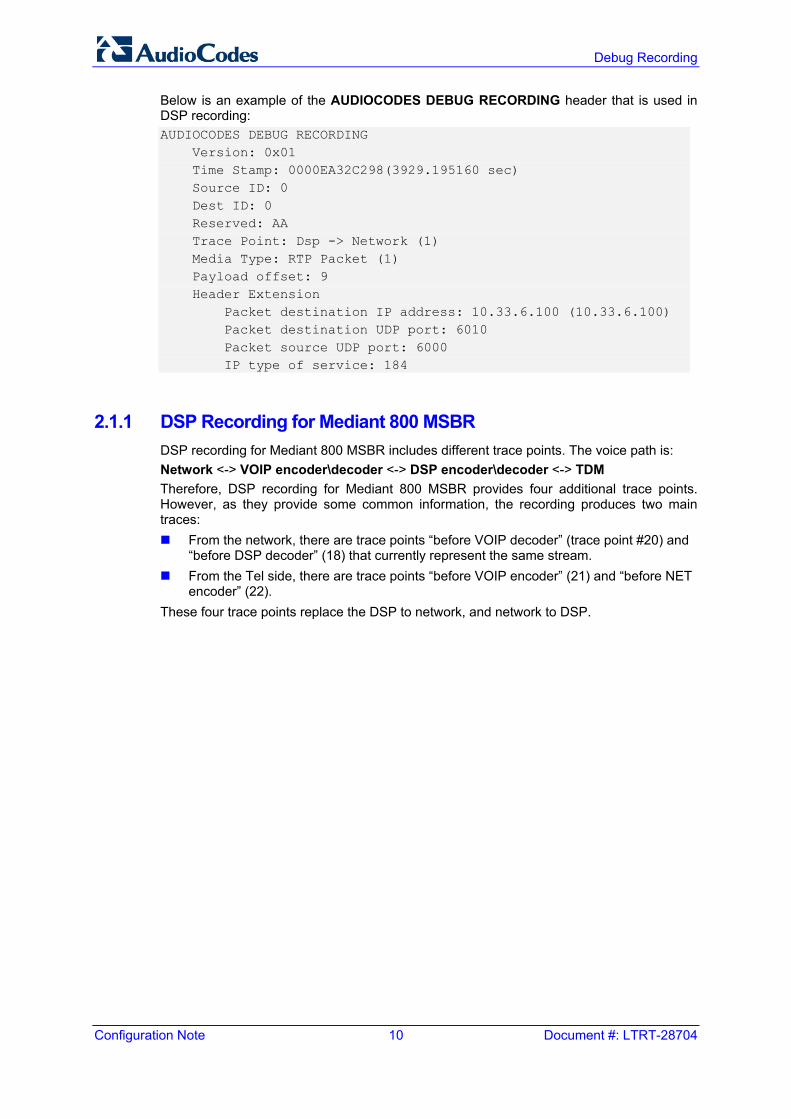
Below is an example of the AUDIOCODES DEBUG RECORDING header that is used in DSP recording: AUDIOCODES DEBUG RECORDING Version: 0x01 Time Stamp: 0000EA32C298(3929.195160 sec) Source ID: 0 Dest ID: 0 Reserved: AA Trace Point: Dsp -> Network (1) Media Type: RTP Packet (1) Payload offset: 9 Header Extension Packet destination IP address: 10.33.6.100 (10.33.6.100) Packet destination UDP port: 6010 Packet source UDP port: 6000 IP type of service: 184
2.1.1 DSP Recording for Mediant 800 MSBR DSP recording for Mediant 800 MSBR includes different trace points. The voice path is: Network <-> VOIP encoder\decoder <-> DSP encoder\decoder <-> TDM Therefore, DSP recording for Mediant 800 MSBR provides four additional trace points. However, as they provide some common information, the recording produces two main traces: From the network, there are trace points “before VOIP decoder” (trace point #20) and
“before DSP decoder” (18) that currently represent the same stream. From the Tel side, there are trace points “before VOIP encoder” (21) and “before NET
encoder” (22). These four trace points replace the DSP to network, and network to DSP.
Configuration Note 2. Debug Recording Modes
Document #: LTRT-28704 11 Mediant SBCs, Gateways & MSBRs
2.2 PSTN Traces PSTN traces record ISDN, CAS and SS7 messages that are exchanged between the device and the PSTN/PBX switch.
Notes: PSTN trace messages can be sent through debug recording or directly to the Syslog. To send PSTN messages to the Syslog server, add the following parameter setting PSTNReserved3=8 to the ini file, and then reset the device.
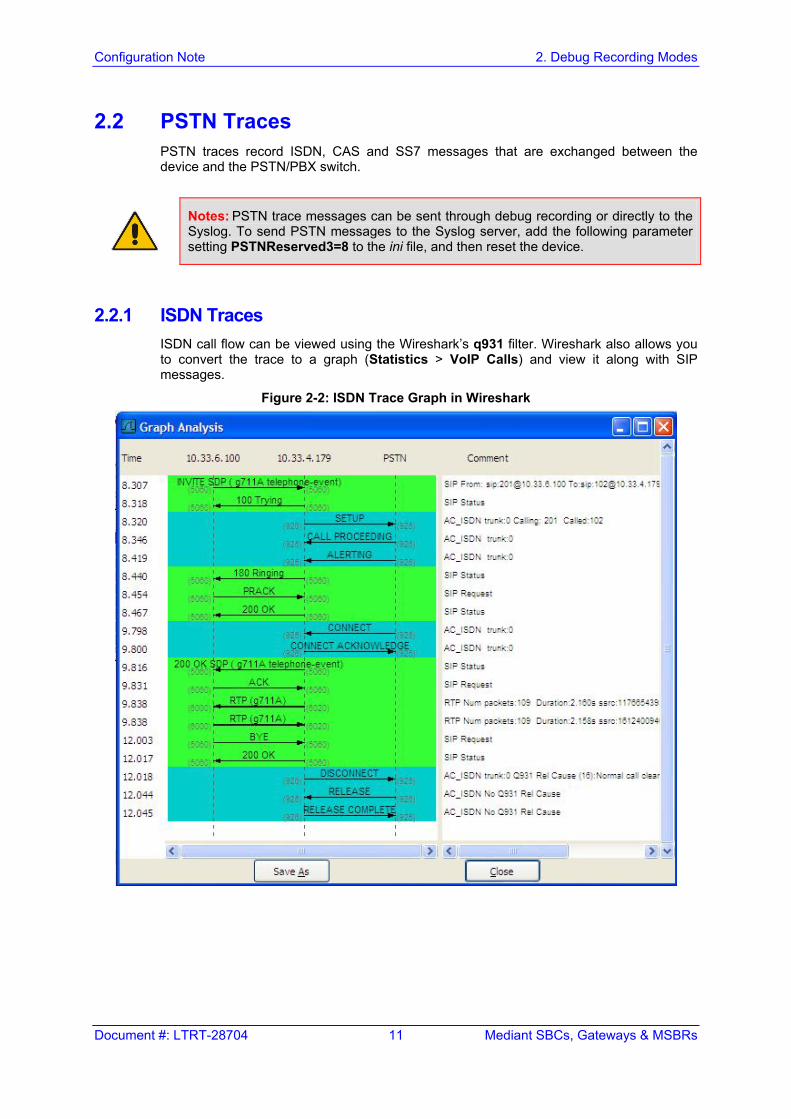
2.2.1 ISDN Traces ISDN call flow can be viewed using the Wireshark’s q931 filter. Wireshark also allows you to convert the trace to a graph (Statistics > VoIP Calls) and view it along with SIP messages.
Figure 2-2: ISDN Trace Graph in Wireshark
Configuration Note 12 Document #: LTRT-28704
Debug Recording
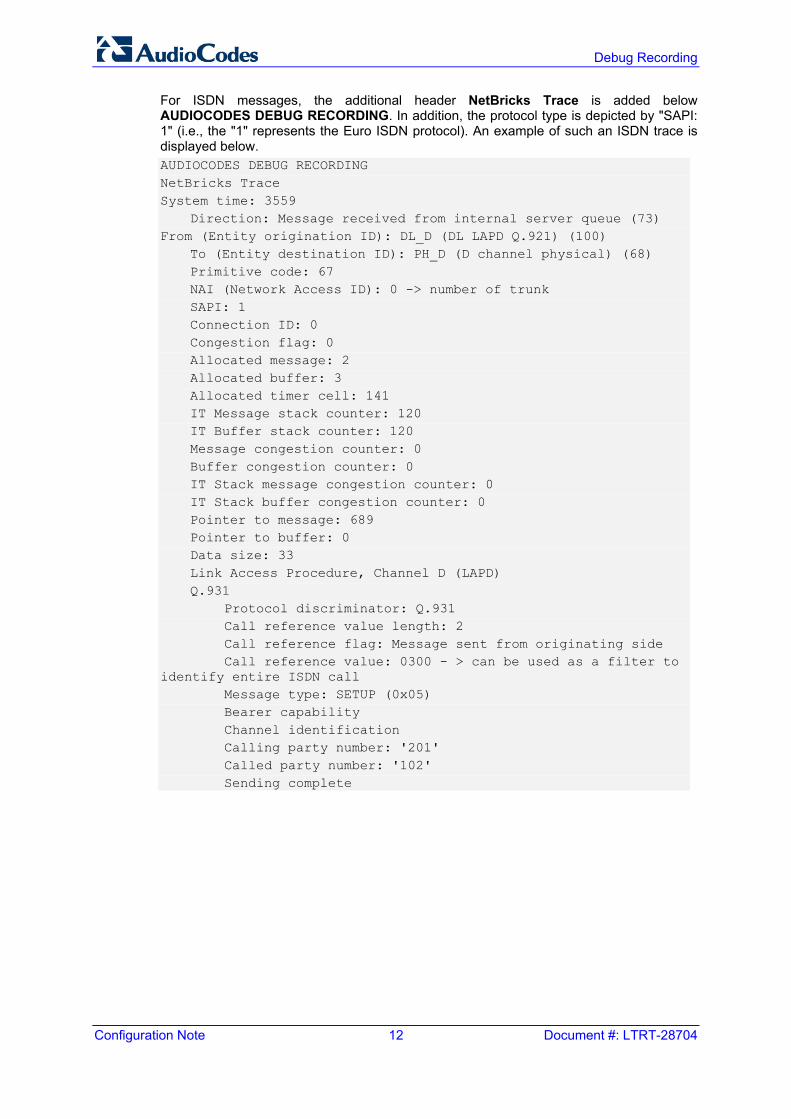
For ISDN messages, the additional header NetBricks Trace is added below AUDIOCODES DEBUG RECORDING. In addition, the protocol type is depicted by "SAPI: 1" (i.e., the "1" represents the Euro ISDN protocol). An example of such an ISDN trace is displayed below. AUDIOCODES DEBUG RECORDING NetBricks Trace System time: 3559 Direction: Message received from internal server queue (73) From (Entity origination ID): DL_D (DL LAPD Q.921) (100) To (Entity destination ID): PH_D (D channel physical) (68) Primitive code: 67 NAI (Network Access ID): 0 -> number of trunk SAPI: 1 Connection ID: 0 Congestion flag: 0 Allocated message: 2 Allocated buffer: 3 Allocated timer cell: 141 IT Message stack counter: 120 IT Buffer stack counter: 120 Message congestion counter: 0 Buffer congestion counter: 0 IT Stack message congestion counter: 0 IT Stack buffer congestion counter: 0 Pointer to message: 689 Pointer to buffer: 0 Data size: 33 Link Access Procedure, Channel D (LAPD) Q.931 Protocol discriminator: Q.931 Call reference value length: 2 Call reference flag: Message sent from originating side Call reference value: 0300 - > can be used as a filter to identify entire ISDN call Message type: SETUP (0x05) Bearer capability Channel identification Calling party number: '201' Called party number: '102' Sending complete
Configuration Note 2. Debug Recording Modes
Document #: LTRT-28704 13 Mediant SBCs, Gateways & MSBRs
2.2.2 CAS Traces CAS traces include the CAS Trace header. The example below shows an example of a CAS trace: AUDIOCODES DEBUG RECORDING CAS Trace Timer: 1145504439 From: DSP (0) Current State: 7 Event: EV_DIAL_ENDED (15) Next State: -1 Function Use: Unknown (-1) Parameter 1: -1 Parameter 2: -1 Parameter 3: -1 Trunk Number: 3 BChannel Number: 23 Call Handle: 0
2.2.3 Control Traces Control traces are used to record incoming and/or outgoing control messages (i.e., SIP).
2.2.4 Network Traces Network traces are used to record any IP stream that isn’t associated with media (RTP/RTCP) according to destination and/or source IP address or port and Layer-4 protocol (UDP, TCP, SCTP or any other IP type as defined by http://www.iana.com). Network traces are typically used to record T.38, SCTP or HTTP.
Note: To record T.38 messages, use the following commands:
• AddIPTrafficTrace host2Net udp a a all all • AddIPTrafficTrace Net2host udp a a all all
Configuration Note 14 Document #: LTRT-28704
Debug Recording
This page is intentionally left blank
Configuration Note 3. Debug Recording Using Web Interface
Document #: LTRT-28704 15 Mediant SBCs, Gateways & MSBRs
3 Debug Recording Using Web Interface This section describes using the Web Interface.
3.1 Configuring and Activating Debug Recording Server This section describes how to configure the Debug Recording server.
To configure and activate debug recording: 1. Open the Logging Settings page (Configuration tab > System menu > Logging >
Logging Settings).
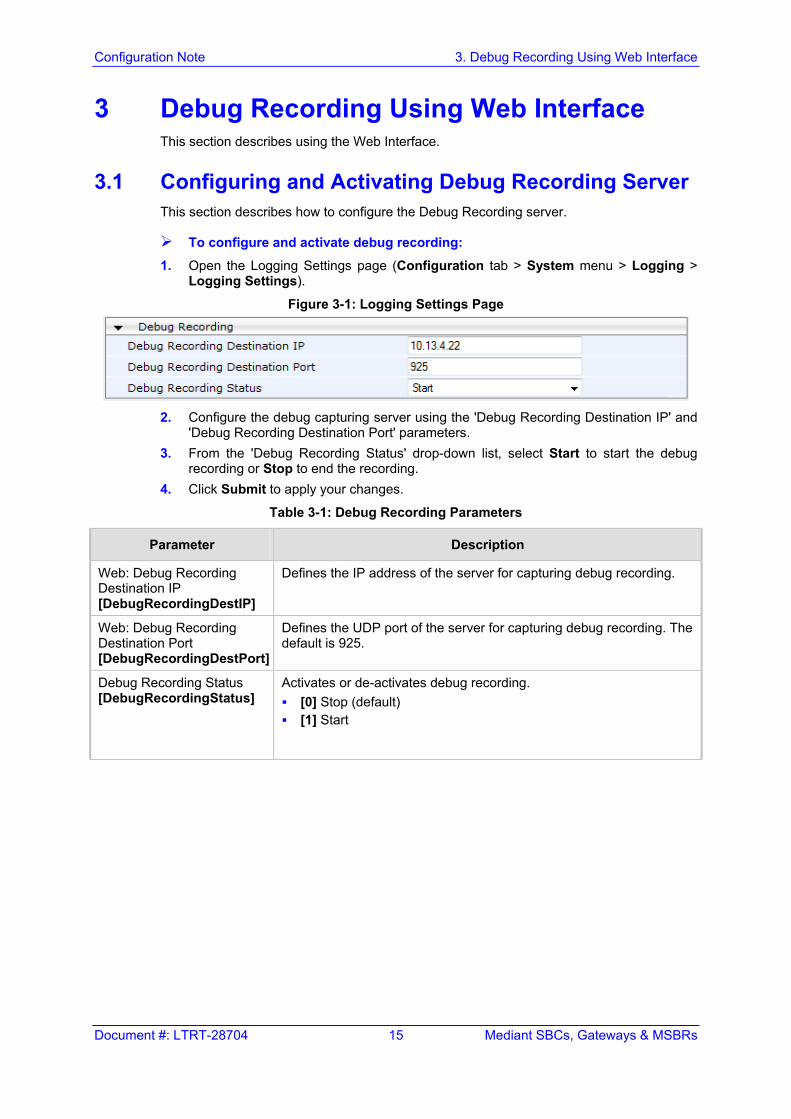
Figure 3-1: Logging Settings Page
2. Configure the debug capturing server using the 'Debug Recording Destination IP' and
'Debug Recording Destination Port' parameters. 3. From the 'Debug Recording Status' drop-down list, select Start to start the debug
recording or Stop to end the recording. 4. Click Submit to apply your changes.
Table 3-1: Debug Recording Parameters
Parameter Description
Web: Debug Recording Destination IP [DebugRecordingDestIP]
Defines the IP address of the server for capturing debug recording.
Web: Debug Recording Destination Port [DebugRecordingDestPort]
Defines the UDP port of the server for capturing debug recording. The default is 925.
Debug Recording Status [DebugRecordingStatus]
Activates or de-activates debug recording. [0] Stop (default) [1] Start
Configuration Note 16 Document #: LTRT-28704
Debug Recording
3.2 Configuring Debug and Syslog Filtering Rules The device can filter Syslog messages and debug recording (DR) packets sent by the device to a Syslog server and packet capturing application (such as Wireshark) respectively. This can be useful to reduce CPU consumption and minimize negative impact on VoIP performance. You can configure up to 30 filtering rules, each based on a selected filtering criteria (e.g., an IP Group). Each filtering criteria can be configured with a range. For example, you can filter Syslog messages for IP Groups 1 through 4. For each filter criteria, you can enable or disable Syslog messages and debug recording. Debug recording can also be filtered using various filtering criteria, such as SIP signaling or signaling and media.
To configure logging filtering rules:
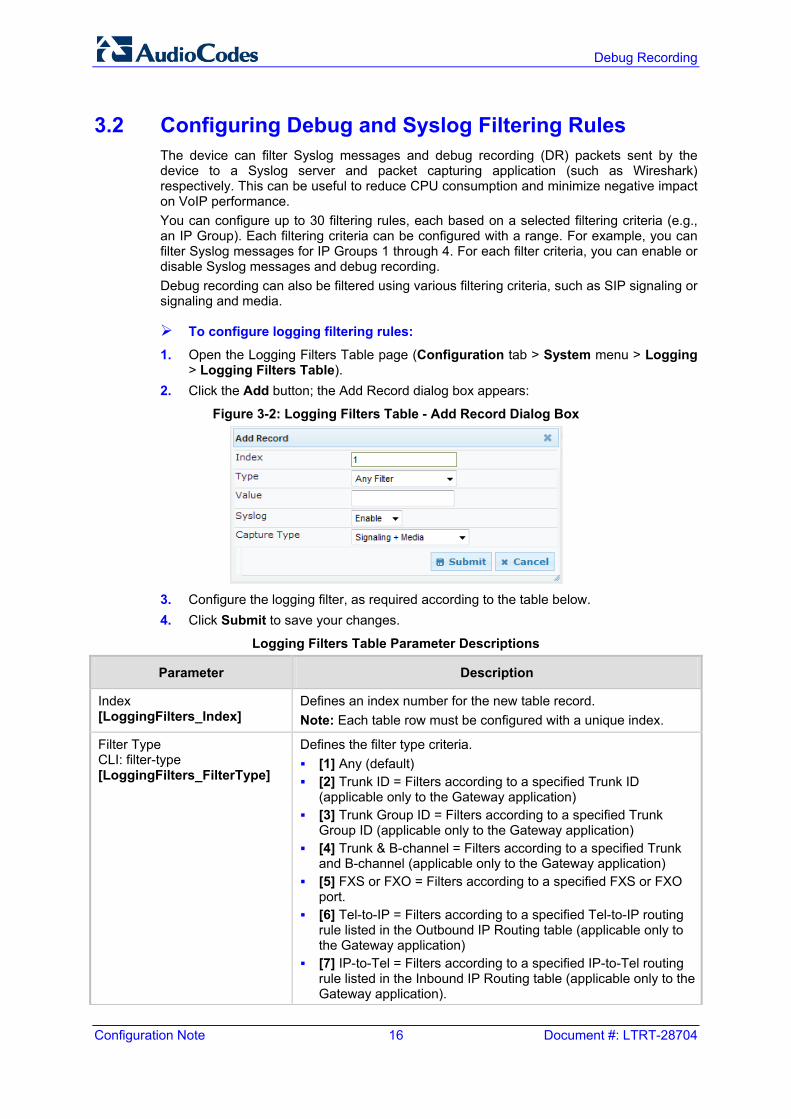
1. Open the Logging Filters Table page (Configuration tab > System menu > Logging > Logging Filters Table).
2. Click the Add button; the Add Record dialog box appears:
Figure 3-2: Logging Filters Table - Add Record Dialog Box
3. Configure the logging filter, as required according to the table below. 4. Click Submit to save your changes.
Logging Filters Table Parameter Descriptions
Parameter Description
Index [LoggingFilters_Index]
Defines an index number for the new table record. Note: Each table row must be configured with a unique index.
Filter Type CLI: filter-type [LoggingFilters_FilterType]
Defines the filter type criteria. [1] Any (default) [2] Trunk ID = Filters according to a specified Trunk ID
(applicable only to the Gateway application) [3] Trunk Group ID = Filters according to a specified Trunk
Group ID (applicable only to the Gateway application) [4] Trunk & B-channel = Filters according to a specified Trunk
and B-channel (applicable only to the Gateway application) [5] FXS or FXO = Filters according to a specified FXS or FXO
port. [6] Tel-to-IP = Filters according to a specified Tel-to-IP routing
rule listed in the Outbound IP Routing table (applicable only to the Gateway application)
[7] IP-to-Tel = Filters according to a specified IP-to-Tel routing rule listed in the Inbound IP Routing table (applicable only to the Gateway application).
Configuration Note 3. Debug Recording Using Web Interface
Document #: LTRT-28704 17 Mediant SBCs, Gateways & MSBRs
Parameter Description
[8] IP Group = Filters according to a specified IP Group ID listed in the IP Group table
[9] SRD = Filters according to a specified SRD ID listed in the SRD table
[10] Classification = Filters according to a specified Classification rule listed in the Classification table (applicable only to the SBC application)
[11] IP-to-IP Routing = Filters according to a specified SBC IP-to-IP routing rule listed in the IP-to-IP Routing table (applicable only to the SBC application)
[12] User = Filters according to a specified user defined by username or user@host.
[13] IP Trace = Filters according to a specified IP network trace wireshark-like expression. For a detailed description on configuring IP traces, see ''Filtering IP Network Traces'' in Section 3.2.1.
Value CLI: value [LoggingFilters_Value]
Defines the value of the selected filtering type in the 'Filter Type' parameter. The value can be the following: A single value A range, using a hyphen "-" between the two values, e.g., "1-3" Multiple, non-contiguous values, using commas "," between
each value, e.g., "1,3,9" Trunks/FXO/FXS pertaining to a module, using the syntax
module number/port or port, for example: "1/2", means module 1, port 2 "1/[2-4]", means module 1, ports 2 through 4
Any to indicate all For IP trace expressions, see ''Filtering IP Network Traces'' in
Section 3.2.1.
Syslog CLI: syslog [LoggingFilters_Syslog]
Enables Syslog messages for the defined logging filter: [0] Disable (default) [1] Enable Note: This parameter is not applicable when 'Filter Type' is set to IP Trace.
Capture Type CLI: capture-type [LoggingFilters_CaptureType]
Enables debug recordings for the defined logging filter and defines what to record: [0] None (default) [1] Signaling = Information related to signaling such as SIP
signaling messages, Syslog, CDR, and the device's internal processing messages.
[2] Signaling & Media = Signaling and media (RTP/RTCP/T.38). [3] Signaling & Media & PCM = Signaling, media, and PCM
(voice signals from and to TDM). [4] PSTN trace = ISDN and CAS traces - applicable only for
Trunk-related filters. Note: This parameter is not applicable when 'Filter Type' is set to IP Trace.
Configuration Note 18 Document #: LTRT-28704
Debug Recording
Notes:
• Open the Syslog Settings page (Configuration tab > System menu > Syslog Settings) and set the 'Enable Syslog' parameter to enable Syslog, and then configure the debug level using the 'Debug Level' parameter.
• The Logging Filters table can also be configured using the table ini file parameter, LoggingFilters.
3.2.1 Filtering IP Network Traces You can filter Syslog and debug recording messages for IP network traces, by setting the 'Filter Type' parameter to IP Trace in the Logging Filters table. IP traces are used to record any IP stream, according to destination and/or source IP address, or port and Layer-4 protocol (UDP, TCP or any other IP type as defined by http://www.iana.com). When the IP Trace option is selected, only the ‘Value’ parameter is applicable; the 'Syslog' and 'Capture Type' parameters are not relevant. The 'Value' parameter configures the Wireshark-like filtering expressions for your IP trace. The following Wireshark-like expressions are supported:
Supported Wireshark-like Expressions for 'Value' Parameter
Expression Description
ip.src, ip.dst Source and destination IP address
ip.addr IP address - up to two IP addresses can be entered
ip.proto IP protocol type (PDU) entered as an enumeration value (e.g., 1 is ICMP, 6 is TCP, 17 is UDP)
udp, tcp, icmp, sip, ldap, http, https Single expressions for protocol type
udp.port, tcp.port Transport layer
udp.srcport, tcp.srcport Transport layer for source port
udp.dstport, tcp.dstport Transport layer for destination port
and, &&, ==, <, > Between expressions
Below are examples of configured expressions for the 'Value' parameter: udp && ip.addr==10.8.6.55 ip.src==10.8.6.55 && udp.port>=5000 and udp.port<6000 ip.dst==10.8.0.1/16 ip.addr==10.8.6.40 For conditions requiring the "or" / "||" expression, add multiple table rows. For example, the Wireshark condition "(ip.src == 1.1.1.1 or ip.src == 2.2.2.2) and ip.dst == 3.3.3.3" can be configured using the following two table row entries: ip.src == 1.1.1.1 and ip.dst == 3.3.3.3 ip.src == 2.2.2.2 and ip.dst == 3.3.3.3
Note: If the 'Value' field is left empty, the device will record all IP traffic types.
Configuration Note 4. Debug Recording Using Command Shell
Document #: LTRT-28704 19 Mediant SBCs, Gateways & MSBRs
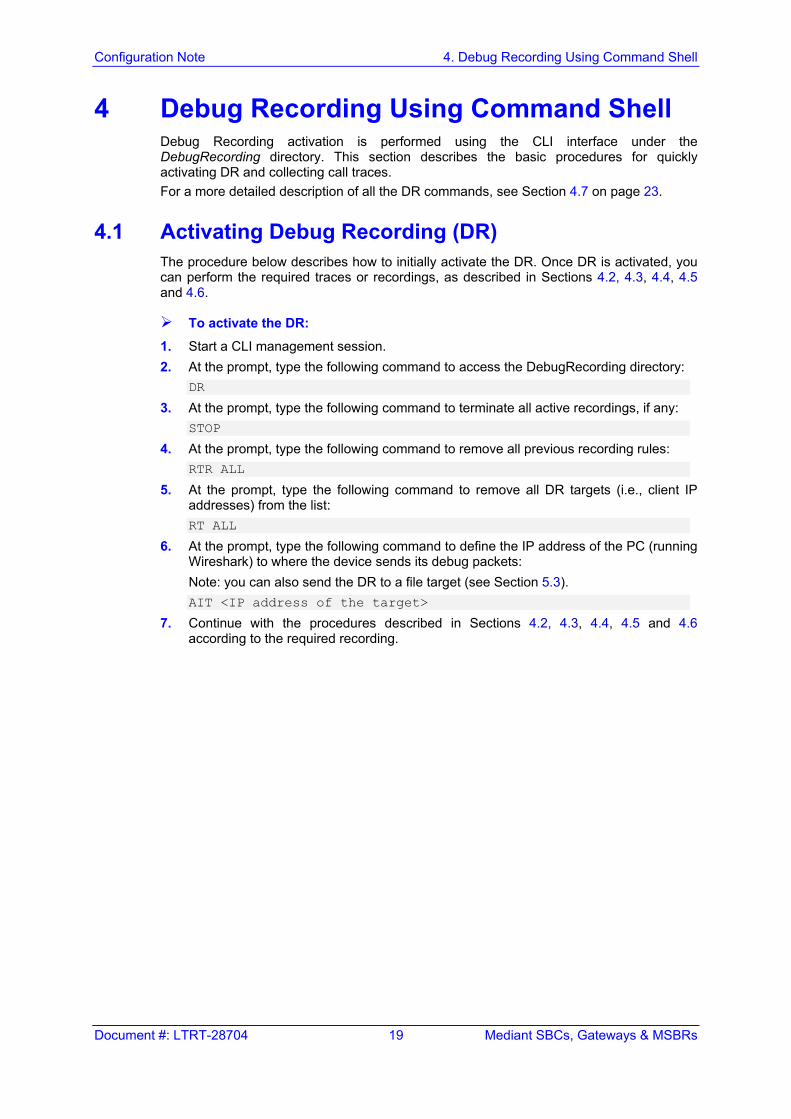
4 Debug Recording Using Command Shell Debug Recording activation is performed using the CLI interface under the DebugRecording directory. This section describes the basic procedures for quickly activating DR and collecting call traces. For a more detailed description of all the DR commands, see Section 4.7 on page 23.
4.1 Activating Debug Recording (DR) The procedure below describes how to initially activate the DR. Once DR is activated, you can perform the required traces or recordings, as described in Sections 4.2, 4.3, 4.4, 4.5 and 4.6.
To activate the DR:
1. Start a CLI management session. 2. At the prompt, type the following command to access the DebugRecording directory:
DR
3. At the prompt, type the following command to terminate all active recordings, if any: STOP
4. At the prompt, type the following command to remove all previous recording rules: RTR ALL
5. At the prompt, type the following command to remove all DR targets (i.e., client IP addresses) from the list: RT ALL
6. At the prompt, type the following command to define the IP address of the PC (running Wireshark) to where the device sends its debug packets: Note: you can also send the DR to a file target (see Section 5.3). AIT <IP address of the target>
7. Continue with the procedures described in Sections 4.2, 4.3, 4.4, 4.5 and 4.6 according to the required recording.
Configuration Note 20 Document #: LTRT-28704
Debug Recording
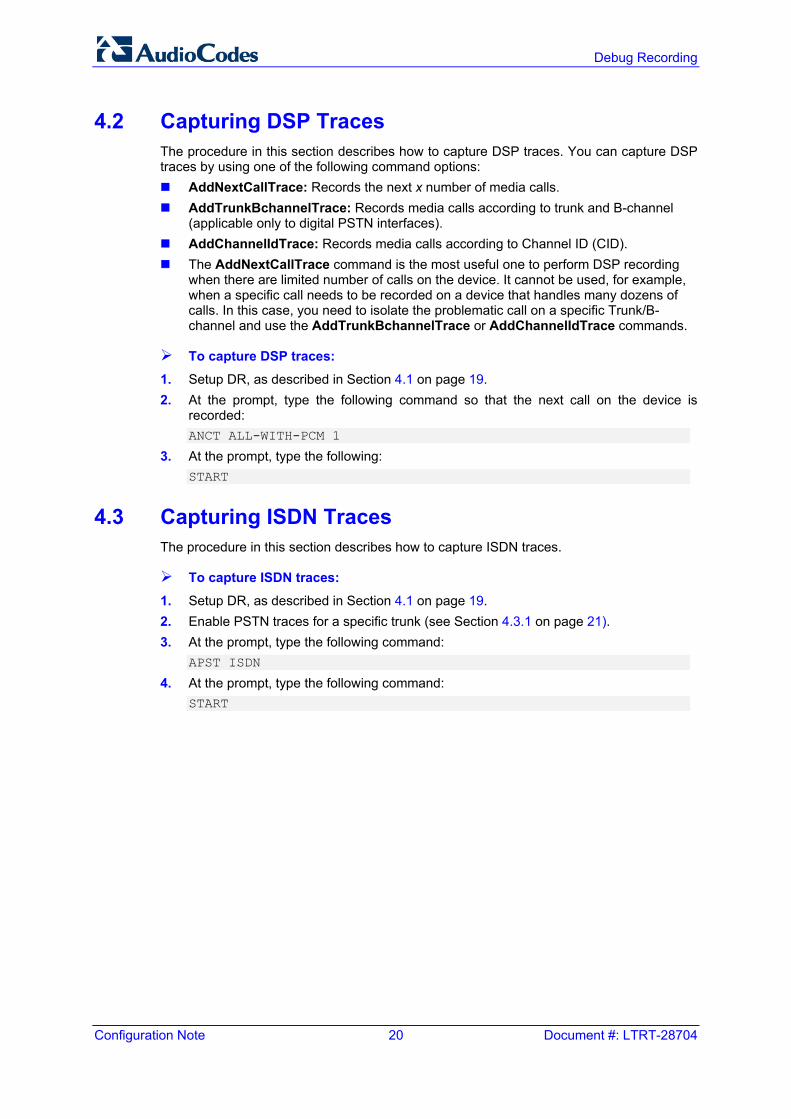
4.2 Capturing DSP Traces The procedure in this section describes how to capture DSP traces. You can capture DSP traces by using one of the following command options: AddNextCallTrace: Records the next x number of media calls. AddTrunkBchannelTrace: Records media calls according to trunk and B-channel
(applicable only to digital PSTN interfaces). AddChannelIdTrace: Records media calls according to Channel ID (CID). The AddNextCallTrace command is the most useful one to perform DSP recording
when there are limited number of calls on the device. It cannot be used, for example, when a specific call needs to be recorded on a device that handles many dozens of calls. In this case, you need to isolate the problematic call on a specific Trunk/B-channel and use the AddTrunkBchannelTrace or AddChannelIdTrace commands.
To capture DSP traces: 1. Setup DR, as described in Section 4.1 on page 19. 2. At the prompt, type the following command so that the next call on the device is
recorded: ANCT ALL-WITH-PCM 1
3. At the prompt, type the following: START
4.3 Capturing ISDN Traces The procedure in this section describes how to capture ISDN traces.
To capture ISDN traces:
1. Setup DR, as described in Section 4.1 on page 19. 2. Enable PSTN traces for a specific trunk (see Section 4.3.1 on page 21). 3. At the prompt, type the following command:
APST ISDN
4. At the prompt, type the following command: START
Configuration Note 4. Debug Recording Using Command Shell
Document #: LTRT-28704 21 Mediant SBCs, Gateways & MSBRs
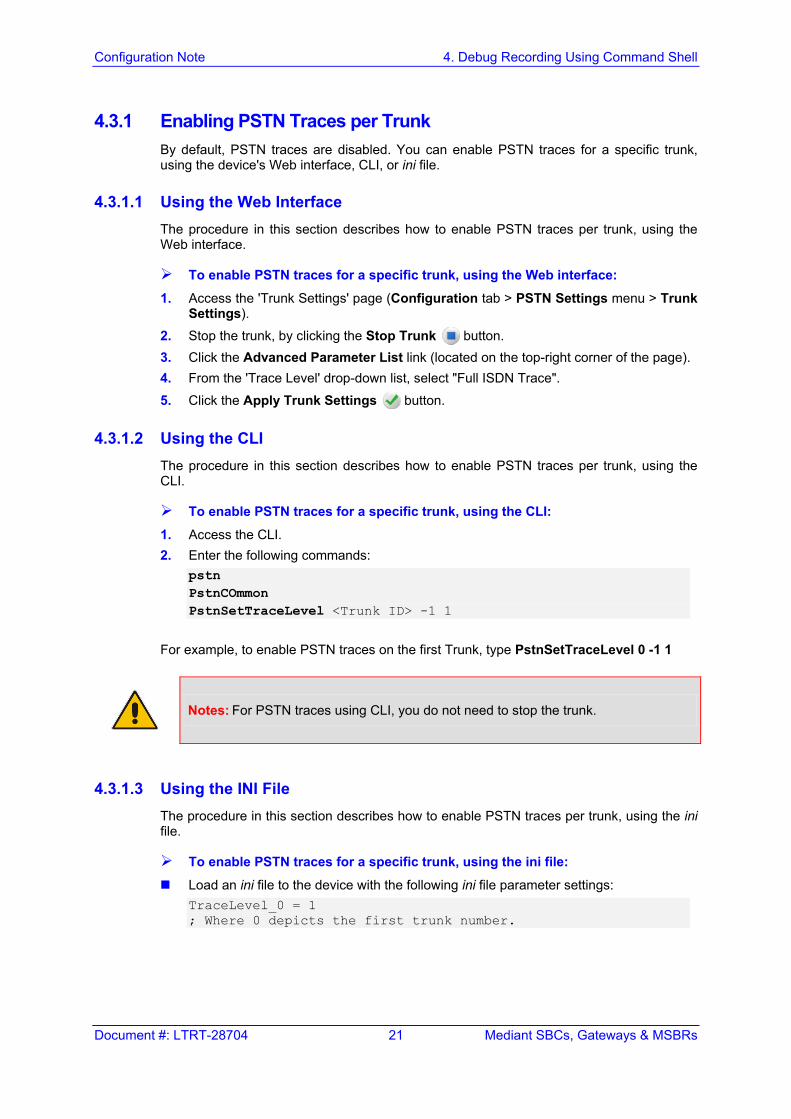
4.3.1 Enabling PSTN Traces per Trunk By default, PSTN traces are disabled. You can enable PSTN traces for a specific trunk, using the device's Web interface, CLI, or ini file.
4.3.1.1 Using the Web Interface The procedure in this section describes how to enable PSTN traces per trunk, using the Web interface.
To enable PSTN traces for a specific trunk, using the Web interface:
1. Access the 'Trunk Settings' page (Configuration tab > PSTN Settings menu > Trunk Settings).
2. Stop the trunk, by clicking the Stop Trunk button. 3. Click the Advanced Parameter List link (located on the top-right corner of the page). 4. From the 'Trace Level' drop-down list, select "Full ISDN Trace".
5. Click the Apply Trunk Settings button.
4.3.1.2 Using the CLI The procedure in this section describes how to enable PSTN traces per trunk, using the CLI.
To enable PSTN traces for a specific trunk, using the CLI:
1. Access the CLI. 2. Enter the following commands:
pstn PstnCOmmon PstnSetTraceLevel <Trunk ID> -1 1
For example, to enable PSTN traces on the first Trunk, type PstnSetTraceLevel 0 -1 1
Notes: For PSTN traces using CLI, you do not need to stop the trunk.
4.3.1.3 Using the INI File The procedure in this section describes how to enable PSTN traces per trunk, using the ini file.
To enable PSTN traces for a specific trunk, using the ini file:
Load an ini file to the device with the following ini file parameter settings: TraceLevel_0 = 1 ; Where 0 depicts the first trunk number.
Configuration Note 22 Document #: LTRT-28704
Debug Recording
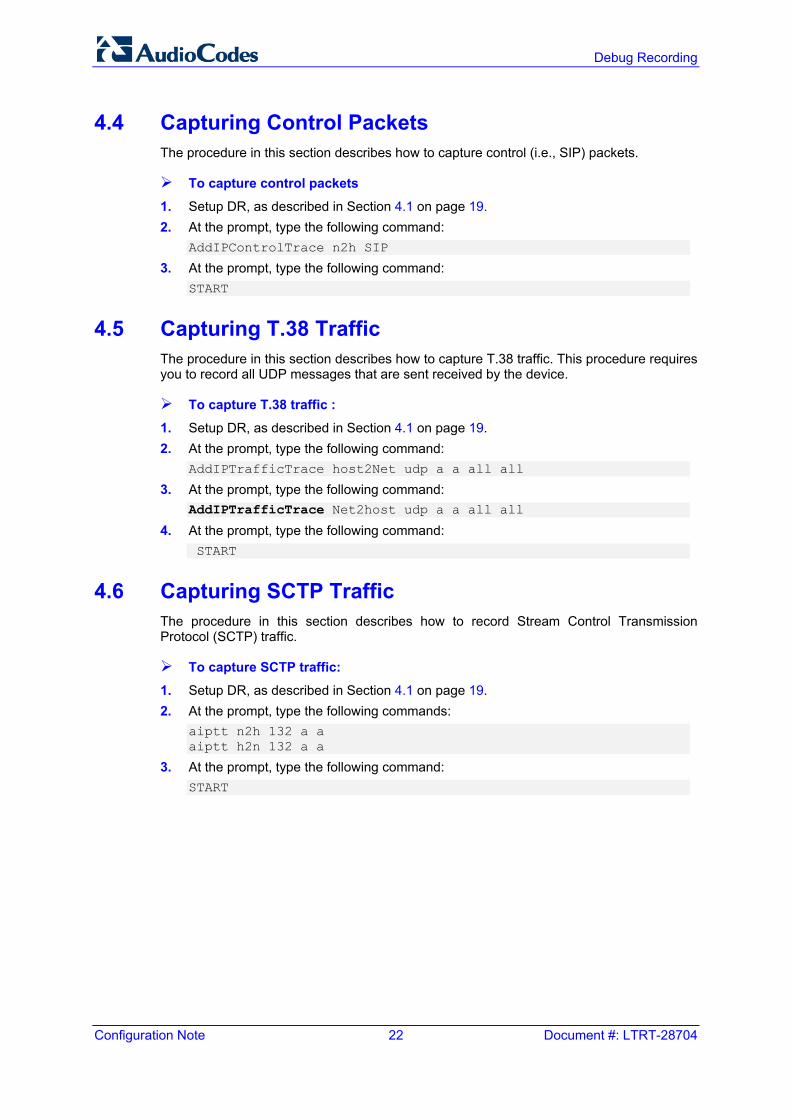
4.4 Capturing Control Packets The procedure in this section describes how to capture control (i.e., SIP) packets.
To capture control packets
1. Setup DR, as described in Section 4.1 on page 19. 2. At the prompt, type the following command:
AddIPControlTrace n2h SIP
3. At the prompt, type the following command: START
4.5 Capturing T.38 Traffic The procedure in this section describes how to capture T.38 traffic. This procedure requires you to record all UDP messages that are sent received by the device.
To capture T.38 traffic :
1. Setup DR, as described in Section 4.1 on page 19. 2. At the prompt, type the following command:
AddIPTrafficTrace host2Net udp a a all all
3. At the prompt, type the following command: AddIPTrafficTrace Net2host udp a a all all
4. At the prompt, type the following command: START
4.6 Capturing SCTP Traffic The procedure in this section describes how to record Stream Control Transmission Protocol (SCTP) traffic.
To capture SCTP traffic:
1. Setup DR, as described in Section 4.1 on page 19. 2. At the prompt, type the following commands:
aiptt n2h 132 a a aiptt h2n 132 a a
3. At the prompt, type the following command: START
Configuration Note 4. Debug Recording Using Command Shell
Document #: LTRT-28704 23 Mediant SBCs, Gateways & MSBRs
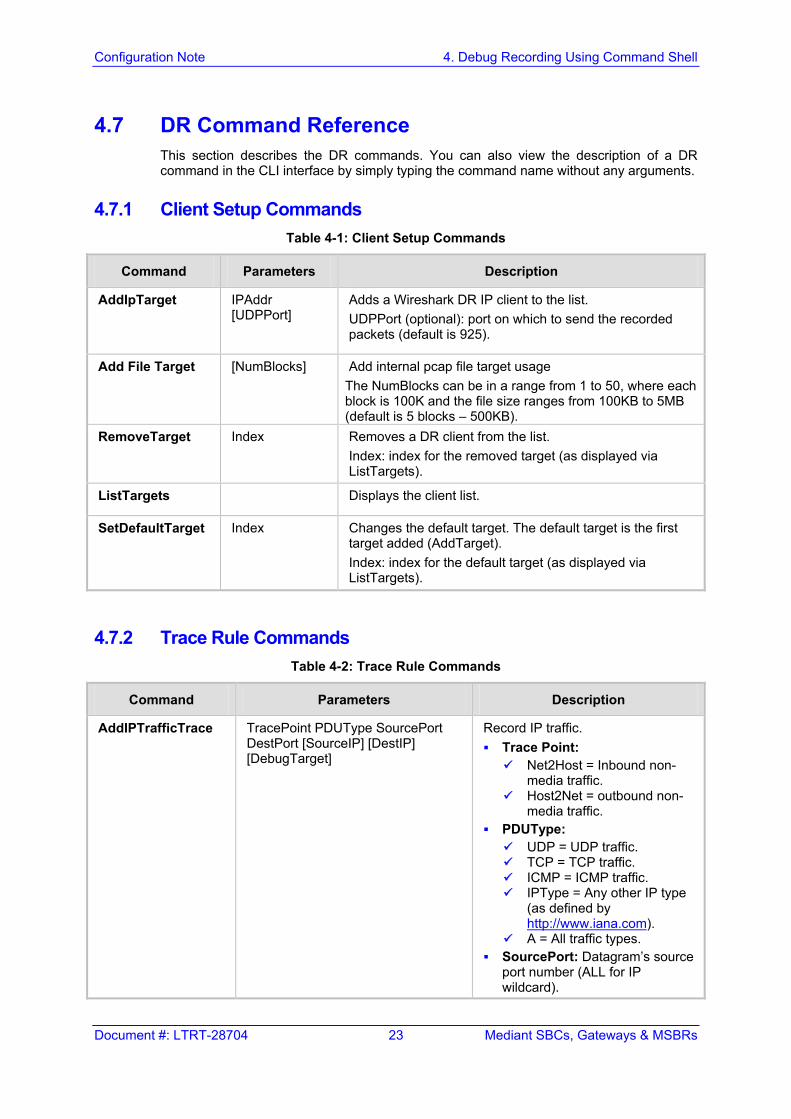
4.7 DR Command Reference This section describes the DR commands. You can also view the description of a DR command in the CLI interface by simply typing the command name without any arguments.
4.7.1 Client Setup Commands Table 4-1: Client Setup Commands
Command Parameters Description
AddIpTarget IPAddr [UDPPort]
Adds a Wireshark DR IP client to the list. UDPPort (optional): port on which to send the recorded packets (default is 925).
Add File Target [NumBlocks] Add internal pcap file target usage The NumBlocks can be in a range from 1 to 50, where each block is 100K and the file size ranges from 100KB to 5MB (default is 5 blocks – 500KB).
RemoveTarget Index Removes a DR client from the list. Index: index for the removed target (as displayed via ListTargets).
ListTargets Displays the client list.
SetDefaultTarget Index Changes the default target. The default target is the first target added (AddTarget). Index: index for the default target (as displayed via ListTargets).
4.7.2 Trace Rule Commands Table 4-2: Trace Rule Commands
Command Parameters Description
AddIPTrafficTrace TracePoint PDUType SourcePort DestPort [SourceIP] [DestIP] [DebugTarget]
Record IP traffic. Trace Point: Net2Host = Inbound non-
media traffic. Host2Net = outbound non-
media traffic. PDUType: UDP = UDP traffic. TCP = TCP traffic. ICMP = ICMP traffic. IPType = Any other IP type
(as defined by http://www.iana.com).
A = All traffic types. SourcePort: Datagram’s source
port number (ALL for IP wildcard).
Configuration Note 24 Document #: LTRT-28704
Debug Recording
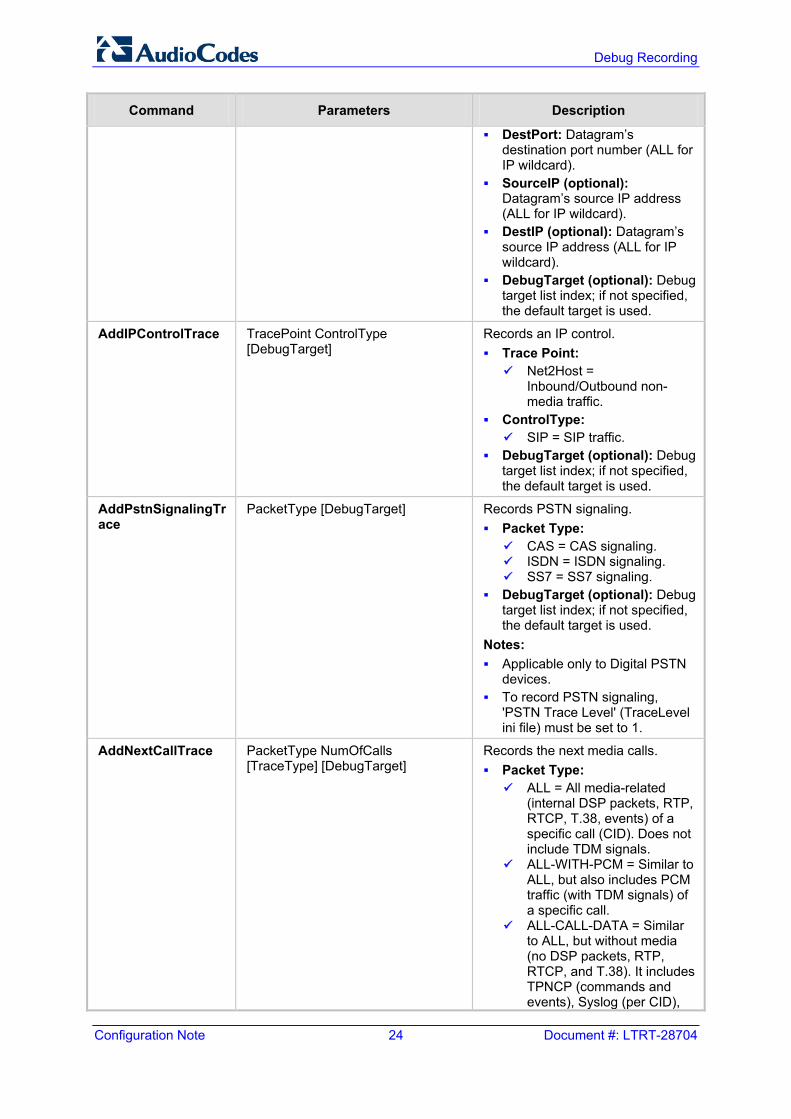
Command Parameters Description
DestPort: Datagram’s destination port number (ALL for IP wildcard).
SourceIP (optional): Datagram’s source IP address (ALL for IP wildcard).
DestIP (optional): Datagram’s source IP address (ALL for IP wildcard).
DebugTarget (optional): Debug target list index; if not specified, the default target is used.
AddIPControlTrace TracePoint ControlType [DebugTarget]
Records an IP control. Trace Point: Net2Host =
Inbound/Outbound non-media traffic.
ControlType: SIP = SIP traffic.
DebugTarget (optional): Debug target list index; if not specified, the default target is used.
AddPstnSignalingTrace
PacketType [DebugTarget] Records PSTN signaling. Packet Type: CAS = CAS signaling. ISDN = ISDN signaling. SS7 = SS7 signaling.
DebugTarget (optional): Debug target list index; if not specified, the default target is used.
Notes: Applicable only to Digital PSTN
devices. To record PSTN signaling,
'PSTN Trace Level' (TraceLevel ini file) must be set to 1.
AddNextCallTrace PacketType NumOfCalls [TraceType] [DebugTarget]
Records the next media calls. Packet Type: ALL = All media-related
(internal DSP packets, RTP, RTCP, T.38, events) of a specific call (CID). Does not include TDM signals.
ALL-WITH-PCM = Similar to ALL, but also includes PCM traffic (with TDM signals) of a specific call.
ALL-CALL-DATA = Similar to ALL, but without media (no DSP packets, RTP, RTCP, and T.38). It includes TPNCP (commands and events), Syslog (per CID),
Configuration Note 4. Debug Recording Using Command Shell
Document #: LTRT-28704 25 Mediant SBCs, Gateways & MSBRs
Command Parameters Description
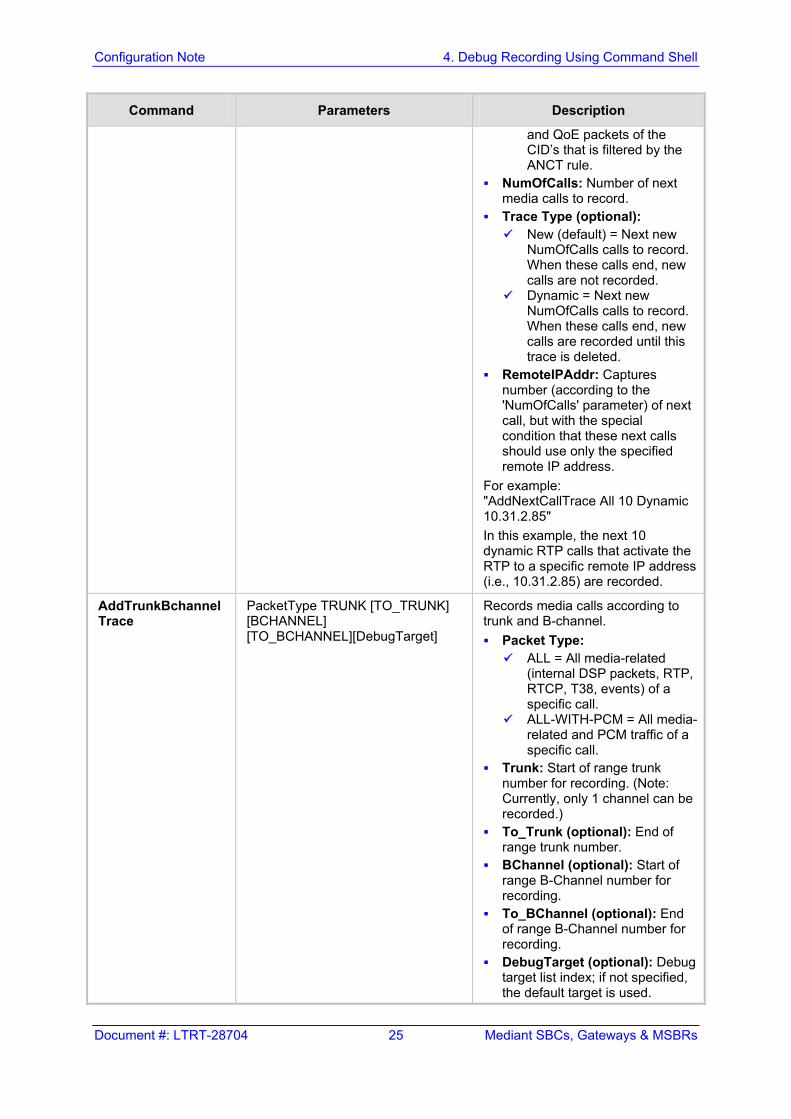
and QoE packets of the CID’s that is filtered by the ANCT rule.
NumOfCalls: Number of next media calls to record.
Trace Type (optional): New (default) = Next new
NumOfCalls calls to record. When these calls end, new calls are not recorded.
Dynamic = Next new NumOfCalls calls to record. When these calls end, new calls are recorded until this trace is deleted.
RemoteIPAddr: Captures number (according to the 'NumOfCalls' parameter) of next call, but with the special condition that these next calls should use only the specified remote IP address.
For example: "AddNextCallTrace All 10 Dynamic 10.31.2.85" In this example, the next 10 dynamic RTP calls that activate the RTP to a specific remote IP address (i.e., 10.31.2.85) are recorded.
AddTrunkBchannelTrace
PacketType TRUNK [TO_TRUNK] [BCHANNEL] [TO_BCHANNEL][DebugTarget]
Records media calls according to trunk and B-channel. Packet Type: ALL = All media-related
(internal DSP packets, RTP, RTCP, T38, events) of a specific call.
ALL-WITH-PCM = All media-related and PCM traffic of a specific call.
Trunk: Start of range trunk number for recording. (Note: Currently, only 1 channel can be recorded.)
To_Trunk (optional): End of range trunk number.
BChannel (optional): Start of range B-Channel number for recording.
To_BChannel (optional): End of range B-Channel number for recording.
DebugTarget (optional): Debug target list index; if not specified, the default target is used.
Configuration Note 26 Document #: LTRT-28704
Debug Recording
Command Parameters Description
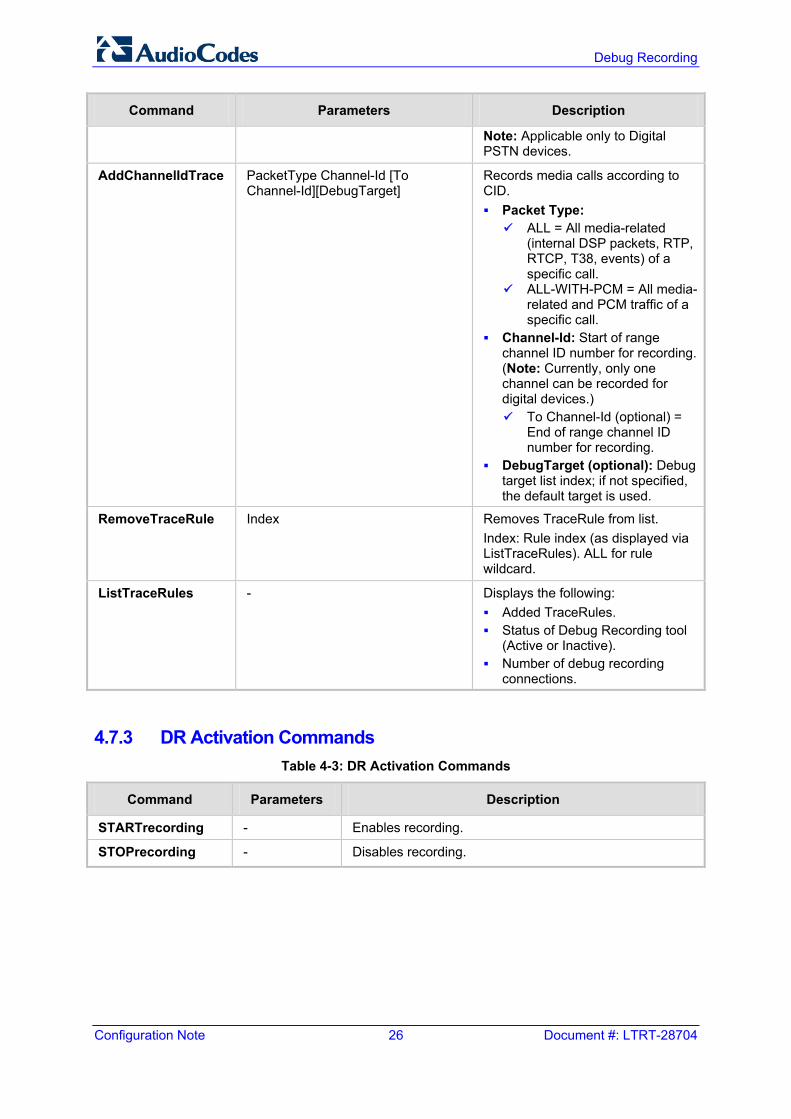
Note: Applicable only to Digital PSTN devices.
AddChannelIdTrace PacketType Channel-Id [To Channel-Id][DebugTarget]
Records media calls according to CID. Packet Type: ALL = All media-related
(internal DSP packets, RTP, RTCP, T38, events) of a specific call.
ALL-WITH-PCM = All media-related and PCM traffic of a specific call.
Channel-Id: Start of range channel ID number for recording. (Note: Currently, only one channel can be recorded for digital devices.) To Channel-Id (optional) =
End of range channel ID number for recording.
DebugTarget (optional): Debug target list index; if not specified, the default target is used.
RemoveTraceRule Index Removes TraceRule from list. Index: Rule index (as displayed via ListTraceRules). ALL for rule wildcard.
ListTraceRules - Displays the following: Added TraceRules. Status of Debug Recording tool
(Active or Inactive). Number of debug recording
connections.
4.7.3 DR Activation Commands Table 4-3: DR Activation Commands
Command Parameters Description
STARTrecording - Enables recording.
STOPrecording - Disables recording.
Configuration Note 5. Collecting Debug Recording
Document #: LTRT-28704 27 Mediant SBCs, Gateways & MSBRs
5 Collecting Debug Recording This section describes how to collect DR messages.
5.1 Collecting DR Messages from Device Startup In some cases, especially for PSTN or SCTP, debug recording upon device startup (reset) is required. The procedure below describes how to enable TDM recording and to send the Syslog to Wireshark from the time the device resets.
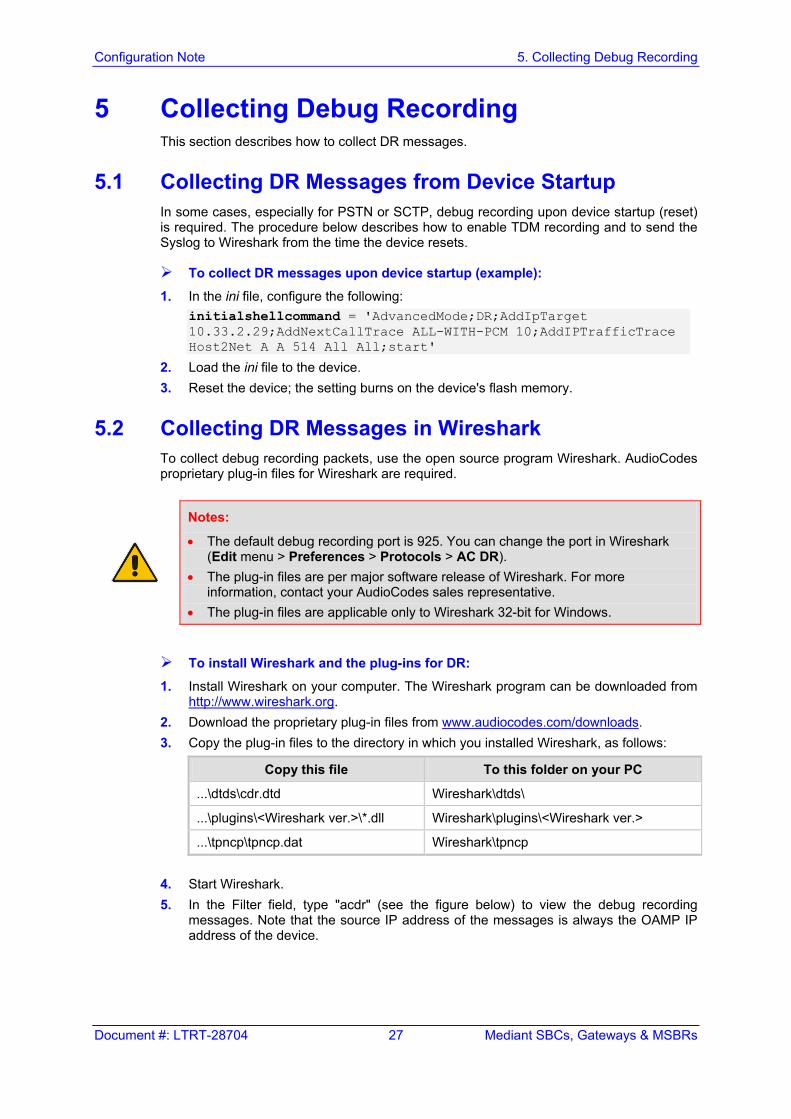
To collect DR messages upon device startup (example):
1. In the ini file, configure the following: initialshellcommand = 'AdvancedMode;DR;AddIpTarget 10.33.2.29;AddNextCallTrace ALL-WITH-PCM 10;AddIPTrafficTrace Host2Net A A 514 All All;start'
2. Load the ini file to the device. 3. Reset the device; the setting burns on the device's flash memory.
5.2 Collecting DR Messages in Wireshark To collect debug recording packets, use the open source program Wireshark. AudioCodes proprietary plug-in files for Wireshark are required.
Notes:
• The default debug recording port is 925. You can change the port in Wireshark (Edit menu > Preferences > Protocols > AC DR).
• The plug-in files are per major software release of Wireshark. For more information, contact your AudioCodes sales representative.
• The plug-in files are applicable only to Wireshark 32-bit for Windows.
To install Wireshark and the plug-ins for DR:
1. Install Wireshark on your computer. The Wireshark program can be downloaded from http://www.wireshark.org.
2. Download the proprietary plug-in files from www.audiocodes.com/downloads. 3. Copy the plug-in files to the directory in which you installed Wireshark, as follows:
Copy this file To this folder on your PC
...\dtds\cdr.dtd Wireshark\dtds\
...\plugins\<Wireshark ver.>\*.dll Wireshark\plugins\<Wireshark ver.>
...\tpncp\tpncp.dat Wireshark\tpncp
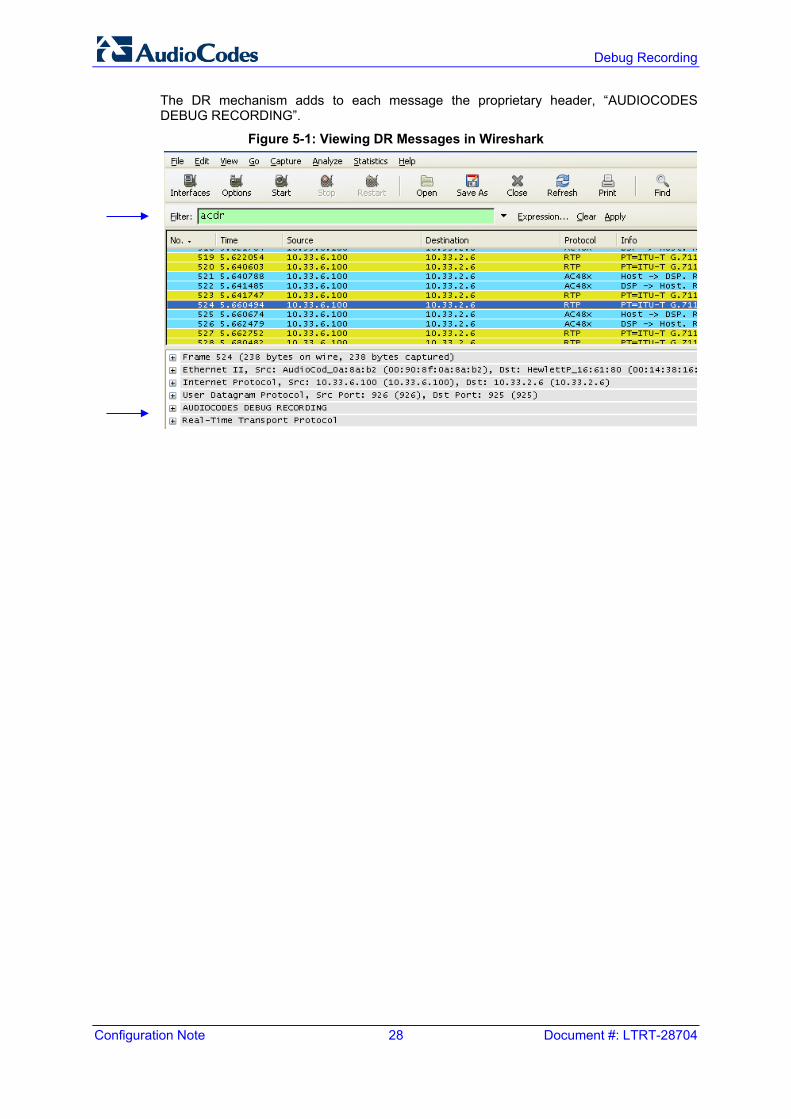
4. Start Wireshark. 5. In the Filter field, type "acdr" (see the figure below) to view the debug recording
messages. Note that the source IP address of the messages is always the OAMP IP address of the device.
Configuration Note 28 Document #: LTRT-28704
Debug Recording
The DR mechanism adds to each message the proprietary header, “AUDIOCODES DEBUG RECORDING”.
Figure 5-1: Viewing DR Messages in Wireshark
Configuration Note 5. Collecting Debug Recording
Document #: LTRT-28704 29 Mediant SBCs, Gateways & MSBRs
5.3 Saving DR Messages into Local PCAP File (into Device’s RAM)
This scenario is relevant when customer's cannot send the DR to a remote PC running Wireshark. To overcome this problem, the DR can be taken locally (by CLI) and saved on the device itself. When the connection is restored, this file can be exported. The procedure below describes how to initially activate the DR. Once activated, you can perform the required traces or recordings, as described in Section 0.
To activate the DR:
1. Start a CLI management session. 2. At the prompt, type the following command to access the DebugRecording directory:
DR
3. At the prompt, type the following command to terminate all active recordings, if any: STOP
4. At the prompt, type the following command to remove all previous recording rules: RTR ALL
5. At the prompt, type the following command to remove all DR targets (i.e., client IP addresses) from the list: RT ALL
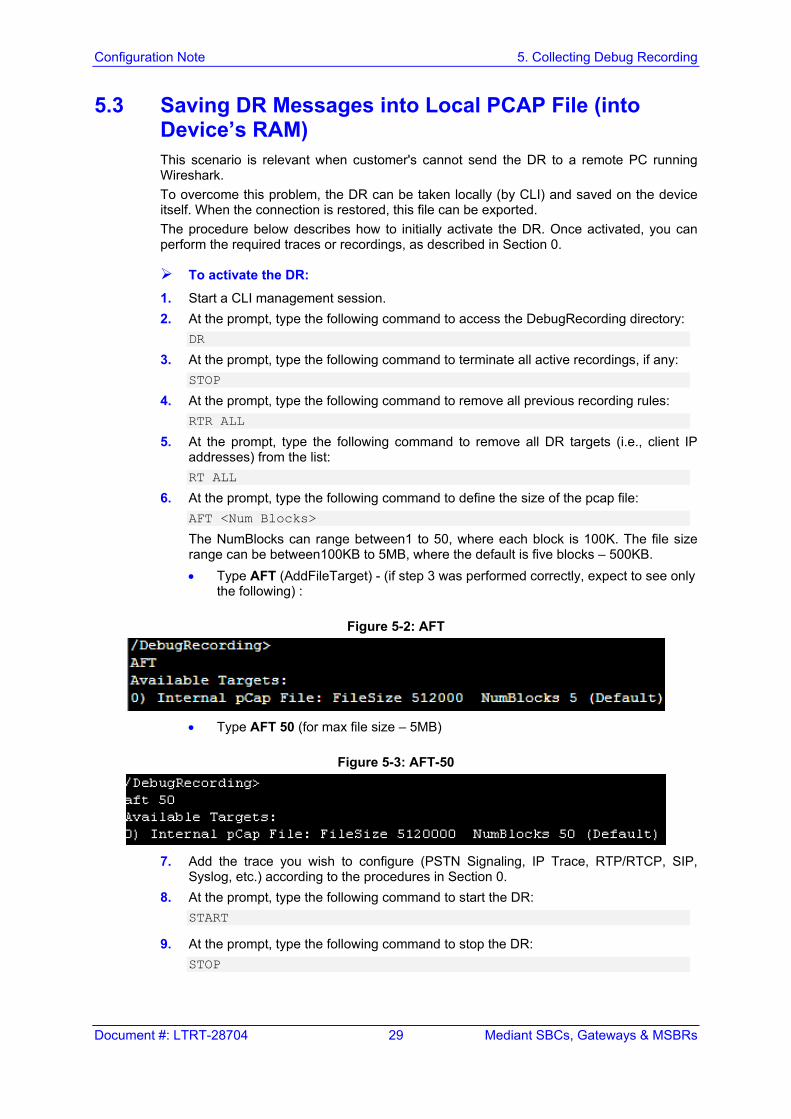
6. At the prompt, type the following command to define the size of the pcap file: AFT <Num Blocks>
The NumBlocks can range between1 to 50, where each block is 100K. The file size range can be between100KB to 5MB, where the default is five blocks – 500KB. • Type AFT (AddFileTarget) - (if step 3 was performed correctly, expect to see only
the following) :
Figure 5-2: AFT
• Type AFT 50 (for max file size – 5MB)
Figure 5-3: AFT-50
7. Add the trace you wish to configure (PSTN Signaling, IP Trace, RTP/RTCP, SIP,
Syslog, etc.) according to the procedures in Section 0. 8. At the prompt, type the following command to start the DR:
START
9. At the prompt, type the following command to stop the DR: STOP
Configuration Note 30 Document #: LTRT-28704
Debug Recording
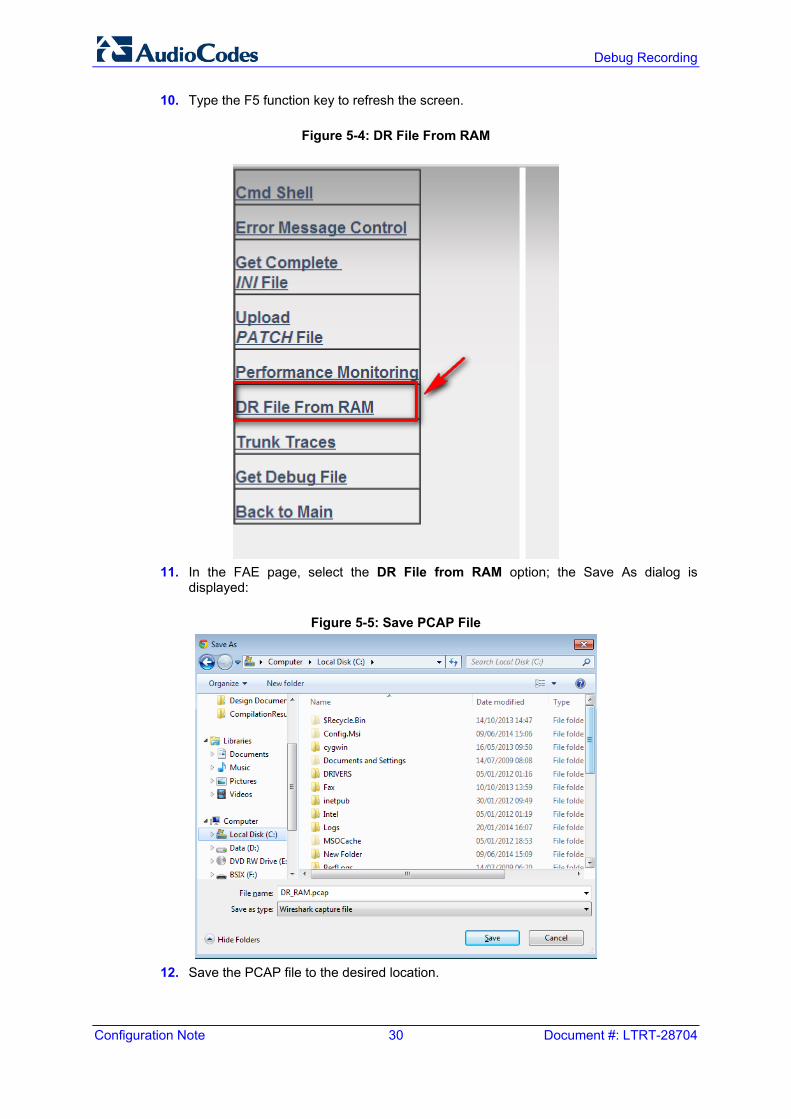
10. Type the F5 function key to refresh the screen.
Figure 5-4: DR File From RAM
11. In the FAE page, select the DR File from RAM option; the Save As dialog is
displayed:
Figure 5-5: Save PCAP File
12. Save the PCAP file to the desired location.
Configuration Note 5. Collecting Debug Recording
Document #: LTRT-28704 31 Mediant SBCs, Gateways & MSBRs
This page is intentionally left blank
Configuration Note
www.audiocodes.com www.audiocodes.com