Embed Size (px)
Citation preview

Debugging a Program
… Using the PC/370 Emulator
Interactively !

Debug features available?
• Program Flow Trace with Breakpoints• Display register contents• Display memory contents• Data and/or address stop, if needed

Interactive Debug Options:
• There are more options, but these are the ones you will most likely use.
• PSW automatically displays each time.
Debug Option Explanation
D Dump (display) a memory location
M Modify a memory location
R Display general purpose registers

Enter option- D,M,R (‘H’ lists all options)
EP = Entry Point A=AddressFollowing 370 A = Failing Address in PSWOP = instruction at the failing PSW address
Remember that most times, the failing address (0002B6 in this example) points to the next instruction to be executed. The failing instruction has already had its PSW address updated to point to the next instruction, but this instruction failed in execution.
In PC/370, programs are loaded into memory at 000200, so relating the failing instruction address to your program, this would be the instruction (in your PRN listing) at offset 0000B6, actually the instruction before this one, that failed. You most likely would wish to see the registers first, so enter option ‘R’

Other Debug Aids
• Assembler Output Listing Fragment (.PRN file)
Location Counter (Displacement from location zero)
Object Code
Addr1 Addr2 (Displacements of operands from zero)
Assembler Statement Number

Other Debug Aids
• A Test Plan– Unit Testing: each module functions properly– System Testing: all modules function together– Acceptance Testing: User sign-off
• Before testing, develop & document a plan– Test all possible conditions – major ones 1st
– Develop test data– Test: comparing & documenting results against expected results
• From Experience– Don’t try to test too much of a program at one time. Create little
chunks.– If you make a change to your code, save the old code before
changing it

So – your program ends abnormally ??
1. Find the instruction that led to the problem
Location immediately following the failing instruction
Instruction following the failing instruction

2. Find the cause of the error3. Fix it
So – your program ends abnormally ??
PSW Address when program failed and the instruction at that location.
We know that it was the instruction prior to the instruction that failed (SVC 2 @ 0000B4). This is instruction is part of the CLOSE that has the +++++ to the left. We probably have something wrong with either our DCB or the data file that is being closed.

You may also get yourself an abnormal completion code …
Code Type Meaning
0C1 Operation Invalid operation code
0C4 Security Protection Exception
0C5 Addressing Address is out of range
0C7 Data Invalid Data for Instruct.
0CA Decimal Decimal Overflow
If so, examine the completion code meaning:

When the program abnormally terminates you can enter most any of the debugging codes (‘R’ was used in this case) to display the current registers. The PSW also is displayed and the ABEND code appears as well.

Finding the Failing Instruction
• Subtract START address from the Interrupt address.• Use .PRN listing to locate failing instruction using the Location
Counter• Failing instruction is the one before the difference calculated in
number 1 above

Failing Address
Fail Addr 02B4Load Addr - 0200
00B4
PSW
Memory @ PSW02B4
Enter ‘R’ for Register display, PSW, and memory fragment

Program
failed in GET …

Back to the source code

REALTORS file is not located on H: drive. It’s on the same drive as the program (f:) – note the DDNAME parameter …

Another Example
49C-20029C
Data at loc. ’49C’looks like EBCDIC data. You can’t execute data …


So What Happened?
• Program is trying to execute instructions at location X’29C’ which is the beginning of the output DCB
• Instruction is the op.code ‘C1’• What is op.code ‘C1’ ?
There is no valid op.code ‘C1’So how did the location counter get to be ’29C’?

Harmlessly and minding its own business, program is executing along to a BAL @ F4, jump to 10C and execute along some more to a B OUTPUT… Where is OUTPUT defined?

OUTPUT is the DCB the program was trying to execute.
That makes for an invalid Branch instruction

Invalid Branch probably should have been a BR 5 – since we were in a subroutine that program did a BAL to

Register 5
BAL instruction
B OUTPUT
BAL executed correctly – note contents of Reg 5
But addess in B OUTPUT probably should be the address in Reg 5, but it’s not

A Real Example
336-200136

When you get into trouble, the first thing you should ask for is to see the registers at the time of the failure.
This also provides the PSW at the time of the failure and 16 bytes of memory at the location of the failure.
This also includes the ABEND code, if present. In this case, the ABEND code is 0C7, which is a data exception
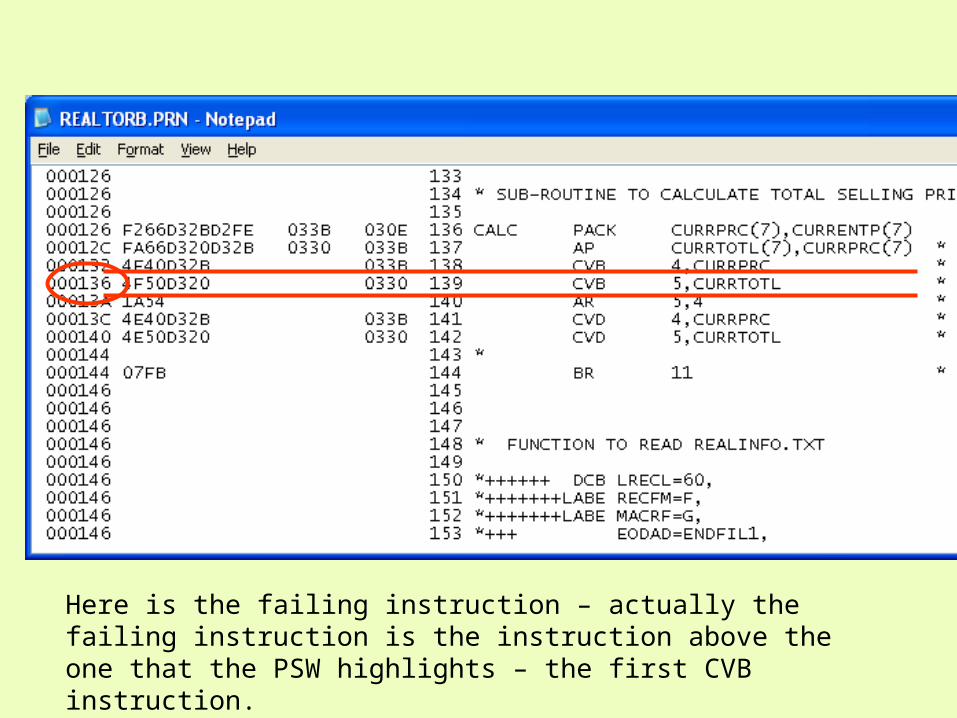
Here is the failing instruction – actually the failing instruction is the instruction above the one that the PSW highlights – the first CVB instruction.

For both CVB instructions, the data locations are defined as shown. Do you see something wrong?

CURRPRC(7)0000003652987F
53B
CURRENTP(7)F3F6F5F2F9F8F7
CALC PACK CURRPRC(7),CURRENTP(7)AP CURRTOTL(7),CURRPRC(7)CVB 4,CURRPRC
CURRTOTL(7)0000003652987C
R4

• So what is the error ?
• Memory Location for CVB and CVD must be an eight-byte field. In this case, it is defined as 7-bytes
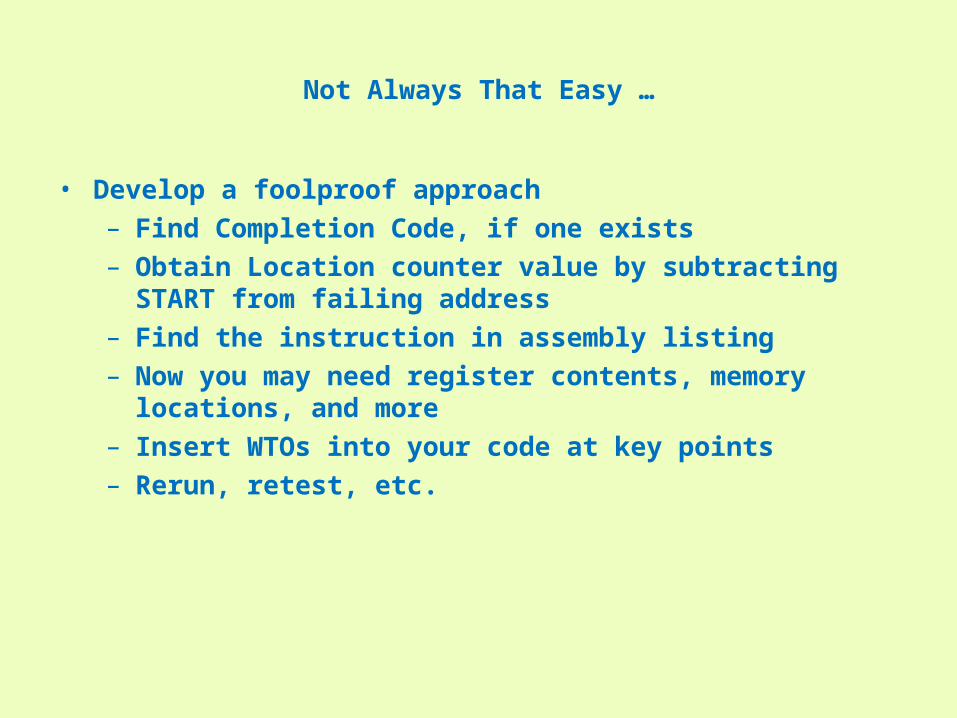
Not Always That Easy …
• Develop a foolproof approach– Find Completion Code, if one exists– Obtain Location counter value by subtracting START from
failing address– Find the instruction in assembly listing– Now you may need register contents, memory locations,
and more– Insert WTOs into your code at key points– Rerun, retest, etc.
Consider Printing the Debug Guide
\FULL\DOC\USER.DOC