Embed Size (px)
Citation preview
Motivation
Software Development Tools Debugging 2
When some test fails
You know there is a bug in the program code
You do not know the root cause of the bug
Testing detects presence of bugs in the code
But you still have to find them and eliminate properly
Writing tests for smaller units of code does not help
Too much work with a little benefit (bad “cost-effect” ratio)
Solution: debugging, automated bug-finders
Debugging
Software Development Tools Debugging 3
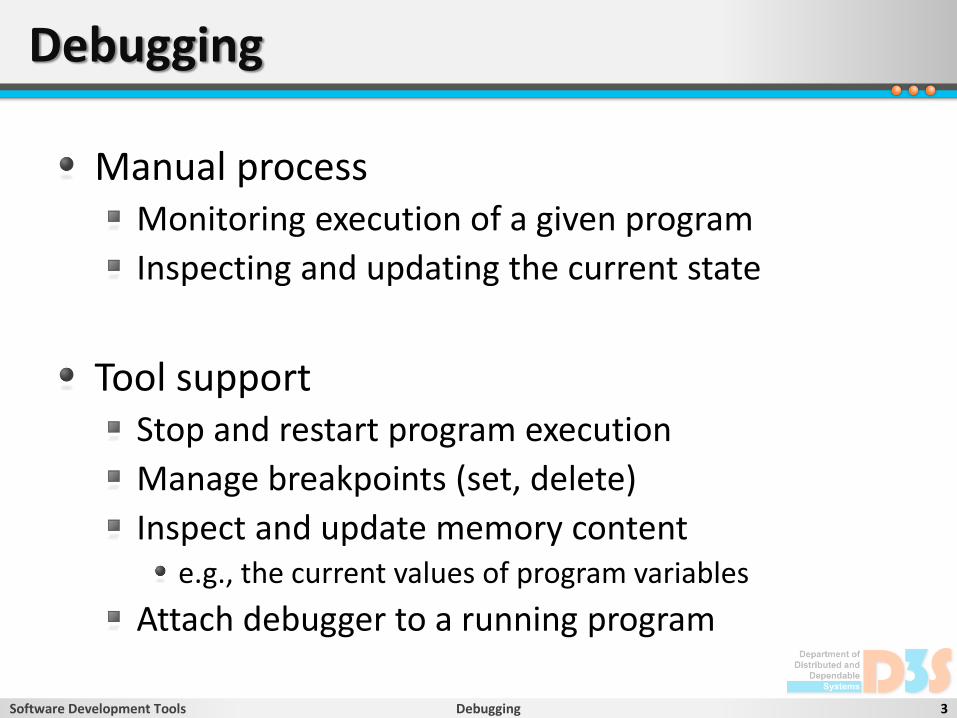
Manual processMonitoring execution of a given program
Inspecting and updating the current state
Tool supportStop and restart program execution
Manage breakpoints (set, delete)
Inspect and update memory content e.g., the current values of program variables
Attach debugger to a running program

Important concepts
Software Development Tools Debugging 4
BreakpointSource code location where the program execution is stopped intentionally
Additional conditions may have to be also satisfiedtotal number of hits, the current value of a program variable
Types: HW (CPU, fast, limited), SW (interrupt, slow)
Core dumpFull memory image of the crashed process
heap objects and fields, registers, stack trace of each thread
Records the full program state upon crash

Basic approaches
Software Development Tools Debugging 5
Printing debug messagesAdd many print statements into your code
System.out.println(“[DEBUG] MyObj.doSmth: arg1 = “ + arg1 + “, v = “ + v + “, data = “ + this.data);
Read huge log files (search for text patterns)Useful when you need lot of data at the same time
“Online” debuggersControl program execution and inspect current stateBasic tools: GDB, DDD, jdb, JPDA, WinDbg, KD, CDBIDE support: Visual Studio, Eclipse, NetBeans, IDEA
Thorough explanation of your code to friends/colleaguesApproach works surprisingly well in practice

The [complete] process of debugging
Software Development Tools Debugging 6
GNU Debugger (GDB)
Software Development Tools Debugging 7
GNU Debugger (GDB)
Software Development Tools Debugging 8
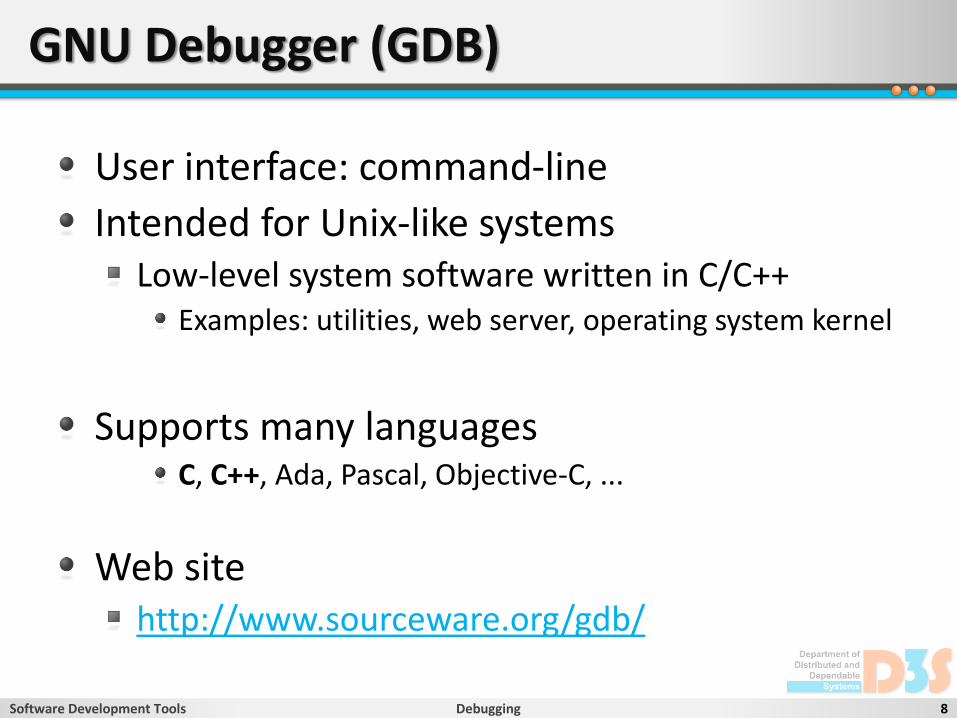
User interface: command-line
Intended for Unix-like systemsLow-level system software written in C/C++
Examples: utilities, web server, operating system kernel
Supports many languagesC, C++, Ada, Pascal, Objective-C, ...
Web sitehttp://www.sourceware.org/gdb/
Running program with GDB
Software Development Tools Debugging 9
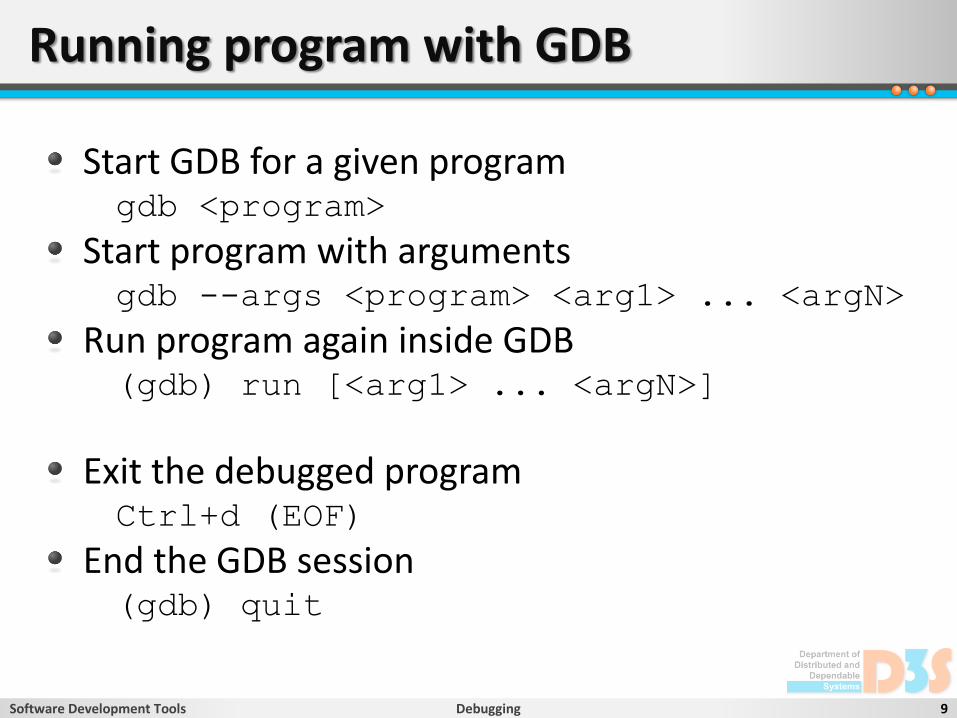
Start GDB for a given programgdb <program>
Start program with argumentsgdb --args <program> <arg1> ... <argN>
Run program again inside GDB(gdb) run [<arg1> ... <argN>]
Exit the debugged programCtrl+d (EOF)
End the GDB session(gdb) quit
Breakpoints
Software Development Tools Debugging 10
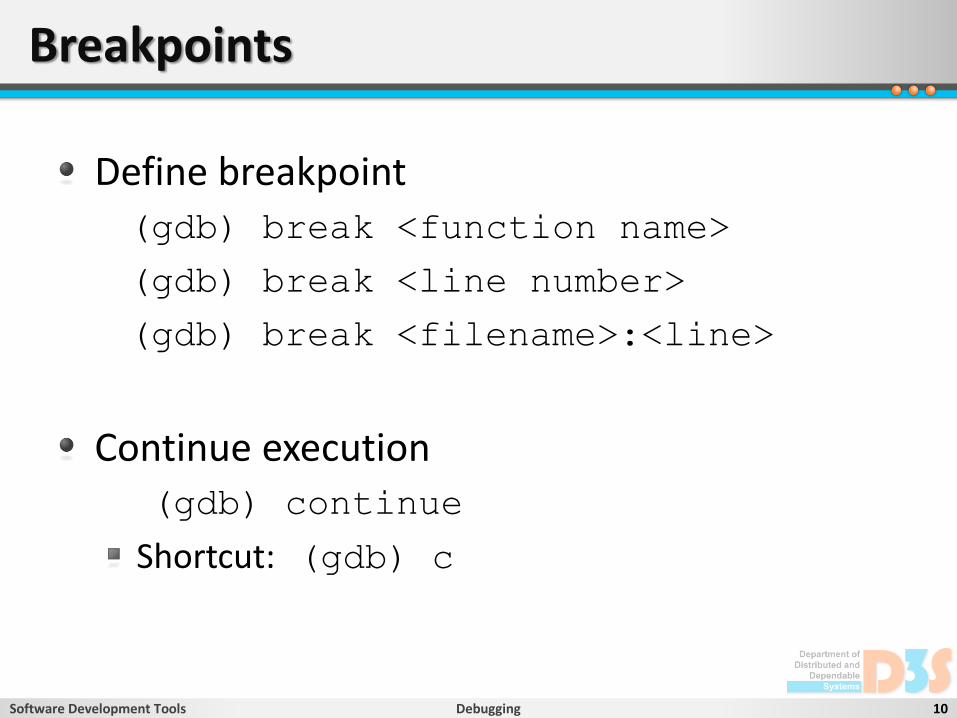
Define breakpoint(gdb) break <function name>
(gdb) break <line number>
(gdb) break <filename>:<line>
Continue execution(gdb) continue
Shortcut: (gdb) c
Breakpoints
Software Development Tools Debugging 11
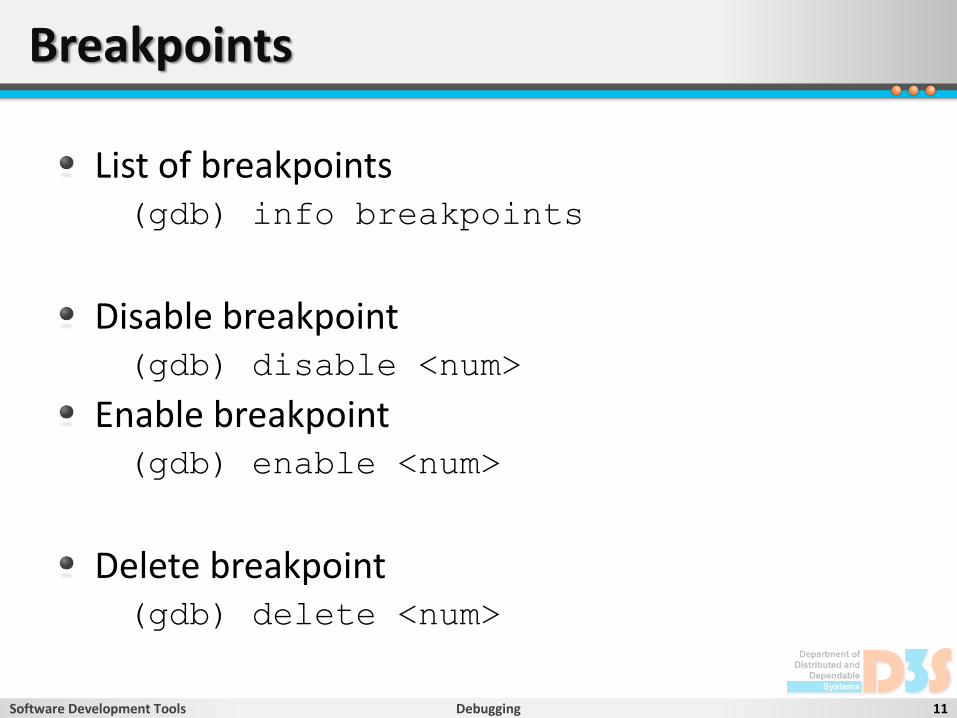
List of breakpoints(gdb) info breakpoints
Disable breakpoint(gdb) disable <num>
Enable breakpoint(gdb) enable <num>
Delete breakpoint(gdb) delete <num>

Single stepping
Software Development Tools Debugging 12
Advance to the next source line(gdb) step [count]
Shortcut: (gdb) s
Advance to the next line in the current scope(gdb) next [count]
Shortcut: (gdb) n
Information about the debugged program
Software Development Tools Debugging 13
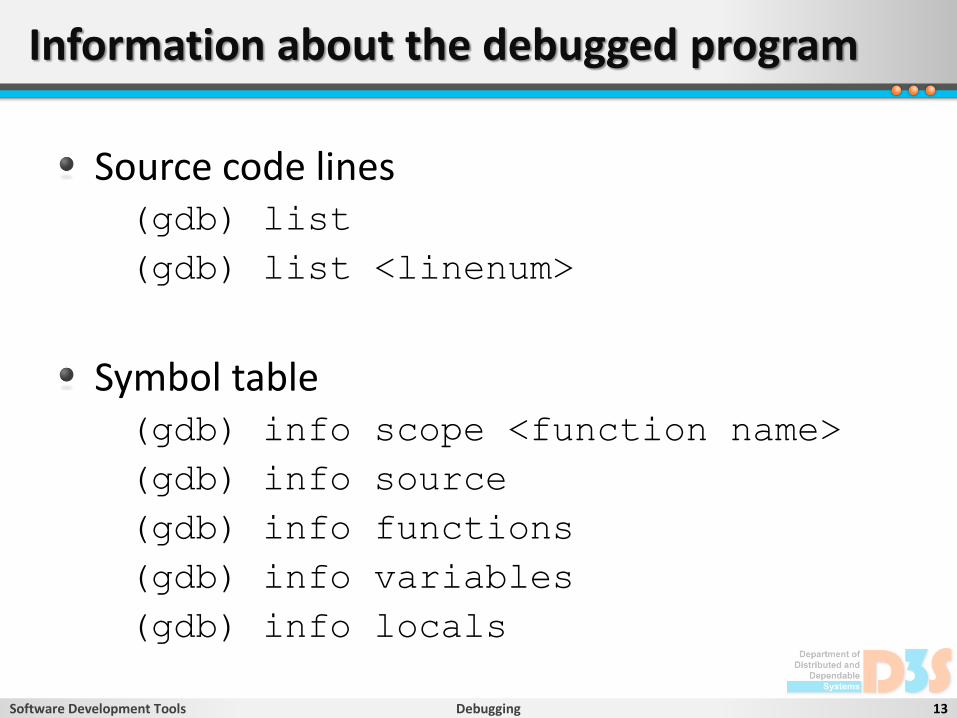
Source code lines(gdb) list
(gdb) list <linenum>
Symbol table(gdb) info scope <function name>
(gdb) info source
(gdb) info functions
(gdb) info variables
(gdb) info locals
Information about program variables
Software Development Tools Debugging 14
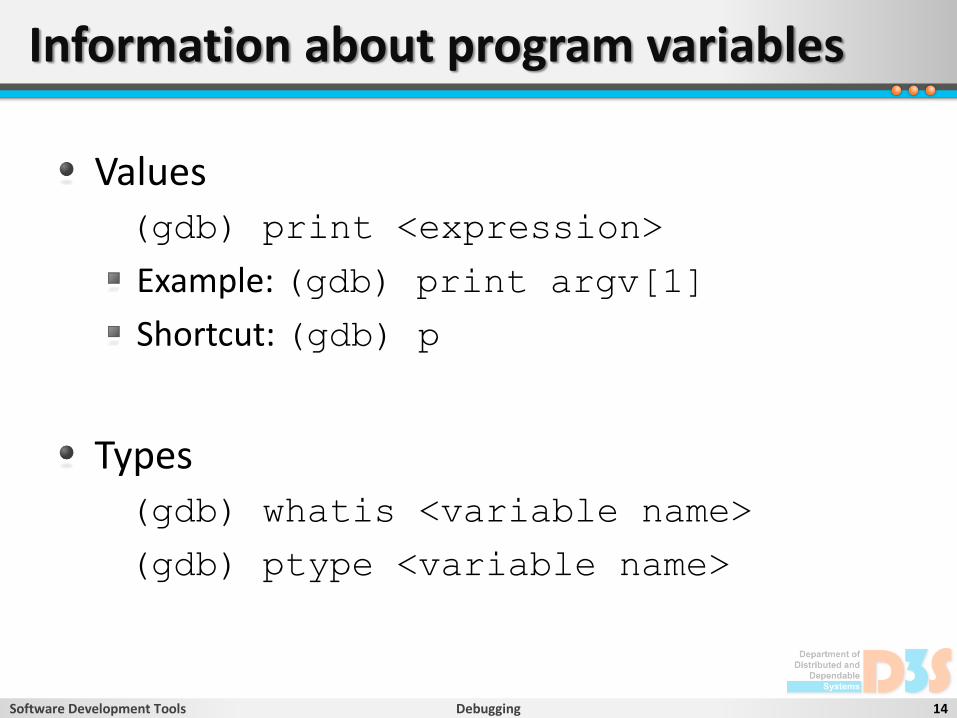
Values(gdb) print <expression>
Example: (gdb) print argv[1]
Shortcut: (gdb) p
Types(gdb) whatis <variable name>
(gdb) ptype <variable name>

Inspecting the call stack frames
Software Development Tools Debugging 15
Print call stack(gdb) backtrace
Shortcut: (gdb) bt
Including local variables(gdb) bt full
Selecting frames
Move frame up: (gdb) up [n]
Move down: (gdb) down [n]
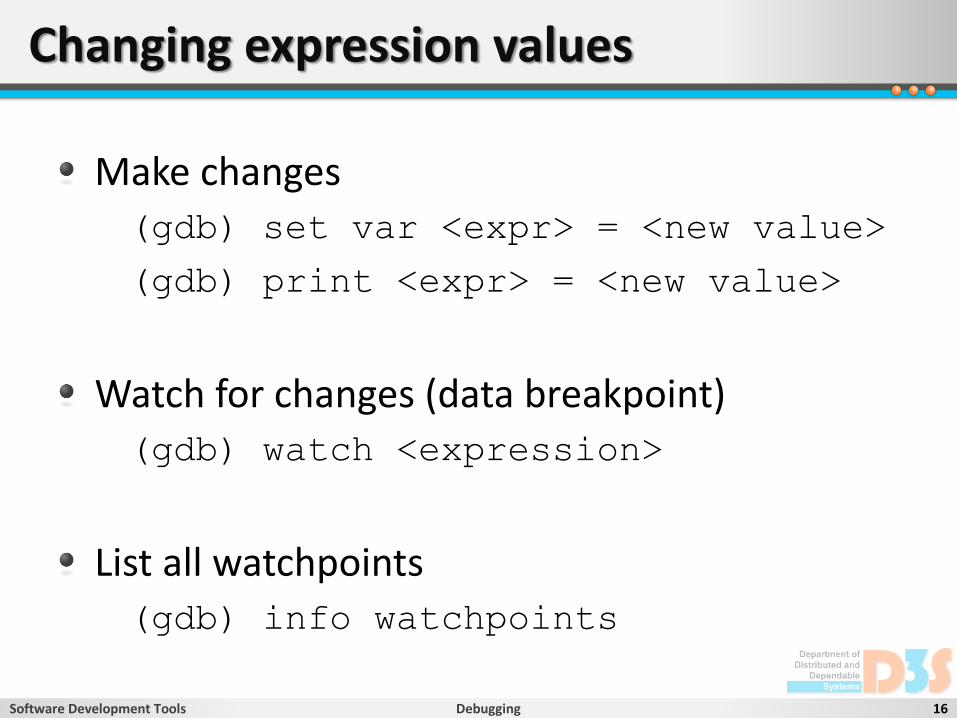
Changing expression values
Software Development Tools Debugging 16
Make changes(gdb) set var <expr> = <new value>
(gdb) print <expr> = <new value>
Watch for changes (data breakpoint)(gdb) watch <expression>
List all watchpoints(gdb) info watchpoints
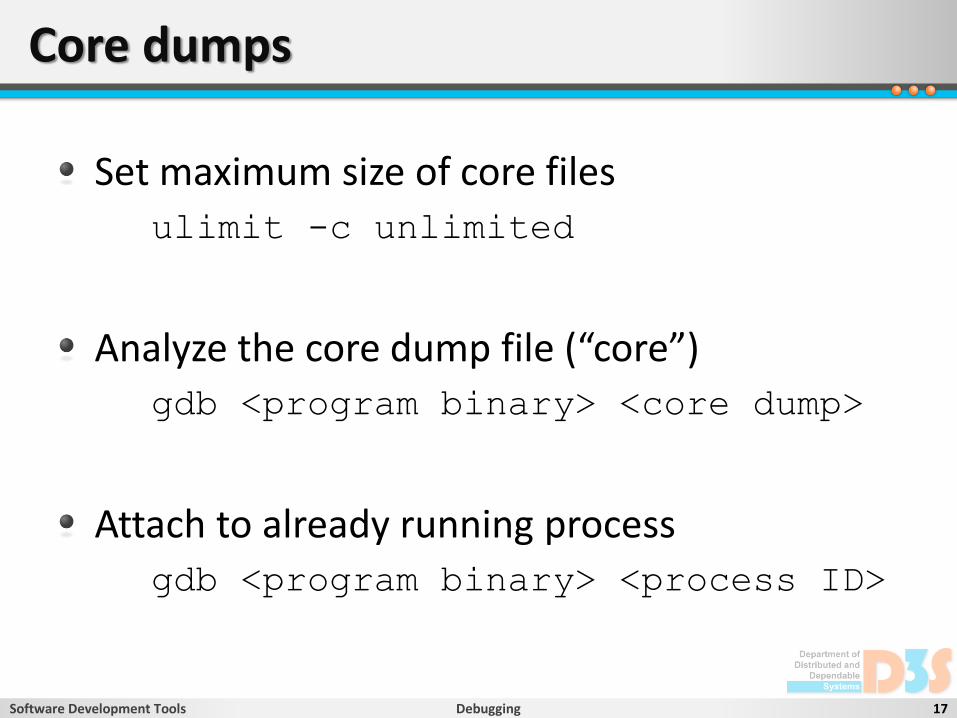
Core dumps
Software Development Tools Debugging 17
Set maximum size of core filesulimit -c unlimited
Analyze the core dump file (“core”)gdb <program binary> <core dump>
Attach to already running processgdb <program binary> <process ID>
Advanced features of GDB
Software Development Tools Debugging 18
Calling functions and jumps
Breakpoint command list
Support for multi-threading
Reverse execution
Record and replay
Remote debugging
GUI frontend: DDDhttp://www.gnu.org/software/ddd
Concurrency
Software Development Tools Debugging 19
Debuggers support multi-threaded programs
Including GDB
Problems
Programs behave differently when running in the debugger than in normal execution
Different internal timing of concurrent events
It is hard to find concurrency bugs with debuggers
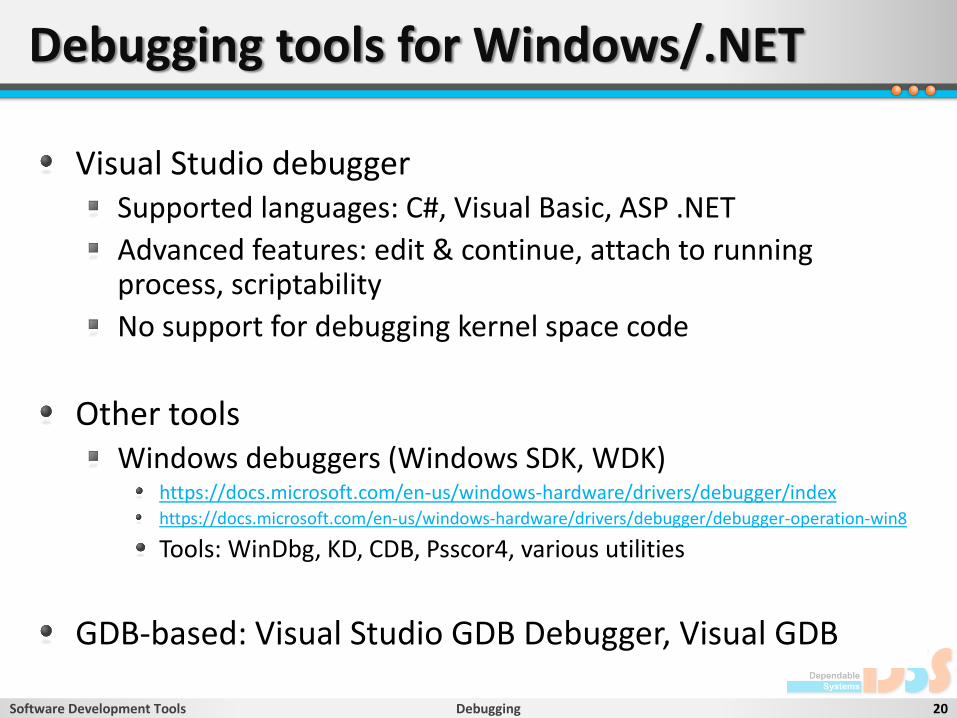
Debugging tools for Windows/.NET
Software Development Tools Debugging 20
Visual Studio debuggerSupported languages: C#, Visual Basic, ASP .NET
Advanced features: edit & continue, attach to running process, scriptability
No support for debugging kernel space code
Other toolsWindows debuggers (Windows SDK, WDK)
https://docs.microsoft.com/en-us/windows-hardware/drivers/debugger/indexhttps://docs.microsoft.com/en-us/windows-hardware/drivers/debugger/debugger-operation-win8
Tools: WinDbg, KD, CDB, Psscor4, various utilities
GDB-based: Visual Studio GDB Debugger, Visual GDB

Task 1
Software Development Tools Debugging 21
Examplehttp://d3s.mff.cuni.cz/files/teaching/nswi154/sudoku.tgz
Build with Make (sets flags “-g -Wall -O0”)
Run via the command ./sudoku vstup.txt
Try basic featuresRunning the program in debugger
Management of breakpoints
Single stepping commands
Printing information about the program and variables
Inspecting the call stack and switching frames
Changing values of selected program variables

Automated run-time checking
Software Development Tools Debugging 22
Idea: search for bugs during program execution
Main approachesReplacing libraries with debugging versions
Program linked with special versions of some library functions
Library functions (malloc, free, ...) perform runtime checks
Force program to crash upon a detected memory access error
Supported errors: buffer overflows, leaks, using freed memory
Tools: Dmalloc, DUMA
Monitoring execution of an instrumented program and looking for specific errors
Tools: Valgrind
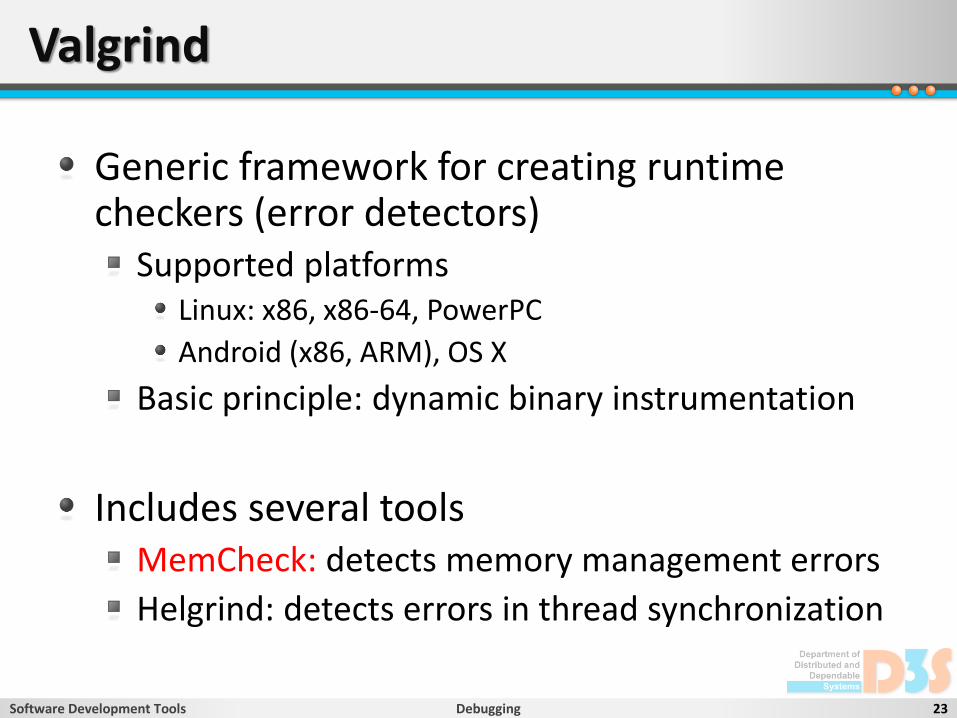
Valgrind
Software Development Tools Debugging 23
Generic framework for creating runtime checkers (error detectors)
Supported platformsLinux: x86, x86-64, PowerPC
Android (x86, ARM), OS X
Basic principle: dynamic binary instrumentation
Includes several toolsMemCheck: detects memory management errors
Helgrind: detects errors in thread synchronization

Running
Software Development Tools Debugging 24
Command line:valgrind <program> <arguments>
Recommended compiler flags to use-g -O0 -Wall -fno-inline
Avoid optimizations (-O1,-O2) when using Valgrind to detect errors in your program

MemCheck
Software Development Tools Debugging 25
Runningvalgrind [--tool=memcheck] <program>
Supported errorsAccessing freed memory blocks
Reading uninitialized variables
Double-freeing of heap blocks
Memory leaks (missing “free”)
How to enable leak detectionvalgrind --leak-check=yes <program>

MemCheck: output
Software Development Tools Debugging 26
Buffer overflow== 2456 == Invalid write of size 4
== 2456 == at 0x204A68D: myfunc (myprog.c:95)
== 2456 == at 0x204A120: main (myprog.c:14)
== 2456 == Address 0x2684FF0 is 8 bytes after a block of
size 64 alloc’d
== 2456 == at 0x2684FA8: malloc (vg_replace_malloc.c:130)
== 2456 == by 0x204A0E8: main(myproc.c:10)
Memory leak== 1789 == 32 bytes in 1 blocks are definitely lost in loss
record 1 of 1
== 1789 == at 0x2F4482D: malloc (vg_replace_malloc.c:130)
== 1789 == at 0x204A692: myfunc (myprog.c:112)
== 1789 == at 0x204A130: main (myprog.c:20)
PID
kind of errorstacktraceidentifies thepoint where theerror occurred
description of the memory addressinvolved in the error
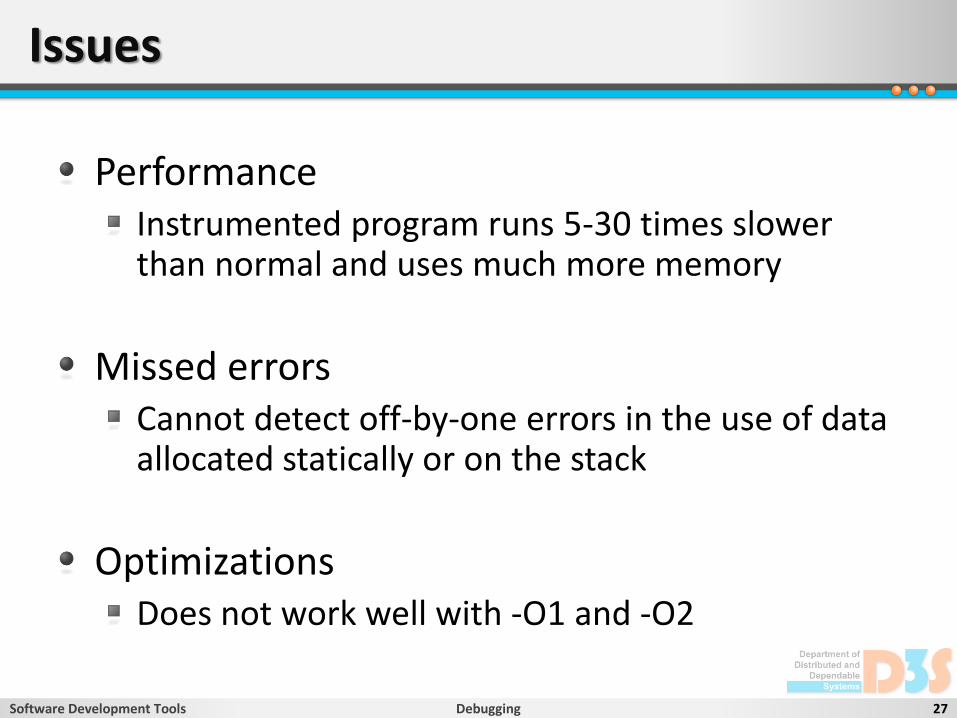
Issues
Software Development Tools Debugging 27
PerformanceInstrumented program runs 5-30 times slower than normal and uses much more memory
Missed errorsCannot detect off-by-one errors in the use of data allocated statically or on the stack
OptimizationsDoes not work well with -O1 and -O2
Task 2
Software Development Tools Debugging 28
Try using MemCheck on the sudoku program
Inspect reported warnings (memory leaks)
Try using Valgrind on some programs in the Linux distribution (ls, cat, ...) and on your simple programs in C/C++

Advanced topics
Software Development Tools Debugging 29
SuppressionsIgnoring reported false positives and errors found in system libraries
Useful options--read-var-info=yes
Information about variables (name, type, location)
--track-origins=yes
Shows where the uninitialized variables come from
Connecting Valgrind with GDB
Links
Software Development Tools Debugging 30
GDBhttp://www.sourceware.org/gdb
jdb: The Java Debuggerhttp://docs.oracle.com/javase/8/docs/technotes/tools/unix/jdb.html
Dmallochttp://dmalloc.com
DUMAhttp://sourceforge.net/projects/duma
Valgrindhttp://valgrind.org/
Sanitizers from Google (address, memory, leak, thread)https://github.com/google/sanitizers

Static code analyzers
Software Development Tools Debugging 31
Automated search for common problems in source code at compile-time
bug patterns, suspicious constructs, bad practice
Focus on semantics (behavior)Compiler has already checked the syntax
Modular analysis (each procedure separately)
Trade-off: precision versus performancefalse positives, missed errors
Detect only simple bugs in the source codebut still very useful (highly recommended to use)
What the analyzers detect
Software Development Tools Debugging 32
Basic patternsPossible null dereferences
Comparing strings with ==
Ignoring result of method callExample: InputStream.read()
Array index out of bounds
Wrong usage of APIStream not closed when exception occurs
Memory usage errorsdouble free(), possible leaks

Tools
Software Development Tools Debugging 33
JavaFindBugs, Jlint, PMD, Checkstyle, Error Prone, Checker Framework
C/C++Clang, PREfast, Cppcheck
C#/.NETStyleCop, FxCop, ReSharper, RoslynatorMicrosoft Application Inspector
Other (including commercial products)SonarQube
FindBugs
Software Development Tools Debugging 34
Bug patterns detector for Java
Source code available (LGPL)
Usage: command line, GUI, Ant, Maven
Integration with Eclipse (plugin)
http://findbugs.sourceforge.net/
Demo: FindBugs
Software Development Tools Debugging 35
FindBugs: advanced features
Software Development Tools Debugging 36
Filtering bugs
Annotations
Data mining

Clang static analyzer
Software Development Tools Debugging 37
LLVM compiler infrastructure project
Clang front-end (C, C++, Objective-C)
Source code available (BSD-like license)
User interface: command-line
http://clang-analyzer.llvm.org/

Demo: Clang
Software Development Tools Debugging 38
Command: scan-buildIntercepts standard build process (CC, CXX)
Runs compiler and then static code analyzer
How to use itscan-build <your build command>
Examplesscan-build ./configure ; make
scan-build gcc test.c mylib.c
Output: HTML files (bug reports)

Clang: options
Software Development Tools Debugging 39
List all available checkers
Command: scan-build -h
Enabling some checkerscan-build -enable-checker [name]
Task 3
Software Development Tools Debugging 40
FindBugsDownload and unpack
http://findbugs.sourceforge.net/downloads.html
How to run itLinux/Windows: bin/findbugsOther options (e.g., heap size)
http://findbugs.sourceforge.net/manual/running.html
Clang static analyzer
Target programsYour own (“zápočťáky”, “softwarový projekt”)Widely known open source software packages
Related courses
Software Development Tools Debugging 41
Tools for detecting complicated bugs
concurrency (deadlocks, data races), assertions
NSWI101: Modely a verifikace chování systémů
NSWI132: Analýza programů a verifikace kódu
Links (other tools)
Software Development Tools Debugging 42
Cppcheck: http://cppcheck.sourceforge.net/
PMD: http://pmd.github.io/
Checkstyle: https://checkstyle.sourceforge.io/
Error Prone: http://errorprone.info/
FxCop: https://docs.microsoft.com/en-us/previous-versions/dotnet/netframework-3.0/bb429476(v=vs.80)
ReSharper: https://www.jetbrains.com/resharper/
SonarQube: https://www.sonarqube.org/
Microsoft Application Inspectorhttps://www.microsoft.com/security/blog/2020/01/16/introducing-microsoft-application-inspector/
Roslynator
Software Development Tools Debugging 43
Extensible static analysis tool for C#
Additional informationhttps://www.infoq.com/news/2020/01/roslynator-analyzers-231/
https://github.com/JosefPihrt/Roslynator
https://devblogs.microsoft.com/dotnet/write-better-code-faster-with-roslyn-analyzers/
https://docs.microsoft.com/en-gb/visualstudio/code-quality/roslyn-analyzers-overview?view=vs-2019

Checker Framework
Software Development Tools Debugging 44
Extends type system of Java
Source code annotations
Compiler plugins (“checkers”)
Responsible for type checking and inference
Detects many kinds of bugs
null pointer exceptions, array index out of bounds, ...
Web: https://checkerframework.org/
Homework
Software Development Tools Debugging 45
Assignmenthttp://d3s.mff.cuni.cz/files/teaching/nswi154/ukoly/
Deadline
17.11.2021 / 22.11.2021


![Test-Driven Fault Navigation for Debugging Reproducible ...€¦ · assigning bug reports to more experienced devel-opers [2] reduces overall debugging time, ... 3.1 Debugging Reproducible](https://img.pdfslide.net/doc/110x75/5f696dcb8c90ef0dec3ba1ca/test-driven-fault-navigation-for-debugging-reproducible-assigning-bug-reports.jpg)