Embed Size (px)
Citation preview

© 2018 Arm Limited
Ryan Hulguin
HPC Senior Applications Engineer
Debugging and Profiling HPC Applications
ATPESC
August 7, 2019

© 2018 Arm Limited2
Agenda
• General Debugging and Profiling Advice
• Arm Software for Debugging and Profiling
• Debugging with DDT
• Profiling with MAP
• Theta Specific Settings
© 2018 Arm Limited3
Debugging
Transforming a broken program to a working one
How? TRAFFIC!
•Track the problem
•Reproduce
•Automate - (and simplify) the test case
•Find origins – where could the “infection” be from?
•Focus – examine the origins
• Isolate – narrow down the origins
•Correct – fix and verify the test case is successful
© 2018 Arm Limited4
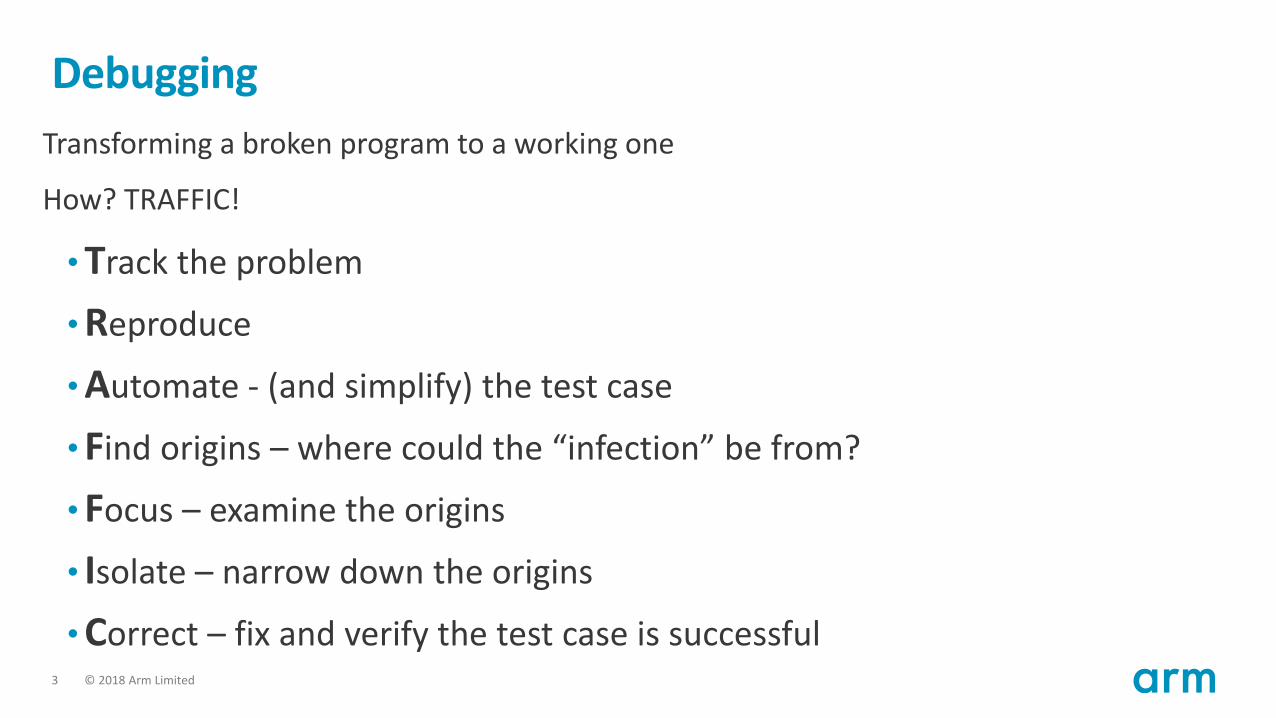
ProfilingProfiling is central to understanding and improving application performance.
No
No
ProfileYes
Yes
Yes
Refine the Profile
File I/O
Memory
CPU
No
No
Buffers, data formats, in-memory filesystems
Collectives, blocking, non-blocking, topology,
load balance
Bandwidth/latency, cache utilization
Vectors, branches, integer, floating point
Yes
Identify Hotspots Focus Optimization
50x
10x
5x
2x
Communication
© 2018 Arm Limited5
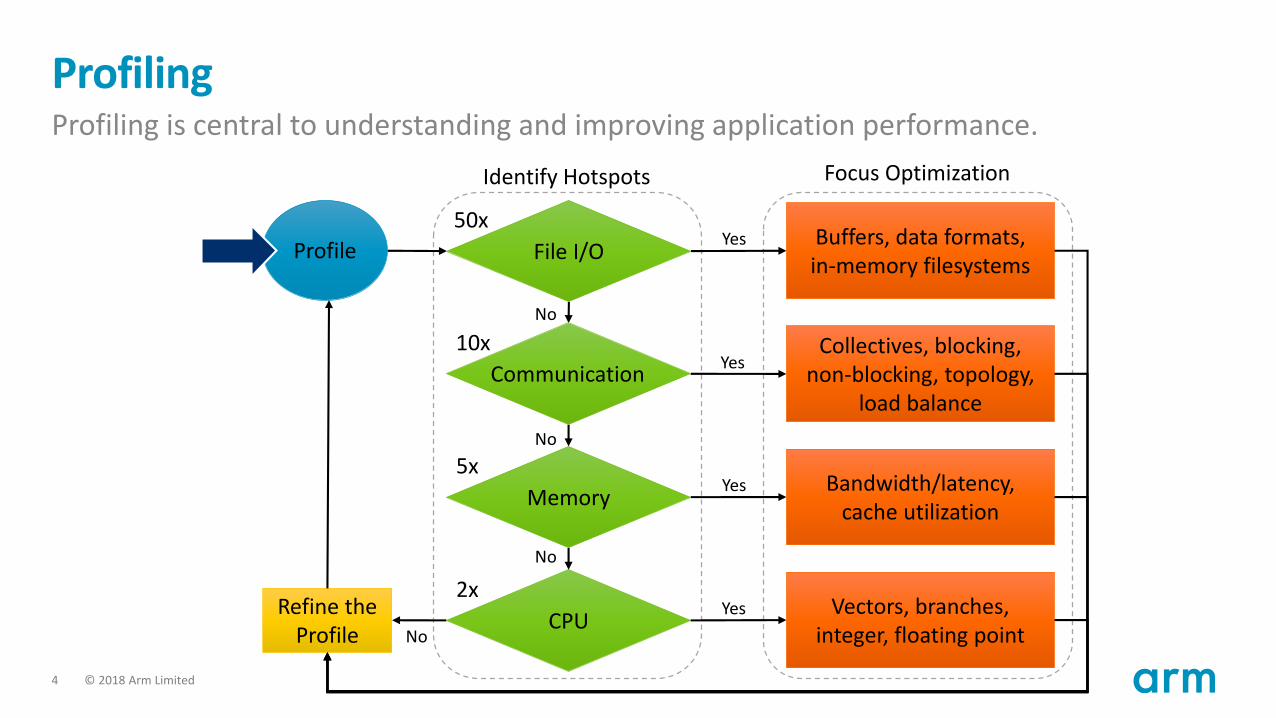
Performance Improvement Workflow
Get a realistic test case
Profile your code
Look for the significant
What is the nature of the
problem?
Apply brain to solve
Think of the future
© 2018 Arm Limited
Arm Software
© 2018 Arm Limited7
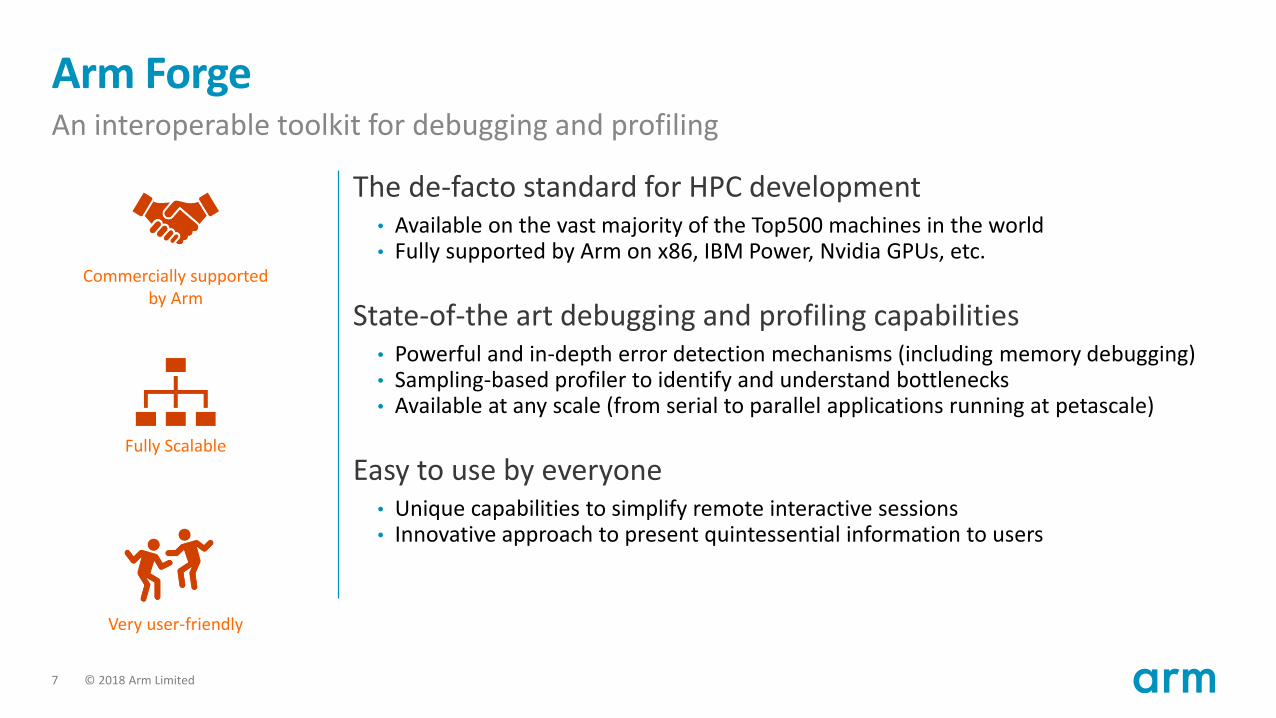
Arm ForgeAn interoperable toolkit for debugging and profiling
The de-facto standard for HPC development• Available on the vast majority of the Top500 machines in the world• Fully supported by Arm on x86, IBM Power, Nvidia GPUs, etc.
State-of-the art debugging and profiling capabilities• Powerful and in-depth error detection mechanisms (including memory debugging)• Sampling-based profiler to identify and understand bottlenecks• Available at any scale (from serial to parallel applications running at petascale)
Easy to use by everyone• Unique capabilities to simplify remote interactive sessions• Innovative approach to present quintessential information to users
Very user-friendly
Fully Scalable
Commercially supportedby Arm
© 2018 Arm Limited8
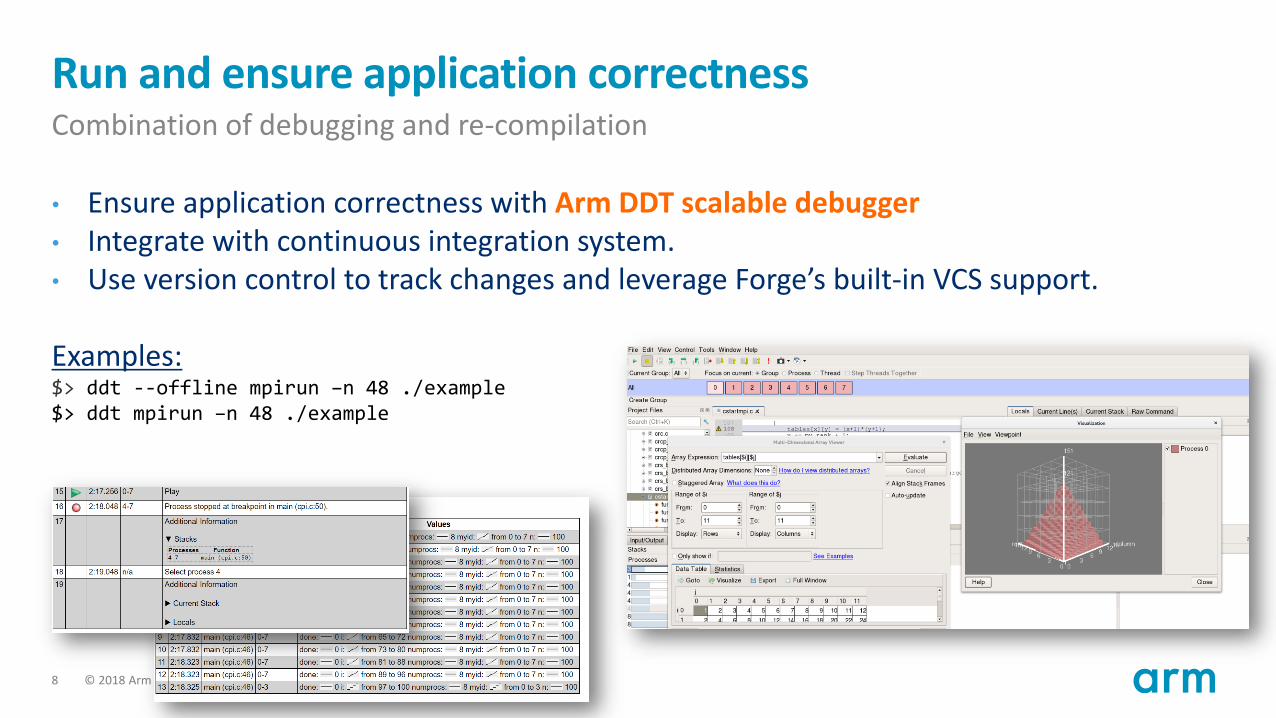
Run and ensure application correctnessCombination of debugging and re-compilation
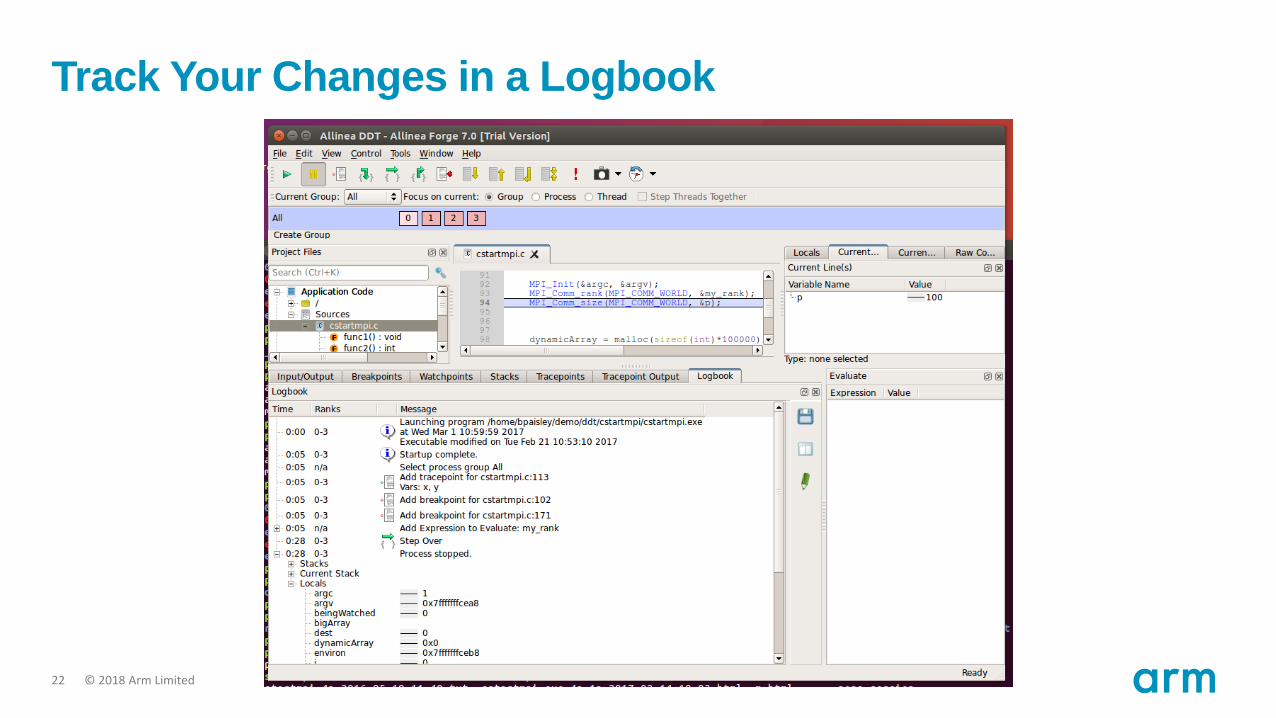
• Ensure application correctness with Arm DDT scalable debugger• Integrate with continuous integration system.• Use version control to track changes and leverage Forge’s built-in VCS support.
Examples:$> ddt --offline mpirun –n 48 ./example$> ddt mpirun –n 48 ./example

© 2018 Arm Limited9
Visualize the performance of your application
• Measure all performance aspects with Arm MAP parallel profiler• Identify bottlenecks and rewrite some code for better performance
Examples:$> map --profile mpirun –n 48 ./example
© 2018 Arm Limited
Debugging with DDT
© 2018 Arm Limited11
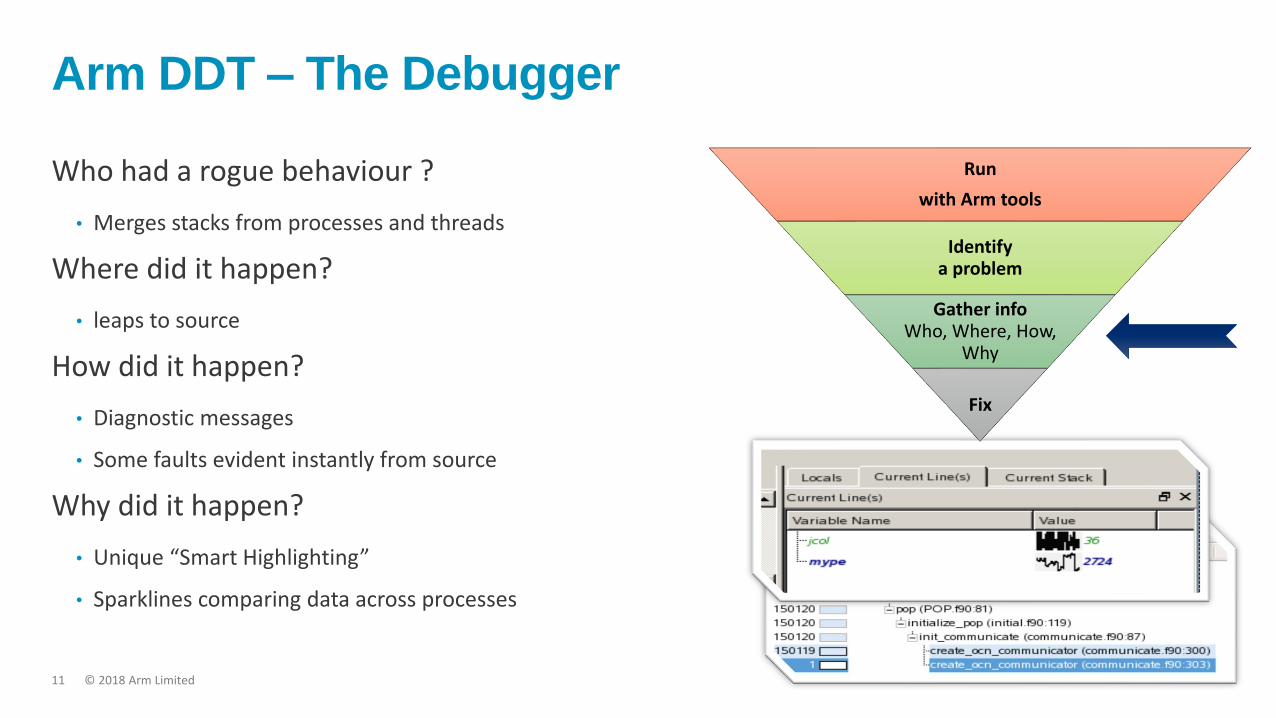
Arm DDT – The Debugger
Who had a rogue behaviour ?
• Merges stacks from processes and threads
Where did it happen?
• leaps to source
How did it happen?
• Diagnostic messages
• Some faults evident instantly from source
Why did it happen?
• Unique “Smart Highlighting”
• Sparklines comparing data across processes
Run
with Arm tools
Identify a problem
Gather infoWho, Where, How,
Why
Fix
© 2018 Arm Limited12
Preparing Code for Use with DDT
As with any debugger, code must be compiled with the debug flag typically -g
It is recommended to turn off optimization flags i.e. –O0
Leaving optimizations turned on can cause the compiler to optimize out some variables and even functions making it more difficult to debug
© 2018 Arm Limited13
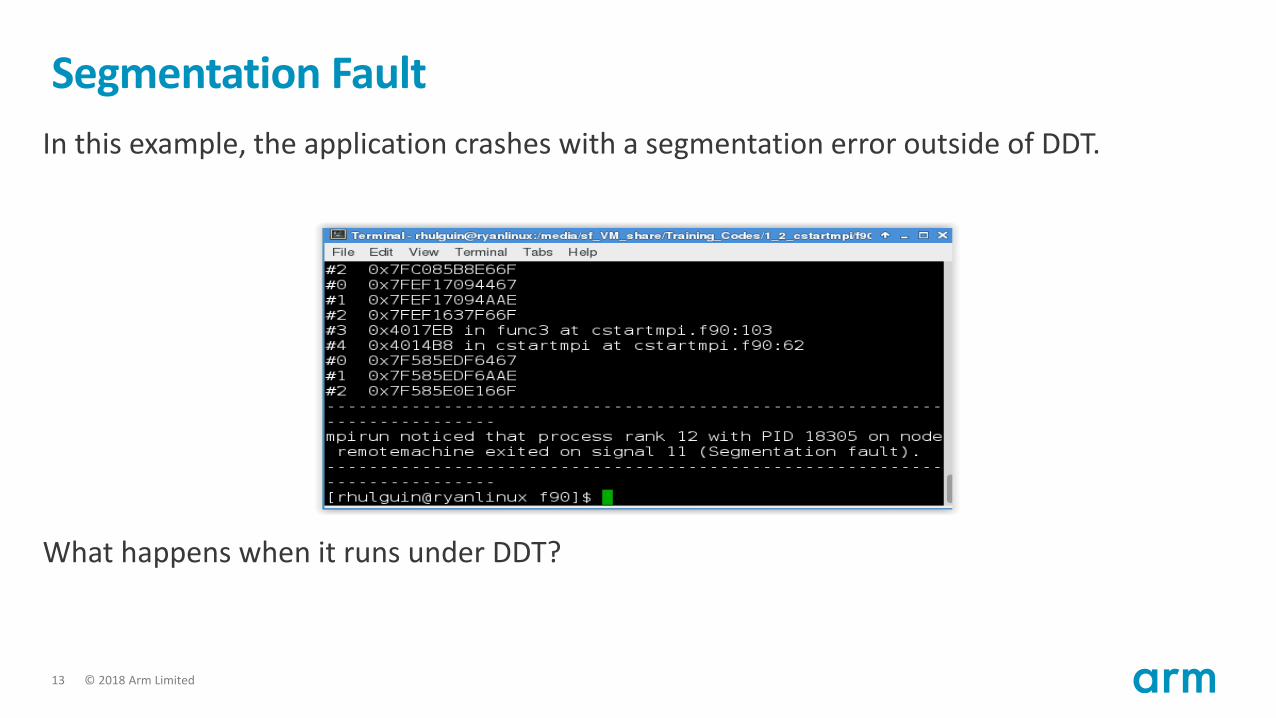
Segmentation Fault
In this example, the application crashes with a segmentation error outside of DDT.
What happens when it runs under DDT?
© 2018 Arm Limited14
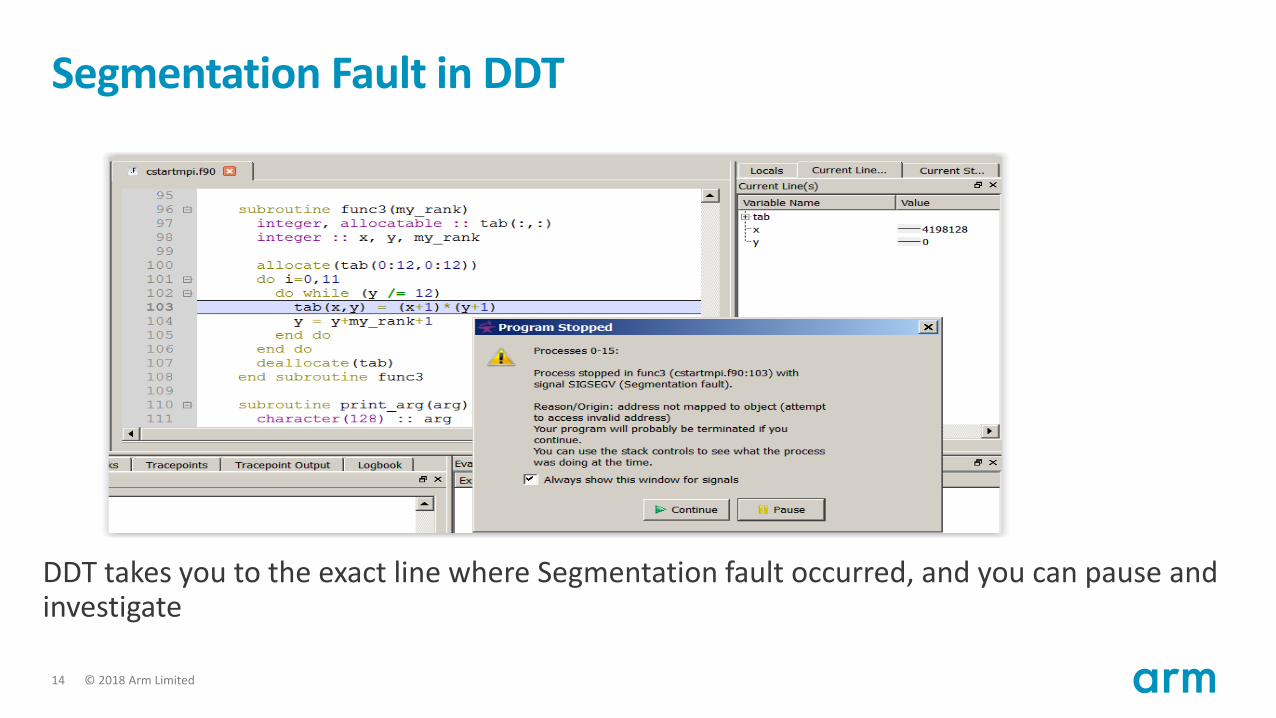
Segmentation Fault in DDT
DDT takes you to the exact line where Segmentation fault occurred, and you can pause and investigate
© 2018 Arm Limited15
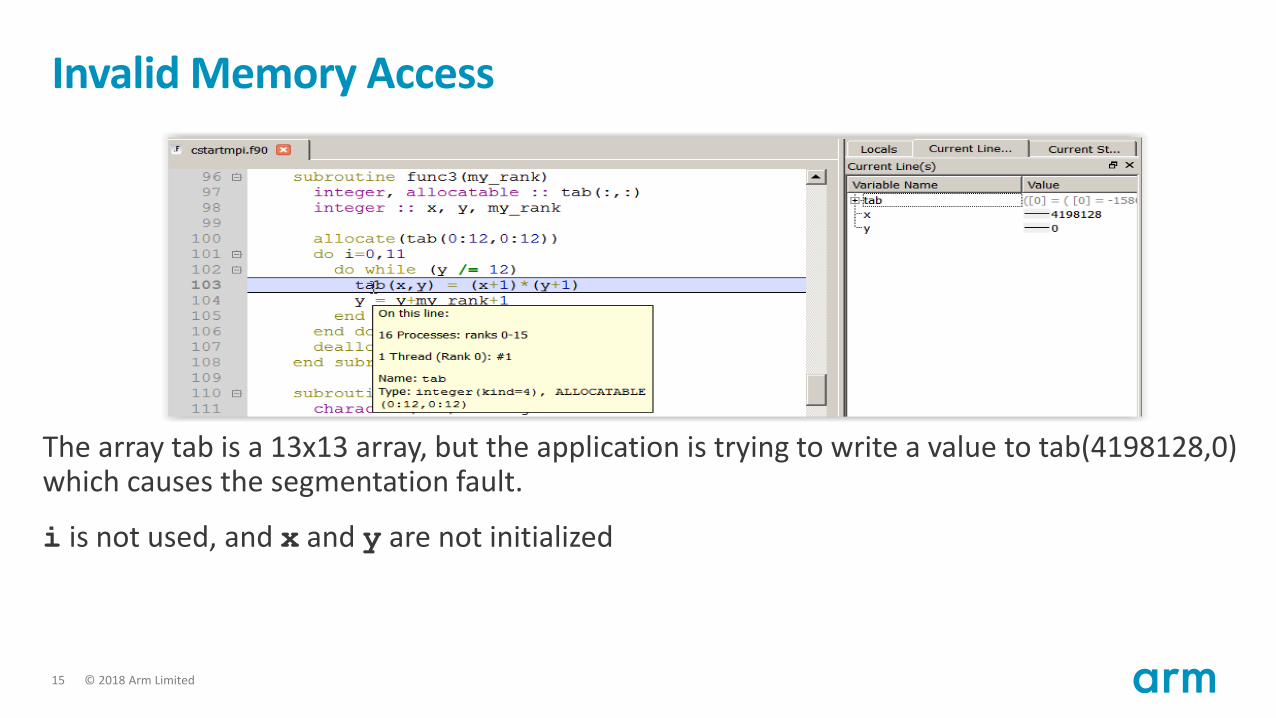
Invalid Memory Access
The array tab is a 13x13 array, but the application is trying to write a value to tab(4198128,0) which causes the segmentation fault.
i is not used, and x and y are not initialized
© 2018 Arm Limited16
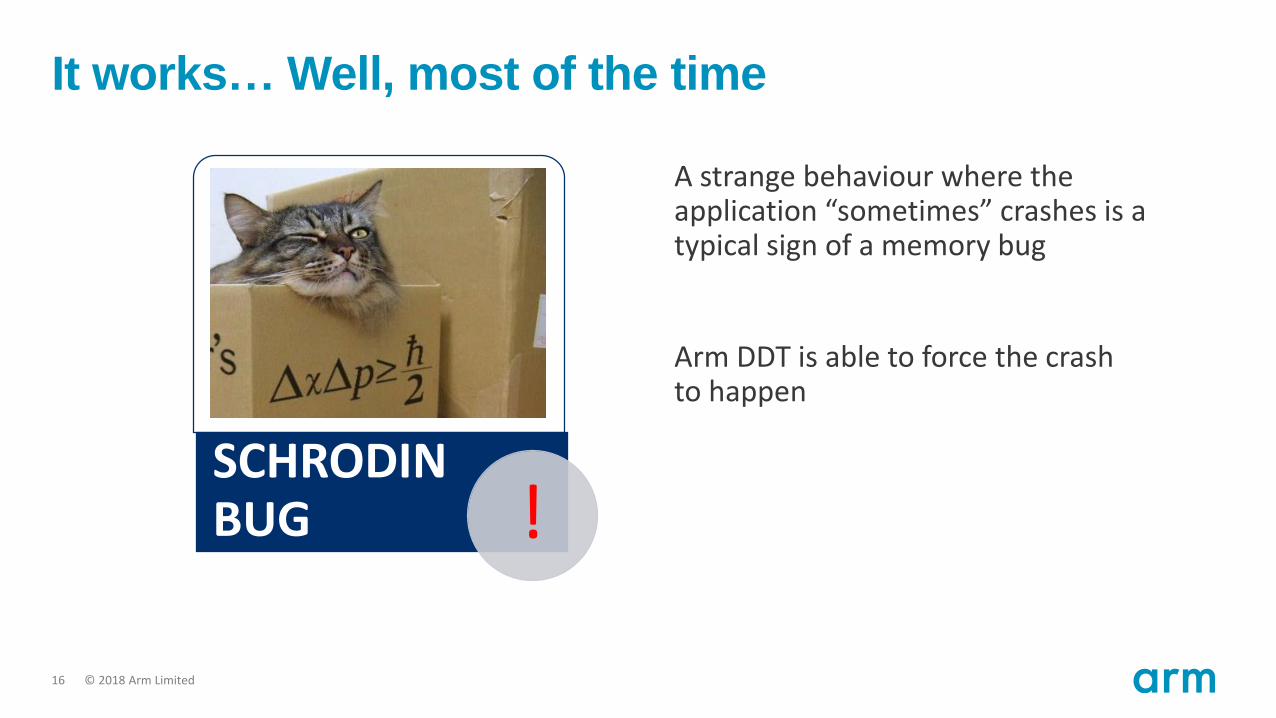
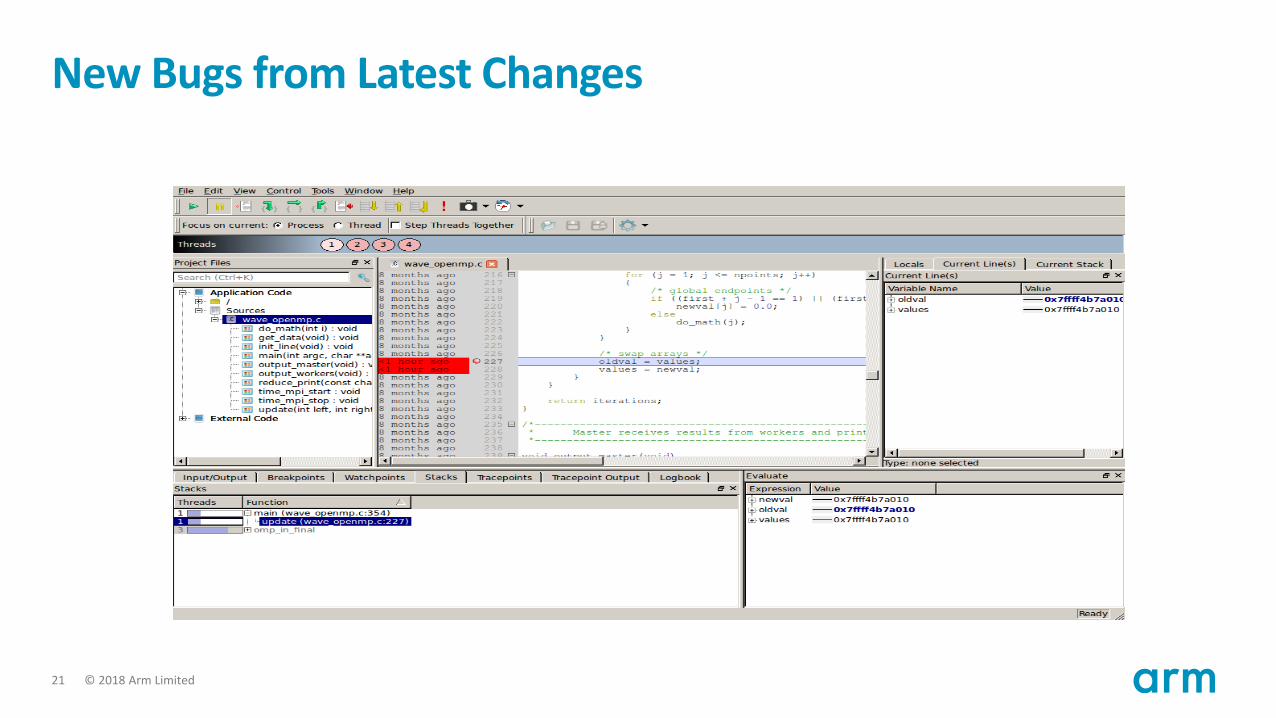
It works… Well, most of the time
A strange behaviour where the application “sometimes” crashes is a typical sign of a memory bug
Arm DDT is able to force the crash to happen
•I am buggy AND not buggy. How about that?
SCHRODINBUG !
© 2018 Arm Limited17
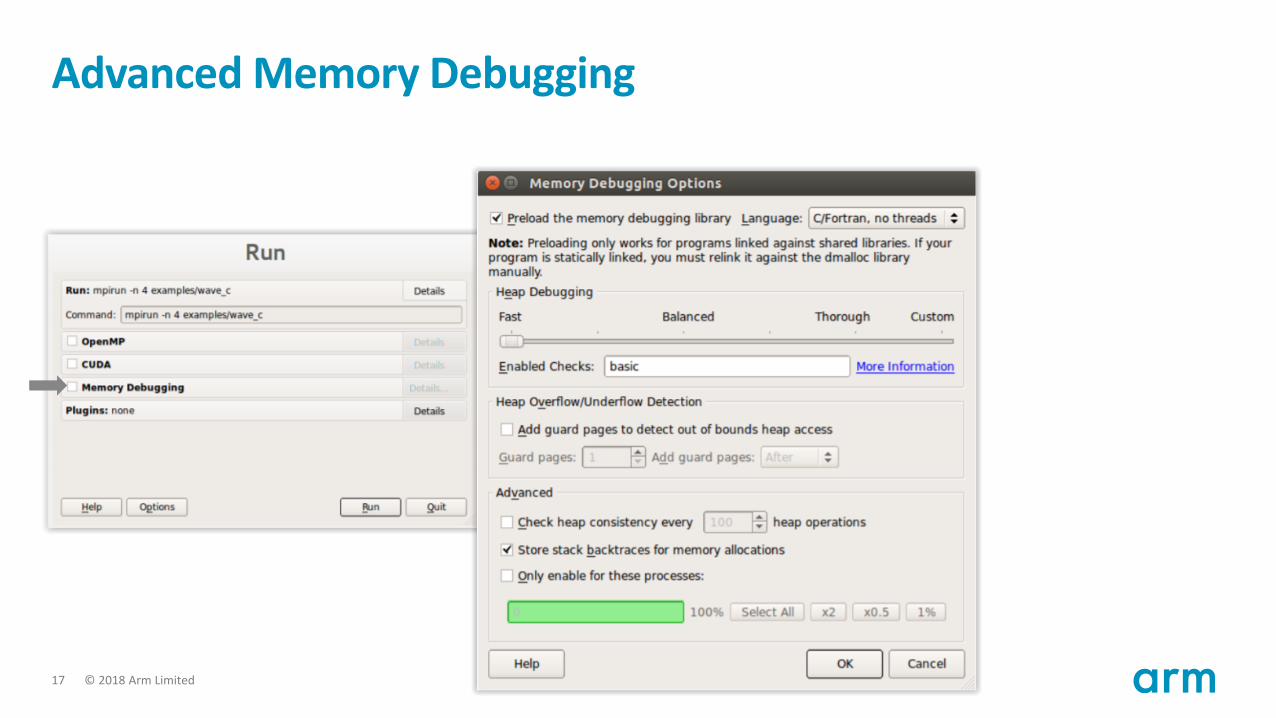
Advanced Memory Debugging
© 2018 Arm Limited18
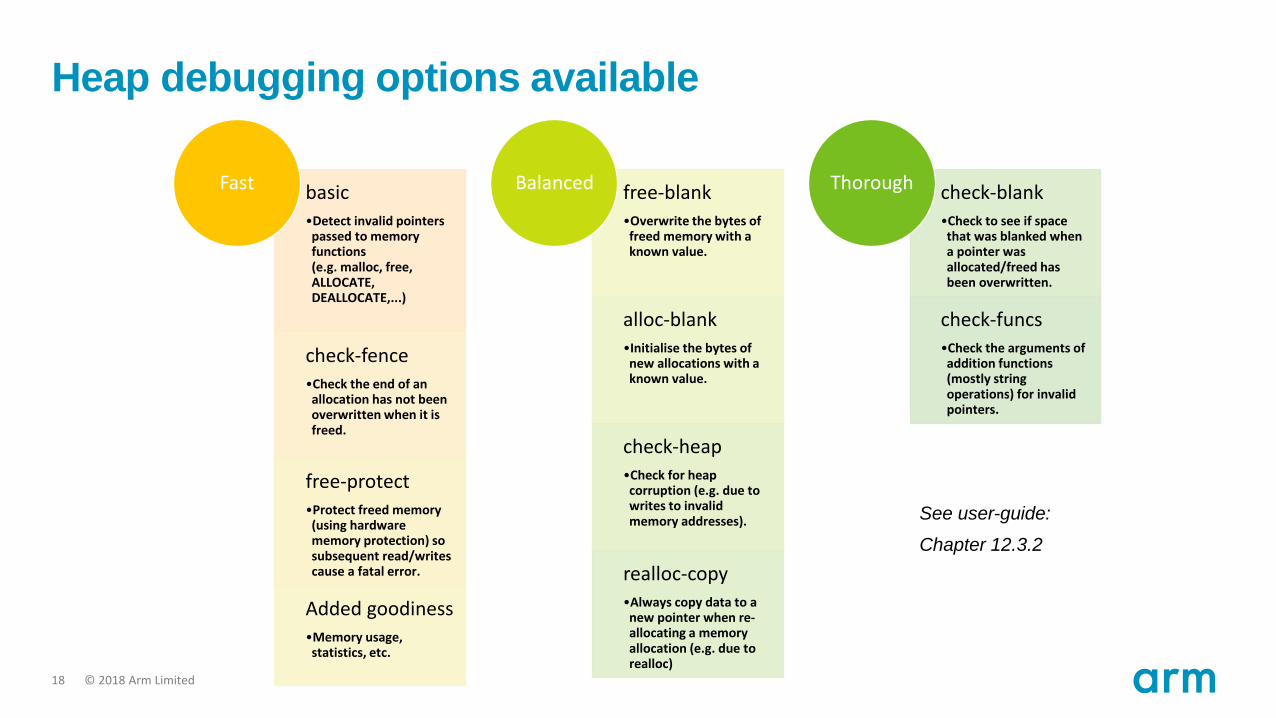
Heap debugging options available
basic•Detect invalid pointers passed to memory functions (e.g. malloc, free, ALLOCATE, DEALLOCATE,...)
check-fence•Check the end of an allocation has not been overwritten when it is freed.
free-protect•Protect freed memory (using hardware memory protection) so subsequent read/writes cause a fatal error.
Added goodiness•Memory usage, statistics, etc.
Fast free-blank•Overwrite the bytes of freed memory with a known value.
alloc-blank•Initialise the bytes of new allocations with a known value.
check-heap•Check for heap corruption (e.g. due to writes to invalid memory addresses).
realloc-copy•Always copy data to a new pointer when re-allocating a memory allocation (e.g. due to realloc)
Balanced check-blank•Check to see if space that was blanked when a pointer was allocated/freed has been overwritten.
check-funcs•Check the arguments of addition functions (mostly string operations) for invalid pointers.
Thorough
See user-guide:
Chapter 12.3.2

© 2018 Arm Limited19
Guard pages (aka “Electric Fences”)
4 kBytes
(typically
)
MEMORY ALLOCATIONGUARDPAGE
GUARDPAGE
MEMORY ALLOCATIONGUARDPAGE
GUARDPAGE
• A powerful feature…:
• Forbids read/write on guard pages throughout the whole execution
(because it overrides C Standard Memory Management library)
• … to be used carefully:
• Kernel limitation: up to 32k guard pages max ( “mprotect fails” error)
• Beware the additional memory usage cost
© 2018 Arm Limited20
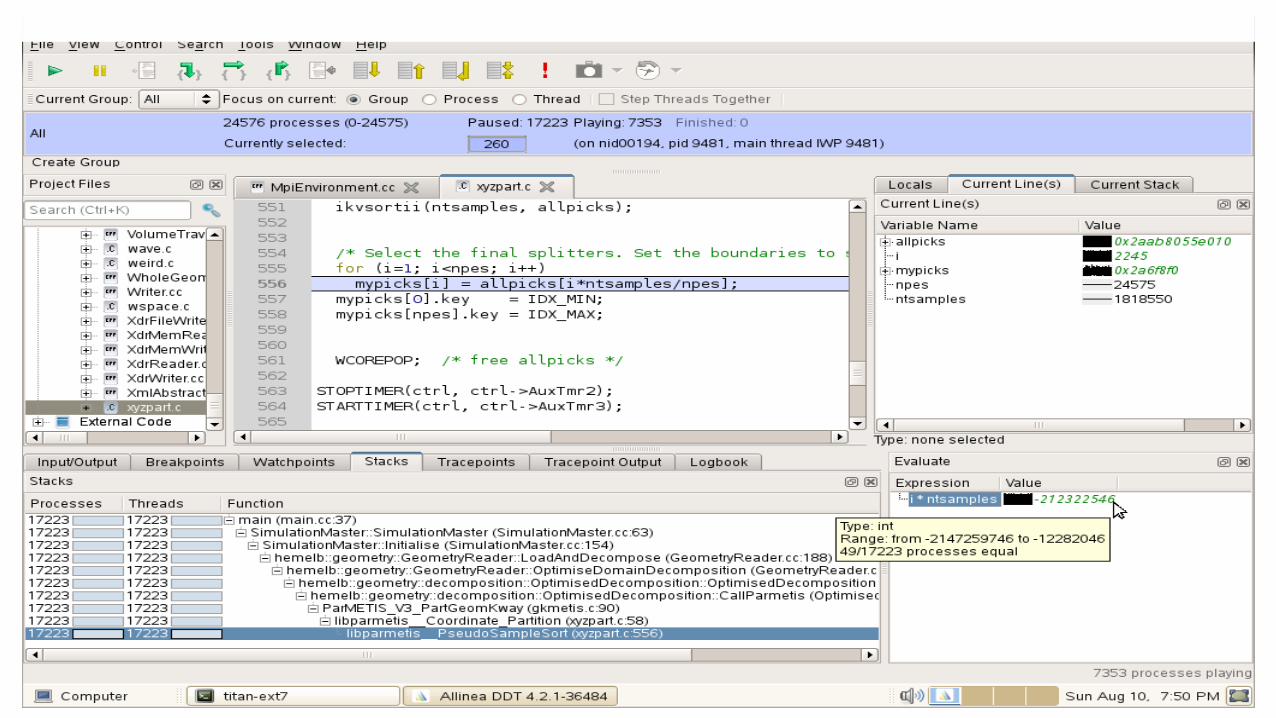
Ah… Integer overflow!
© 2018 Arm Limited21
New Bugs from Latest Changes
© 2018 Arm Limited22
caption
Track Your Changes in a Logbook
© 2018 Arm Limited
Arm DDT Demo
© 2018 Arm Limited24
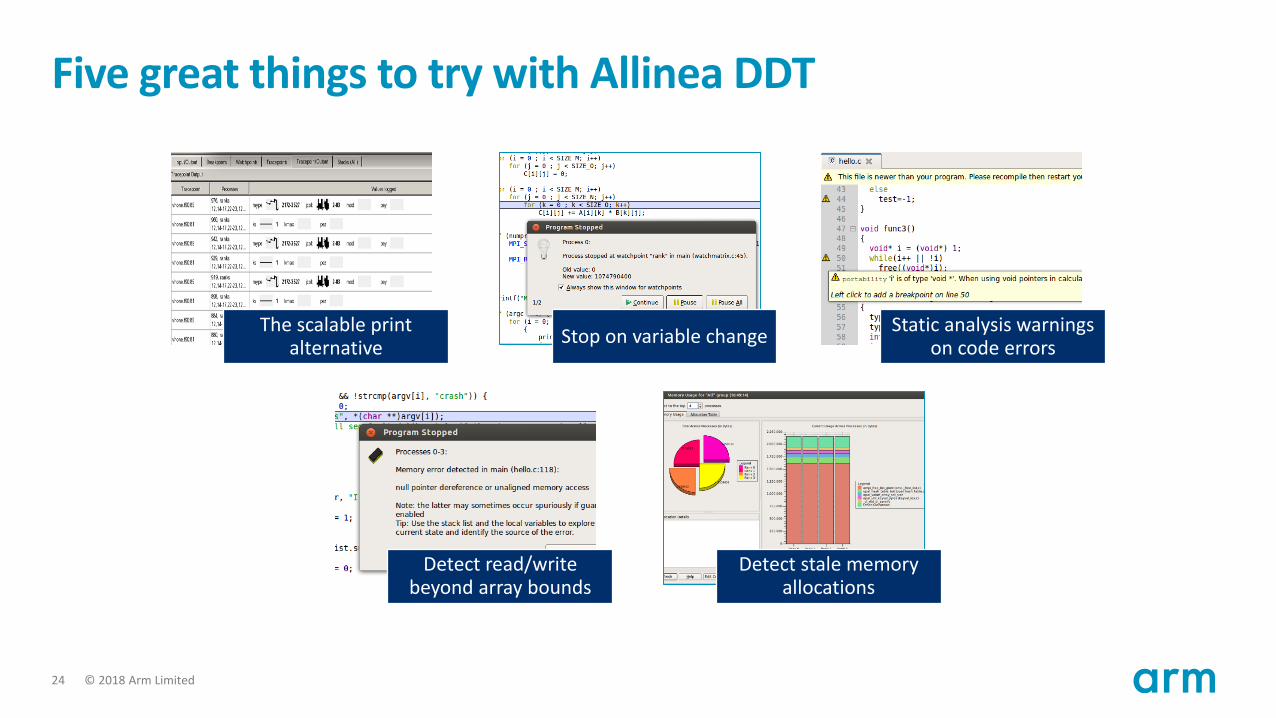
Five great things to try with Allinea DDT
The scalable print alternative
Stop on variable changeStatic analysis warnings
on code errors
Detect read/write beyond array bounds
Detect stale memory allocations
© 2018 Arm Limited25
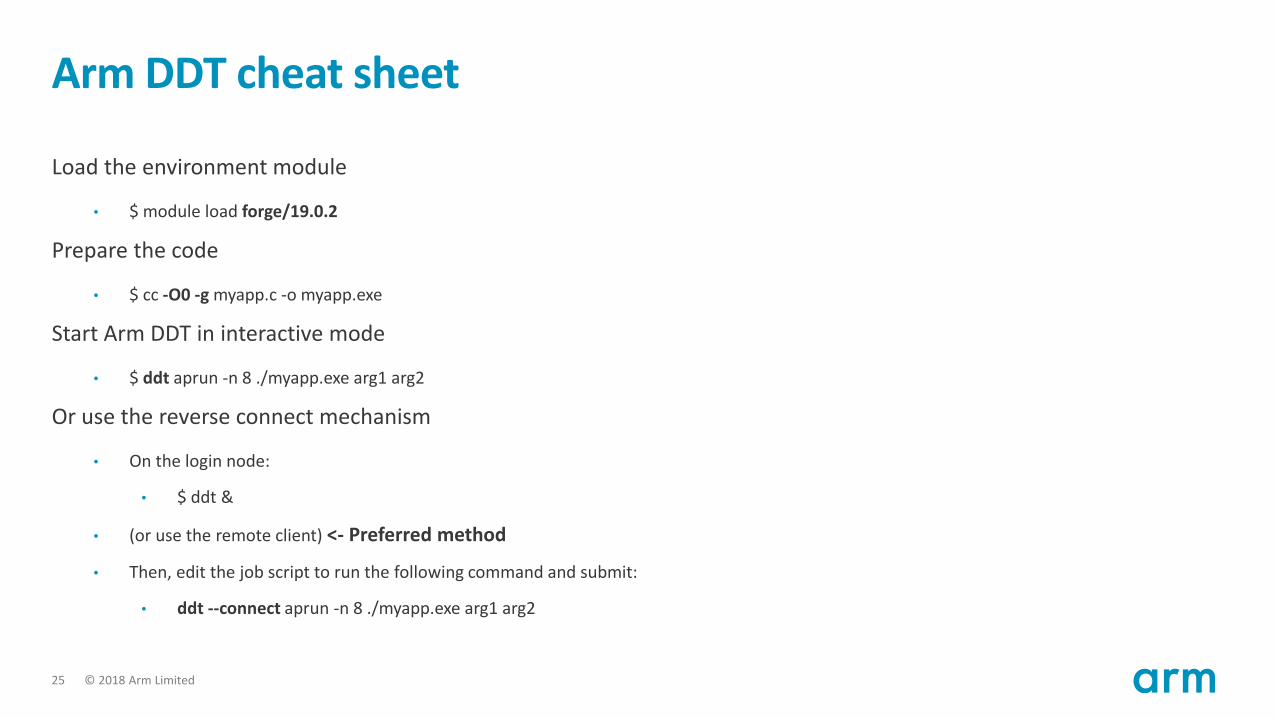
Arm DDT cheat sheet
Load the environment module
• $ module load forge/19.0.2
Prepare the code
• $ cc -O0 -g myapp.c -o myapp.exe
Start Arm DDT in interactive mode
• $ ddt aprun -n 8 ./myapp.exe arg1 arg2
Or use the reverse connect mechanism
• On the login node:
• $ ddt &
• (or use the remote client) <- Preferred method
• Then, edit the job script to run the following command and submit:
• ddt --connect aprun -n 8 ./myapp.exe arg1 arg2

© 2018 Arm Limited
Profiling with MAP
© 2018 Arm Limited27
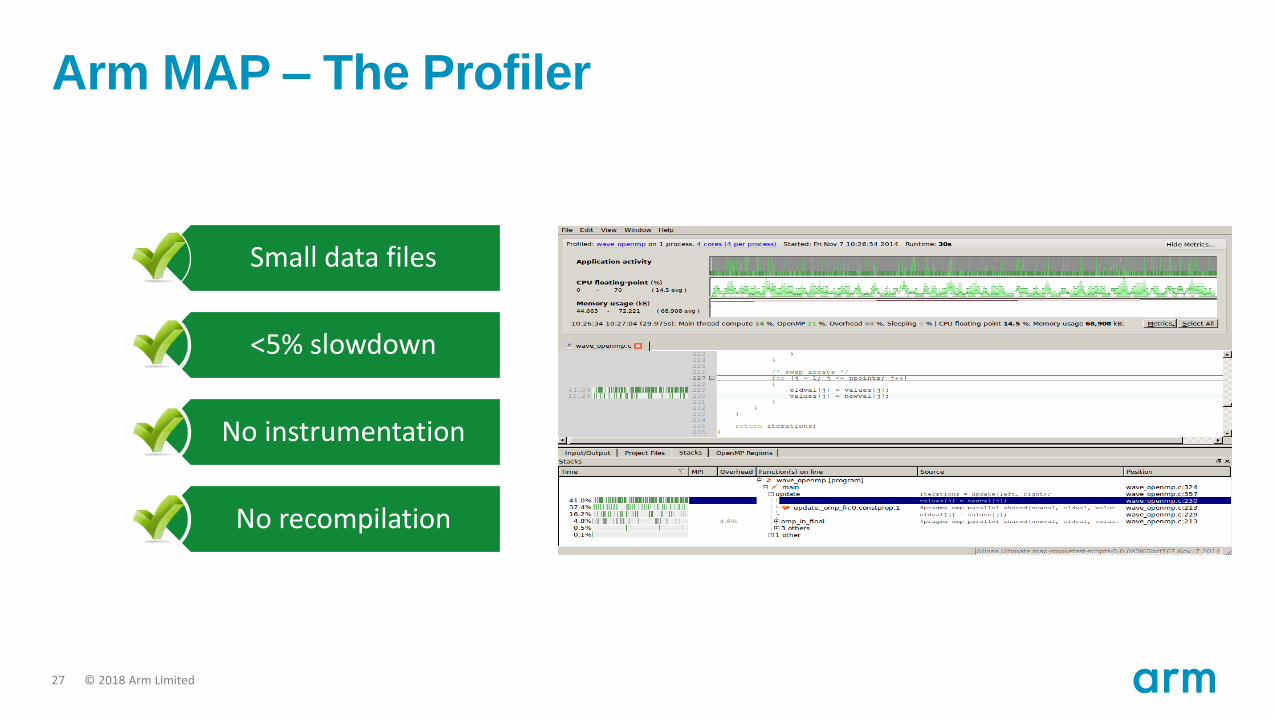
Small data files
<5% slowdown
No instrumentation
No recompilation
Arm MAP – The Profiler
© 2018 Arm Limited28
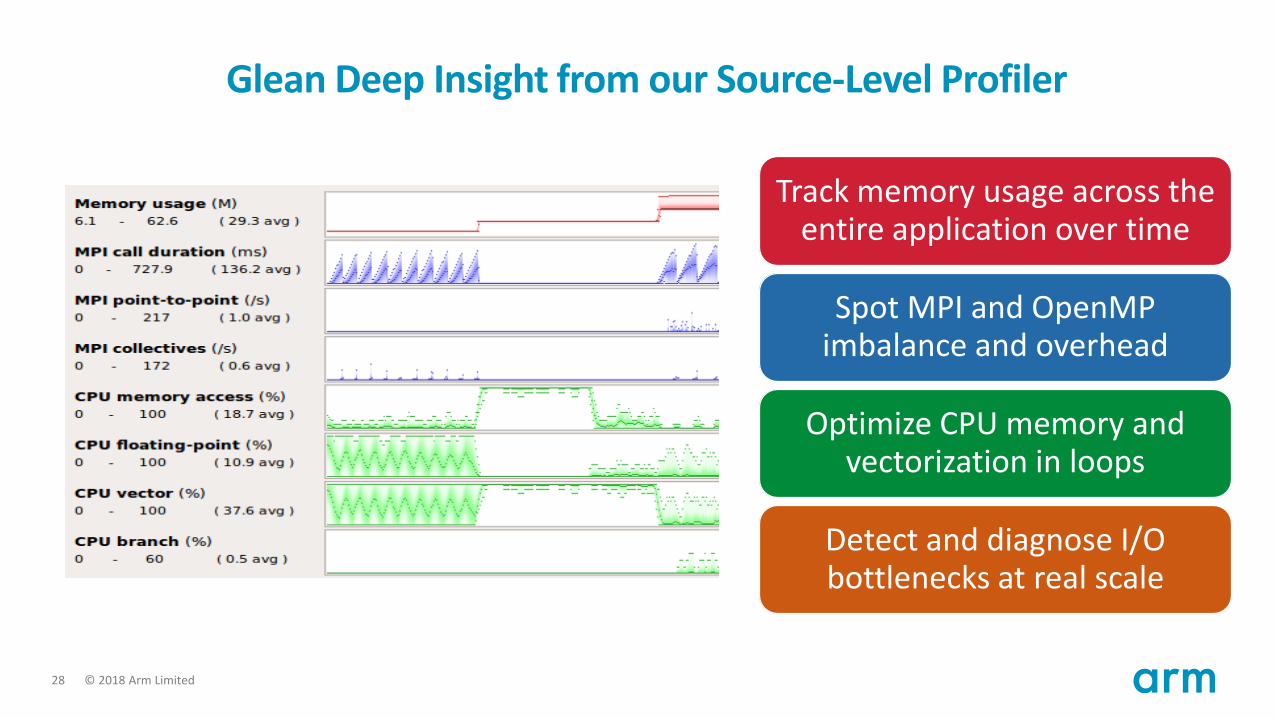
Glean Deep Insight from our Source-Level Profiler
Track memory usage across the entire application over time
Spot MPI and OpenMP imbalance and overhead
Optimize CPU memory and vectorization in loops
Detect and diagnose I/O bottlenecks at real scale
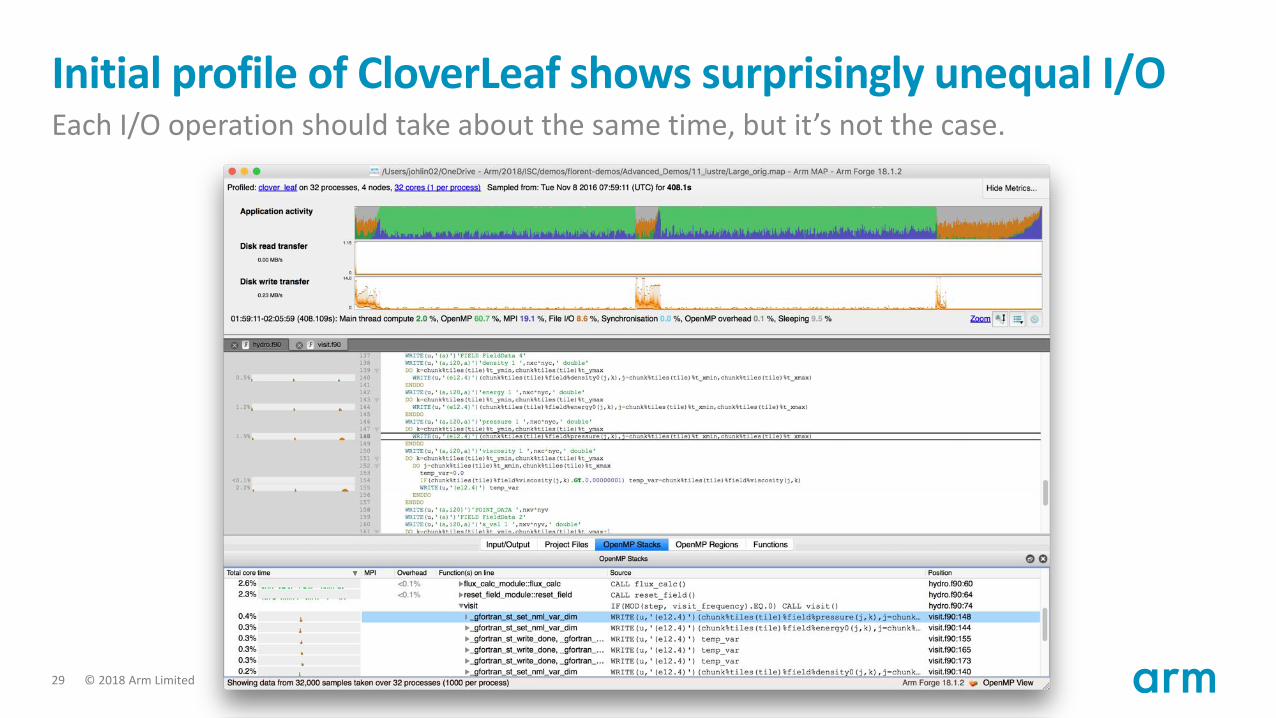
© 2018 Arm Limited29
Initial profile of CloverLeaf shows surprisingly unequal I/OEach I/O operation should take about the same time, but it’s not the case.

© 2018 Arm Limited30
Symptoms and causes of the I/O issuesSub-optimal file format and surprise buffering.
• Write rate is less than 14MB/s.
• Writing an ASCII output file.
• Writes not being flushed until buffer is full.
• Some ranks have much less buffered data than others.
• Ranks with small buffers wait in barrier for other ranks to finish flushing their buffers.
© 2018 Arm Limited31
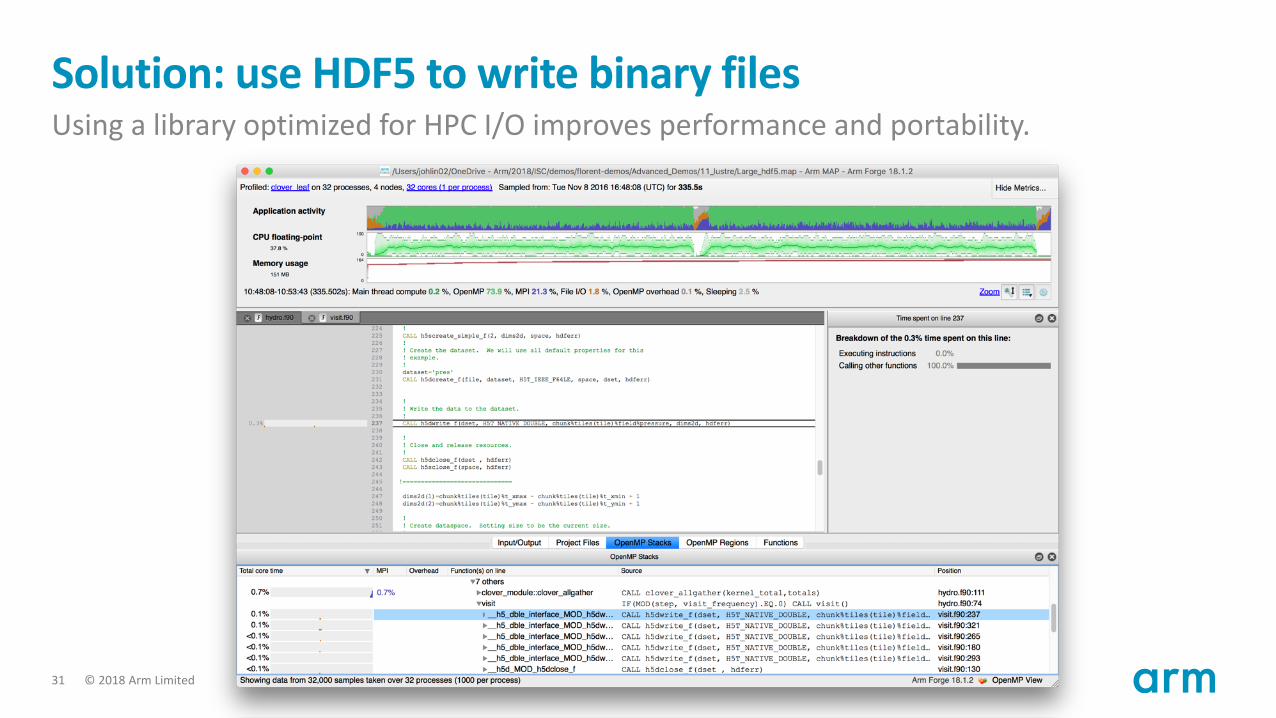
Solution: use HDF5 to write binary filesUsing a library optimized for HPC I/O improves performance and portability.
© 2018 Arm Limited32
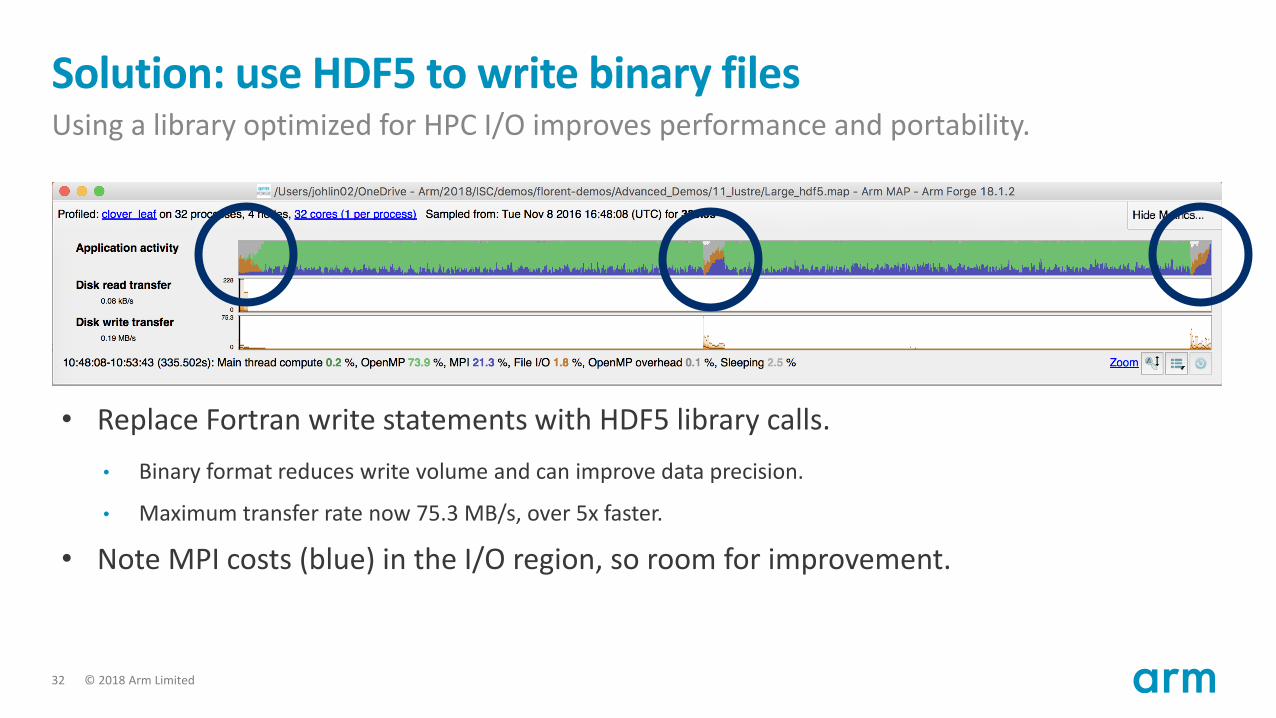
Solution: use HDF5 to write binary filesUsing a library optimized for HPC I/O improves performance and portability.
• Replace Fortran write statements with HDF5 library calls.
• Binary format reduces write volume and can improve data precision.
• Maximum transfer rate now 75.3 MB/s, over 5x faster.
• Note MPI costs (blue) in the I/O region, so room for improvement.
© 2018 Arm Limited33
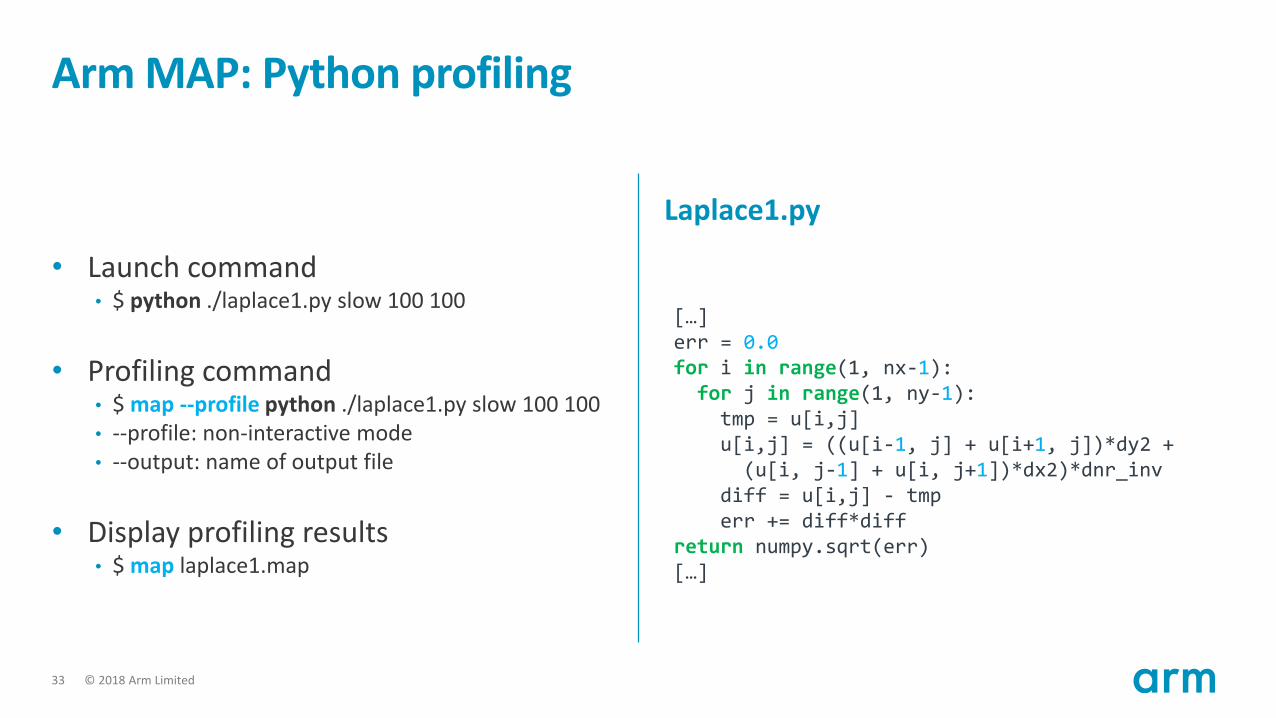
Arm MAP: Python profiling
• Launch command• $ python ./laplace1.py slow 100 100
• Profiling command• $ map --profile python ./laplace1.py slow 100 100• --profile: non-interactive mode• --output: name of output file
• Display profiling results• $ map laplace1.map
Laplace1.py
[…]err = 0.0for i in range(1, nx-1):for j in range(1, ny-1):tmp = u[i,j]u[i,j] = ((u[i-1, j] + u[i+1, j])*dy2 +(u[i, j-1] + u[i, j+1])*dx2)*dnr_inv
diff = u[i,j] - tmperr += diff*diff
return numpy.sqrt(err)[…]
© 2018 Arm Limited34
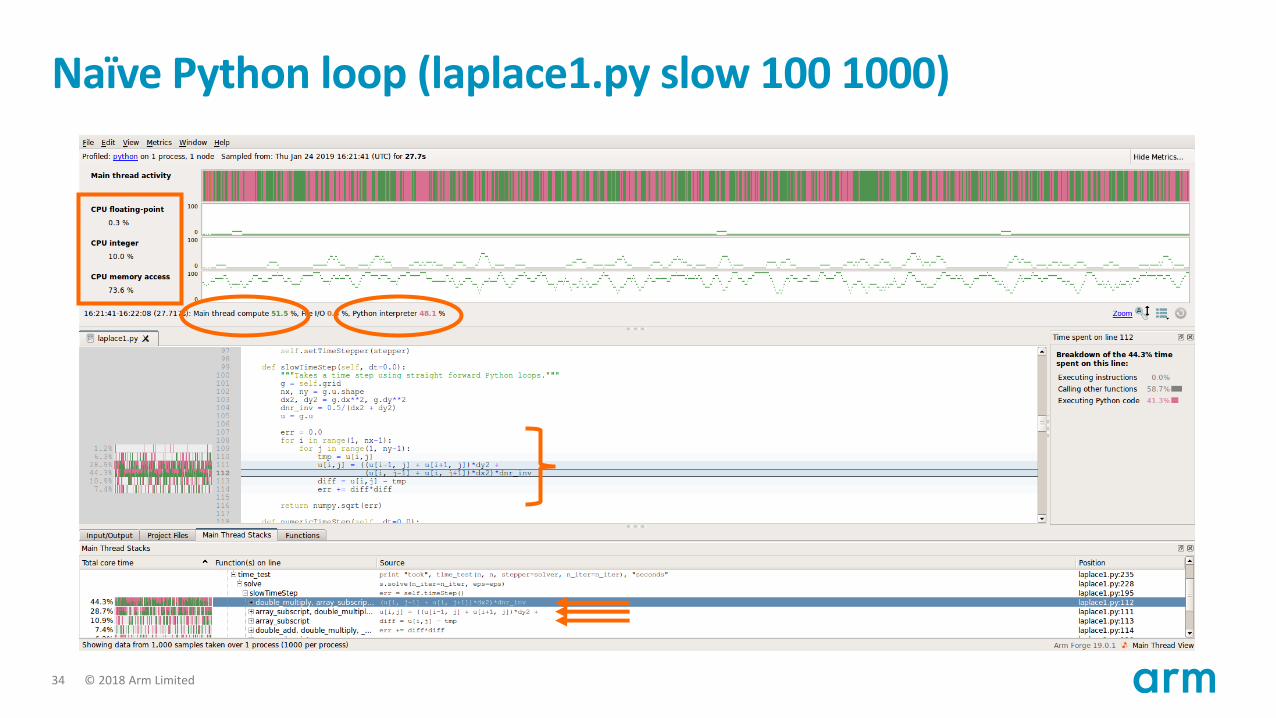
Naïve Python loop (laplace1.py slow 100 1000)

© 2018 Arm Limited35
Optimizing computation on NumPy arrays
Naïve Python loop
err = 0.0for i in range(1, nx-1):for j in range(1, ny-1):tmp = u[i,j]u[i,j] = ((u[i-1, j] + u[i+1, j])*dy2 +(u[i, j-1] + u[i, j+1])*dx2)*dnr_invdiff = u[i,j] - tmperr += diff*diff
return numpy.sqrt(err)
NumPy loop
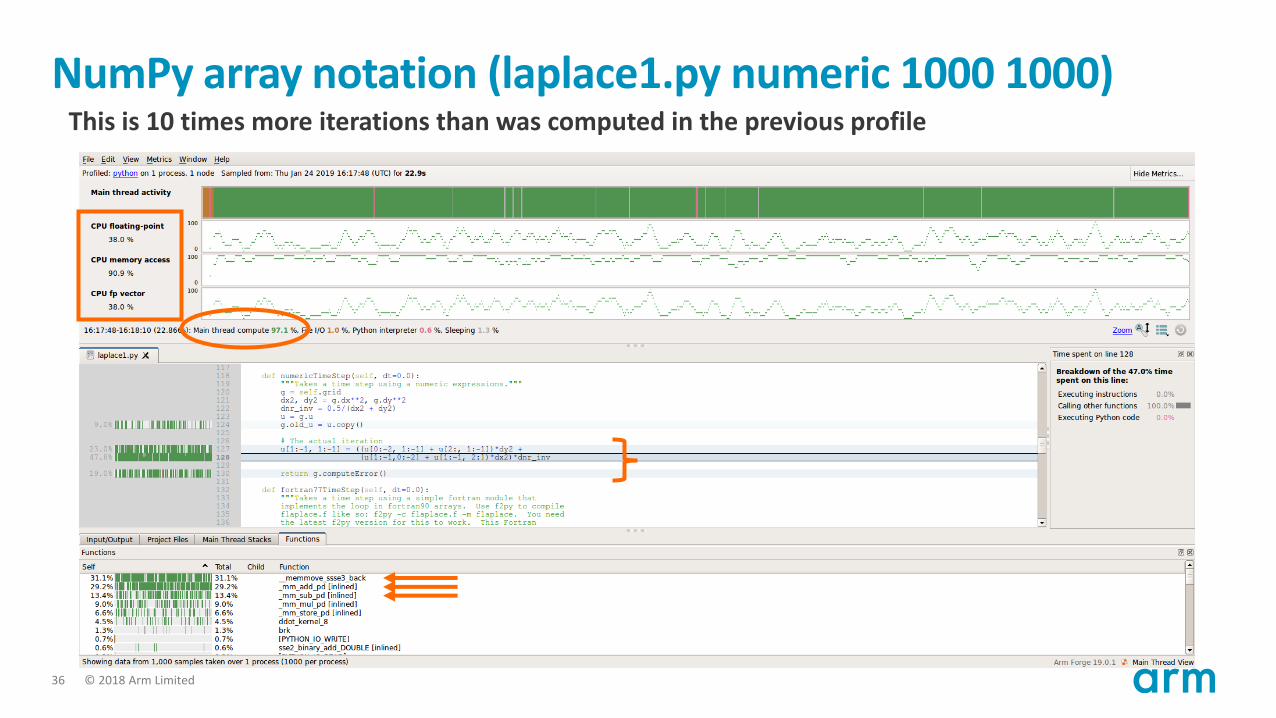
u[1:-1, 1:-1] = ((u[0:-2, 1:-1] + u[2:, 1:-1])*dy2 + (u[1:-1,0:-2] + u[1:-1, 2:])*dx2)*dnr_inv
return g.computeError()
© 2018 Arm Limited36
NumPy array notation (laplace1.py numeric 1000 1000)This is 10 times more iterations than was computed in the previous profile
© 2018 Arm Limited37
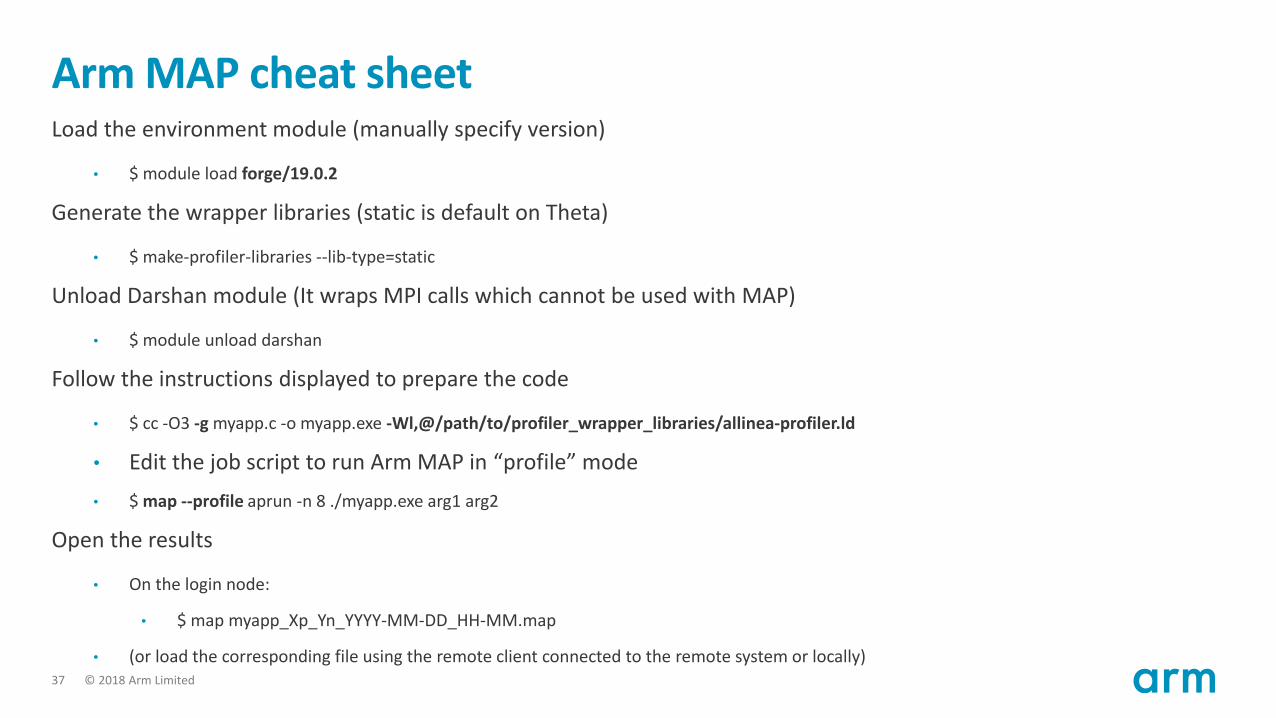
Arm MAP cheat sheetLoad the environment module (manually specify version)
• $ module load forge/19.0.2
Generate the wrapper libraries (static is default on Theta)
• $ make-profiler-libraries --lib-type=static
Unload Darshan module (It wraps MPI calls which cannot be used with MAP)
• $ module unload darshan
Follow the instructions displayed to prepare the code
• $ cc -O3 -g myapp.c -o myapp.exe -Wl,@/path/to/profiler_wrapper_libraries/allinea-profiler.ld
• Edit the job script to run Arm MAP in “profile” mode
• $ map --profile aprun -n 8 ./myapp.exe arg1 arg2
Open the results
• On the login node:
• $ map myapp_Xp_Yn_YYYY-MM-DD_HH-MM.map
• (or load the corresponding file using the remote client connected to the remote system or locally)
© 2018 Arm Limited38
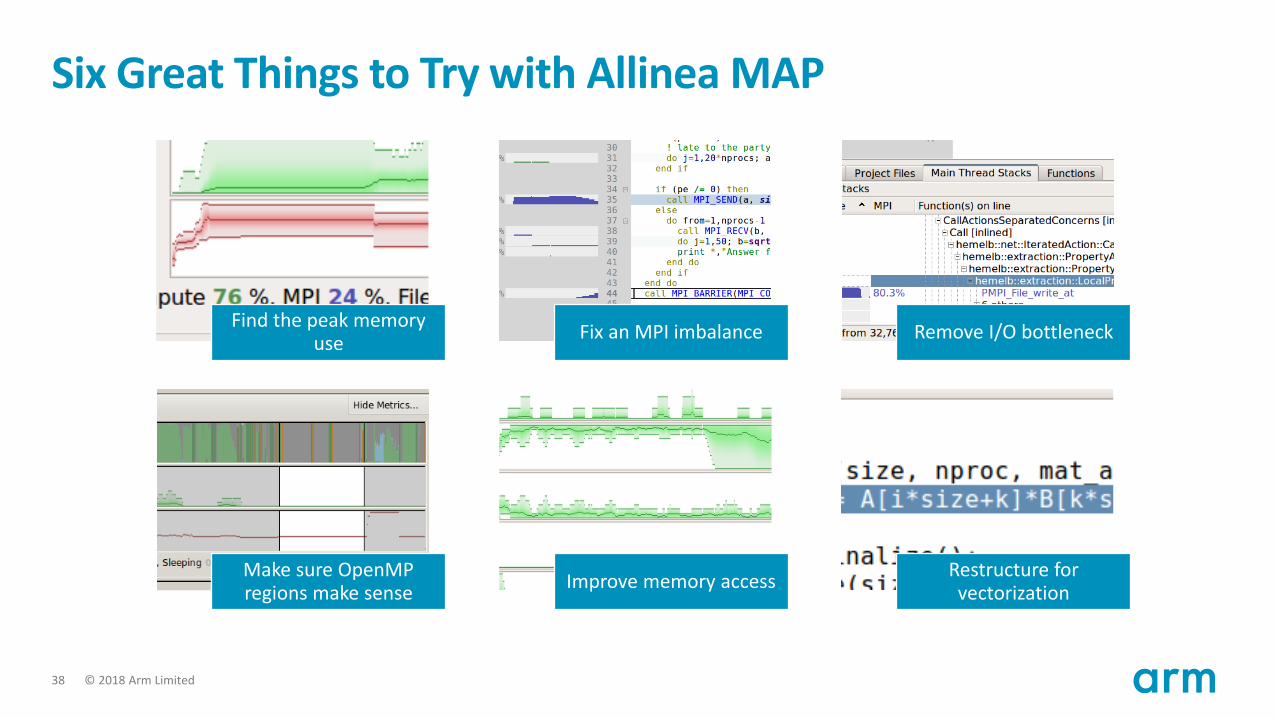
Six Great Things to Try with Allinea MAP
Find the peak memory use
Fix an MPI imbalance Remove I/O bottleneck
Make sure OpenMP regions make sense
Improve memory accessRestructure for vectorization
© 2018 Arm Limited
Theta Specific Settings
© 2018 Arm Limited40
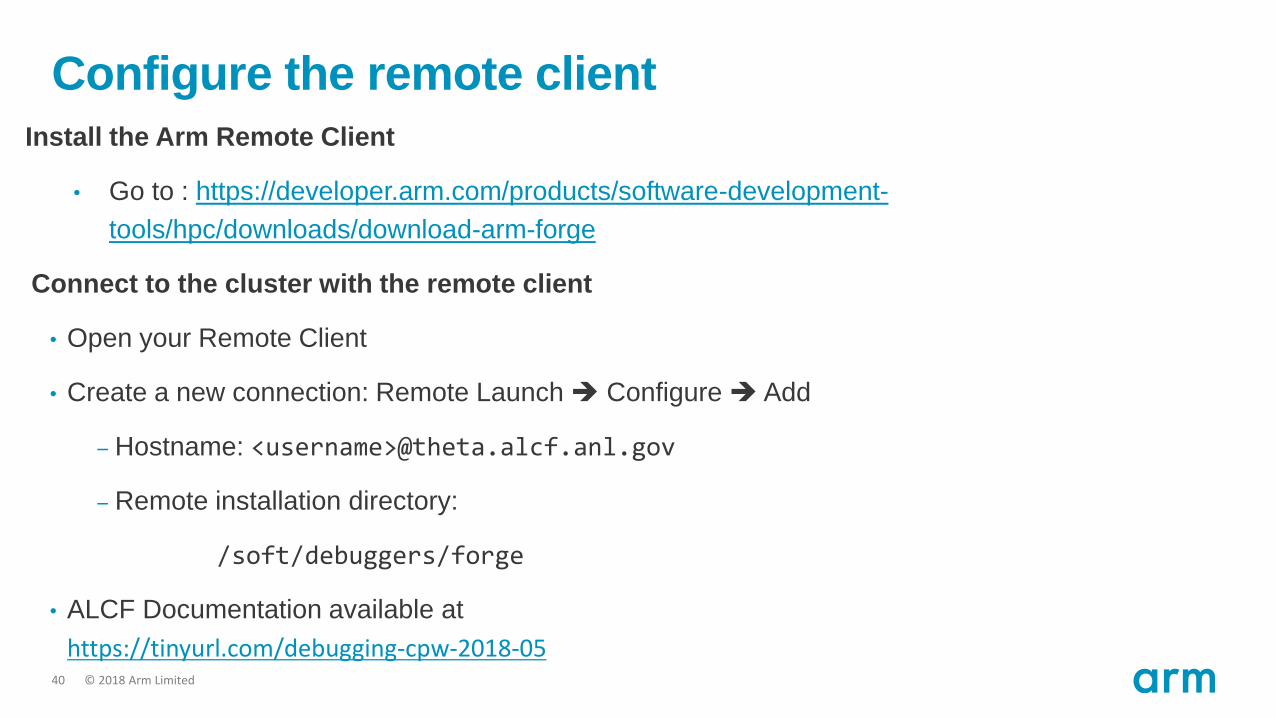
Configure the remote clientInstall the Arm Remote Client
• Go to : https://developer.arm.com/products/software-development-
tools/hpc/downloads/download-arm-forge
Connect to the cluster with the remote client
• Open your Remote Client
• Create a new connection: Remote Launch ➔ Configure ➔ Add
– Hostname: <username>@theta.alcf.anl.gov
– Remote installation directory:
/soft/debuggers/forge
• ALCF Documentation available at
https://tinyurl.com/debugging-cpw-2018-05
© 2018 Arm Limited41
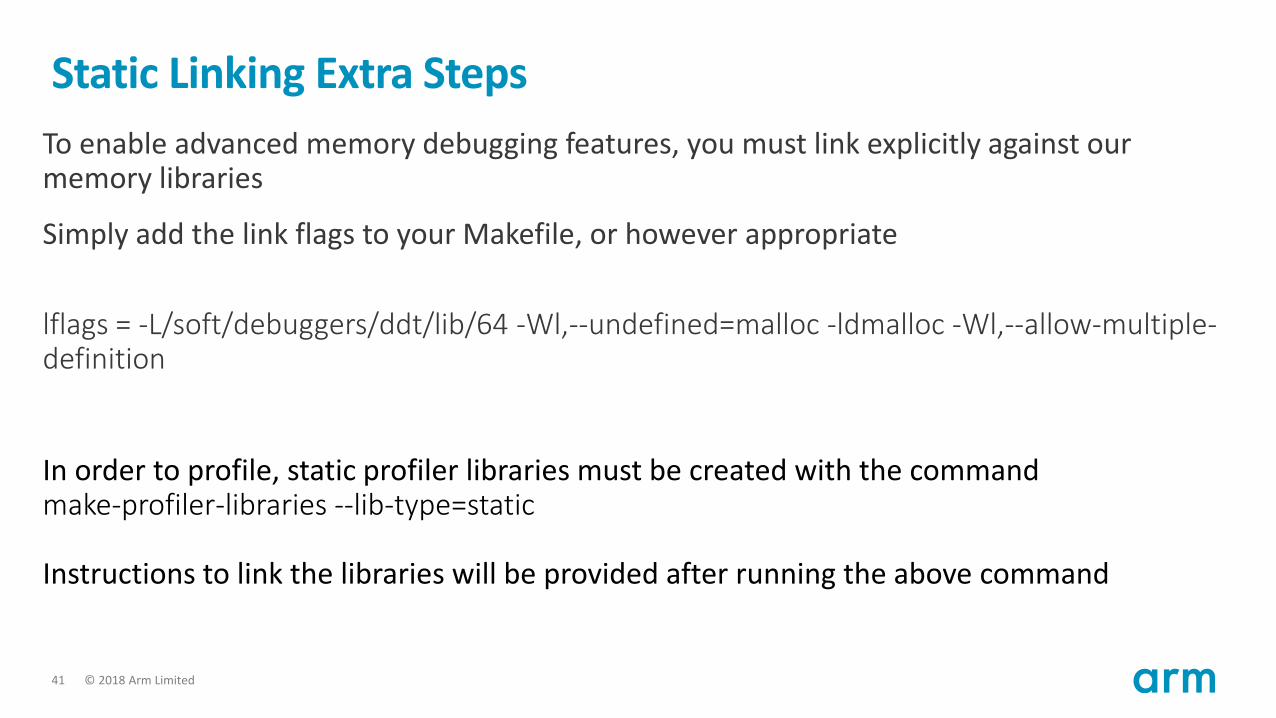
Static Linking Extra Steps
To enable advanced memory debugging features, you must link explicitly against our memory libraries
Simply add the link flags to your Makefile, or however appropriate
lflags = -L/soft/debuggers/ddt/lib/64 -Wl,--undefined=malloc -ldmalloc -Wl,--allow-multiple-definition
In order to profile, static profiler libraries must be created with the commandmake-profiler-libraries --lib-type=static
Instructions to link the libraries will be provided after running the above command

© 2018 Arm Limited
Questions?

4343 © 2018 Arm Limited
Thank You!Danke!Merci!谢谢!ありがとう!Gracias!Kiitos!감사합니다धन्यवाद