Embed Size (px)
Citation preview
Debugging and Profiling in Microsoft VisualStudio with Parallel Nsight
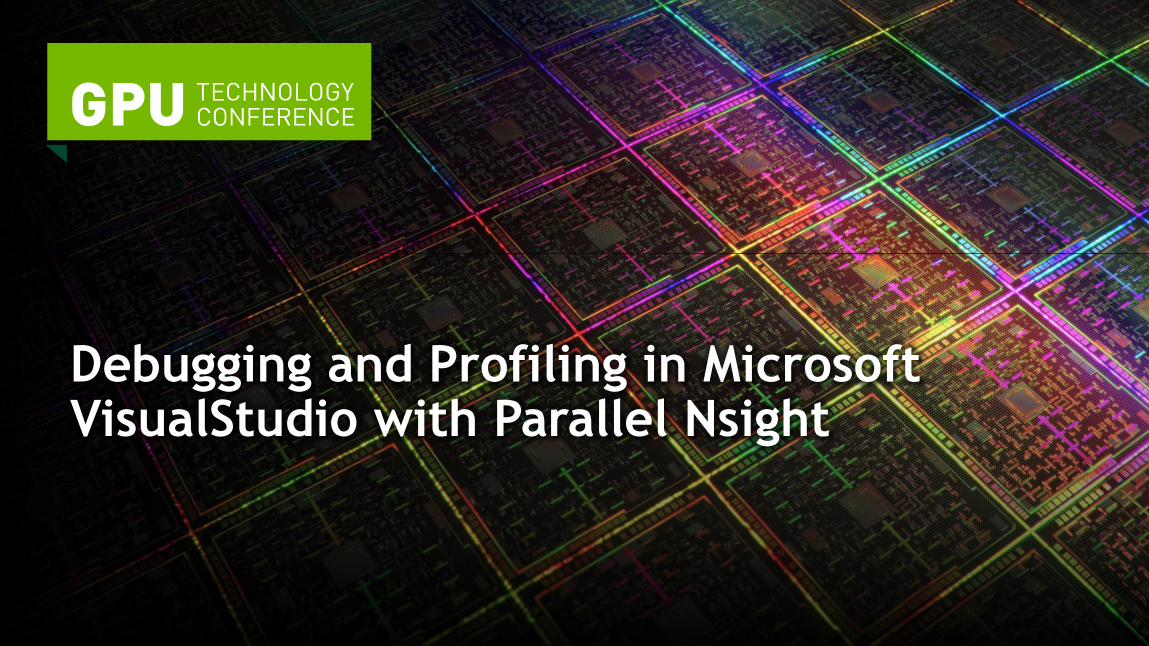
NVIDIA Parallel Nsight™
Profile Debug Build
Visual Studio integrated development for GPU and CPU
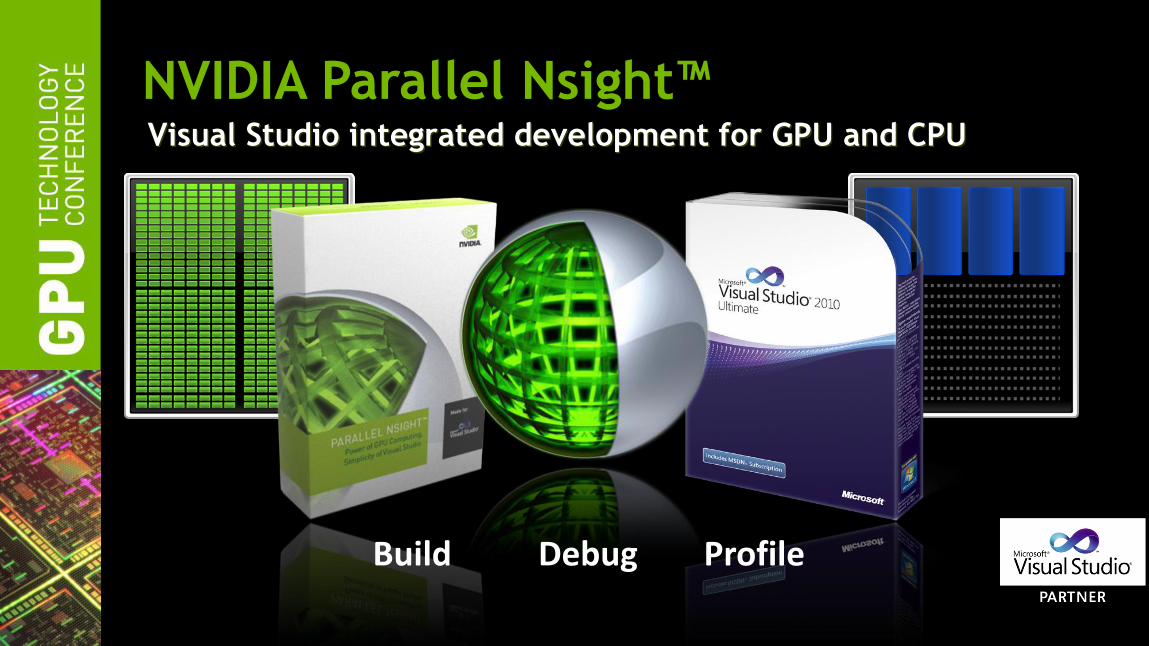
NVIDIA Parallel Nsight for Graphics & Compute
Graphics Inspector
Real-time inspection of Direct3D API calls
Investigate GPU pipeline state
See contributing fragments with Pixel
History
Profile frames to find GPU bottlenecks
System Analysis
View CPU & GPU events on a single timeline
Examine workload dependencies
CUDA, Direct3D, and OpenGL API Trace
Profile CUDA kernels using performance
counters
Free License!
CUDA/Graphics Debugger
GPU Accelerated CUDA and HLSL
debugging
Examine shaders executing in
parallel
Identify issues with conditional
breakpoints
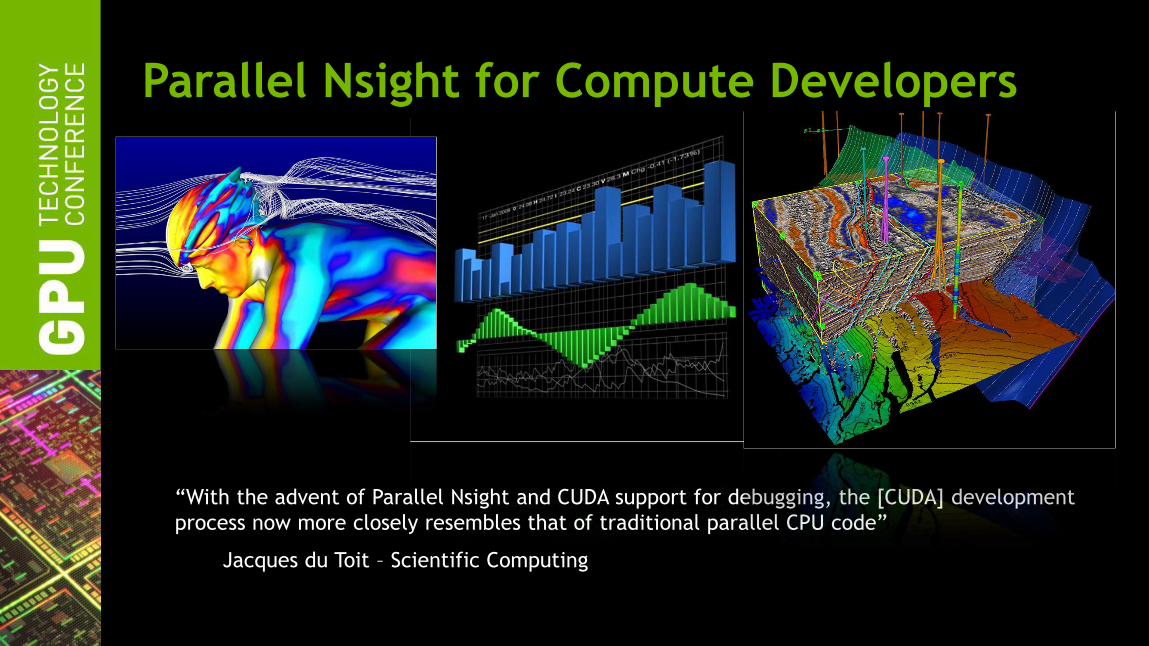
Parallel Nsight for Compute Developers
“With the advent of Parallel Nsight and CUDA support for debugging, the [CUDA] development
process now more closely resembles that of traditional parallel CPU code”
Jacques du Toit – Scientific Computing
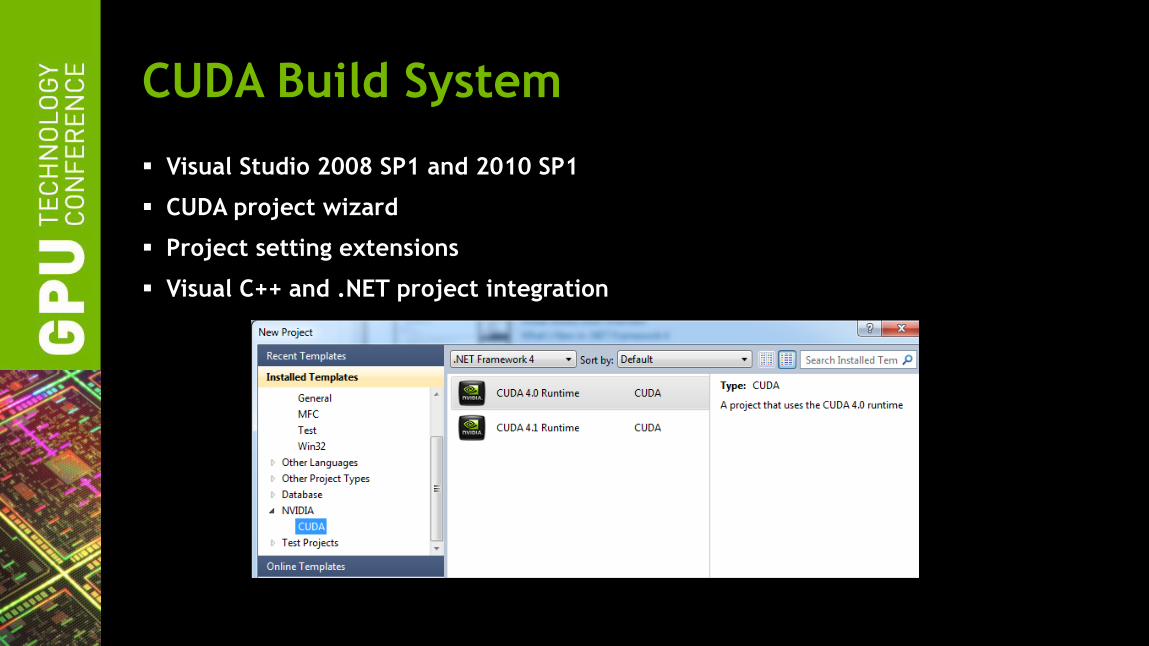
CUDA Build System
Visual Studio 2008 SP1 and 2010 SP1
CUDA project wizard
Project setting extensions
Visual C++ and .NET project integration
Parallel Nsight CUDA Debugging
Native GPU debugging with mixed CUDA-C/PTX/SASS assembly
Debugger attach to running process
Conditional breakpoint with program variables
GPU memory views and data breakpoints
CUDA expression engine and stack frame support
Massively-threaded GPU kernels navigation
CUDA memory checker
CUDA system information
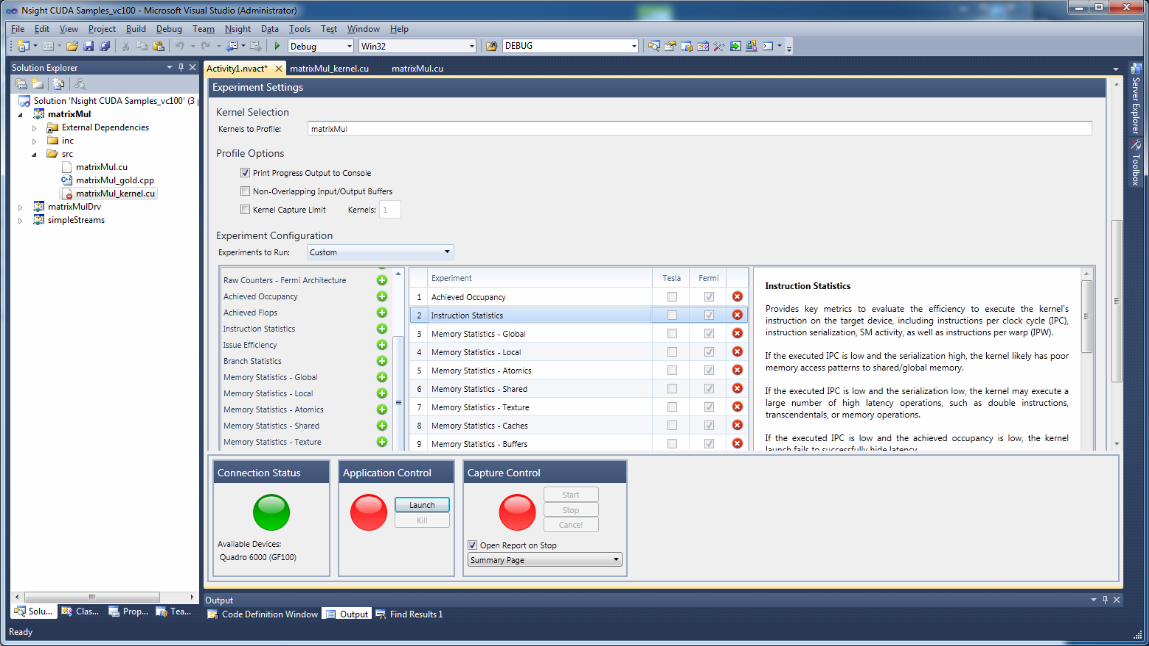
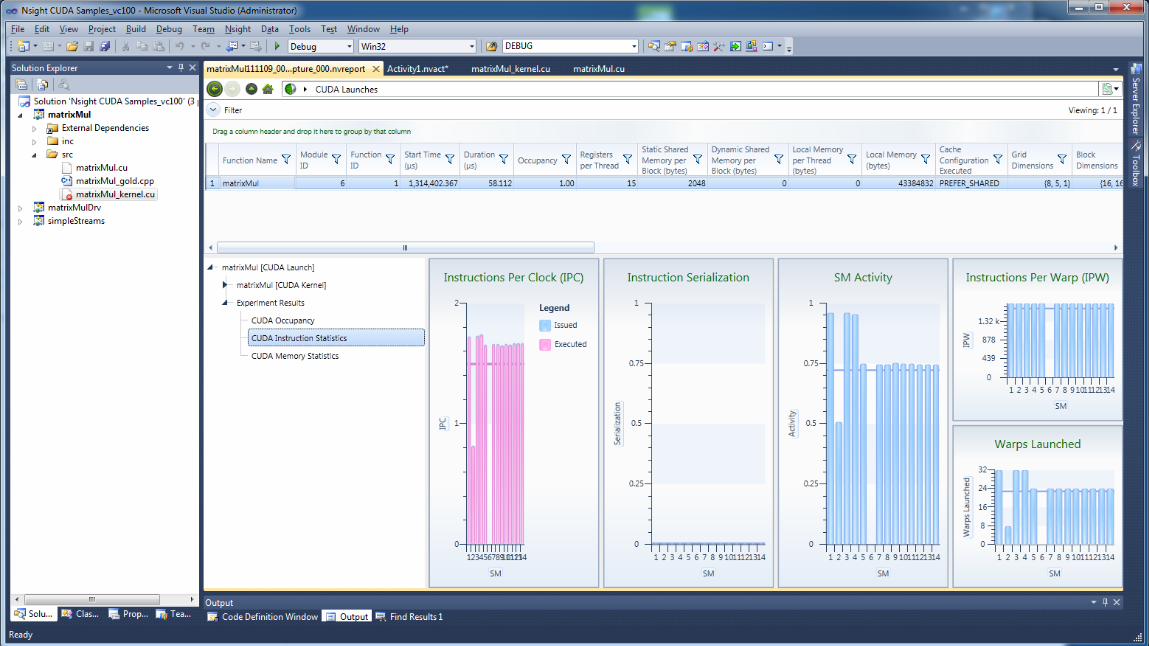
Parallel Nsight CUDA Profiling
CUDA profiler with live counter reconfiguration
Unlimited experiments on live kernels
Advanced profiling experiments
• Achieved occupancy
• Instruction throughput
Kernel profiling filtering
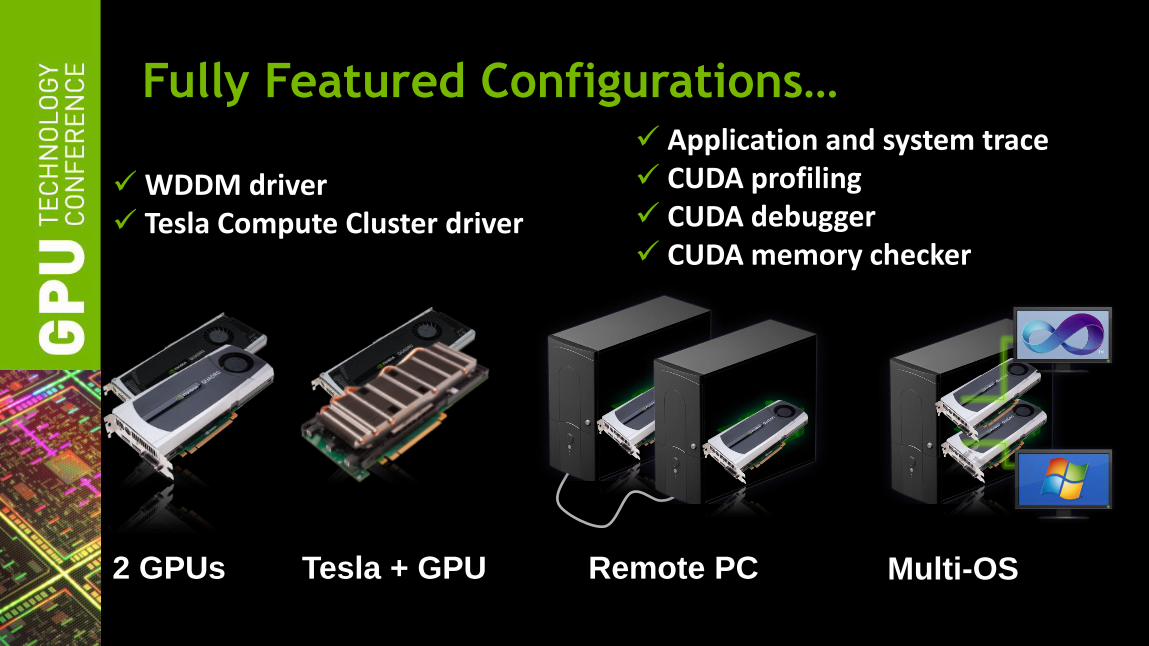
Fully Featured Configurations…
Remote PC 2 GPUs Tesla + GPU
Application and system trace CUDA profiling CUDA debugger CUDA memory checker
WDDM driver Tesla Compute Cluster driver
Multi-OS
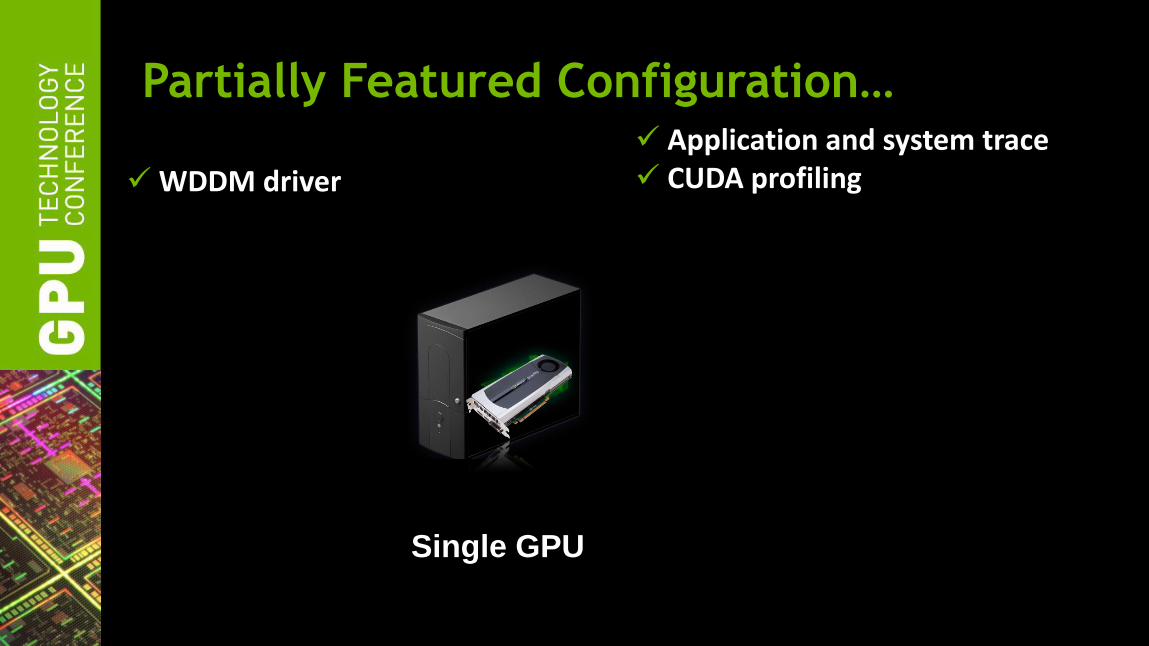
Partially Featured Configuration…
Single GPU
Application and system trace CUDA profiling WDDM driver
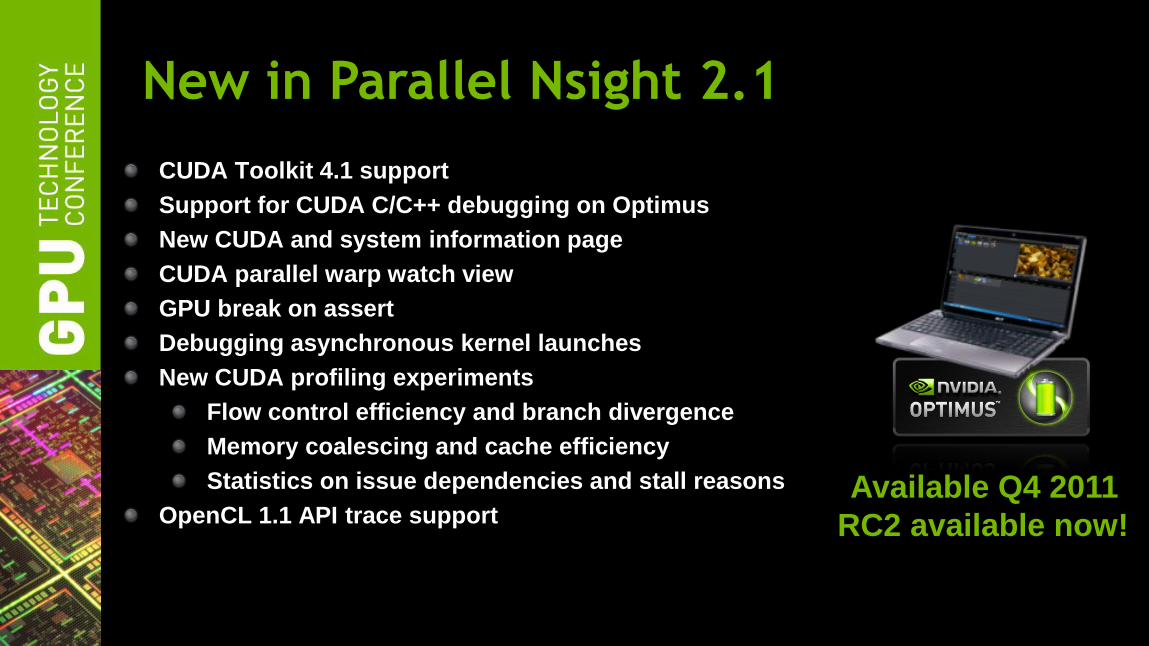
New in Parallel Nsight 2.1
CUDA Toolkit 4.1 support
Support for CUDA C/C++ debugging on Optimus
New CUDA and system information page
CUDA parallel warp watch view
GPU break on assert
Debugging asynchronous kernel launches
New CUDA profiling experiments
Flow control efficiency and branch divergence
Memory coalescing and cache efficiency
Statistics on issue dependencies and stall reasons
OpenCL 1.1 API trace support
Available Q4 2011
RC2 available now!
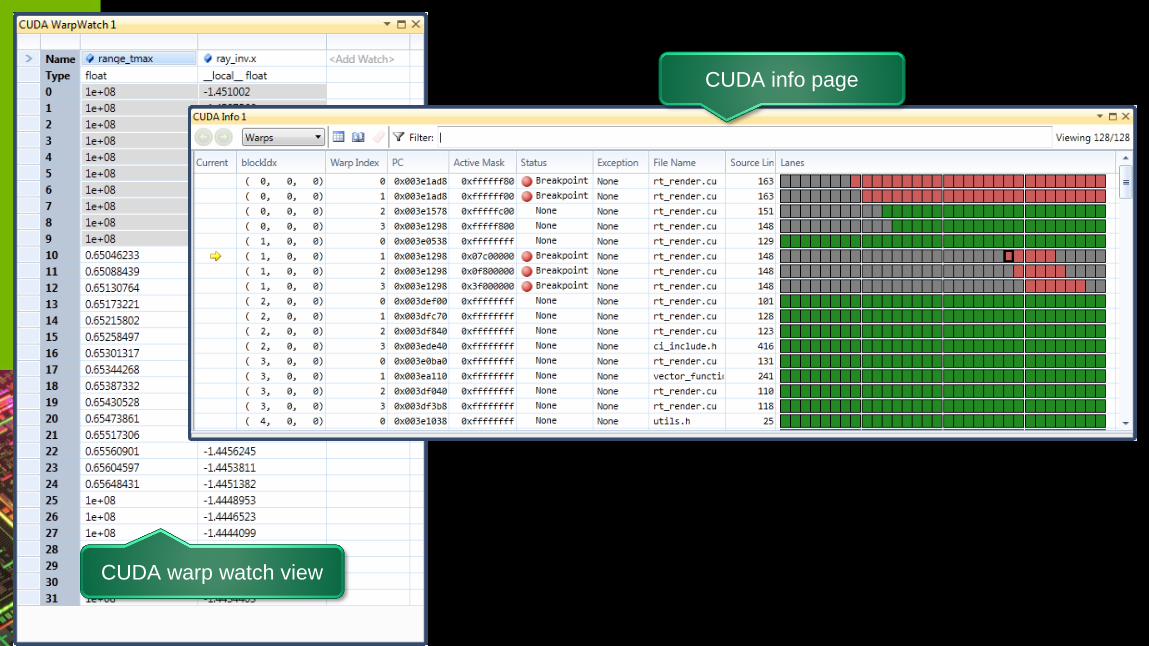
CUDA info page
CUDA warp watch view
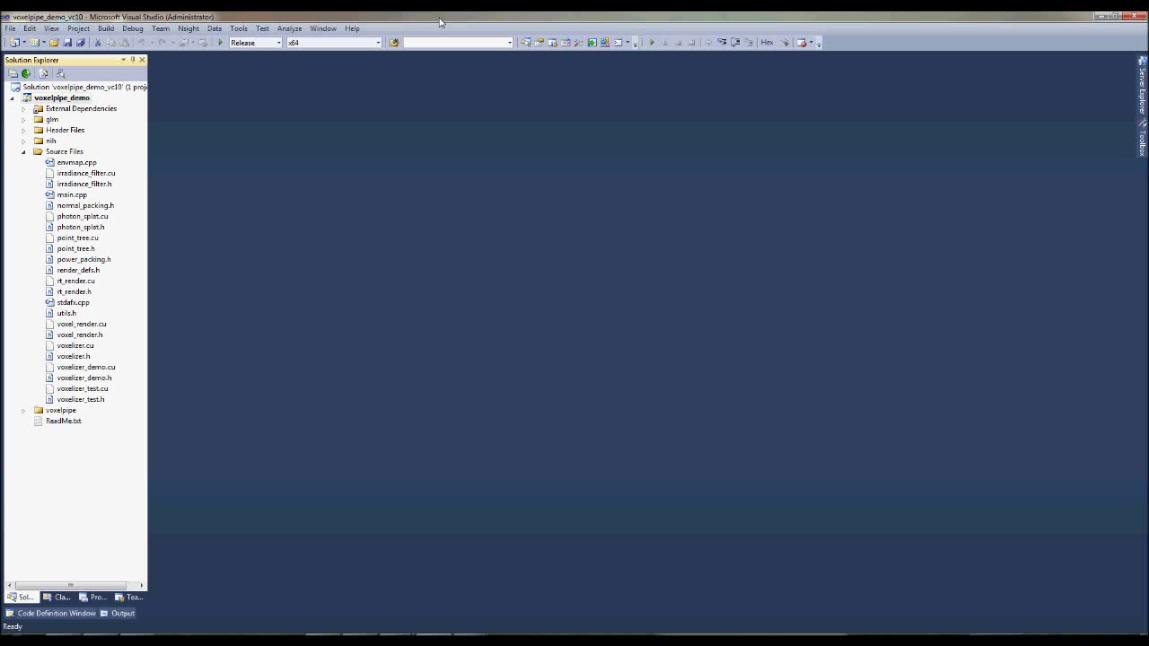
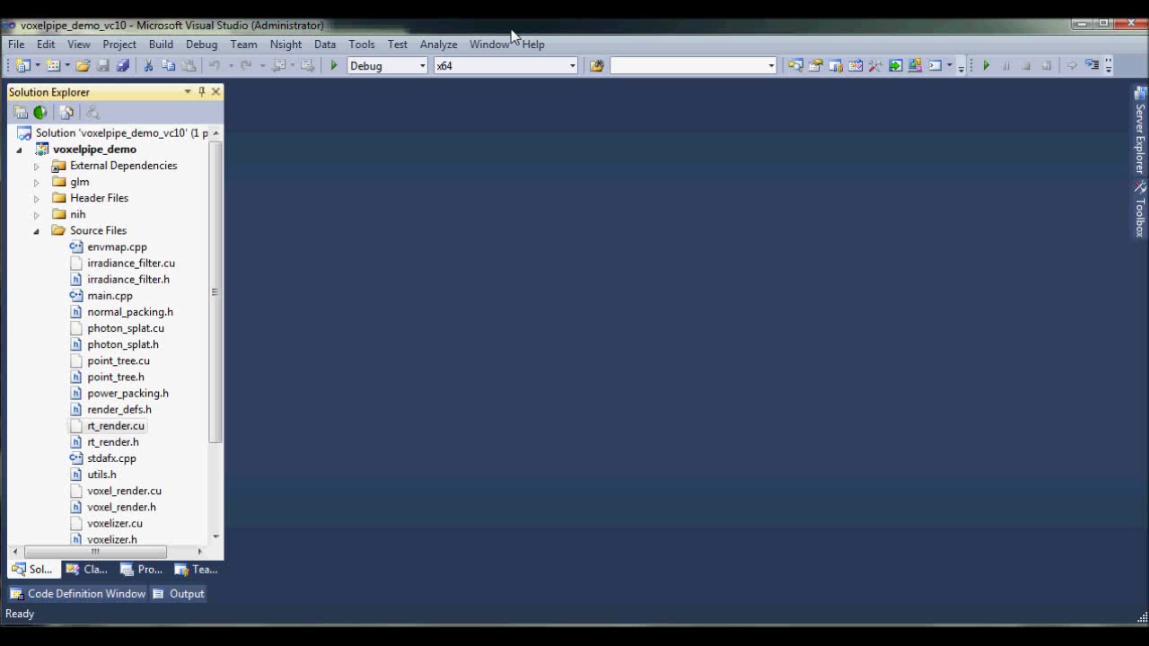
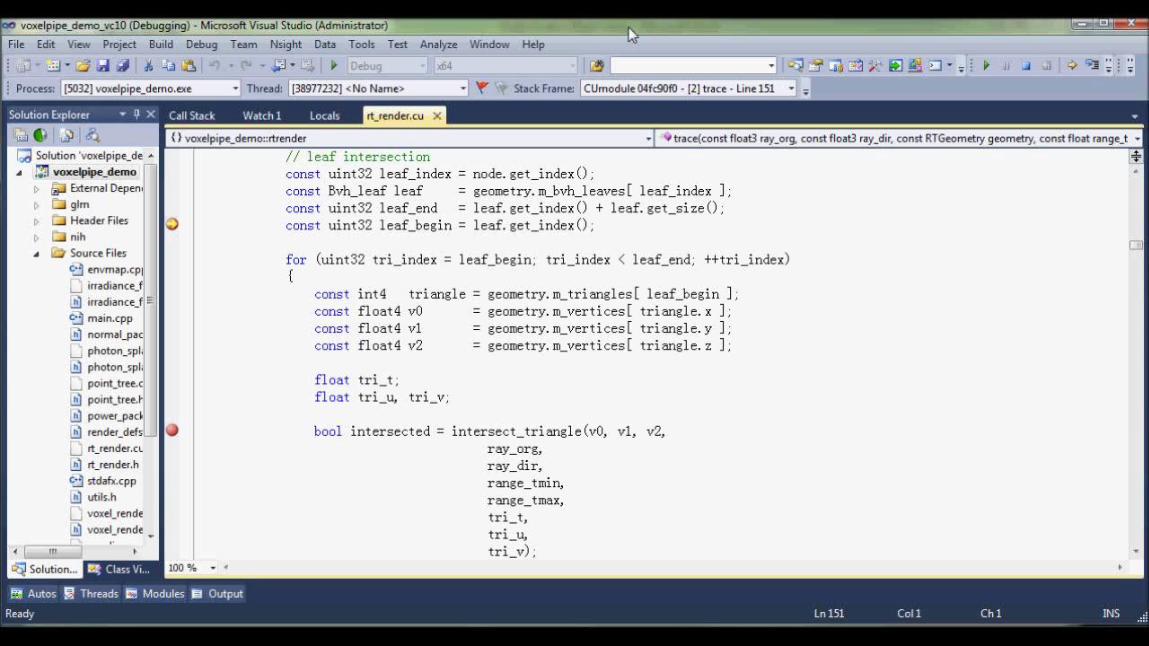
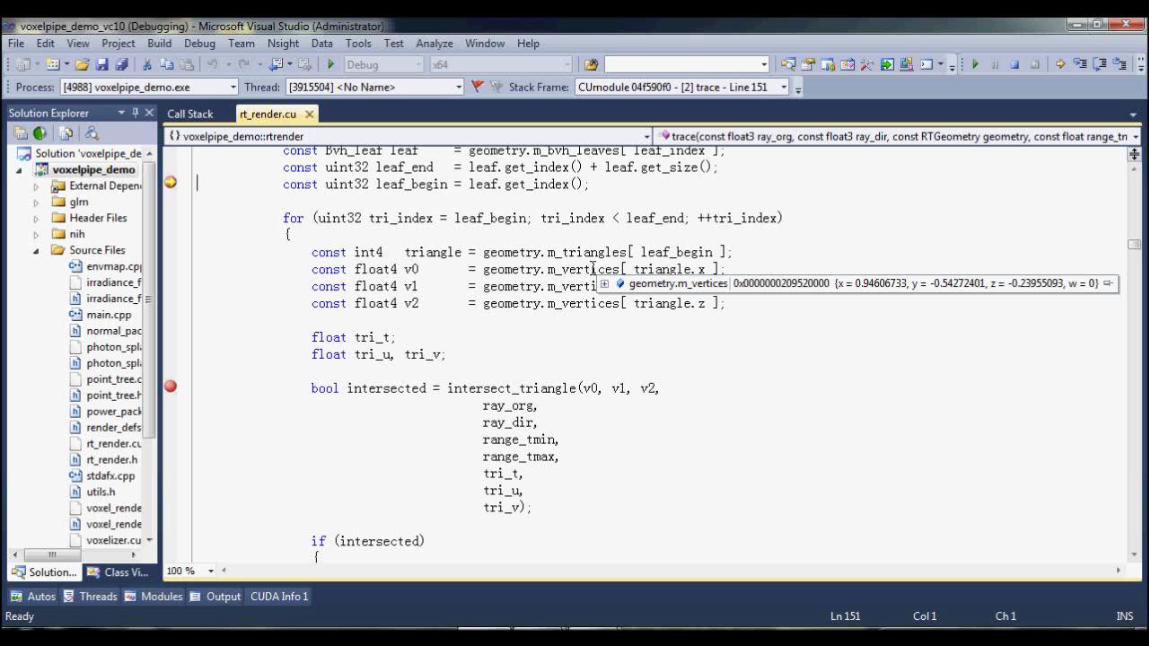
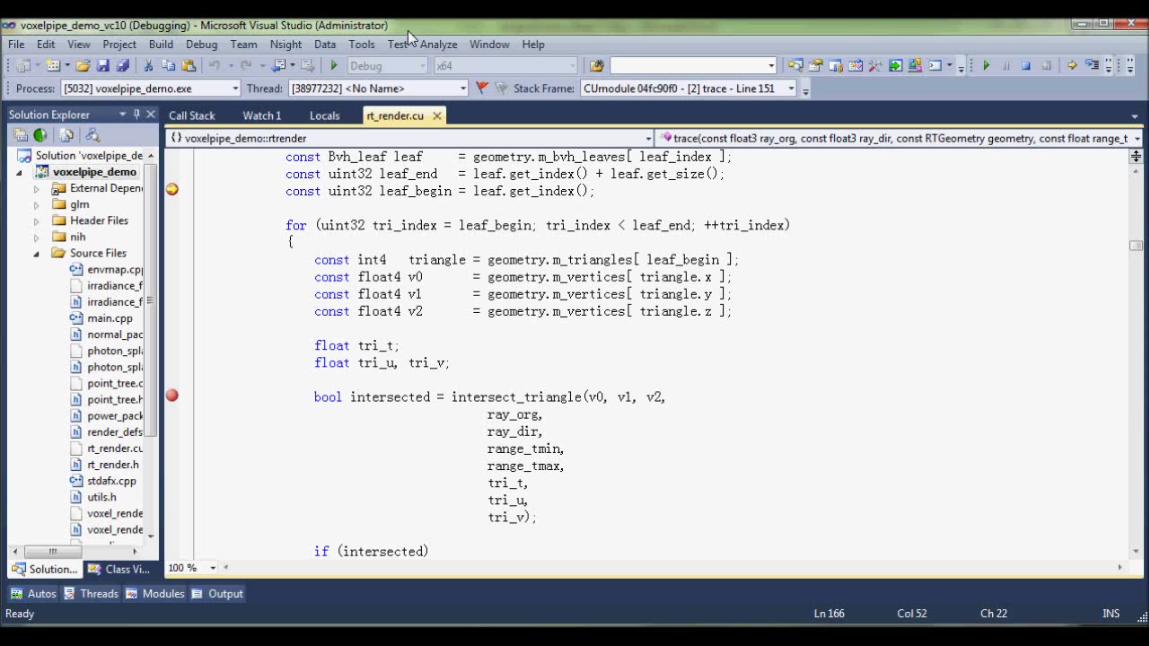
Demo – CUDA
Similar experience as CPU debugging
Debug the ‘parallel’
PTX/SASS
Memory
- PTX/SASS
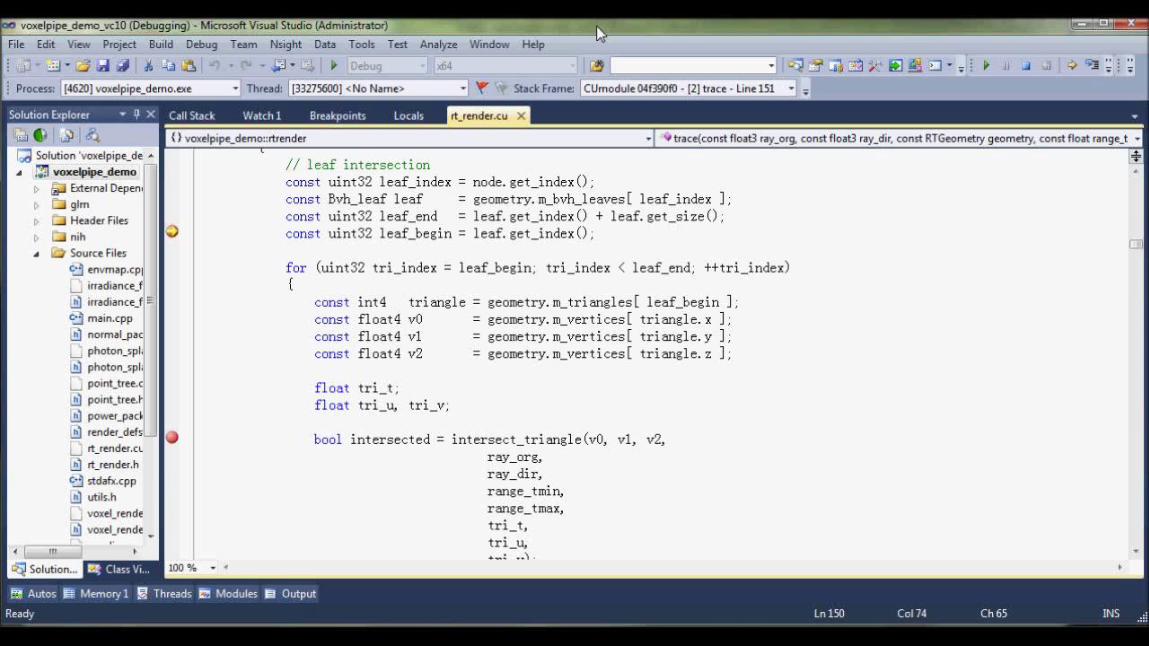
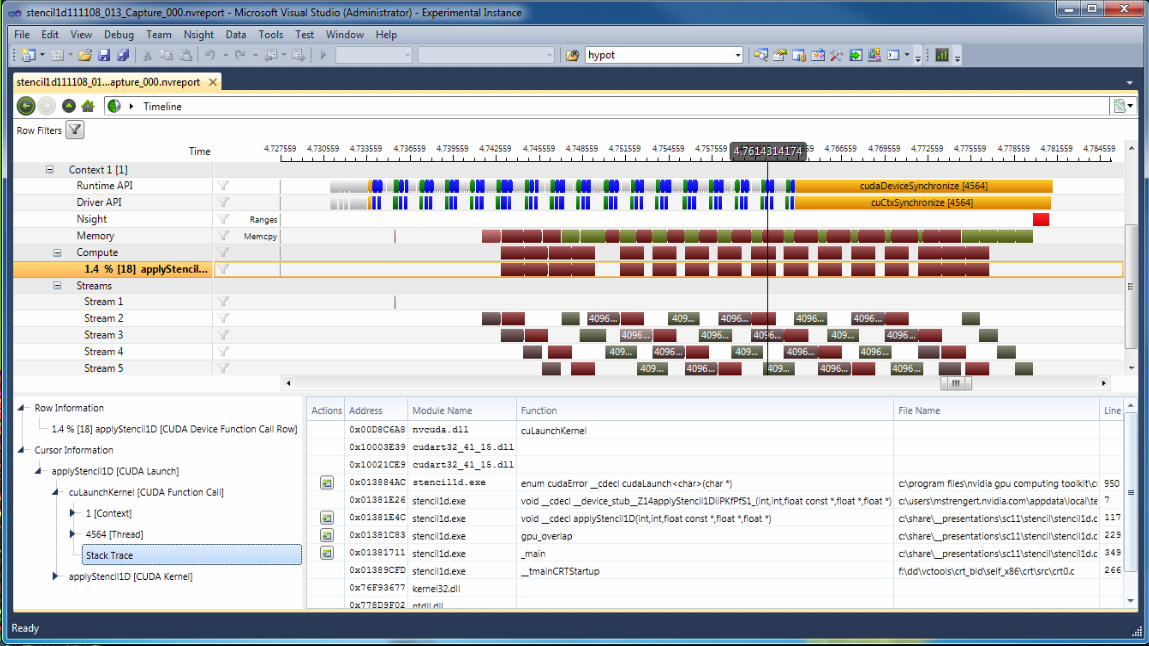
Demo – CUDA Trace
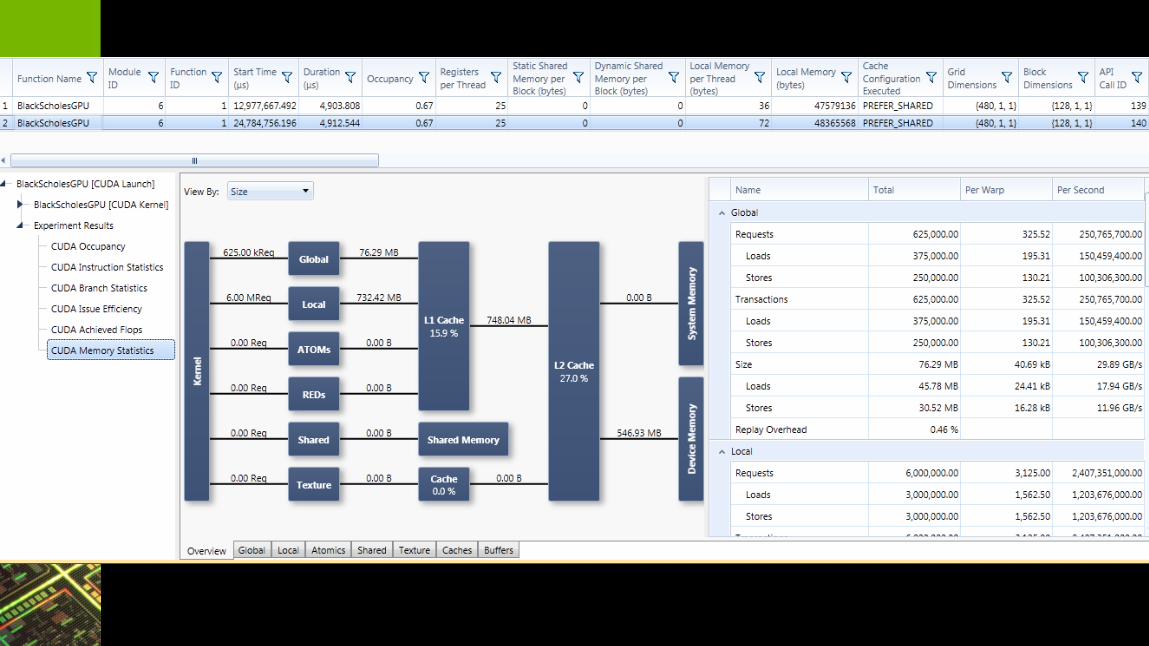
Demo – CUDA Profiling
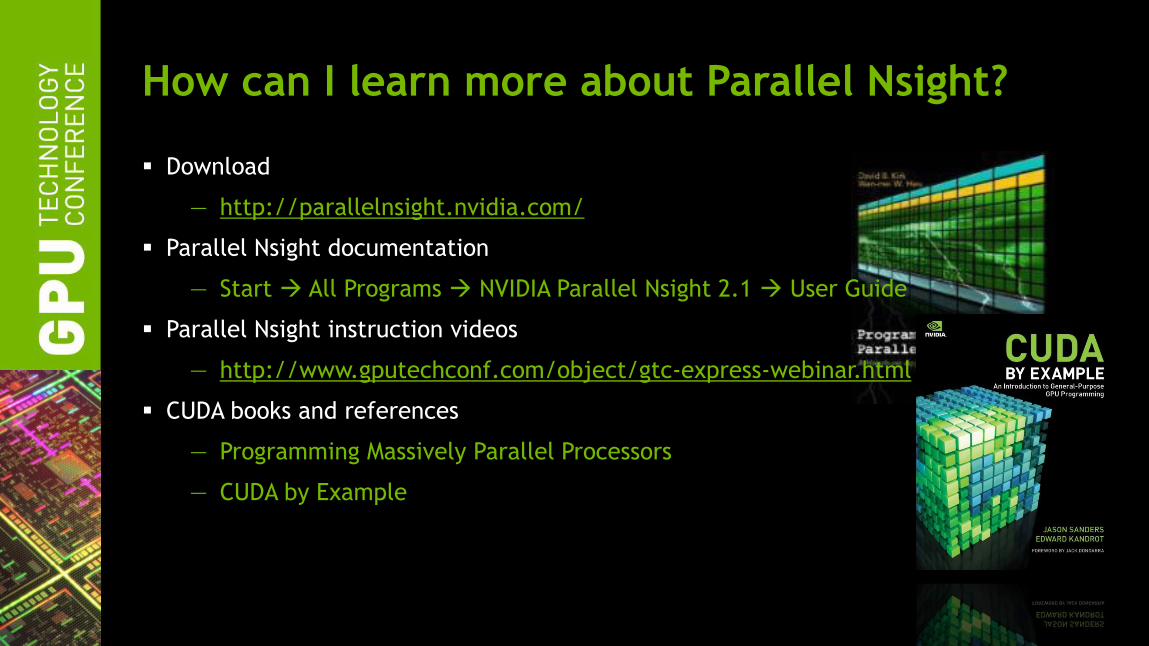
How can I learn more about Parallel Nsight?
Download
— http://parallelnsight.nvidia.com/
Parallel Nsight documentation
— Start All Programs NVIDIA Parallel Nsight 2.1 User Guide
Parallel Nsight instruction videos
— http://www.gputechconf.com/object/gtc-express-webinar.html
CUDA books and references
— Programming Massively Parallel Processors
— CUDA by Example