Embed Size (px)
Citation preview

B1WD-3356-01ENZ0(00)August 2015
Windows
FUJITSU SoftwareNetCOBOL V11.0
Debugging Guide

PrefaceNetCOBOL allows you to create, execute, and debug COBOL programs. This manual describes the debugging functions available.
Audience
This manual is for people who develop COBOL programs using NetCOBOL. It assumes users possess basic knowledge of COBOL andare familiar with the appropriate Windows platform.
How this Manual is Organized
This manual consists of the following chapters and appendices:
Chapter Contents
Chapter 1 Introduction to Debugging with NetCOBOL An overview of the various debugging functions.
Chapter 2 Debugging in Windows System Details of the debugger for the 32 bit Windows environments.
Chapter 3 Debugging Mixed COBOL andPowerCOBOL
Details of debugging mixed COBOL and PowerCOBOLapplications.
Chapter 4 Debugging Visual Basic calling COBOL Details of debugging mixed Visual Basic and COBOLapplications.
Chapter 5 NetCOBOL Debugging Functions Details of using COBOL debugging functions.
Appendix A Debugger Command Lists Lists of the commands supported in the different environmentsthat can be entered into the command-line windows.
How to Use This Manual
Check the features listed in the introduction and determine which debugging features you wish to use. Select the chapter that details thosefeatures.
Conventions Used in this Manual
This manual uses the following typographic conventions.
Example of Convention Description
setup Characters you enter appear in bold.
Program-name Underlined text indicates a placeholder forinformation you supply.
ENTER Small capital letters are used for the name of keysand key sequences such as ENTER and CTRL+R. Aplus sign (+) indicates a combination of keys.
... Ellipsis indicates the item immediately proceedingcan be specified repeatedly.
Edit, Literal Names of pull-down menus and options appear withthe initial letter capitalized.
[def] Indicates that the enclosed item may be omitted.
{ABC|DEF} Indicates that one of the enclosed items delimited by| is to be selected.
CHECK
WITH PASCAL LINKAGE
ALL
PARAGRAPH-ID
Commands, statements, clauses, and options youenter or select appear in uppercase. Program sectionnames, and some proper names also appear inuppercase. Defaults are underlined.
- i -

Example of Convention Description
COBOL
ALL
PROCEDURE DIVISION: ADD 1 TO POW-FONTSIZE OF LABEL1. IF POW-FONTSIZE OF LABEL1 > 70 THEN MOVE 1 TOW POW-FONTSIZE OF LABEL1. END-IF.
This font is used for examples of program code.
The sheet acts as an application creation form. Italics are occasionally used for emphasis.
Refer to "Setting Environment Variables" in the "NetCOBOLUser's Guide".
References to other publications or sections withinpublications are in quotation marks.
Product Names
Product Name Abbreviation
Microsoft® Windows Server® 2012 R2 Datacenter
Microsoft® Windows Server® 2012 R2 Standard
Microsoft® Windows Server® 2012 R2 Essentials
Microsoft® Windows Server® 2012 R2 Foundation
Windows Server 2012 R2
Microsoft® Windows Server® 2012 Datacenter
Microsoft® Windows Server® 2012 Standard
Microsoft® Windows Server® 2012 Essentials
Microsoft® Windows Server® 2012 Foundation
Windows Server 2012
Microsoft® Windows Server® 2008 R2 Foundation
Microsoft® Windows Server® 2008 R2 Standard
Microsoft® Windows Server® 2008 R2 Enterprise
Microsoft® Windows Server® 2008 R2 Datacenter
Windows Server 2008 R2
Windows® 8.1
Windows® 8.1 Pro
Windows® 8.1 Enterprise
Windows 8.1
Windows® 8
Windows® 8 Pro
Windows® 8 Enterprise
Windows 8
Windows® 7 Home Premium
Windows® 7 Professional
Windows® 7 Enterprise
Windows® 7 Ultimate
Windows 7
Windows Server 2012 R2
Windows Server 2012
Windows Server 2008 R2
Windows 8.1(x64)
Windows 8(x64)
Windows
- ii -

Product Name Abbreviation
Windows 7(x64)
Microsoft(R) Visual C++(R) development system Visual C++
Microsoft(R)Visual Basic(R) programming system Visual Basic
Oracle Solaris Solaris
Product Differences
The following products are not supported in the US English language version, or other English language versions, of this product, but maybe mentioned in this manual:
- SequeLink
- MeFt/Web
- Print Walker/OVL option
- System Walker/List Works
Trademarks
- NetCOBOL is a trademark or registered trademark of Fujitsu Limited or its subsidiaries in the United States or other countries or inboth.
- Microsoft, Windows, Windows Server, Visual Basic and Visual C++ are trademarks or registered trademarks of Microsoft Corporationin the United States and/or other countries.
- Oracle and Java are registered trademarks of Oracle and/or its affiliates. Other names may be trademarks of their respective owners.Oracle Solaris might be described as Solaris, Solaris Operating System, or Solaris OS.
- Other product names are trademarks or registered trademarks of each company. Trademark indications are omitted for some systemand product names described in this manual.
- The permission of the Microsoft Corporation has been obtained for the use of screen images.
Acknowledgments
The language specifications of COBOL are based on the original specifications developed by the work of the Conference on Data SystemsLanguages (CODASYL). The specifications described in this manual are also derived from the original. The following passages are quotedat the request of CODASYL.
"COBOL is an industry language and is not the property of any company or group of companies, or of any organization or group oforganizations. No warranty, expressed or implied, is made by the COBOL Committee as to the accuracy and functioning of theprogramming system and language. Moreover, no responsibility is assumed by the committee, in connection therewith.
"The authors of the following copyrighted material have authorized the use of this material in part in the COBOL specifications. Suchauthorization extends to the use of the original specifications in other COBOL specifications:
- FLOW-MATIC (Trademark of Sperry Rand Corporation), Processing for the UNIVAC I and II, Data Automation Systems,copyrighted 1958, 1959, by Sperry Rand Corporation.
- IBM Commercial Translator, Form No. F28-8013, copyrighted 1959 by International Business Machines Corporation.
- FACT, DSI 27A5260-2760, copyrighted 1960 by Minneapolis-Honeywell."
The object-oriented language specification for COBOL is based on the Forth COBOL International Standards resulting from the effortsof the ISO/IEC JTC1/SC22/WG4 and NCITS J4 Technology Committees. We would like to express our special thanks to those committeesfor their efforts and dedication.
Export Regulation
Exportation/release of this document may require necessary procedures in accordance with the regulations of your resident countryand/or US export control laws.
- iii -

The contents of this manual may be revised without prior notice. No part of this document may be reproduced or transmitted in any formor by any means, electronic or mechanical, for any purpose, without the express written permission of Fujitsu Limited.
August 2015
Copyright 1992-2015 FUJITSU LIMITED
- iv -

ContentsChapter 1 Introduction to Debugging with NetCOBOL.............................................................................................................1
1.1 Debugging with NetCOBOL............................................................................................................................................................... 11.2 Features of the Debugger for Windows...............................................................................................................................................11.3 Features of the COBOL Debugging Functions....................................................................................................................................2
1.3.1 TRACE......................................................................................................................................................................................... 21.3.2 CHECK.........................................................................................................................................................................................21.3.3 COUNT.........................................................................................................................................................................................21.3.4 Memory Check............................................................................................................................................................................. 31.3.5 COBOL Error Report....................................................................................................................................................................31.3.6 Compiler Listings......................................................................................................................................................................... 3
Chapter 2 Debugging in Windows System...............................................................................................................................42.1 Overview of the Debugger...................................................................................................................................................................42.2 Preparing Programs for Debugging..................................................................................................................................................... 5
2.2.1 Debug Program Types.................................................................................................................................................................. 52.2.2 Compiling for Debugging.............................................................................................................................................................62.2.3 Linking for Debugging................................................................................................................................................................. 6
2.3 Environment Variables of the Debugger............................................................................................................................................. 62.3.1 @SVD_PERFORM_CHECK(to watch PERFORM nest)........................................................................................................... 72.3.2 @SVD_ENV(to specify a debugging environment).................................................................................................................... 72.3.3 @SVD_COMPATIBILITY(to specify compatibility)................................................................................................................. 8
2.4 Starting the Debugger.......................................................................................................................................................................... 82.4.1 Start debugging............................................................................................................................................................................. 8
2.4.1.1 How to start debugging for general programs....................................................................................................................... 92.4.1.2 How to start debugging for programs that run in server environments such as Interstage....................................................92.4.1.3 How to start debugging using the just-in-time debugging function...................................................................................... 9
2.4.2 Starting to Debug a Program........................................................................................................................................................ 92.4.2.1 The Start Debugging Dialog Box........................................................................................................................................ 102.4.2.2 Specifying Options on the Command Line..........................................................................................................................11
2.5 Operation of the Debugger................................................................................................................................................................ 132.5.1 Overview of the Debugger Windows......................................................................................................................................... 13
2.5.1.1 Main Window...................................................................................................................................................................... 132.5.1.2 Source File Window............................................................................................................................................................ 142.5.1.3 Program List Window..........................................................................................................................................................142.5.1.4 Watch Window.................................................................................................................................................................... 152.5.1.5 Line Command window.......................................................................................................................................................152.5.1.6 Call Stack window............................................................................................................................................................... 162.5.1.7 Thread List window............................................................................................................................................................. 162.5.1.8 Status Bar.............................................................................................................................................................................16
2.5.2 Function of the Debugger........................................................................................................................................................... 172.5.2.1 Using the Debugger............................................................................................................................................................. 17
2.5.2.1.1 Setting Breakpoints.......................................................................................................................................................172.5.2.1.2 Checking and Changing Data Contents........................................................................................................................ 172.5.2.1.3 Breaking Execution when Data Changes......................................................................................................................182.5.2.1.4 Changing the Statement Execution Sequence.............................................................................................................. 182.5.2.1.5 Tracing the Execution Path...........................................................................................................................................192.5.2.1.6 Tracing the Program Calling Path................................................................................................................................ 202.5.2.1.7 Breaking into an Executing Program............................................................................................................................212.5.2.1.8 Allocating Linkage Section Items.................................................................................................................................212.5.2.1.9 Checking Test Coverage...............................................................................................................................................212.5.2.1.10 Restarting the Debug Session..................................................................................................................................... 212.5.2.1.11 Automating Debug Operations................................................................................................................................... 222.5.2.1.12 Configuring the Debugger.......................................................................................................................................... 222.5.2.1.13 Splitting the Source File Window...............................................................................................................................232.5.2.1.14 Configuring Source Code Font and Colors.................................................................................................................23
- v -

2.5.2.1.15 Checking the Status of the Debugger......................................................................................................................... 232.5.2.1.16 Data File Input/Output................................................................................................................................................ 24
2.6 Debug Functions Based on Program Features...................................................................................................................................252.6.1 Debug functions for dynamic structured programs.................................................................................................................... 252.6.2 Debug functions for signals handled by the exception handler.................................................................................................. 262.6.3 Debug Functions for Object-Oriented Programming................................................................................................................. 262.6.4 Debugger Compatibility with Multithreading............................................................................................................................ 27
2.6.4.1 Basic operation of the debugging function in multithreading............................................................................................. 272.6.4.2 Multithread-specific operations of the debugging function.................................................................................................27
2.6.4.2.1 Breakpoints................................................................................................................................................................... 272.6.4.2.2 Passage count points..................................................................................................................................................... 282.6.4.2.3 Execution...................................................................................................................................................................... 282.6.4.2.4 Watch data/Watch conditional expression....................................................................................................................282.6.4.2.5 Backward trace............................................................................................................................................................. 28
2.6.4.3 Functions to aid in debugging multithreads.........................................................................................................................282.6.4.3.1 Enable/disable debugging event notifying....................................................................................................................282.6.4.3.2 Suspend/resume............................................................................................................................................................ 28
2.6.4.4 Automating debug operations in a multithread environment.............................................................................................. 282.6.5 Handling of Unicode by the Debugger....................................................................................................................................... 29
2.6.5.1 Debug functions of Unicode programs................................................................................................................................292.6.5.2 Notes on handling Unicode..................................................................................................................................................29
2.7 Notes.................................................................................................................................................................................................. 292.8 How to use the Interactive Remote Debugger................................................................................................................................... 31
2.8.1 Overview of the remote debugger.............................................................................................................................................. 312.8.1.1 Benefits of introducing the remote debugger...................................................................................................................... 322.8.1.2 Storage location for resources when doing remote debugging............................................................................................322.8.1.3 How to create the debug target program for remote debugging.......................................................................................... 33
2.8.2 Start procedure for remote debugging........................................................................................................................................ 332.8.2.1 How to start remote debugging for general programs......................................................................................................... 332.8.2.2 How to start remote debugging for programs that run in server environments such as Interstage..................................... 342.8.2.3 How to start remote debugging using the just-in-time debugging function........................................................................ 35
2.8.3 How to use the Remote Debugger Connector............................................................................................................................ 352.8.3.1 How to use the server remote debugger connector..............................................................................................................362.8.3.2 How to start the remote debugger connector on the server................................................................................................. 362.8.3.3 Format of the connect restriction file...................................................................................................................................372.8.3.4 How to use the client remote debugger connector...............................................................................................................38
2.8.3.4.1 How to start the remote debugger connector on the client........................................................................................... 382.8.3.4.2 The Remote Debugger Connector dialog box settings................................................................................................. 38
2.8.3.5 Restricting connection to computers that allow remote debugging.....................................................................................402.8.4 Environment Variables of the Remote Debugger.......................................................................................................................41
2.8.4.1 @SVD_COMPATIBILITY(to specify compatibility)........................................................................................................ 412.8.5 Starting the Remote Debugger....................................................................................................................................................42
2.8.5.1 Specification for Remote Debugging using the Start Debugging dialog box......................................................................422.8.5.2 Specifying Options on the Command Line for the Remote Debugger................................................................................45
2.8.6 Using the Remote Debugger.......................................................................................................................................................462.8.7 Notes about the Remote Debugger............................................................................................................................................. 46
2.8.7.1 Notes about the Win32 Remote Debugger.......................................................................................................................... 472.8.7.2 Notes about the Solaris Remote Debugger.......................................................................................................................... 47
2.8.7.2.1 Deciding the Character Code at execution-time........................................................................................................... 472.8.7.2.2 Notes on handling Unicode...........................................................................................................................................472.8.7.2.3 Other Notes................................................................................................................................................................... 47
Chapter 3 Debugging Mixed COBOL and PowerCOBOL...................................................................................................... 483.1 Overview............................................................................................................................................................................................483.2 Preparing Programs for Mixed COBOL Debugging......................................................................................................................... 48
3.2.1 Building COBOL Programs for Debugging............................................................................................................................... 483.2.2 Building PowerCOBOL Programs for Debugging.....................................................................................................................48
- vi -

3.2.3 COBOL Runtime Options.......................................................................................................................................................... 483.3 Starting Debugging Mixed COBOL Applications.............................................................................................................................493.4 Tips for Debugging Mixed COBOL Applications............................................................................................................................ 49
3.4.1 Expanded PowerCOBOL Code.................................................................................................................................................. 493.4.2 The Main Event Loop................................................................................................................................................................. 493.4.3 Internal Sub-Programs to Handle Events....................................................................................................................................503.4.4 Expanded Code for Items, Methods and Attributes....................................................................................................................50
Chapter 4 Debugging Visual Basic calling COBOL................................................................................................................524.1 Overview............................................................................................................................................................................................524.2 Preparing Programs for Debugging with Visual Basic......................................................................................................................52
4.2.1 Compiling for Debugging...........................................................................................................................................................524.2.2 Linking for Debugging............................................................................................................................................................... 524.2.3 Making Files Accessible to Visual Basic................................................................................................................................... 524.2.4 COBOL Runtime Options.......................................................................................................................................................... 53
4.3 Starting Debugging with COBOL and Visual Basic......................................................................................................................... 534.4 Stopping Debugging with COBOL and Visual Basic....................................................................................................................... 574.5 Do's and Don'ts in the Dual Debugging Environment.......................................................................................................................58
Chapter 5 NetCOBOL Debugging Functions..........................................................................................................................595.1 Outline of the Debugging Functions..................................................................................................................................................59
5.1.1 Statement Number...................................................................................................................................................................... 615.2 Using the CHECK Function.............................................................................................................................................................. 62
5.2.1 Flow of Debugging..................................................................................................................................................................... 625.2.2 Output Message.......................................................................................................................................................................... 625.2.3 Examples of Using the CHECK Function.................................................................................................................................. 655.2.4 Notes........................................................................................................................................................................................... 70
5.3 Using the TRACE Function...............................................................................................................................................................715.3.1 Flow of Debugging..................................................................................................................................................................... 715.3.2 Trace Information....................................................................................................................................................................... 725.3.3 Notes........................................................................................................................................................................................... 74
5.4 Using the COUNT function...............................................................................................................................................................765.4.1 Flow of Debugging..................................................................................................................................................................... 765.4.2 Count Information.......................................................................................................................................................................765.4.3 Debugging Programs with the COUNT Function...................................................................................................................... 795.4.4 Notes........................................................................................................................................................................................... 80
5.5 Using the Memory Check Function...................................................................................................................................................805.5.1 Flow of Debugging .................................................................................................................................................................... 805.5.2 Output Message ......................................................................................................................................................................... 815.5.3 Diagnostic report ........................................................................................................................................................................825.5.4 Identifying programs ..................................................................................................................................................................835.5.5 Identifying destroyed locations ..................................................................................................................................................835.5.6 Notes........................................................................................................................................................................................... 84
5.6 Using the COBOL Error Report........................................................................................................................................................ 845.6.1 COBOL Error Report overview..................................................................................................................................................845.6.2 Resources used by the COBOL Error Report.............................................................................................................................84
5.6.2.1 Programs.............................................................................................................................................................................. 855.6.2.2 Relationships between compiler and linkage options and output information....................................................................855.6.2.3 Compiling and linking programs......................................................................................................................................... 875.6.2.4 Location of the debugging information file (.SVD) ........................................................................................................... 87
5.6.3 Starting the COBOL Error Report.............................................................................................................................................. 885.6.3.1 Starting the COBOL Error Report for applications that generate application errors and U-level runtime messages......... 885.6.3.2 Starting the COBOL Error Report for applications that do not respond ............................................................................ 885.6.3.3 Starting the COBOL Error Report for applications that cause area destruction .................................................................895.6.3.4 Start parameters................................................................................................................................................................... 89
5.6.4 Diagnostic Report....................................................................................................................................................................... 915.6.4.1 Diagnostic report output destination....................................................................................................................................915.6.4.2 Diagnostic report output information.................................................................................................................................. 92
- vii -
5.6.4.2.1 For application errors, runtime messages, and no response......................................................................................... 925.6.4.2.2 For area destruction watch ...........................................................................................................................................99
5.6.4.3 How to read diagnostic reports.......................................................................................................................................... 1005.6.4.3.1 Application error.........................................................................................................................................................1005.6.4.3.2 Runtime message........................................................................................................................................................ 1025.6.4.3.3 No response.................................................................................................................................................................1055.6.4.3.4 Area destruction watch............................................................................................................................................... 105
5.6.5 Dump........................................................................................................................................................................................ 1085.6.5.1 What is dump?................................................................................................................................................................... 1085.6.5.2 Dump output destination....................................................................................................................................................1085.6.5.3 Managing the number of dump files..................................................................................................................................109
5.6.6 Notes......................................................................................................................................................................................... 1095.7 Debugging Using Compiler Listings and Debugging Tools........................................................................................................... 110
5.7.1 Flow of Debugging................................................................................................................................................................... 1115.7.2 Source Program Listing............................................................................................................................................................ 1135.7.3 Object Program Listing.............................................................................................................................................................1145.7.4 Listings Relating to Data Areas................................................................................................................................................ 115
5.7.4.1 Data Map Listing............................................................................................................................................................... 1155.7.4.2 Program Control Information Listing................................................................................................................................ 1195.7.4.3 Section Size Listing........................................................................................................................................................... 120
5.7.5 Locating Errors......................................................................................................................................................................... 1205.7.5.1 Locating errors (Program database file)............................................................................................................................ 1205.7.5.2 Locating Errors (Link Map file)........................................................................................................................................ 1265.7.5.3 Researching Data Values................................................................................................................................................... 129
Appendix A Debugger Command Lists................................................................................................................................ 134
Index.....................................................................................................................................................................................135
- viii -

Chapter 1 Introduction to Debugging with NetCOBOLThe introduction gives you an overview of the debugging options available with NetCOBOL.
1.1 Debugging with NetCOBOLNetCOBOL provides debugging aids:
- NetCOBOL Studio debugging functions
- COBOL Debugger for the Windows system (32 bit applications)
- COBOL Debug Functions
The debugging function of NetCOBOL Studio and COBOL Debugger is a full featured, interactive debugger that provides a rich set offunctions to help you locate bugs and analyze the behavior of your programs. It works on the executable code, in EXE or DLL format, soyou are seeing the same code execute that will be run when the applications are used in production. Working with the executable codealso means that mixed language debugging is straightforward. For more information on using the NetCOBOL Studio debugging function ,refer to "NetCOBOL Studio User's Guide".
The COBOL debugger products support many common interface features such as the ability to record and play back sequences of debuggingoperations and a command-line interface.
The COBOL debug functions provide tracing of executed statements and checking of subscripts and modifiers going out of range, as wellas the ability to count executed statements. With these functions you can ascertain the exact points at which abnormal termination occursand prevent errors of programs corrupting memory outside their allotted range.
1.2 Features of the Debugger for WindowsThe debugger for the Windows system provides the following features:
- Displays the original program source.
- Colors code to indicate comments, verbs, data-names and other syntax features.
- Clearly indicates the current execution point, breakpoint settings, pass count settings and execution route trace point.
- Gives convenient access to all functions through menus, a toolbar, a shortcut menu, accelerator keys and a command-line window.
- Records and displays the CALL stack status.
- Lists all programs loaded in memory and allows you to switch easily among them.
- Supports storage of different file types in multiple directories or in a single folder.
- Provides navigation around the program source through Find and Jump to line number functions.
- Provides different levels of code execution control including stepping line-by-line, automated line-by-line execution while you watch,and full speed execution to the next breakpoint.
- Code can be executed up to the point indicated by the cursor, up to the next program and up to a long list of specific execution conditionssuch as particular verbs being executed, particular files being accessed and entry to or exit from the program.
- The current execution point can be set to any statement in the program.
- Breakpoints can be set on any statement. The breakpoint can be set to occur only if a particular condition is true or after the line hasbeen executed a particular number of times.
- Passage counts can be set on any statement so you can check the number of times particular lines are being executed.
- The values of data items can be inspected, changed and monitored throughout execution.
- Unassigned linkage items can be assigned storage space so that debugging can continue.
- Execution path can be recorded for later tracing so you can confirm how a particular point in the code was arrived at.
- 1 -

- Debugging operations, and their results, can be recorded in a log file for later inspection or for later replay of either the whole debuggingsession or repeated sequences of operations.
- Useful lists of breakpoints, pass counts, monitored data items, active programs and other information are provided to help you controlyour debugging session.
With this full set of features bugs are quickly tracked down and eradicated.
1.3 Features of the COBOL Debugging FunctionsThere are COBOL debugging functions as follows:
- TRACE
- CHECK
- COUNT
- Memory Check
- COBOL Error Report
- Compiler Listings
These functions can be very useful in trapping problems that are difficult to reproduce in production situations.
1.3.1 TRACETRACE records the following information at program execution time:
- Results of executed statements
- Line number and position within line, of the statement causing abnormal termination.
- Program name being executed.
- Messages output during execution.
TRACE lets you check where abnormal termination is happening and the path taken to reach that point.
TRACE is enabled by specifying an option at compile time and providing specific details in environment variables at run time.
1.3.2 CHECKCHECK is also a compile time option. When set, the COBOL runtime system checks the following items:
- The subscript and the index boundaries, and reference modification
- Numeric data exceptions and divide-by-zero errors
- Parameters for calling a method
- Program calling conventions
A message is output when one of these items goes out of range.
A count can be specified so that the message is only displayed after a certain number of occurrences.
1.3.3 COUNTCOUNT records the following information at program execution time:
- The execution count for each statement written in a source program sequentially, along with the percentage of this execution countto the total execution count for all the statements.
- The execution count by verb, along with the percentage of this execution count vs. the total execution count for all the statements.
COUNT lets you check all the routes the program has followed during execution.
- 2 -

1.3.4 Memory CheckWhen Memory Check is enabled by specifying environment variables, the COBOL runtime system checks the specified area. If the areahas been destroyed, the following information is output:
- Name of the program or method for which area destruction was detected
- Location where destruction was detected (procedure division start or end)
- Addresses of the destroyed area
Memory Check lets you check the program that destroyed the runtime system area.
1.3.5 COBOL Error ReportCOBOL Error Report output diagnostic information for the following problems:
- Application errors and runtime messages of U-level
- No response
- Area destruction
COBOL Error Report check lets you check which error has occurred and in which statement.
1.3.6 Compiler ListingsWhen the compile option LIST is specified, object program list is generated for each object program.
Object program list check lets you check the statement that caused the program to terminate abnormally.
- 3 -

Chapter 2 Debugging in Windows SystemThis chapter explains how to use the interactive debugger. The sections are:
- Overview of the Debugger
- Preparing Programs for Debugging
- Environment Variables of the Debugger
- Starting the Debugger
- Overview of the Debugger Windows
- Using the Debugger
- Debug Functions Based on Program Features
- Debug Functions for Object-Oriented Programming
- Debugger Compatibility with Multithreading
- Handling of Unicode by the Debugger
- Notes
- How to use the Interactive Remote Debugger
- Start procedure for remote debugging
- How to use the Remote Debugger Connector
- Environment Variables of the Remote Debugger
- Starting the Remote Debugger
- Using the Remote Debugger
- Notes about the Remote Debugger
2.1 Overview of the DebuggerThe COBOL debugger is a full function, interactive source code debugger. You can easily debug your COBOL source programs displayedon the screen, by using the keyboard and mouse to select menu commands and toolbar buttons.
The debugger provides functions for:
- Controlling code execution
- Watching and changing data values
- Setting breakpoints at specific locations
- Setting breakpoints on specific conditions
- Counting the number of times lines are executed
- Retracing execution paths
- Recording and replaying debugging commands
- Operating the debugger automatically
- Navigating around the source code
- Configuring the colors of different source code items
- Viewing the program CALL sequence
Access is provided to these functions in several ways, allowing you to choose the access method that works best for you. The toolbarcontains the most frequently used functions and there are accelerator keys for most immediate actions. All the functions are available from
- 4 -

the drop down menus. A shortcut menu provides functions best invoked by mouse-only actions. A command line interface providescompatibility with earlier versions of Fujitsu debuggers and supports automated debugging.
You can debug not only the program running on the same computer as the debugger, but also the program running on another computeron the network. This section explains how to use the normal interactive debugger. For information regarding the interactive remotedebugger, see "How to Use the Interactive Remote Debugger".
2.2 Preparing Programs for DebuggingThis section explains how to prepare COBOL programs for use with the debugger. The figure below gives an overview of the debuggingprocedure.
Figure 2.1 Overview of the debugging procedure
2.2.1 Debug Program TypesThe debugger can debug executable programs (EXE) and dynamic link libraries (DLL) called from executable programs. This chapterrefers to these executable programs and dynamic link libraries as debug target programs.
Usually, a debug target program consists of multiple COBOL source programs. For the debugger to recognize one of these programs fordebugging, you need to create a debugging information file by compiling with the TEST option. Since the debugger maintains user resourcecompatibility, you can use it without having to recompile and re-link old resources.
- 5 -

Figure 2.2 Debugging programs with and without TEST
2.2.2 Compiling for DebuggingTo prepare a program for debugging, specify the compiler option TEST when compiling the COBOL source program. When the compileroption TEST is specified, the compiler writes the information needed to carry out debugging to an object file and creates a debugginginformation file.
The file name used for the debugging information file is the name of the COBOL source program with the extension SVD added.
Programs to be debugged can be easily created using the project management function. For more information, refer to "Creating a DebugModule" in the "NetCOBOL User's Guide".
COBOL source programs compiled with the TEST option specified can be debugged with the debugger functions. COBOL source programscompiled without the TEST option specified or non-COBOL programs can be run under the debugger but cannot be debugged. COBOLsource programs compiled with both the TEST and OPTIMIZE options specified cannot be debugged, since a debugging information fileis not available. Refer to "TEST (Whether the interactive debugger and the COBOL Error Report should be used)" in the "NetCOBOLUser's Guide".
2.2.3 Linking for DebuggingTo link an object file for debugging, specify the link option /DEBUG. If you specify these options, the linker outputs the debugginginformation that is output in the object file by the compiler in an executable file or dynamic link library file.
The format of the option /DEBUG is:
/DEBUG
Note
If you do not want to view certain programs in the debugger, omit the /DEBUG option.
2.3 Environment Variables of the DebuggerThis section describes how to set environment variables to be used by the debugger.
The environment variables to be used by the debugger are for batch debugging, and it is unnecessary to specify them except for batchdebugging. For information on batch debugging, refer to "2.5.2.1.11 Automating Debug Operations".
Use either of the following methods to set environment variables:
- Set them by the system of the control panel.
- 6 -

- Set them by the SET command.
For how to use the SET command, refer to the "Setting Runtime Environment Information" in the "NetCOBOL User's Guide".
For how they can be set in AUTOEXEC.BAT or by the control panel, refer to Help on your system.
2.3.1 @SVD_PERFORM_CHECK(to watch PERFORM nest)@SVD_PERFORM_CHECK = {YES|NO}
Specify whether the debugger watch PERFORM nest. (YES/NO)
By specifying this environment variable, the initial value to decide whether to watch PERFORM nest can be set in the value specified bythe environment variable.
When the environment variable is not specified, the default becomes the following.
At batch debugging
Do not watch PERFORM nest.
At operations except batch debugging
The default conforms to the values that were set when the debugger last ended.
2.3.2 @SVD_ENV(to specify a debugging environment)@SVD_ENV = [DIFF|SAME[({ALL|WORD})][{BREAK|CONTINUE}][SIGNAL({BREAK|CONTINUE})][THREADEND({BREAK|CONTINUE})]
Specify a debugging environment.
This environment variable is provided for batch debugging by means of a command file that was created for Debugger V50L10 or earlierdebugger. By specifying this environment variable, the initial values for the debugging environment can be set to the value specified bythe environment variable instead of the values that were set when the debugger last ended.
DIFF
Uppercase and lowercase letters are distinguished in handling data names or program names in line commands.
SAME(ALL)
Uppercase and lowercase letters are not distinguished in handling data names or program names in line commands.
SAME(WORD)
In line commands, lowercase letters in data names are taken as the corresponding uppercase letters while lowercase letters in programnames are not taken as the corresponding uppercase letters.
BREAK
Execution of the program is interrupted before processing an exception procedure when an exception condition occurs. BREAK canbe abbreviated as B.
CONTINUE
Execution of the program is not interrupted before processing an exception procedure when an exception condition occurs. CONTINUEcan be abbreviated as CONT or C.
SIGNAL(BREAK)
Execution of the program is interrupted when the first signal was received. SIGNAL can be abbreviated as SIG. BREAK can beabbreviated as B. For reception of the first signal, refer to "2.6.2 Debug functions for signals handled by the exception handler".
SIGNAL(CONTINUE)
Execution of the program is not interrupted when the first signal was received. SIGNAL can be abbreviated as SIG. CONTINUE canbe abbreviated as CONT or C. For reception of the first signal, refer to "2.6.2 Debug functions for signals handled by the exceptionhandler".
- 7 -

THREADEND (BREAK)
The program execution is interrupted at all thread ends. THREADEND can be abbreviated as THE. BREAK can be abbreviated as B.
THREADEND (CONTINUE)
The program execution is interrupted at only the implicit thread end. THREADEND can be abbreviated as THE. CONTINUE can beabbreviated as CONT or C.
When the environment variable is not specified or each parameter is omitted, the default becomes the following.
At batch debugging
- Uppercase and lowercase letters are distinguished in handling data names or program names in line commands.
- Execution of the program is interrupted before processing an exception procedure when an exception condition occurs.
- Execution of the program is not interrupted when the first signal is received from the operating system (such as problem signalsand callbacks).
- The program execution is interrupted at only the implicit thread end.
At operations except batch debugging
- The default environment is the values that were set when the debugger last ended.
2.3.3 @SVD_COMPATIBILITY(to specify compatibility)@SVD_COMPATIBILITY = {[COBOL97] VxxLyy | NetCOBOL Vx.xLyy}
You can restrict the functions of the debugger with this variable. By specifying this environment variable, the initial value for thecompatibility of the debugger can be set in the value specified by the environment variable. When the environment variable is not specified,the default conforms to the values that were set when the debugger last ended.
In the environment variable, specify the product type and version level of the debugger in use at the time the command file was created.
If you select "About NetCOBOL for Windows " from the debugger Help menu, you can check the product type and version level of thedebugger.
[COBOL97] VxxLyy
If you specify COBOL97, there are three types of behavior depending on what is set for the version and level number (VxxLyy). Theseare shown as follows.
- When a version and level earlier than V50L10 is specified: Compatibility with V40 series or earlier is maintained.
- When V50L10 is specified: Compatibility with V50L10 is maintained.
- When V61L10 or later is specified: Compatibility with V61L10 is maintained. (This is the latest behavior.)
NetCOBOL Vx.xLyy
If you specify NetCOBOL, the behavior is shown as follows.
- When V7.0L10 or later is specified: This is the latest behavior. Compatibility with V7.0L10, the release specified in this, andassociated, manuals is maintained.
2.4 Starting the DebuggerThis section explains how to start the debugger and provide the information required for debugging.
2.4.1 Start debuggingEssentially, there are three methods used to start debugging.
- Debugging for general programs
Start the debugger, and specify the program you want to debug. Start the debug.
- 8 -

- Debugging for programs that run in server environments such as Interstage
Start the debug from program you want to debug. Since the COBOL program is called from the server product, you must use this asthe start method, as the programs cannot be debugged using the method for general programs.
- Debugging using the just-in-time debugging function
When an application error occurs or a runtime message occurs in the program, the debugger starts automatically and debugs theprogram.
2.4.1.1 How to start debugging for general programsThis starts the debugger and starts debug for the program you want to debug. The following are general methods:
- Select "Debug" from the Project menu of the Project Manager window.
- Select "Win32" in the Project Manager window, Tools menu, "Debugger type". Next, use one of the following methods to start thedebug:
- Select "Debugger" in the Project Manager window, Tools menu.
- At the command prompt, type in the command to invoke the debugger. Refer to "2.4.2.2 Specifying Options on the CommandLine" for the details of the command line format.
When the debugger starts, the Main window of the debugger will appear. To start a debugging session, bring up the Start Debugging dialogbox, provide the required information, and click the [OK] button. This starts a debugging session. Then, the dialog box closes and theMain window is activated. Thus, you can perform debugging by selecting menus and buttons in the Main window, or by entering a linecommand.
2.4.1.2 How to start debugging for programs that run in server environments such asInterstage
This is the method for starting the debugger from the program you want to debug.
You can start debug for programs that run on servers such as Interstage and Web servers from the command in the environment variable.For details, refer to “How to start remote debugging for programs that run in server environments such as Interstage”.
2.4.1.3 How to start debugging using the just-in-time debugging functionThis start method automatically starts the debugger and debugs the program if an application error or runtime message occurs in theprogram.
Use the environment variable @CBR_JUSTINTIME_DEBUG to start the debugger when an application error or runtime message occursand debug the program. Refer to "@CBR_JUSTINTIME_DEBUG (Specify inspection using the debugger or the COBOL Error Reportat abnormal termination)" in the "NetCOBOL User's Guide".
When an application error or runtime message occurs in the program as it is run, the debugger is activated, and the Main window of thedebugger will appear. To start a debugging session, bring up the Start Debugging dialog box and click the [OK] button. When debuggingstarts, the program pauses with the application error or runtime message occurring.
2.4.2 Starting to Debug a ProgramTo start debugging a program, select File, "Start Debugging". This brings up the Start Debugging dialog box.
- 9 -

2.4.2.1 The Start Debugging Dialog Box
The Start Debugging dialog box lets you input all the information the debugger requires to execute your program. You only need to enterthe information that applies to your program. The information requested on each tab is as follows:
Table 2.1 Start Debugging Dialog Box Parameters
Parameter Description
Application Application: Name of the EXE file to be loaded.
This is the only mandatory parameter.
Default: Extension of EXE.
Execution-timeoptions: Any options expected on the command line of the program.
Start program: Name of the first program to be debugged (must be a program prepared fordebugging).
Default: the first program for debugging executed in the EXE or a DLL calledby it.
Source Source file storagefolders:
Directories containing the source of the programs to be debugged.Default: the folder containing the EXE or DLL file.
Copy library storagefolders:
Directories containing copy libraries used by the debug target programs.
Default: If this parameter is omitted or cannot be found in the specified folders,a search for the parameter will be made in order from (1) the directoriesspecified by environment variable COB_COBCOPY and (2) the foldercontaining the EXE or DLL file. For copy library files with IN/OF specified,a search for the parameter will be made in order from (1) the directoriesspecified by the environment variable COB_library-name and (2) the foldercontaining the EXE or DLL file.
Subschema descriptorfile storage folders:
Directories containing subschema used by the debug target programs. Default: If this parameter is omitted or cannot be found in the specified folders,a search for the parameter will be made in order from (1) the directoriesspecified by environment variable COB_AIMLIB and (2) the folder containingthe EXE or DLL file.
Descriptor Screen and formdescriptor:
Directories and extension of form descriptors used by the debug targetprograms.
- 10 -

Parameter Description
Default: If this parameter is omitted or cannot be found in the specified folders,a search for the parameter will be made in order from (1) the directoriesspecified by environment variable FORMLIB and (2) the folder containing theEXE or DLL file. Extension PMD.
File descriptor: Directories and extension of file descriptors used by the debug target programs.Default: If this parameter is omitted or cannot be found in the specified folders,a search for the parameter will be made in order from (1) the directoriesspecified by environment variable FILELIB and (2) the folder containing theEXE or DLL file. Extension FFD.
DebuggingInformation
Debugging informationfile storage folders
Directories containing debugging information file(.SVD files)
Default: the folder containing the EXE or DLL file.
BatchDebugging
Use Batch Debugging Batch Debugging is performed.
Command file File to drive the debugging session.
Default extension: LOG
History file File to save actions and results from the debugging session.
Default extension: LOG
Details of the Start Debugging Dialog Box Options
Relative file names
When you use relative path names, the debugger adds the folder that was current when the debugger started to the path name.
Multiple folder names
For fields that accept multiple directories, separate the folder names by semicolons ";". The debugger searches for files in order of thespecified directories.
The search procedure when the folder specification is omitted or when files cannot be found in the specified folders depends on eachfile.
For source files and debugging information files, the directories containing the executable files or the dynamic link libraries aresearched.
For copy library files, subschema descriptor files, screen and form descriptors, and file descriptors, the folders are searched in orderfrom (1) the directories specified by the environment variable and (2) the directories containing the executable files or the dynamiclink libraries. Refer to "Setting Environment Variables" in the "NetCOBOL User's Guide" for details about environment variables usedfor specifying folders of the various files.
Command and history files
When the "Use Batch Debugging" check box is on, Command file and History file parameters are mandatory.
Do not specify the same file in both the Command file and History file parameters.
If the file specified for the History file already exists, it is overwritten.
Refer to "2.5.2.1.11 Automating Debug Operations" for details on batch debugging and command files.
2.4.2.2 Specifying Options on the Command LineThis section explains how to start the debugger using command format.
To start a debugger with the winsvd command, select it from "Debugger type" in the Tools menu of the Project Manager window. Selectthe correct type of debugger before executing the start command.
To start the debugger from the command line, use the WINSVD command with the following format:
winsvd [start-parameter] application-name [execution-time-option]
You must specify the parameters in the order shown above.
- 11 -

If you only enter "winsvd", you need to provide the application information in the Start Debugging dialog box.
You must specify application-name if you want to enter any other information after "winsvd".
When you start the debugger with information on the command line, it comes up with the Start Debugging dialog box opened and thecommand line information entered in the appropriate fields.
To start debugging, enter any further information in the Start Debugging dialog box, and click the OK button.
See the list below for the supported start parameters.
Table 2.2 Start Parameters
Specification Format Field in Start Debugging dialog box
/G start- program-name Start program
/S source-file-storage-folder-name Source file storage folders
/C copy-library-storage-folder-name Copy library storage folders
/A subschema- descriptor-file-storage-folder-name Subschema descriptor file storage folders
/M screen-and form-descriptors-storage-folder-name Screen and form descriptor folders
/E screen-and form-descriptors-extension Screen and form descriptor extension
/H file-descriptors-storage-folder-name File descriptor folders
/O file-descriptors-extension File descriptor extension
/D debugging-information- file-storage-folder-name Debugging information file storage folders
/B command-file-name Command file
/L history- file-name History file
/N Starts debugging without opening the Start Debugging dialogbox.
"-" (hyphen) can be used instead of "/ " (slash) as the first character of a start parameter.
The start parameter letter can be upper case or lower case.
To specify multiple start parameters, provide one or more blanks between start parameters.
Example
To enter a command with the following parameters and options:
- Application name: E:\EXE\SAMPLE1.EXE
- Source file storage folder name: D:\SOURCE
- Debugging information file storage folder name: E:\SVD
- Execution-time option: PARAM1
The command line would be:
winsvd /S d:\source /D e:\svd e:\exe\sample1.exe param1
- 12 -

2.5 Operation of the Debugger
2.5.1 Overview of the Debugger Windows
2.5.1.1 Main WindowThe main window of the debugger contains the Source File window, the Program List window, the Watch window, the Call Stack window,the Thread List window, and the Line Command window. The status bar at the bottom of the window displays program status informationand an expanded explanation about the item under the mouse pointer.
The figure below shows an example of the main window.
Figure 2.3 Debugger Main Window
You can invoke debugging operations in five ways:
1. Using menu commands: Refer to Help for details of each command.
2. Using accelerator keys: The drop down menus show the accelerator keys beside the functions they invoke.
3. Using toolbar buttons: Refer to Help for details of each button. You can detach and move the toolbar anywhere in the main windowby dragging.
4. Using the shortcut menu: You display the shortcut menu by clicking the right mouse button. Refer to Help for details on the shortcutmenu commands.
- 13 -

5. Using the Line Command window: You enter commands in this window. Refer to Help for details on the supported line commands.
2.5.1.2 Source File WindowThe Source File window displays the program source and expanded copy libraries. The debugger opens one window for each programbeing debugged. It opens these windows automatically when execution is interrupted in programs prepared for debugging.
You can use the Program List window to open Source File windows.
You can use the shortcut menu to open library files.
See the figure below for an example of the Source File window.
Figure 2.4 A Split Source File Window
You can use a division bar to split the Source File window and view two parts of the same source file simultaneously. The division barstarts as a small bar, called the split box, at the top of the vertical scroll bar. To split the screen click on the split box and drag it down.
The following statements are displayed in color, which can be changed, so as to distinguish them from other statements:
- Current statement - the next statement to be executed: The currently stopped statement is colored. Unless the setup is changed, thecurrent statement color is yellow.
- Current trace statement: The currently backward-traced statement is colored. Unless the setup is changed, the backward-tracedstatement color is blue.
- Statement with a breakpoint set: A statement on which a breakpoint is set is colored. Unless the setup is changed, a statement with abreakpoint is colored red.
- Statement with a passage count set: When a passage count point is set on a statement, it is colored. (The default setup uses green.) Ifthe program is executed after a passage count point is set, the executed statements will not have a different color from that of alreadyexecuted statements. If, however, the passage count point is set after execution has begun, a statement not already passed is indicatedin green and a statement that has already been passed is indicated in dark green.
The debugger colors the source code to distinguish user-defined text, reserved words and comments.
2.5.1.3 Program List WindowThe Program List window lists all programs loaded in memory for debugging. To display this window, select "Program List" on theWindow menu.
The Program List window can be used to view programs or classes to be debugged, or to open source files.
- 14 -

Figure 2.5 The Program List Window
2.5.1.4 Watch WindowThe Watch window displays the following kinds of information:
- Data name and contents whose values and contents are monitored to determine if they have been changed
- Conditional expressions in which the establishment and status of conditions is monitored
The Watch window opens automatically when data or condition monitoring starts and also appears when "Watch" is selected from theWindow menu.
The Watch window is used to identify data changes or monitored conditions or to halt program execution when monitored data change.
More than one set of data or conditions can be programmed for monitoring.
See the figure below for an example of a Watch window.
Figure 2.6 The Watch Window
2.5.1.5 Line Command windowThe Line Command window accepts line commands and displays the results. To display the Line Command window select "LineCommand" from the Window menu.
Figure 2.7 The Line Command Window
- 15 -

Refer to "Debugger Command Lists" in Appendix A for a list of line commands.
Refer to Help for detailed specifications of the line commands.
2.5.1.6 Call Stack windowThe Call Stack window displays a list of the active programs in the call stack. The program currently being debugged is at the top of thecalling path, and calling programs are displayed in sequence. A mark indicating an active program is displayed to the left of the programname.
To display the Call Stack window, select "Call Stack" from the Window menu. The debugging environment can be configured to disablethe Call Stack window from being updated while animation is in progress.
The Call Stack window can be used to identify a calling program or to open a source file.
The figure below illustrates a typical Call Stack window.
Figure 2.8 The Call Stack Window
2.5.1.7 Thread List windowThe Thread List window displays a listing of the active threads and the threads from which a thread end event has been received.
To display the Thread List window, select "Thread List" from the Window menu. The debugging environment can be configured to disablethe Thread List window from being updated while animation is in progress.
The Thread List window is used to check the status of the active threads or change the implicit thread.
Note
System and server applications may have some threads other than COBOL applications threads. This window displays all threadinformation (included with their threads) of the process.
See the figure below for an example of a Thread List window.
Figure 2.9 The Thread List Window
2.5.1.8 Status BarThe status bar displays the following information:
- An expanded explanation of the menu command or toolbar button under the mouse pointer.
- The event that interrupted execution.
- 16 -

- The thread ID of the current implicit thread.
- The cursor position in the Source File window.
- Whether the debugger treats lowercase letters as EQUAL or NOT EQUAL to uppercase letters on line commands.
- Whether TRACE is on or off.
- Whether the operation history log is being written.
2.5.2 Function of the Debugger
2.5.2.1 Using the DebuggerThis section explains how to use the debugger for the following tasks:
- Setting breakpoints
- Checking and changing data contents
- Breaking execution when data changes
- Changing the statement execution sequence
- Tracing the execution path
- Tracing the program calling path
- Breaking into an executing program
- Allocating linkage section items
- Checking test coverage
- Restarting the debugging session
- Automating debugging operations
- Configuring the debugger
- Splitting the source screen
- Configuring source code font and colors
- Checking the status of debugger items
- Data File Input/Output
2.5.2.1.1 Setting Breakpoints
You can set breakpoints at specific locations, at the entry or exit of programs, and on specific conditions being satisfied.
You set simple breakpoints at the current cursor location by using the toolbar Set/Delete Breakpoint button
or the breakpoint function on the shortcut menu. More complex breakpoints are set using the Debug menu Breakpoint function.
In the Line Command window, use the BREAK command.
The Specific Execution Condition on the Continue menu offers another way of executing to a particular point in the program. This functionallows you to execute the program up to a particular verb, location or access point of a particular file. Use the Continue, Specific Executionfunction to execute up to the selected point(s).
2.5.2.1.2 Checking and Changing Data Contents
Use the Data function on the Debug or shortcut menus to check and change the contents of data items.
Data,
- 17 -

, is also available on the toolbar.
In the Line Command window, LIST and SET correspond to the Data function.
2.5.2.1.3 Breaking Execution when Data Changes
Sometimes you know that a data item does not have the correct value but it is not obvious where the incorrect value is coming from. Inthese situations you need to use the Data Monitor function. Data Monitor monitors the data item and interrupts execution when the contentschange.
You switch on the monitoring of a data item from the Watch window or by using the MONITOR line command.
For example, to find out where the application updates data item A, consider the following figure.
Figure 2.10 Finding Data Modification Locations
2.5.2.1.4 Changing the Statement Execution Sequence
The debugger can bypass statements that contain errors and pass control to statements that are not in the original execution sequence.
Use the Change Start-Point to Cursor function, on the Continue or shortcut menus, to change the program execution sequence.
For example, to bypass line 220 in the program below:
- 18 -

Figure 2.11 Changing the Statement Execution Sequence
2.5.2.1.5 Tracing the Execution Path
You can often encounter situations where you can stop a program at the point an error occurs, but there are many possible routes to thatpoint. The Backward Trace function highlights (colors) the statement currently being traced. As a colored statement shifts, you can visuallyreview the flow of program controls.
The Trace function enables the recording of the flow of control. When execution is interrupted, you can use the Backward Trace functionsto retrace the path of execution.
There are four trace functions:
Previous Statement: Steps backward from the current trace sentence to the sentence that was executed before it.
Next Statement: Steps forwards from the current trace sentence to the sentence that was executed after it.
Previous Procedure: Jumps backwards from the current trace statement to the first statement in the procedure containing the statement,and then to the first statement in the procedure that was executed before the current trace procedure.
Next Procedure: Jumps forwards to the first statement in the procedure that was executed after the current trace procedure.
The Trace function is not available as a line command.
For example, to confirm which location calls procedure PRM, consider the following figure.
- 19 -

Figure 2.12 Tracing an Execution Path
2.5.2.1.6 Tracing the Program Calling Path
When data in the linkage section is incorrect or the timing of a program call is incorrect, you often need to confirm which program madethe call. The debugger lets you check the calling path using the Call Stack function available from the Window menu and the toolbar.
Call Stack displays a list of the active programs in the call stack. For example, suppose the application executes the following sequence:
MAINPROG CALLS PROGRAMA PROGRAMA CALLS PROGRAMC PROGRAMC EXITS PROGRAMA EXITSMAINPROG CALLS PROGRAMB PROGRAMB CALLS PROGRAMC Breakpoint encountered in PROGRAMC.
Then the Call Stack list looks like this:
Figure 2.13 Call Stack Window
Note that PROGRAMA does not appear in the list, as it is no longer active in the CALL hierarchy.
- 20 -

2.5.2.1.7 Breaking into an Executing Program
You can break into looping programs, or regain control of programs being run, by pressing the esc key. You can also select the Breakfunction from the Continue menu or the toolbar.
If you are working with a Windows application, for example using PowerCOBOL generated code, you may need to take an action in theuser window before control returns to the debugger.
2.5.2.1.8 Allocating Linkage Section Items
Finding linkage section allocation errors in the midst of debugging large program suites is potentially time consuming. You need to correctand recompile program source, rebuild the application, and restart debugging. The debugger provides the Linkage function to ease suchsituations.
For example, if a calling program omits a parameter from the CALL statement, debugging of the subprogram can continue withoutinterrupting the debugging session. Use the Linkage function to allocate an area in memory for the missing linkage section item.
The debugger deal locates the allocated area when it returns control to the calling program from the subprogram.
Figure 2.14 Allocating Linkage Section Items
2.5.2.1.9 Checking Test Coverage
When testing programs, you often want to be sure that certain sections or lines of code have at least been executed. The Passage Countfunction lets you do this.
First, determine the points in your programs that you want to check. Then, set passage counts by either selecting the Passage Count functionon the Debug menu or the Set Passage Count function on the shortcut menu. Execute the program. Selecting Debug, Update Passage CountDisplay, causes the highlight color to change for executed statements. Alternatively, you can select Debug, Passage Count that displaysthe Passage Count window. This window gives a list of all passage count statements and the number of executions for each statement.
2.5.2.1.10 Restarting the Debug Session
You can restart debugging the same program, without terminating the debugger, by using the Continue, Re-debug function. All data is re-initialized and you can choose whether to retain or reset the following:
- Breakpoints
- Passage counts
- Watch Data
- Watch conditional expression.
- 21 -

2.5.2.1.11 Automating Debug Operations
If you need to demonstrate your debugging steps, or to perform the same debugging procedures frequently, you can automate your debugoperations. The debugger supports two types of automated debugging: batch and automatic.
Both types use a command file that contains debugger commands.
Batch Debugging
In this mode, you specify a command file at the start of debugging. The command file drives the whole debugging session; you do nothave to interact with the debugger.
Automatic Debugging
With automatic debugging, you select a command file during a debugging session, and the debugger executes the commands in the file.Control returns to you when all the commands have been executed. Automatic debugging is useful when you want to repeat the executionof a string of commands.
Creating Command Files
You create command files by:
- Using a text editor
- Specifying a history file in the Start Debugging dialog (Batch Debugging tab)
- Starting and stopping history file creation during a debugging session using the Option, Output Log menu function or the ENVcommand.
You can use the history files, created by the debugger, as command files with no changes. Alternatively, you can use a text editor to makeappropriate changes to the history files, or to select particular sections for use in batch or automated debugging.
The following example shows a command file to set a breakpoint, and display a data value before and after the breakpoint.
break 47 ; Set a breakpoint list data-out ; Display data cont ; Run list data-out ; Display data cont ; Run quit ; Quit
The debugger treats characters following semicolons as comments.
2.5.2.1.12 Configuring the Debugger
You can use the Option, Environments function to configure the following aspects of the debugging environment:
The environments other than the statement identification number mode and replacement character will be enabled the next time thedebugger is started.
- Animation speed: Speed at which the Animate function executes statements.
- Display source text of subprogram: Whether or not Animate and Backward Trace show the code of subprograms.
- Display all threads: Specifies whether backward trace and animation will be carried out with the implicit thread only or with all thethreads.
- Watch the PERFORM statements: Whether to watch the PERFORM statements. When the PERFORM statements are to be watched,the detection of out-of-line PERFORM errors can be handled, and the number of internal PERFORM statements for which Animateand Backward Trace will display the code can be controlled.
- Suspend execution when an exception event occurs: Indicates whether to suspend execution before the exception procedure is executedwhen an exception condition occurs. Refer to "Defining Exception Processes " in the "NetCOBOL User's Guide."
- Suspend execution when the first signal is received: Indicates whether to suspend execution when the first signal is received. Referto "2.6.2 Debug functions for signals handled by the exception handler".
- Suspend execution when thread end: Indicates whether to suspend execution when thread end.
- 22 -

- Capital/small letter on line commands: Whether the debugger handles uppercase letters and lowercase letters as equivalent on linecommands.
- Line number display method: Display the number in the COBOL source file, or a sequential line number generated by the compiler.
- Display the line number: Whether or not the line number in the Source File window is displayed.
- Window update during animation: Specifies whether the Call Stack window and the Thread List window will be updated duringanimation.
- Replacement character for non-displayable values: This is the character that the debugger substitutes for non-displayable byte valueswhen displaying, printing and monitoring data.
- State of debugger when suspended: Specifies whether the debugger should be activated or not when execution is suspended.
- Windows to be opened during batch debugging: Specifies windows to be opened in the Main window during batch debugging.
- Alarm on suspension: Specifies whether the beeper should beep or not when execution is suspended.
- Alarm on suspension during batch debugging: Specifies whether the beeper should beep or not when execution is suspended duringbatch debugging.
- Compatibility: Specifies whether the scope of debugger functionality will be restricted to the specific version range.
2.5.2.1.13 Splitting the Source File Window
You can split the Source File window into two separately scrollable windows. To do this, click and drag the Split box that is in the topright hand corner of the window, immediately above the scroll bar.
Figure 2.15 The Split Box
2.5.2.1.14 Configuring Source Code Font and Colors
The Font and Color commands under View bring up dialog boxes that let you configure the font for the source code and the color of fifteendifferent attributes of the COBOL source display.
2.5.2.1.15 Checking the Status of the Debugger
The debugger maintains information about a number of items: breakpoints, passage counts, watch data, and the watch conditionalexpression. It displays these in the dialog box for each function.
The Breakpoint dialog box displays a list of the breakpoints set and whether they are enabled or disabled.
The Passage Count dialog box displays a list of statements with passage counts, and the counts for these statements.
The Watch window displays a list of data items being watched or monitored and a list of the conditional expressions being monitored.
- 23 -

2.5.2.1.16 Data File Input/Output
The Data File I/O capability is available to read/write data values to/from a file. Brief descriptions of these functions follow.
Reading from a File
This sets a data item to the value read from a file. This is useful when you set a large number of values, because you can store them in afile in advance, instead of using the SET command to change data.
The typical usage is to identify process routes. To do this, you need to prepare values that let your program take every route. Reading suchvalues from a file saves you the time it would take to enter values during a test, thus making the task much easier.
Writing into a File
This writes values of data items into a file. Because you can reference values previously stored in a file, instead of using the LIST commandfor displaying data, this is useful when you need to reference many values at a time.
The typical usage is to review processing results that might vary depending on process routes or entered data. Writing into a file allowsyou to focus on checking process routes during a test, because you can take the time to review processing results after the test is completed.
Using the Fujitsu Data Editor is recommended when you create or check a data file that is to be used for the Data File I/O capability.
Example
In this example, we identify the process route the subprogram takes, and review all the return values from the parameters after the debuggingactivities are completed.
1. Create a file for reading
Create a file (INFL) in which the values required to take every route are set to the data item (A), assuming the data area (LINK) inthe linkage section to be one record.
2. Debug
At the entry point of the subprogram, read values stored in a file (INFL) into the data area (LINK) in the linkage section to identifythe route.
At the exit of the subprogram, write values stored in the data area (LINK) in the linkage section into a file (OUTFL).
- 24 -

3. Review the written file
Check the file (OUTFL) to review the values in the data area (LINK) in the linkage section that were changed by the subprogram.
2.6 Debug Functions Based on Program FeaturesThis section explains the debug functions based on the program features.
2.6.1 Debug functions for dynamic structured programsDynamic structured programs can be debugged in the same way as static structured programs. However, the following points must benoted. Refer to "Dynamic Linkage" in the "NetCOBOL User's Guide."
Dynamic-link structure
For a dynamic-link structure, required DLLs will also be loaded when the calling program is loaded. As a result, the DLLs will also beobjects of debugging. DLLs can be debugged in the same way as static structured programs.
Dynamic-program structure
For a dynamic-program structure, a required DLL is loaded when called from the calling program. The DLL becomes an object of debuggingwhen it is loaded.
To set a breakpoint in a program that includes a DLL, the breakpoint must be set before DLL is called. When a breakpoint is set, thedebugger will not be able to display source files of programs that have not been loaded. Therefore, use a command or dialog box to specifythe name of the program to be loaded. The set breakpoint is valid when a program that has been unloaded is reloaded as long as you donot delete the set breakpoint.
- 25 -
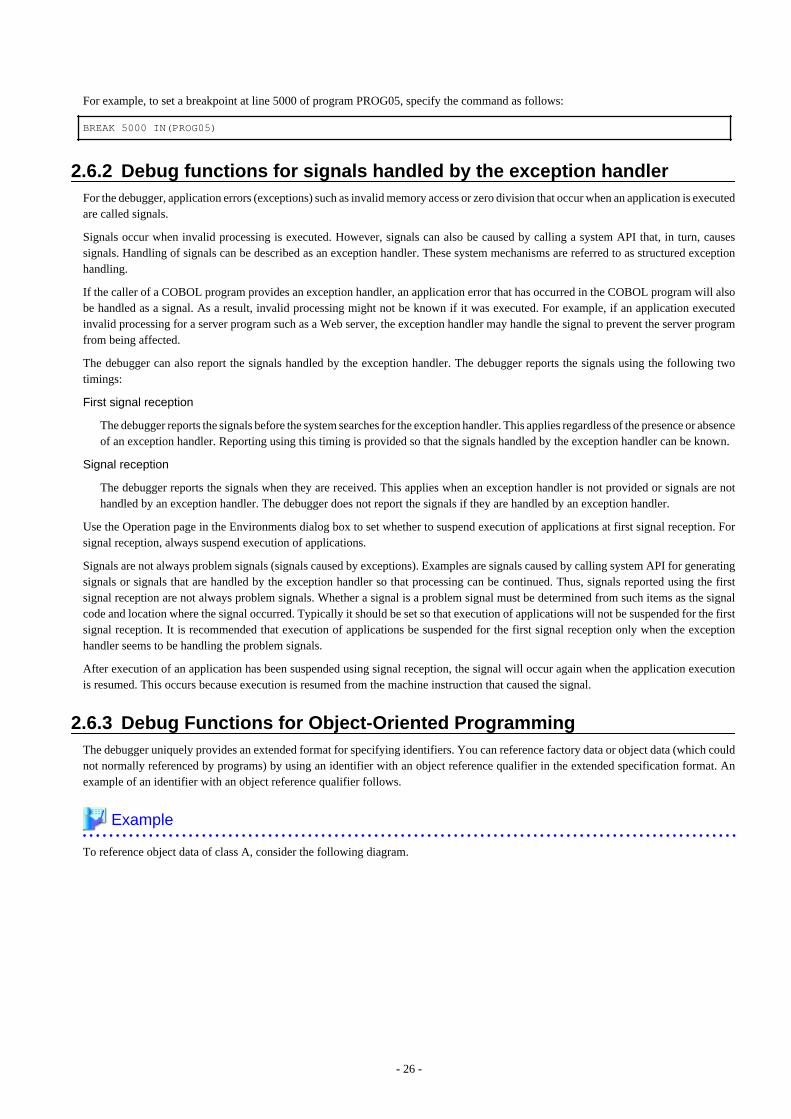
For example, to set a breakpoint at line 5000 of program PROG05, specify the command as follows:
BREAK 5000 IN(PROG05)
2.6.2 Debug functions for signals handled by the exception handlerFor the debugger, application errors (exceptions) such as invalid memory access or zero division that occur when an application is executedare called signals.
Signals occur when invalid processing is executed. However, signals can also be caused by calling a system API that, in turn, causessignals. Handling of signals can be described as an exception handler. These system mechanisms are referred to as structured exceptionhandling.
If the caller of a COBOL program provides an exception handler, an application error that has occurred in the COBOL program will alsobe handled as a signal. As a result, invalid processing might not be known if it was executed. For example, if an application executedinvalid processing for a server program such as a Web server, the exception handler may handle the signal to prevent the server programfrom being affected.
The debugger can also report the signals handled by the exception handler. The debugger reports the signals using the following twotimings:
First signal reception
The debugger reports the signals before the system searches for the exception handler. This applies regardless of the presence or absenceof an exception handler. Reporting using this timing is provided so that the signals handled by the exception handler can be known.
Signal reception
The debugger reports the signals when they are received. This applies when an exception handler is not provided or signals are nothandled by an exception handler. The debugger does not report the signals if they are handled by an exception handler.
Use the Operation page in the Environments dialog box to set whether to suspend execution of applications at first signal reception. Forsignal reception, always suspend execution of applications.
Signals are not always problem signals (signals caused by exceptions). Examples are signals caused by calling system API for generatingsignals or signals that are handled by the exception handler so that processing can be continued. Thus, signals reported using the firstsignal reception are not always problem signals. Whether a signal is a problem signal must be determined from such items as the signalcode and location where the signal occurred. Typically it should be set so that execution of applications will not be suspended for the firstsignal reception. It is recommended that execution of applications be suspended for the first signal reception only when the exceptionhandler seems to be handling the problem signals.
After execution of an application has been suspended using signal reception, the signal will occur again when the application executionis resumed. This occurs because execution is resumed from the machine instruction that caused the signal.
2.6.3 Debug Functions for Object-Oriented ProgrammingThe debugger uniquely provides an extended format for specifying identifiers. You can reference factory data or object data (which couldnot normally referenced by programs) by using an identifier with an object reference qualifier in the extended specification format. Anexample of an identifier with an object reference qualifier follows.
Example
To reference object data of class A, consider the following diagram.
- 26 -

This identifier can be also specified through the interactive Subordinate item reference dialog box.
See Help for the details of identifiers and the Subordinate item reference dialog box.
2.6.4 Debugger Compatibility with MultithreadingThis section describes the scheme of debugger compatibility for debugging multithread programs.
2.6.4.1 Basic operation of the debugging function in multithreadingWhen multiple threads are running in a process of a debugged program, debugging can be essentially performed on only one thread at atime. The thread on which debugging can be performed is called the implicit thread. Any thread can be debugged by switching the implicitthread to it. The implicit thread can be switched from the Thread List window.
Because the debugger window or dialog box displays information on the implicit thread, multithread programs can be debugged in thesame manner as single-thread programs.
System and server applications may have some threads other than COBOL applications threads. It is necessary to use the same actions aswith multithread applications when these applications are debugged.
2.6.4.2 Multithread-specific operations of the debugging functionWhile the debugging function basically works on the implicit thread as if it were a single thread, the following operations are specific onlyto multithreads:
- Breakpoints
- Passage count points
- Execution
- Watch data/Watch conditional expression
- Backward trace
2.6.4.2.1 Breakpoints
Because a breakpoint is effective for all threads, all threads stop at the specified breakpoint. Moreover, the passage count of each threadis counted. The passage count is initialized to zero by subsequent execution of any procedure after a thread ends, though the passage countis maintained until the time the thread ended.
- 27 -

2.6.4.2.2 Passage count points
Because a passage count is effective for all threads, the number of times a thread passes the passage count point is counted. The passagecount is initialized to zero by subsequent execution of any procedures after a thread ends, though the passage count is maintained untilthe time the thread ended.
To check the passage count when threads other than the implicit thread end, therefore, specify on the [Operation] page in the [Environment]dialog box, a program execution break at thread end.
2.6.4.2.3 Execution
When a program is executed unconditionally, all threads are run simultaneously.
If a program is executed to a target position, the implicit thread is run under specified conditions. All threads other than the implicit threadare run unconditionally at this time.
2.6.4.2.4 Watch data/Watch conditional expression
While watching data shared by threads, the watch data or watch conditional expression function detects successful monitoring when athread changes the data being monitored.
While watching data not shared by threads, the function also detects successful monitoring, even when the data is changed by anotherthread.
2.6.4.2.5 Backward trace
The backward trace function can be executed in one of two modes: in one mode the function traces back only the implicit thread, and inanother mode the function traces back all threads.
In multithread trace mode, the backward trace function traces threads in order of execution. The thread currently traced is automaticallydisplayed in the Source File window.
You can visually review the flow of control among the threads.
2.6.4.3 Functions to aid in debugging multithreadsThe following debug functions help to debug multithread programs efficiently:
- Enable/disable debugging event notifying
- Suspend/resume
2.6.4.3.1 Enable/disable debugging event notifying
Notification of debugging events, such as monitoring and breakpoint halts, can be enabled or disabled for each individual thread.
When debug event notification is disabled for a thread, the thread is run, but interruption events for debugging, such as monitoring andarrival at a breakpoint, will not be notified.
This function can be specified from the Thread List window.
2.6.4.3.2 Suspend/resume
The suspend/resume function limits the action of threads during program execution.
If a thread is suspended, it remains at the current position when the program is run. If a suspended thread is resumed, it comes into operationthe next time a program is run.
This function can be specified from the Thread List window.
2.6.4.4 Automating debug operations in a multithread environmentWith batch debugging and automatic debugging functions, the debugger can reproduce debugging procedures.
Though these functions can also be used for debugging multithread programs, certain points deserve special notice in reproducingdebugging procedures for multithread programs:
- 28 -

- Generate threads in the same order as that in which debugging procedures are recorded.
The debugger identifies each individual thread on the basis of the order in which it is generated in the process. This order is knownas a thread ID. Debugging procedures are performed on threads that are identified by their thread IDs. To reproduce a debuggingprocedure performed on a given thread, the order in which the thread is generated must be set to equal the order in which the debuggingprocedure is recorded. Threads might not be generated in order, according to the system and the server application. In that case, it isnot possible to automate debugging.
- Notify debugging events to only one thread during program execution.
When multiple threads are run concurrently, debugging events may be notified to different threads between the two instances ofrecording and reproduction, depending on how the OS allocates CPU time to the individual threads. Where a program is run withunconditional execution or breakpoint execution specified, having non-implicit threads to which debugging events may be notifiedor suspended can avert this problem.
2.6.5 Handling of Unicode by the DebuggerThis section explains how to debug programs compiled using Unicode.
2.6.5.1 Debug functions of Unicode programsThe debugger will automatically handle Unicode when debugging Unicode programs.
For Unicode programs, the debugger can basically use the same operations as those for non-Unicode programs.
2.6.5.2 Notes on handling UnicodeNote the following points when debugging Unicode programs:
Handling Unicode native characters
Unicode native characters are also displayed in the Data dialog box and Watch window. However, Unicode native characters cannotbe input. To input Unicode native characters, specify them using hexadecimal format.
Displaying and updating data values
Big-endian is used as the encoding form of data values for manipulating national data items and national edited data items usinghexadecimal format. For details of big-endian, refer to "Encoding Form" in the "NetCOBOL User's Guide".
Batch debugging, automatic debugging, and output log
ASCII is also used as the coding system of command files and history files for Unicode. As a result, Unicode native characters arereplaced with a "_" and output.
2.7 NotesThis section provides you some notes/suggestions you should take into account when using the interactive debugger.
- The target application should be a 32-bit application.
- When the debugger interrupts execution of a Windows application, it stops that application's processing. Therefore, it cannot refreshthe displays on its windows. If you want to inspect their current states, arrange your windows so the application windows are alwaysvisible.
- The Line Command window keeps up to about 5,000 lines of command results.
- You can specify statement identification numbers in two different ways: editor line numbers or relative line numbers. You can onlyuse both methods when debugging programs compiled with the NUMBER option. Programs compiled with NONUMBER can onlyuse relative line numbers. To change between using editor line numbers and relative line numbers, you can either use the ENV linecommand, or the Option, Environments, Input dialog box.
When a program which has duplicate numbers consecutively in the sequence number area is compiled with the NUMBER compileroption, you might not be able to set a breakpoint where you want, if you have specified the editor line number as a statementidentification number. To prevent this problem, select the relative line number as statement identification number, or recompile your
- 29 -

program with the compiler option NONUMBER specified to prepare for debugging. (Better yet, renumber the source code beforecompilation!)
Example
001000 IDENTIFICATION DIVISION.000200 PROGRAM-ID. MAIN. :001000 PROCEDURE DIVISION.001100 DISPLAY "*** INITIALIZE ***". [1]001100 MOVE ZERO TO DATA-1. [2]001100 MOVE ZERO TO DATA-1. [3] :003600 END PROGRAM MAIN.
In the above example, a breakpoint will be set on the DISPLAY statement ([1]) even if you try to set it at the MOVE statements ([2]and [3]).
- You can set breakpoints and passage counts at EXEC SQL in the PROCEDURE DIVISION.
However, you cannot set a breakpoint or a passage count at EXEC SQL including non-execution statements such as the WHENEVERstatement.
In addition, you cannot set breakpoints and passage counts directly in embedded SQL statements.
- When programs contain the clauses REPLACING, DISJOINING or JOINING, the debugger displays the original source withoutapplying these clauses. If the position of statements or procedure names changes as a result of the source substitutions, it is not possibleto debug the programs correctly.
- As the COPY statement creates program restrictions, you cannot debug programs correctly in the following cases. The way to avoidthis trouble is shown in each case.
- Programs including library text containing the following definitions in the COPY statement:
- Entire program definitions (from IDENTIFICATION DIVISION to END PROGRAM)
- Entire factory definitions (from IDENTIFICATION DIVISION to END FACTORY)
- Entire object definitions (from IDENTIFICATION DIVISION to END OBJECT)
- Entire method definitions (from IDENTIFICATION DIVISION to END METHOD)
The way to avoid this trouble is to define the statements described in the above library text directly in the program that importsthe library text.
- Describing the COPY statement in the PROCEDURE DIVISION, and the PERFORM statement is in the end line of the importedlibrary text:
The way to avoid this trouble is to define the CONTINUE statement at the end of the library text.
- Describing the COPY statement in the PROCEDURE DIVISION, and the COPY statement is in the end line, and the ENDPROGRAM statement has not been described:
The way to avoid this trouble is to define the END PROGRAM statement in the program in which the COPY statement has beendescribed.
- Describing the COPY statement in the PROCEDURE DIVISION, and the PERFORM statement is in the end line of the importedlibrary text, and the PERFORM statement is immediately after the COPY statement:
The way to avoid this trouble is to define the CONTINUE statement immediately after the library text and the COPY statement.
- Describing the COPY statement in the PROCEDURE DIVISION, and the COPY statement is immediately after the EXITstatement, EXIT PROGRAM statement, or EXIT METHOD statement, and the start line of the import library text contains thesection-name or paragraph-name:
The way to avoid this trouble is to describe the section-name or the paragraph-name in the program that imports the library text,not in the start line of the library text.
- 30 -

- A stored procedure cannot be debugged.
- Do not perform the following operations when the debugger is running:
- Change a screen setting on [Display Properties].
- Change a setting on the Control Panel.
- Terminate the Windows system.
- Pressing the F12 key in the application window during application execution will generate a signal and interrupt the execution,resumption of which will terminate the application.
- The debugger may access a resource such as a file or database while application execution is suspended in the system or COBOLruntime system. If the debugger under this situation is terminated or restarted, the resource may be destroyed. If the debugger isterminated or restarted during synchronous processing in the COBOL runtime system, a runtime message such as JMP0034I-U maybe output. If this occurs while a multithread application is being debugged, the probability increases as the number of threads increases.The application must be terminated normally. To ensure safety, a backup copy of the resources used for debugging should be madein advance.
- Threads other than the thread that executes the COBOL program might exist, depending on the system, the server application, etc.When such an application is debugged, it is necessary to treat it as a multithread application. For details, refer to "2.6.4 DebuggerCompatibility with Multithreading".
- The COBOL debugger cannot be used while an application is being debugged using the PowerCOBOL debugger or Visual C++debugger or is being executed on Systemwalker.
- The just-in-time debugging function will not operate if the application itself handles application errors by using an exception handlerfor structured exception handling. This applies to, for example, applications linked to non-COBOL programs that have an exceptionhandler and applications called from server programs such as a Web server that has an exception handler. To check for applicationerrors that occur in such applications, use the general debugger starting method or debugger starting method of the program to bedebugged.
- Corrective action you should take if "Execution was terminated before start of program was reached." is displayed is shown below.
- The program specified in the debugging start program ended without being executed. Alternatively, there is an error in the specifiedprogram name:
Make sure that the debugging start program name is correct.
- The program is not a debug target program:
Refer to "2.2 Preparing Programs for Debugging", and then create the program again.
- The debugging information file is not found:
The debugging information file is searched for in the folder storing the executable files and dynamic link libraries. If the file existsin a different folder, specify the debugging information file storage folder.
2.8 How to use the Interactive Remote DebuggerThis section explains the way to debug programs using the interactive remote debugger.
In this section, the following words are used:
- "IP address" means "IP address or host name" unless otherwise noted.
- "Windows" means "32-bit Windows" unless otherwise noted.
2.8.1 Overview of the remote debuggerThe remote debugger can debug programs that run on different computers on the network.
In this section, the two computers on the network are expressed as follows:
- Computers that run COBOL programs : server
- Computers that display the COBOL debugger window : client
- 31 -

The remote debugger supports Windows and Solaris as the server OS. If the server is Windows, use the Win32 remote debugger. If theserver is Solaris, use the Solaris remote debugger.
The functions of remote debuggers can vary depending on the server OS. In cases where remote debuggers must be distinguished fromone another, the remote debugger that is called is as follows:
- Solaris remote debugger if the server OS is Solaris
In the following explanation, it is assumed that the server is Windows.
If the server is Solaris, refer to the parts related to "NetCOBOL User's Guide for Solaris" where necessary.
Note
To use the remote debug function, there must be support for TCP/IP protocol in both the server and client.
2.8.1.1 Benefits of introducing the remote debuggerThe following cost reductions and improvements in development can be achieved by introducing the remote debugger.
- You can debug COBOL programs that run in server environments such as Interstage and Web servers from the client environmentthat you normally use.
In this way, cost reductions and improvements in development can be achieved without having to set up an expensive serverenvironment for each developer and having several developers having to debug at the same time.
- If the server is Solaris, you can now debug using the same operation as the Windows edition COBOL debugger.
There are two ways to use and debug programs that run on Solaris on the Windows client.
- Introduce the expensive Windows X windows server, and use screen mode for the svd command.
- Using a TTY terminal, use line mode for the svd command.
The remote debugger does not need the expensive X windows server, and shares the same operation as the Windows edition COBOLdebugger. For these reasons, it can be used to achieve cost reductions and improvements in development.
2.8.1.2 Storage location for resources when doing remote debuggingWhen you do remote debugging, you must store the resources that are required for debugging in either the server or the client, or both.
The resources that are required for debugging are shown in table below.
Table 2.3 Storage location for resources when doing remote debugging
Debug resource Client Server
Executable programs - Yes
Dynamic link library (*1) - Yes
Shared object file (*2) - Yes
Debugging information file - Yes
Source file Yes (*5) -
Library text Yes (*5) -
Screen form descriptor Yes (*5) Yes
File descriptor (*3) Yes (*5) Yes
Subschema descriptor (*4) Yes (*5) -
Command file Yes (*5) -
History file Yes (*5) -
*1: Server is Windows
- 32 -

*2: Server is Solaris
*3: Server is Windows or Solaris
*4: Server is Windows
*5: Character code of resources in the client is always ASCII
2.8.1.3 How to create the debug target program for remote debuggingFor details on how to create a program that can be debugged with a remote debugger, refer to the "NetCOBOL User's Guide" for theappropriate system on the server side.
2.8.2 Start procedure for remote debuggingAs for normal debugging, there are three methods used to start remote debugging.
- Remote debugging for general programs
Start the remote debugger, and specify the program you want to debug. Start the debug.
- Remote debugging for programs that run in server environments such as Interstage
Start the remote debug from program you want to debug. Since the COBOL program is called from the server product, you must usethis as the start method, as the programs cannot be debugged using the method for general programs.
- Remote debugging using the just-in-time debugging function
When an application error occurs or a runtime message occurs in the program, the remote debugger starts automatically and debugsthe program.
This start method can be used if the server is Windows.
2.8.2.1 How to start remote debugging for general programsThis starts the remote debugger and starts debug for the program you want to debug.
Before you can debug a general program, you must start the remote debugger connector in the server in advance.
To operate the server computer directly, log on to the server computer. To log on to a computer on the server side, use TELNET. If theserver OS is Windows, use the terminal service.
The procedure to start the remote debugger for debugging general programs is shown below:
1. Start the remote debugger connector in the server.
At this time, restrict the permission for connection to the computer where necessary. For details, refer to the "2.8.3.1 How to usethe server remote debugger connector", and "2.8.3.5 Restricting connection to computers that allow remote debugging".
When the remote debugger connector starts, information such as the IP address and port number are displayed, and the order fromthe client to start debugging is monitored.
2. Start the remote debugger in the client.
The methods that are generally used are as follows:
- Solaris remote debugger: In the Project Manager window, in the Project menu, select "Remote debug".
- Windows or Solaris remote debugger: In the Project Manager window, in the Tools menu, select "Debugger type" to select thedebugger. Next, start the debugger according to one of the following methods:
- In the Project Manager window, in the Tools menu, select "Debugger".
- In the command prompt, input the command format and then start the remote debugger. For details, refer to "2.8.5.2Specifying Options on the Command Line for the Remote Debugger".
- Solaris remote debugger: Select a COBOL project in the "Structure view" or "Dependency view" of NetCOBOL Studio. Select"Remote development" from the Project menu, and then select "Debugger".
- 33 -

3. Specify the required information in the Start Debugging dialog box.
After the remote debugger starts, the debugger main window opens.
If the Start Debugging dialog box does not appear when the debugger starts, select "Start Debugging" from the File menu of theremote debugger.
In the Start Debugging dialog box, make entries for the application, source file storage folder, server IP address, and other necessaryinformation for starting debugging, and then click the OK button. For details, refer to "2.8.5 Starting the Remote Debugger".
4. Use the remote debugger to debug.
The Start Debugging dialog box is closed, and debugging begins.
The operation method of the remote debugger is the same as that of the ordinary debugger.
For details, refer to "2.5.2.1 Using the Debugger".
While the server remote debugger connector is starting, you can debug as many times as you like simply by specifying the programto debug using the remote debugger.
5. Close the remote debugger.
To close the remote debugger, in the File menu, select Exit.
6. Close the server remote debugger connector.
To close the server remote debugger, hold down the Ctrl and C keys together.
2.8.2.2 How to start remote debugging for programs that run in server environmentssuch as Interstage
This is the way to start the remote debugger from the program you want to debug.
This start method is mainly used for remote debug for COBOL programs that run in a server environment such as Interstage and Webservers.
The start procedure is shown below:
1. Make the settings for remote debugging.
- Client settings
Start the remote debugger connector in the client.
The remote debugger connector starts with the same settings the previous time it was started, and resides in the task tray.
Where necessary, modify the port number, and restrict the permission to connect to the computer.
For details, refer to 2.8.3.4 How to use the client remote debugger connector", and "2.8.3.5 Restricting connection to computersthat allow remote debugging".
- Server settings
Specify the IP address and port number of the client computer that is displayed in the client remote debugger connector, Connectinformation page in the environment variable @CBR_ATTACH_TOOL. For details, refer to "@CBR_ATTACH_TOOL(Invoke debugger or COBOL Error Report from application)" in the "NetCOBOL User's Guide".
If several developers are to debug at the same time, you must specify a different IP address and port number for each developerin @CBR_ATTACH_TOOL.
You can specify a different IP address and port number for each developer in @CBR_ATTACH_TOOL in the following cases:
- Each developer has a special folder, and it contains the executable files or dynamic link library you want to debug and theruntime initialization file (COBOL85.CBR).
- You specify @CBR_ATTACH_TOOL in the runtime initialization file.
If you debug a dynamic link library that is called from a server product such as Interstage or a Web server, you must specifythat on runtime initialization file that has been stored in the same folder as the dynamic link library must be referred to. Fordetails, refer to "Using the runtime initialization file under DLL" in the "NetCOBOL User's Guide".
- 34 -

2. Execute the program you want to debug.
Execute the operation for running the COBOL program you want to debug, such as input from a Web server.
3. Start the remote debugger in the client.
After the remote debugger starts, the debugger main window opens in the client.
To start debugging, in the Start Debugging dialog box, enter the required information and then click OK. For details, refer to "2.8.5Starting the Remote Debugger".
If you specify the start parameter in the server environment variable @CBR_ATTACH_TOOL, the contents are displayed in theStart Debugging dialog box on startup. For this reason, you do not have to specify them each time.
4. Use the remote debugger to debug.
The remote debugger operation is the same as for the normal debugger.
For details, refer to "2.5.2.1 Using the Debugger".
While the client remote debugger connector is starting, you can execute a program to debug it as many times as you like.
5. Close the remote debugger.
To close the remote debugger, in the File menu, select Exit.
6. Close the client remote debugger connector.
Right-click the icon of the remote debugger connector that resides in the task tray, and in the menu that is displayed select Exit.
If the server is Solaris, the following points are different:
- Environment variable @CBR_ATTACH_TOOL
The name of this environment variable is CBR_ATTACH_TOOL. Note that the "@" mark is not part of the name.
In addition, if the specification "host/TEST" does not include the "host" part, the "TEST" part must also be omitted.
- Runtime initialization file (COBOL85.CBR)
The name of the runtime initialization file is COBOL.CBR.
- Referring to the runtime initialization file that is stored in the same folder as the shared object file.
Refer to the "NetCOBOL User's Guide for Solaris". The relevant section is "Using runtime initialization files in the library storagefolder".
2.8.2.3 How to start remote debugging using the just-in-time debugging functionThis automatically starts the remote debugger for debugging the program if an application error or runtime message occurs in the program.
You can only use this start method if the server is Windows.
This start method is the same as for "2.8.2.2 How to start remote debugging for programs that run in server environments such asInterstage" except for the environment variable @CBR_JUSTINTIME_DEBUG. For details, refer to "@CBR_JUSTINTIME_DEBUG(Specify inspection using the debugger or the COBO Error Report at abnormal termination)" in the "NetCOBOL User's Guide".
If an application error or a runtime message occurs when you execute the program, the remote debugger starts up and the remote debuggermain window opens. To start debugging, click OK in the Start Debugging dialog box. After debugging starts, the application error orruntime message is interrupted.
2.8.3 How to use the Remote Debugger ConnectorTo achieve remote debugging, you must use a program that monitors orders to start debugging from different computers on the network.
There are two types of remote debugger connectors in this program. These are shown below:
- Server remote debugger connector
This is a program that monitors orders to start debugging from a client that runs on the server.
For details, refer to "2.8.2.1 How to start remote debugging for general programs".
- 35 -

- Client remote debugger connector
This is a program that monitors orders to start debugging from a server that runs on the client.
For details, refer to "2.8.2.2 How to start remote debugging for programs that run in server environments such as Interstage", and"2.8.2.3 How to start remote debugging using the just-in-time debugging function".
In these programs, restrict the permission to connect to the computer where necessary. For details, refer to "2.8.3.5 Restricting connectionto computers that allow remote debugging".
2.8.3.1 How to use the server remote debugger connectorIf executing a remote debug with "2.8.2.1 How to start remote debugging for general programs", use the server remote debugger connector.
This program is run on the server.
2.8.3.2 How to start the remote debugger connector on the serverThe start format for the server remote debugger connector is shown below.
start format for the server remote debugger connector
- If the server is Windows
cobrds32 [port] [connect-restrictions]
- If the server is Solaris
svdrds [port] [connect-restrictions]
Port Format
-p port-number
- Specify the port number for monitoring using a number from 1024 to 65535.
- If -p is omitted, the standard port (59998) will be monitored.
Connect restriction format:
Table 2.4 Connect restriction contents
Format Contents
-h host_name Specify a host name or an IP address to allow connection.
-s connect_restriction_file_name Specify the connect restriction file.
-e The processing result of the contents of the specified connect restriction file aredisplayed.
- If -s and -h are both omitted, connection will be allowed from all computers.
- After the remote debugger connector is started, the IP address and port number are displayed, and orders from the client to startdebugging are monitored.
- To close the remote debugger connector, hold down the Ctrl and C keys together.
- 36 -

Information
- If you have to specify an environment variable for the program you want to debug, set this before you start the remote debuggerconnector.
- If you have to start each program that you want to debug in a different environment, you have to run the remote debugger connectorin each environment.
Like the environment variable, the environment here determines the operation when the remote debugger connector is started, and itssettings cannot be modified later.
- If you have to start each program that you want to debug in a different environment, or if several developers debug at the same time,specify-p when the remote debugger connector starts, and then use a different port.
Examples of starting the server remote debugger connector
- Several developers debug at the same time
cobrds32 -p 10001 -h client-1cobrds32 -p 10002 -h client-2cobrds32 -p 10003 -h client-3
This is the case when three developers use the remote debugger at the same time.
Choose the port number to be used by each developer and specify this using -p.
Specify -h to accept only the specific computer's request for remote debugging and to reject incorrect connections by other developers.
2.8.3.3 Format of the connect restriction fileSpecify the format of the connect restriction file as shown below:
format of the connect restriction file
[ ALLOW={ ALL | connection-target [connection-target...] } ][ DENY={ ALL | connection-target [connection-target...] }]
- This allows connection from the connection target specified in ALLOW. If this is omitted, it is assumed that ALL has been specified.
- This denies connection from the connection target specified in DENY. If this is omitted, it is assumed that ALL has been specified.
- If you specify ALL, connection is allowed or denied from all computers.
- If ALLOW and DENY are both specified, and ALLOW is described, ALLOW has priority.
- If this is register on several lines, write "\" at the end of the line.
Example
ALLOW=192.168.0.1 192.168.0.3 \192.168.0.8-192.168.0.10
The connection target format is shown below.
Table 2.5 Connection target format (IPv4)
Format Example Example of IP address application range
IP address 192.168.0.1 192.168.0.1
Range 192.168.0.1-192.168.0.10 192.168.0.1 to 192.168.0.10
Wildcard (*1) 192.168.0.* 192.168.0.0 to 192.168.0.255
- 37 -

Format Example Example of IP address application range
Host name (*2) Hostname 192.168.0.1
*1 : You can specify "*" instead of the decimal parts (8-bit) delimited by "."
*2 : This example assumes that a host name called "Hostname" has been assigned for an IP address of 192.168.0.1.
Table 2.6 Connection target format (IPv6)
Format Example Example of IP address application range
IP address fe80::1:23:456:789a fe80::1:23:456:789a
Range fe80::1:23:456:1-fe80::1:23:456:789a fe80::1:23:456:1 to fe80::1:23:456:789a
Wildcard (*3) fe80::1:23:*:789a fe80::1:23:0:789a to fe80::1:23:ffff:789a
Host name (*4) Hostname fe80::1:23:456:789a
*3 : You can specify "*" instead of the hexadecimal parts (16-bit) delimited by ":"
*4 : This example assumes that a host name called "Hostname" has been assigned for an IP address of fe80::1:23:456:789a.
For details about typical examples, refer to "2.8.3.5 Restricting connection to computers that allow remote debugging".
For details of IPv6, refer to " For IPv6 of debugging" in the "NetCOBOL User's Guide".
Note
If there is an error in the contents of the connect restriction file, the specified details will be invalid, and connection will be allowed fromall computers.
2.8.3.4 How to use the client remote debugger connectorIf executing a remote debug with "2.8.2.2 How to start remote debugging for programs that run in server environments such asInterstage", and "2.8.2.3 How to start remote debugging using the just-in-time debugging function", use the client remote debuggerconnector.
This program is run on the client.
2.8.3.4.1 How to start the remote debugger connector on the client
The start format for the client remote debugger connector is shown below:
- In the Project Manager window, Tools menu, select "Remote debugger connector".
After the remote debugger connector starts, the following icon is displayed in the task tray, and the settings are the same as those theprevious time the remote debugger connector was started. The order from the server to start debugging is monitored.
To modify the settings or check the settings contents, right-click the task tray icon and then select Environments from the displayed menu.To close the remote debugger connector, right-click the task tray icon, and then select Exit from the displayed menu.
Information
The remote debugger connector can also be started from NetCOBOL Studio. For details, refer to the "NetCOBOL Studio User's Guide".
2.8.3.4.2 The Remote Debugger Connector dialog box settings
This section explains how to make the Remote debugger connector settings.
- 38 -

Figure 2.16 Remote Debugger Connector Dialog Box
Using the Remote Debugger Connector dialog box, you can modify the settings for the remote debugger connector and check the settingscontents.
The information requested on each tab is as follows:
Table 2.7 Remote Debugger Connector Dialog Box Parameters
Parameter Description
Connect Information Network Condition: IP address of the machine or hostname where the remotedebugger connector is activating, and the port numbermonitored by the remote debugger connector are displayed.
When you select Change Port Number, Change Port Numberdialog box opens.
Connect Restriction Connect Allowed Target: Set the connect-allowed targets.
If you select Allow All the Connection, all computers areallowed to connect.
Allow Target displays the list of the connect-allowed targets.Using each button, Add, Edit and Remove, you can modify thelist of connect-allowed targets.
- 39 -

Parameter Description
Connect Denied Target: Set the connect-denied target.
If you select Deny All the Connection, all computers are deniedto connect.
Deny target displays the list of the connect-denied targets.
Using each button, Add, Edit and Remove, you can modify thelist of the connect-denied targets.
For details about typical examples, refer to "2.8.3.5 Restricting connection to computers that allow remote debugging".
2.8.3.5 Restricting connection to computers that allow remote debuggingThe way to restrict connections to computers that allow remote debugging is shown in table below. This table uses the IPv4 address. TheIPv6 address can also be used. Refer to "For IPv6 of debugging" in the "NetCOBOL User's Guide".
In this table, the server remote debugger connector is expressed by "server", and the client remote debugger connector is expressed by"client".
The connect restriction file is used in the server. For details, refer to "2.8.3.3 Format of the connect restriction file".
In the client, make the settings in the Connect Restriction page of the Remote Debugger Connector dialog box. For details, refer to "2.8.3.4.2The Remote Debugger Connector dialog box settings".
Table 2.8 Typical examples of restricting connection
Format Server Client
This allows connection for only aspecific target.
The IP address to be allowedconnection is as follows:
192.168.0.1
ALLOW=192.168.0.1
DENY=ALL
Setting for "Connect Allowed Target":
- Select "Allow Target".
- Set as follows in the edit box:
192.168.0.1
Setting for "Connect Denied Target":
- Select "Deny All the Connection".
This allows connection forseveral specific targets.
The IP addresses to be allowedconnection are as follows:
192.168.0.1
192.168.0.2
192.168.0.10
ALLOW=192.168.0.1 \
192.168.0.2 192.168.0.10
DENY=ALL
Setting for "Connect Allowed Target":
- Select "Allow Target".
- Set as follows in the edit box:
192.168.0.1
192.168.0.2
192.168.0.10
Setting for "Connect Denied Target":
- Select "Deny All the Connection".
This allows connection for aspecific range.
The range of IP addresses to beallowed connection is as follows:
Lower limit: 192.168.0.1
Upper limit: 192.168.0.10
ALLOW=192.168.0.1-192.168.0.10
DENY=ALL
Setting for "Connect Allowed Target":
- Select "Allow Target".
- Set as follows in the edit box:
192.168.0.1-192.168.0.10
Setting for "Connect Denied Target":
- Select "Deny All the Connection".
This allows connection in octetunits.
ALLOW=192.168.*
DENY=ALL
Setting for "Connect Allowed Target":
- Select "Allow Target".
- 40 -

Format Server Client
The range of IP addresses to beallowed connection is as follows:
Lower limit: 192.168.0.0
Upper limit: 192.168.0.255
- Set as follows in the edit box:
192.168.0.*
Setting for "Connect Denied Target":
- Select "Deny All the Connection".
This allows connection for allcomputers.
ALLOW=ALL
DENY=ALL
Setting for "Connect Allowed Target":
- Select "Allow All the Connection".
Setting for "Connect Denied Target":
- Select "Deny All the Connection".
2.8.4 Environment Variables of the Remote DebuggerThe environment variables that the Win32 remote debugger uses are the same as the environment variables that the normal Win32 debuggeruses. For details about environment variable settings, refer to "2.3 Environment Variables of the Debugger".
This section explains environment variables that the Solaris remote debugger uses.
Since environment variables are used for batch debugging, you do not have to specify an environment variable that the Solaris remotedebugger uses unless you are intending to do batch debugging. The same is true for normal debuggers.
For details about batch debugging, refer to "2.5.2.1.11 Automating Debug Operations".
2.8.4.1 @SVD_COMPATIBILITY(to specify compatibility)
@SVD_COMPATIBILITY={COBOL97 V61L10|NetCOBOL VersionLevel}
You can restrict the functions of the Solaris remote debugger with this variable.
By specifying this environment variable, the initial value for the compatibility of the Solaris remote debugger can be set in the valuespecified by the environment variable.
When the environment variable is not specified, the default conforms to the values that were set when the debugger last ended.
In the environment variable, specify the version level of the Solaris remote debugger when the command file was created.
COBOL97 V61L10:
If you specify COBOL97, the following behavior occurs:
This is similar behavior to the COBOL97 V61L10 svd command.
If you make a few changes to the history file created using this operating mode, you can use this as the command file of the svdcommand that runs on Solaris.
NetCOBOL VersionLevel:
If you specify NetCOBOL, the following behavior occurs:
This is the latest behavior.
V7.0L10 or later can be specified for VersionLevel.
For details, refer to Help of the Solaris remote debugger, about the Compatibility page of Environments dialog box.
Note
- Environment variable @SVD_COMPATIBILITY is not for making svd's original command file be available for batch debuggingusing the Solaris remote debugger. When you use svd's original command file for batch debugging, use the svd command on Solaris.
- If you do a lot of batch debugging using Solaris remote debugger, it might exert a heavy burden on the network. In this case, it isrecommended that you use the svd command on Solaris for batch debugging.
- 41 -

2.8.5 Starting the Remote DebuggerThis section explains how to start the remote debugger and provide the information required for debugging.
2.8.5.1 Specification for Remote Debugging using the Start Debugging dialog boxTo start remote debugging a program, select File, "Start Debugging". This brings up the Start Debugging dialog box.
Figure 2.17 The Start Debugging Dialog Box
The Start Debugging dialog box lets you input all the information the remote debugger requires to execute your program. You only needto enter the information that applies to your program.
For most items, this is the same as for the normal debugger. However, you must store the resources that are required for debugging in theserver or in the client properly.
For details about the storage location for resources that are required for remote debugging, refer to "2.8.1.2 Storage location for resourceswhen doing remote debugging".
The information requested on each tab is as follows:
Table 2.9 Start Debugging Dialog Box Parameters
Parameter Description
Application Application: Name of the EXE file to be loaded.
This is the only mandatory parameter.
When you use the Win32 remote debugger and omit the extension, itis assumed that the extension is EXE. When you use the Solaris remotedebugger and omit the extension, it is assumed that the file has noextension.
Execution-time-options: Any options expected on the command line of the program.
Start program: Name of the first program to be debugged (must be a programprepared for debugging).
Default: the first program for debugging executed in the EXE or aDLL called by it.
Source Source file storage folders: Folders containing the source of the programs to be debugged..
Copy library storage folders: Folders containing copy libraries used by the debug target programs.
- 42 -

Parameter Description
Default: If this parameter is omitted or cannot be found in the specifiedfolders, a search for the parameter will be made from the foldersspecified by environment variable COB_COBCOPY. For copylibrary files with IN/OF specified, a search for the parameter will bemade from the folders specified by the environment variableCOB_library-name.
Subschema descriptor filestorage folders:
For the Win32 remote debugger only.
Folders containing subschema used by the debug target programs.
Default: If this parameter is omitted or cannot be found in the specifiedfolders, a search for the parameter will be made from the foldersspecified by environment variable COB_AIMLIB.
Descriptor Screen and form descriptor: Folders and extension of form descriptors used by the debug targetprograms.
Default: If this parameter is omitted or cannot be found in the specifiedfolders, a search for the parameter will be made from the foldersspecified by environment variable FORMLIB. Extension PMD.
File descriptor: For Win32 and Solaris remote debuggers only.
Folders and extension of file descriptors used by the debug targetprograms.
Default: If this parameter is omitted or cannot be found in the specifiedfolders, a search for the parameter will be made from the foldersspecified by environment variable FILELIB. Extension FFD.
DebuggingInformation
Debugging information filestorage folders
Folders containing debugging information file. (.SVD files)
Default: If this parameter is omitted or cannot be found in the specifiedfolders, when using the Win32 remote debugger, a search for theparameter will be made from the folders containing executable file ordynamic link library. When using the Solaris remote debugger, asearch for the parameter will be made from the folders specified inServer Folder in Server Cooperation page.
BatchDebugging
Use Batch Debugging Batch Debugging is performed.
Command file File to drive the debugging session.
Default extension: LOG
History file File to save actions and results from the debugging session.
Default extension: LOG
ServerCooperation
Host Specify the port number and host of the server remote debuggerconnector in the connect destination
If you start as described in "2.8.2.2 How to start remote debuggingfor programs that run in server environments such as Interstage" or"2.8.2.3 How to start remote debugging using the just-in-timedebugging function", the server IP address is displayed automaticallyand this cannot be modified.
Server Folder Specify the current folder when the application is running.
If you start as described in "2.8.2.2 How to start remote debuggingfor programs that run in server environments such as Interstage" or"2.8.2.3 How to start remote debugging using the just-in-timedebugging function", the current when the application started isdisplayed automatically and this cannot be modified.
- 43 -

Parameter Description
Delete The currently displayed connect destination is deleted from Hostdrop-down combo box.
Details of the Start Debugging Dialog Box Options
Specifying Folder Name and File Name
When you specify a folder name or a file name, the syntax of the name depends on the conventions of the server or the client uponwhich it resides.
For Application, folders or files included in Execution-time-options, Debugging information file, storage folders and Server Folder,specify them according to the conventions of the server.
If you specify the relative path in the Application page, Application, Execution-time options, or Debugging Information page,Debugging information file storage folders, this is handled as the relative path from the server folder specified here.
For Source file storage folders, Copy library storage folders, Subschema descriptor file storage folders, Screen and form descriptor,File descriptor, Command file and History file, specify them according to the conventions of the client.
Multiple folder names
For fields that accept multiple folders, separate the folder names by semicolons ";". The debugger searches for files in order of thespecified folders.
How to specify Host
Specify host in the following format:
The IP address is IPv4 format or IPv6 format.
The port number must be from 1024 to 65535. If you omit the port number, it will default to 59998.
The IPv6 format can specify the scope address. The scope address specifies the scope identifier after the address.
When you set the IPv6 address to the port number, you must enclose the address with [ ].
For details of IPv6, refer to "For IPv6 of debugging" in the "NetCOBOL User's Guide".
Example
[IPv4 address(192.168.0.1) and port number(2000)] 192.168.0.1:2000[IPv6 address(fe80::1:23:456:789a) and port number(2000)] [fe80::1:23:456:789a]:2000[IPv6 address (fe80::1:23:456:789a) and scope identifier (%eth0)] fe80::1:23:456:789a%eth0[IPv6 address (fe80::1:23:456:789a), scope identifier (%5) and port number (2000)] [fe80::1:23:456:789a%5]:2000[Host name(server-1) and port number(2000)] server-1:2000[Port number omitted(IPv4)] 192.168.0.1[Port number omitted(IPv6)] fe80::1:23:456:789a
- 44 -

2.8.5.2 Specifying Options on the Command Line for the Remote DebuggerThis section explains the way to start the remote debugger using command format.
Since you must start the remote debugger using the winsvd command, in the Project Manager window, Tools menu, select Debugger type,and then Win32 remote or Solaris remote.
For most items, this is the same as for the normal debugger. However, you must store the resources that are required for debugging in theserver or in the client as appropriate.
For details about the storage location for resources that are required for remote debugging, refer to "2.8.1.2 Storage location for resourceswhen doing remote debugging".
You can also specify a start parameter for the host.
To start the remote debugger from the command line, use the WINSVD command with the following format:
winsvd [start-parameter] [application-name] [execution-time-option]
You must specify the parameters in the order shown above.
If you only enter "winsvd", you need to provide the application information in the Start Debugging dialog box.
You must specify application-name if you want to enter any other information after "winsvd".
When you start the remote debugger with information on the command line, it comes up with the Start Debugging dialog box opened andthe command line information entered in the appropriate fields.
To start remote debugging, enter any further information in the Start Debugging dialog box, and click the OK button.
See the list below for the supported start parameters.
Table 2.10 Start-Parameters
Specification Format Field in Start Debugging dialog box
-U host Specify the host for remote debugging.
The format of the specification is same as that described in "How tospecify Host" in "2.8.5.1 Specification for Remote Debugging using theStart Debugging dialog box", except for the case of omission. Whenthis is omitted, it is assumed that the port number that was available atthe last connection is specified. For the first connection, it will be 59998.
You cannot specify this parameter in the @CBR_ATTACH_TOOL or@CBR_JUSTINTIME_DEBUG environment variable.
-G start- program-name Start program
-S source-file-storage-folder-name Source file storage folders
-C copy-library-storage- folder -name Copy library storage folders
-A subschema- descriptor-file-storage- folder -name (Note)
Subschema descriptor file storage folders.
For the Win32 remote debugger only.
-M screen-and form-descriptors-storage- folder-name
Screen and form descriptor folders
-E screen-and form-descriptors-extension Screen and form descriptor extension
-H file-descriptors-storage- folder -name File descriptor folders.
-O file-descriptors-extension File descriptor extension.
-D debugging-information- file-storage- folder -name
Debugging information file storage folders
-B command-file-name Command file
-L history- file-name History file
-N Starts debugging without opening the Start Debugging dialog box.
- 45 -

In the case of the Win32 remote debugger, the start character of the start parameter is handled the same whether it is a slash (/) or a hyphen(-). In the case of the Solaris remote debugger, you can only use a hyphen (-) as the start character. Additionally, the parameter name thatcontinues after the start character can be handled if it contains upper-case letters and lower-case letters. If you have specified several startparameters, leave at least one space between each.
Example
- To enter a command with the following parameters and options for Win32 remote debugger:
- Server: server-1
- Application name: E:\EXE\SAMPLE1.EXE
- Execution-time option: PARAM1
- Source file storage folder name: D:\SOURCE
- Debugging information file storage folder name: E:\SVD
The command line would be:
winsvd /U server-1 /S d:\source /D e:\svd e:\exe\sample1.exe param1
- To enter a command with the following parameters and options for Solaris remote debugger:
- Server: server-1
- Application name: /home/usr1/sample1
- Execution-time option: PARAM1
- Source file storage folder name: D:\SOURCE
- Debugging information file storage folder name: /home/usr1/svd
The command line would be:
winsvd -U server-1 -S d:\source -D /home/usr1/svd /home/usr1/sample1 param1
Note
- Specify the folder name or file name in the execution-time option according to the server folder conventions.
- Note the following points in the case of a Solaris remote debugger:
- You cannot use a slash (/) in the start character of the start parameter.
- Since the server file name and folder name are case sensitive, take care when you specify upper-case letters and lower-case letters.
- The start parameters that you can specify are different from those of the svd command.
2.8.6 Using the Remote DebuggerAfter you have started the debugger, the operation is generally the same as for a normal debugger. For details, refer to "2.5.2.1 Using theDebugger".
In the case of a Solaris remote debugger, there are some differences. For details, refer to Help.
2.8.7 Notes about the Remote DebuggerThis section explains points to note when using the remote debugger.
To use the remote debug function, there must be support for TCP/IP protocol in both the server and client.
- 46 -

2.8.7.1 Notes about the Win32 Remote DebuggerThis section explains points to note when using the Win32 remote debugger.
For details about common points with the normal debugger, refer to "2.8.7.2.2 Notes on handling Unicode", and "2.7 Notes".
- Note the storage location for the resources that are required for debugging. For details, refer to "2.8.1.2 Storage location for resourceswhen doing remote debugging".
- Specify the application name and debugging information file storage folder according to the server folder conventions.
- Specify the folder name and file name in the execution-time options according to the server folder conventions.
2.8.7.2 Notes about the Solaris Remote DebuggerThis section explains points to note when using the Solaris remote debugger.
2.8.7.2.1 Deciding the Character Code at execution-time
The Solaris remote debugger decides the character code at execution- time using one of the following methods:
- When starting remote debugging for general programs:
The operation is the same as for the character code for starting server remote debugger connector.
- When starting remote debugging for programs that run in server environments such as Interstage:
The operation is the same as for the character code that runs on servers such as Interstage and Web servers.
2.8.7.2.2 Notes on handling Unicode
In the Solaris remote debugger, note the following points when debugging Unicode programs:
Handling Unicode native characters
Unicode native characters are also displayed in the Data dialog box and Watch window. However, Unicode native characters cannot beinput. To input Unicode native characters, specify them using hexadecimal format.
Batch debugging, automatic debugging, and output log
ASCII is also used as the coding system of command files and history files for Unicode. As a result, Unicode native characters are replacedwith a "_" and output.
2.8.7.2.3 Other Notes
For details about points in common with the normal debugger, refer to the "NetCOBOL User's Guide for Solaris".
- Note the storage location for the resources that are required for debugging. For details, refer to "2.8.1.2 Storage location for resourceswhen doing remote debugging".
- Specify the application name and debugging information file storage folder according to the server folder conventions.
- Specify the folder name and file name in the execution-time options according to the server folder conventions.
- Since the server file name and folder name are case sensitive, take care when you specify upper-case letters and lower-case letters.
- If you omit the application name extension, an EXE extension will not be provided for the name. Solaris assumes no extension.
- 47 -

Chapter 3 Debugging Mixed COBOL and PowerCOBOLThis chapter covers the details of debugging applications that contain mixtures of COBOL and PowerCOBOL code. Details covered are:
- How to prepare programs for debugging
- How to start the debugging process
- What to look out for when debugging
3.1 OverviewYou can use the COBOL Debugger to debug applications that contain a mix of COBOL and PowerCOBOL code. This chapter explainshow to use the COBOL debugger to debug such applications and covers some common situations you may encounter.
You prepare PowerCOBOL and COBOL code for debugging as if you were working solely with one type of code. You bring up the mainprogram under the COBOL debugger and debugging proceeds as normal.
There is one difference in that the COBOL Debugger shows you the full, expanded, PowerCOBOL code. The debugger displays the mainevent loop, which PowerCOBOL usually hides, and some statements that you code within PowerCOBOL are expanded into MOVEs andCALLs to subroutines. Once you understand this additional code, you are essentially debugging a COBOL application.
Note
When the main program is a PowerCOBOL sheet, you can use the PowerCOBOL Debug function to debug the PowerCOBOL code. Thishas the advantage that you do not see the expanded PowerCOBOL code, but the disadvantage that you cannot view and debug the COBOLcode. Check the PowerCOBOL documentation for information about the PowerCOBOL Debug function.
3.2 Preparing Programs for Mixed COBOL DebuggingYou code, compile and link both COBOL and PowerCOBOL programs as if you were working with only one type of COBOL.
3.2.1 Building COBOL Programs for DebuggingTo prepare COBOL programs for debugging, compile them with the TEST directive and link them with the /DEBUG option. ProjectManager includes the linker options automatically for you when you specify the TEST compiler directive.
3.2.2 Building PowerCOBOL Programs for DebuggingPowerCOBOL programs to be debugged must have the "Build program for debug" option checked in the Compile Options dialog box.Checking this option also ensures that the programs are linked in the appropriate manner.
3.2.3 COBOL Runtime OptionsNetCOBOL tailors its behavior at runtime by checking the settings of a number of environment variables and runtime options. You canset these variables in a variety of ways, documented in the "NetCOBOL User's Guide".
Before starting to debug, it is a good idea to specify all the environment variables you require in the initialization file (COBOL85.CBR).To do this, either edit the file, or use the Runtime Environment Setup Tool. Settings to consider include:
- File allocation mappings.
- COBOL sub-program name to DLL file name mappings.
- Other environment settings specific to your application requirements.
- 48 -
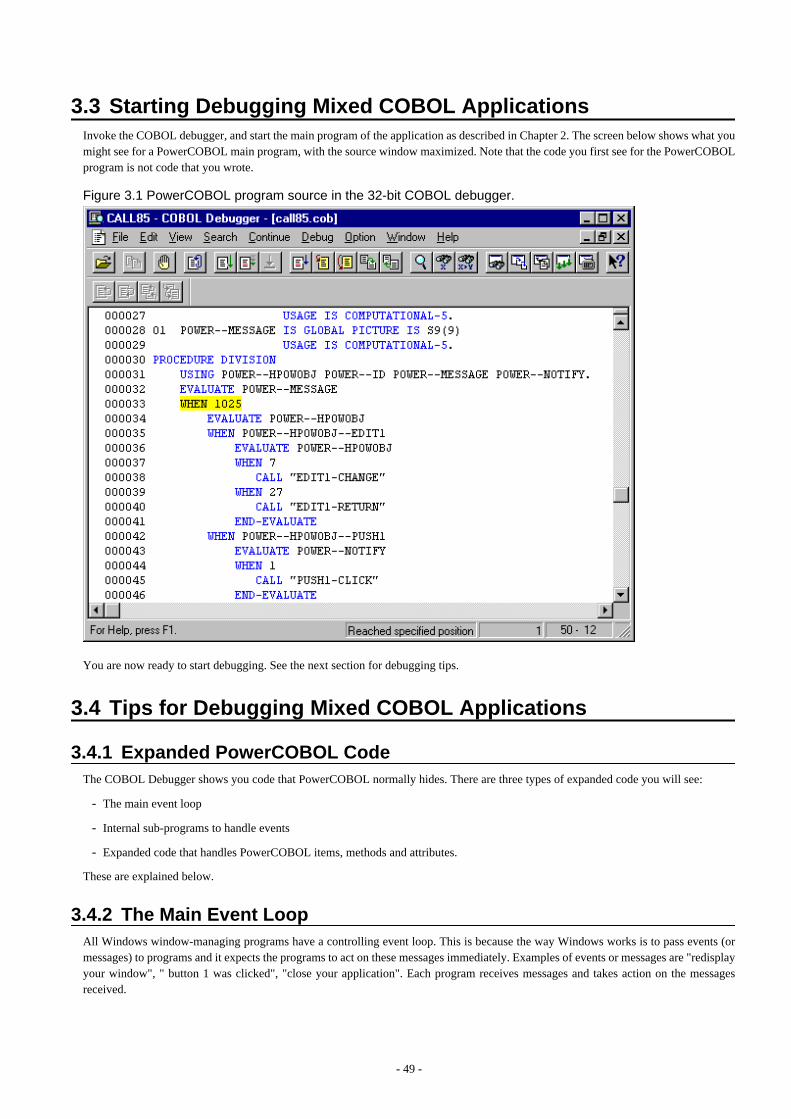
3.3 Starting Debugging Mixed COBOL ApplicationsInvoke the COBOL debugger, and start the main program of the application as described in Chapter 2. The screen below shows what youmight see for a PowerCOBOL main program, with the source window maximized. Note that the code you first see for the PowerCOBOLprogram is not code that you wrote.
Figure 3.1 PowerCOBOL program source in the 32-bit COBOL debugger.
You are now ready to start debugging. See the next section for debugging tips.
3.4 Tips for Debugging Mixed COBOL Applications
3.4.1 Expanded PowerCOBOL CodeThe COBOL Debugger shows you code that PowerCOBOL normally hides. There are three types of expanded code you will see:
- The main event loop
- Internal sub-programs to handle events
- Expanded code that handles PowerCOBOL items, methods and attributes.
These are explained below.
3.4.2 The Main Event LoopAll Windows window-managing programs have a controlling event loop. This is because the way Windows works is to pass events (ormessages) to programs and it expects the programs to act on these messages immediately. Examples of events or messages are "redisplayyour window", " button 1 was clicked", "close your application". Each program receives messages and takes action on the messagesreceived.
- 49 -

A PowerCOBOL sheet receives the messages in its main procedure and determines the type of message in the "EVALUATE POWER—MESSAGE" statement. The main procedure then calls internal sub-programs to handle the events.
When debugging within PowerCOBOL you do not see the main event loop, as PowerCOBOL only shows the code that you wrote.
3.4.3 Internal Sub-Programs to Handle EventsPowerCOBOL creates internal sub-programs around code that you write to handle events. This is not visible to you within PowerCOBOL.However, when using the COBOL Debugger, you see all the code for these internal programs. Internal programs start with the code:
IDENTIFICATION DIVISIONPROGRAM-ID. "PROGRAM-NAME".
and end with the code:
END PROGRAM "PROGRAM-NAME".
"PROGRAM-NAME" usually has the structure:
item-event
e.g. "EDIT1-CHANGE", "EDIT1-RETURN", "PUSH1-CLICK".
The COBOL Debugger displays all the internal subprograms in a single source file. Thus the COBOL Debugger lets you browse, searchand set breakpoints in the entire PowerCOBOL source code for your sheet.
3.4.4 Expanded Code for Items, Methods and AttributesThe COBOL Debugger displays expanded and changed versions of statements that contain references to items, methods and attributes.
For example:
The PowerCOBOL method call:
CALL CLOSESHEET OF CALL85.
appears as:
CALL "XPOWCSCLOSEMYSELF" USING BY VALUE CALL85.
in the COBOL Debugger.
The PowerCOBOL statement referencing an attribute of an item:
MOVE POW-TEXT OF EDIT1 TO ID-INPUT
appears as:
CALL "XPOWEDITGETTEXT" USING BY VALUE EDIT1 BY REFERENCE POW-0001MOVE POW-0001 TO ID-INPUT
in the COBOL Debugger.
You handle the expanded statements like any other COBOL statements. You set breakpoints, and view and change data values as if thestatements were your own.
Apparently Inactive Code
Debugging any event-based graphical system can appear strange at first if you normally work with procedural code. The debugger canbecome unresponsive and the application window at times does not refresh itself as you might expect. You find yourself clicking onwindows, wondering why nothing is happening.
There are two basic reasons for this behavior:
- There are times when the debugger is waiting for an event to come from the application window. At these times only the "Break"button is enabled on the debugger toolbar.
- 50 -

- The debugger has stopped the running application (e.g., when a breakpoint has been encountered). There is nothing active to receiveand process events from the application window. So clicking on the application window has no apparent effect.
Once you understand why the behavior exists, it is reasonably easy to cope with it.
If the debugger is not responding, look at its toolbar. If only the "Break" button is enabled the debugger is waiting for an event in theapplication window. You can either switch to the application window and take an appropriate action, or click the "Break" button that mayabort the application.
If the user window is not responding, switch to the debugger. The debugger has halted execution for one reason or another. Check thereason, check your breakpoints and restart the execution using one of the Continue menu functions.
Sometimes you want to see the application window at the same time as viewing the code. You do this by sizing and positioning theapplication and debug windows appropriately.
Using Run to Next Program
Because you are debugging at least two programs (PowerCOBOL and COBOL), and often have many PowerCOBOL generated internalsub-programs, you may choose to use the Run to Next Program function. If you are at the top of the event loop on the EVALUATEPOWER--MESSAGE statement, it may appear that nothing is happening. Every time you click on "Run to Next Program" you come backto the same point.
This happens because the PowerCOBOL sheet is receiving several messages from the Windows system. The event loop processes eachmessage. The COBOL Debugger sees the event loop relinquishing control through the EXIT PROGRAM statement and then regainingcontrol when the next message arrives. It therefore appears to the COBOL Debugger that a new program is being executed.
To get to the sub-program of interest you may need to click on "Run to Next Program" several times.
Keeping or Regaining Control
As with any debugging operation, the best way of keeping control is setting breakpoints at appropriate locations in the code.
If the code appears to be running and not hitting the breakpoints you have set, you can use the "Break" function. However, this can causethe application to abort so you have to restart the application.
SVD File Does Not Match Program to be Debugged
If you are experimenting with ways of building the mixed application code together you may encounter a message from the COBOLDebugger that says:
"Debugging information file FILENAME.svd does not match the program to be debugged. The debugging information is ignored."
This can happen when you compile the COBOL code in Project Manager and the rest of the system in PowerCOBOL (or vice versa). Tocorrect this you may need to Build within PowerCOBOL or Rebuild within Project Manager. Rebuild in Project Manager forces arecompilation whereas Build does not.
Another possibility is that somehow one of the systems has lost the compiler "TEST" directive or Compile for Debug option.
- 51 -

Chapter 4 Debugging Visual Basic calling COBOLThis chapter covers the details of debugging Visual Basic applications calling COBOL. Details covered are:
- How to prepare programs for debugging
- How to start the dual debugging process
- How to stop the dual debugging process
- Do's, and Don'ts
4.1 OverviewNetCOBOL programs are designed to work well with Visual Basic. The main consideration in debugging these mixed language applicationsis in bringing up the two debugging environments. The COBOL subprograms are prepared exactly as if they were to be called from otherCOBOL programs.
Because the Visual Basic program will be calling COBOL, Visual Basic is brought up under the COBOL debugger. This ensures that callsfrom Visual Basic to COBOL can be intercepted by the COBOL debugger and the appropriate actions taken to let you see your COBOLsource code.
When you are debugging mixed Visual Basic and COBOL applications you have two complex environments active. To ensure that theyinteract correctly it is important you follow the start-up and close-down steps documented in this chapter.
4.2 Preparing Programs for Debugging with Visual BasicCOBOL programs that are called from Visual Basic are prepared in exactly the same way as COBOL programs that are called from otherCOBOL programs. The only special consideration in writing the programs is to ensure that data passed through the Linkage Section mustbe compatible with Visual Basic data types.
Similarly preparing COBOL programs for debugging requires the same steps as if they were to be debugged in a totally COBOLenvironment.
4.2.1 Compiling for DebuggingPrograms to be debugged must be compiled with the TEST directive.
4.2.2 Linking for DebuggingPrograms to be debugged must be linked with the linker options:
/DEBUG
4.2.3 Making Files Accessible to Visual BasicWhen the Visual Basic program makes a call to COBOL it has to be able to find the COBOL code and supporting library routines. At thetime the call is made the system's current folder is determined by Visual Basic and is most likely the folder containing the Visual Basicstart-up module.
There are therefore three options for ensuring the COBOL programs and supporting files can be found when Visual Basic makes its call:
- Put the COBOL files in a folder on the PATH. To update the path, change the PATH statement in the AUTOEXEC.BAT file.
- Make the code in the Visual Basic program specify a full path for the COBOL subprogram.
- Put the COBOL files in the folder that will be the current folder at the time the call is made. (Not recommended as you will have amix of COBOL application and Visual Basic system files.)
- 52 -

4.2.4 COBOL Runtime OptionsNetCOBOL tailors its behavior at runtime by checking the settings of a number of environment variables and runtime options. Thesevariables can be set in a variety of ways, documented in the "NetCOBOL User's Guide".
Before starting to debug make sure that you have specified all the environment variables you require. These settings should be placed inthe initialization file (COBOL85.CBR) either by editing, or by using the Runtime Environment Setup Tool.
Settings to consider include:
- File allocation mappings.
- COBOL sub-program name to DLL file name mappings.
- Other environment settings specific to your application requirements.
4.3 Starting Debugging with COBOL and Visual BasicTo debug applications in which Visual Basic programs call COBOL programs, the COBOL debugger is started first. You tell the debuggerwhere the COBOL source and debugging information is stored then, instead of loading a COBOL program into the debugger, you specifyVisual Basic as the application. Within Visual Basic you execute or debug the VB programs as normal and when Calls to COBOL areexecuted the COBOL debugger gains control so that you can debug the COBOL programs. This process is detailed in the followinginstructions.
Once you have the COBOL programs compiled, linked and stored in a suitable folder, start the COBOL debugger. It can be started fromwithin Programming Staff or from the Windows desktop.
1. The debugger displays a blank debug window.
Figure 4.1 COBOL Debugger Main Window
- 53 -

2. Select File, Start Debugging from the menu. The Start Debugging dialog box is displayed.
Figure 4.2 The Start Debugging Menu
3. Enter, or browse for, the location of the Visual Basic program.
Figure 4.3 Application Field Filled In
- 54 -

4. Enter the name of the Visual Basic program you wish to start in the Execution-time-option edit box. Alternatively, you can leavethis field blank and load the program after Visual Basic starts.
Figure 4.4 CallCOB.frm as Execution-time option
5. Click on the Source tab. Enter, or browse for, the name of the folder containing your COBOL source. If your programs use sourcelibraries and subschemas, also enter these folder names.
Figure 4.5 Filling in Source File Storage Folders
- 55 -
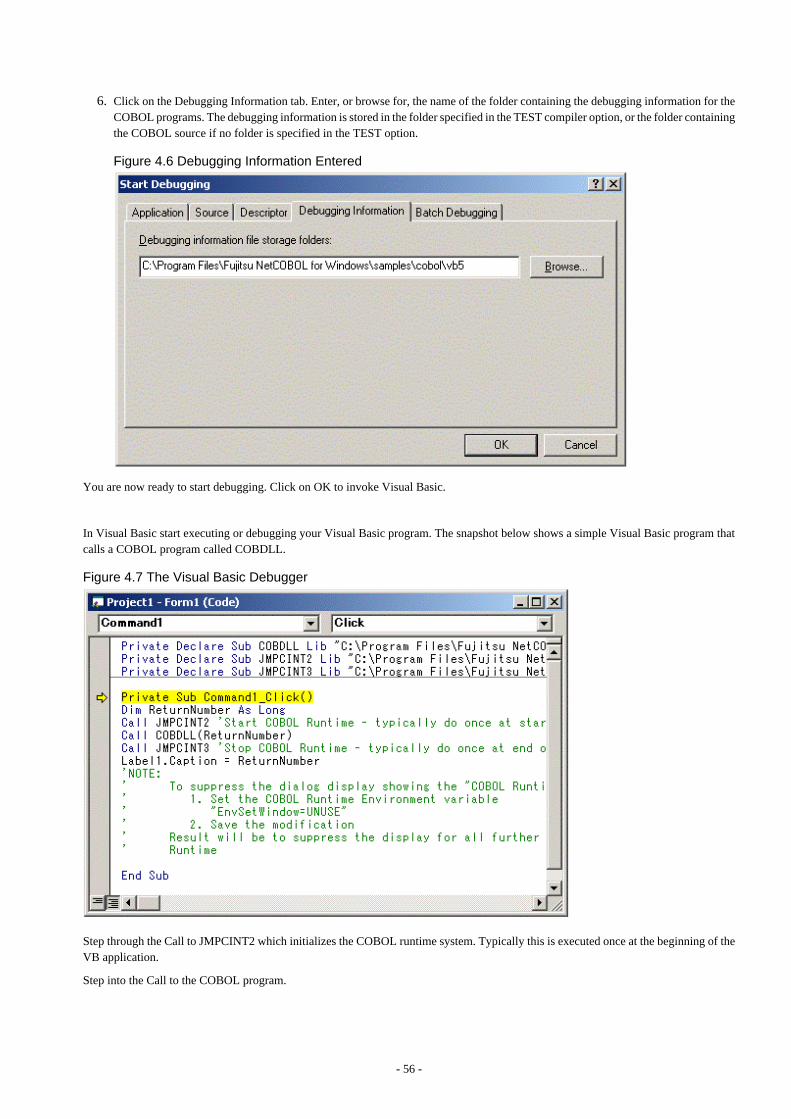
6. Click on the Debugging Information tab. Enter, or browse for, the name of the folder containing the debugging information for theCOBOL programs. The debugging information is stored in the folder specified in the TEST compiler option, or the folder containingthe COBOL source if no folder is specified in the TEST option.
Figure 4.6 Debugging Information Entered
You are now ready to start debugging. Click on OK to invoke Visual Basic.
In Visual Basic start executing or debugging your Visual Basic program. The snapshot below shows a simple Visual Basic program thatcalls a COBOL program called COBDLL.
Figure 4.7 The Visual Basic Debugger
Step through the Call to JMPCINT2 which initializes the COBOL runtime system. Typically this is executed once at the beginning of theVB application.
Step into the Call to the COBOL program.
- 56 -

On the first Call, it will appear that nothing is happening. You need to switch to the COBOL debugger window (this is titled "VB6 -COBOL Debugger"). On subsequent Calls to COBOL the COBOL debugger window is displayed automatically.
The Called source is displayed.
Figure 4.8 The COBOL Debugger
Note
Sometimes a tool tip from the Visual Basic debug toolbar may remain visible on top of the COBOL debugger window. It does not affectthe execution of the COBOL code or debugger.
Debug the COBOL code as normal.
Note
a) The accelerator key for Step Into is F8 in both Visual Basic and the COBOL debugger.
b) Remember to set breakpoints in the COBOL program before a Go or Run command, as you may not be able to regain control in theCOBOL source.
When you execute an EXIT PROGRAM statement in the top level COBOL program, control is returned to Visual Basic.
Continue debugging in Visual Basic and COBOL until you are ready to stop. Be sure to follow the instructions in the section "StoppingDebugging with COBOL and Visual Basic" when stopping debugging.
4.4 Stopping Debugging with COBOL and Visual BasicIt is important that the Visual Basic and COBOL debugging environments are closed down in the correct order. Failure to do so can resultin one or both systems hanging.
Close down the debugging in the following order:
- 57 -

1. If you are not already there, return to the Visual Basic environment by executing an EXIT PROGRAM statement in the COBOLprogram.
2. Step through or execute a Call to JMPCINT3. This tells the COBOL runtime to tidy up and close down.
3. Stop debugging or executing in Visual Basic.
4. Close Visual Basic.
5. Either Close the COBOL debugger or start another debug session.
To start another debug session use one of the following:
- Select Continue, Re-debug.
- Select File, Start Debugging
- Select File, and a previously debugged program.
4.5 Do's and Don'ts in the Dual Debugging Environment
Do specify Application, Source and Debugging Information directories.
Control may be transferred from one debugging system to the other at points where the current folder has changed. To be sure the COBOLsystem can find the files it requires these directories must be entered in the Start Debugging dialog box.
Do set breakpoints in code before running.
You may find it difficult to break into the COBOL or Visual Basic code if you run the code without first setting breakpoints at suitablepoints.
Do close down in the proper order.
Failure to close down in the proper order can cause either or both debugging systems to hang.
Do NOT close down in an improper order!
Failure to close down in the proper order can cause either or both debugging systems to hang.
- 58 -

Chapter 5 NetCOBOL Debugging FunctionsNetCOBOL debugging functions and a COBOL debugger are provided to help debug programs created with this product. This chapterprovides instructions on using the NetCOBOL debugging functions.
For information on using the COBOL debugger, refer to "Chapter 2 Debugging in Windows System".
Outline of the debugging functions:
- Using the TRACE Function
- Using the CHECK Function
- Using the COUNT Function
- Using the Memory Check Function
- Using the COBOL Error Report
- Debugging using Compiler Listings
5.1 Outline of the Debugging FunctionsSix types of debugging functions are available for COBOL:
- Checking the referencing of an incorrect area, data exceptions, and parameters (CHECK function)
- Tracing executed COBOL statements (TRACE function)
- Reporting the execution count for each statement sequentially, as well as by verb, along with percentage of these counts (COUNTfunction).
- Checking the runtime system area (Memory Check function)
- Generating diagnostic reports and dump on application errors and runtime messages (COBOL Error Report).
- Using the object program listing to identify the statement that terminated abnormally (debugging using an object program listing)
To use the debugging function, specify the compiler option for each desired debugging function at the compilation of the COBOL program,and specify the environment to operate the debugging function at the execution of the program.
Table 5.1 Outline of the debugging functions and compiler options
Function Name Outline Compiler Option
CHECK function The following items are checked.
- Whether the subscript or the index addresses an area outside of the range of a tablewhen that table is referenced
- Whether the reference modified exceeds the data length at reference modification
- Whether the contents of the object word are correct when the data containing theOCCURS DEPENDING ON clause is referenced
- Whether the numeric item contains a value of the type that is specified by theattribute.
- Whether the divisor in division is not zero.
- Whether, in an invoked method, the number of parameters and attributes for acalling method match those for a called method.
- Whether, in an invoked program, the calling conventions of a calling programmatch those of a called program.
- Whether, the number of parameters and length of the CALL statements match thoseof a called program.
Purpose
CHECK
- 59 -

Function Name Outline Compiler Option
- To prevent an operation error of the program due to a memory reference error
- To prevent erroneous numbers from causing a program to behave unexpectedly
- To prevent invalid parameters from causing a program to behave unexpectedly
- To prevent different calling conventions from causing a program to behaveunexpectedly.
TRACE function The following types of information are output:
- Tracing result of executed statements
- Line number and verb number of the statement that was executed at abnormaltermination
- Program name that contains the statements that were executed and programattribute information
- Message output during execution
Purpose
- To ascertain at which statement abnormal termination occurred
- To ascertain the path of the statements that were executed up to abnormaltermination
- To check the message output during execution
TRACE
COUNT function This function reports:
- The execution count for each statement in your program, sequentially, along withthe percentage of this execution count vs. the total execution count for all thestatements.
- The execution count by verb that appears in your program, along with thepercentage of this count vs. the total execution count for all the statements.
Purpose
- To identify all the routes the program have followed during execution
- To improve the efficiency of your program
COUNT
Memory checkfunction
The following items are checked.
- The runtime system area is checked when the program and method proceduredivisions start and end. If the area has been destroyed, the following informationis output.
- Name of the program or method for which area destruction was detected
- Location where destruction was detected (procedure division start or end)
- Addresses of the destroyed area
Purpose
- To identify the program that destroyed the runtime system area. If the COBOLError Report is also used, the destroyed locations can also be identified.
-
COBOL ErrorReport
This function reports the following information:
- Error type (Exception code or runtime message)
- Problem location (Module name, program name, source file name, line number)
- Calling path
- System information
TEST
- 60 -

Function Name Outline Compiler Option
- Environment variable
- Runtime environment information
- Process list
- Module list
- Thread information
Moreover, the dump is output.
Purpose
- To identify which error has occurred and in which statement
- To identify the calling path for the programs run until errors occurred
- To identify the status of applications or the computer in effect when errors occurred
Debugging usingCompilerListings
The following information is output for each object program.
- Object relative offset
- Object code in machine language
- Procedure name and procedure number
- Assembler instruction
- Verb name and line number
- Area name
- Defined word written in the COBOL program
Purpose
- To identify the statement that caused the program to terminate abnormally
LIST
SOURCE
COPY
MAP
Note
You cannot use the TRACE and COUNT functions at the same time.
5.1.1 Statement NumberA statement number described in the subsequent explanation indicates the following expression:
line-number[. verb-sequence-number-in-line-number]
Refer to "SOURCE(Whether a source program listing should be output)" in the "NetCOBOL User's Guide".
line-number
When compiler option NUMBER is selected, the format is "[COPY-qualification-value-]user-line-number" and whenNONUMBER is selected, the format is "[COPY-qualification-value-]sequence-number-in-file."
The sequence number in the file is the value assigned in ascending order by the compiler, starting from "1" as the first line in the fileand incrementing by 1 for each line.
verb-sequence-number-in-line-number
These are sequence numbers used to make each statement unique when multiple statements are entered at the same line number.Numbers are allocated in ascending order starting from 1 for the first statement and, 2, 3 ... subsequently.
- 61 -

5.2 Using the CHECK FunctionThe CHECK function checks the following items. If the function detects an abnormality, it writes a message and terminates abnormally.Therefore, program operation errors can be prevented.
- Subscripts, indexes and reference modification outside their range
- Numeric data exceptions and zero divisor check
- Parameters for calling a method
- Program calling conventions
- Internal program call parameters
- External program call parameters
This section describes how to use the CHECK function.
5.2.1 Flow of DebuggingThe following section shows the flow of debugging operation when using the CHECK function.
Figure 5.1 Flow of debugging with CHECK function
5.2.2 Output MessageIf the CHECK function checks and detects an abnormality, it will generate a message. This message is usually output to the message box.
- 62 -

While the messages that are generated by the CHECK function normally have the severity code E, the severity code changes to U whenthe message output count equals a predetermined value. (For more information about severity codes, refer to “NetCOBOL Messages”.)
The CHECK(PRM) internal program call parameter produces a diagnostic message at compilation if it determines an error in the callingstructure parameters, but it does not check the number of times specified (n,PRM) for runtime message output.
Checking parameters for calling a method
JMP08101-E/U
[PID:xxxxxxxx TID:xxxxxxxx] FAILURE IN USING (or RETURNING) PARAMETER OF THE 'method-name'METHOD. 'NUMBER' (or PARAMETER=parameter's sequence number ). PGM=program-nameLINE=statement-number
Remedy
Modify your program so that the method referenced in the message is called with valid parameters and execute it again.
Checking Subscripts and Indexes
JMP0820I-E/U
[PID:xxxxxxxx TID:xxxxxxxx] SUBSCRIPT/INDEX IS OUT OF RANGE. PGM=program-name.LINE=statement-number. OPD=data-name (dimension of data-name)
Remedy
Specify a correct value for the subscript or index indicated in the message, then re-execute.
Checking Reference Modification
JMP0821I-E/U
[PID:xxxxxxxx TID:xxxxxxxx] REFERENCE MODIFIER IS OUT OF RANGE. PGM=program-name.LINE=statement-number. OPD=data-name.
Remedy
Correct the program so that reference modification of the data item indicated in the message is performed within the specifiedrange.
Checking a Target Word of the OCCURS DEPENDING ON Clause
JMP0822I-E/U
[PID:xxxxxxxx TID:xxxxxxxx] ODO OBJECT VALUE IS OUT OF RANGE. PGM=program-name.LINE=statement-number. OPD=data-name. ODO=name of target word of ODO clause.
Remedy
Specify a correct value for the object (in the OCCURS DEPENDING ON clause) indicated in the message, then re-execute.
Checking numeric data exceptions
JMP08281-E/U
[PID:xxxxxxxx TID:xxxxxxxx] INVALID VALUE SPECIFIED. PGM=program-name. LINE=statement-number. OPD=data-name
Remedy
Set a valid value in the operand referenced by the message and re-execute.
Checking zero-divisor
- 63 -

JMP08291-E/U [PID:xxxxxxxx TID:xxxxxxxx] DIVIDED BY ZERO. PGM=program-name. LINE=statement-number.OPD=data-name
Remedy
Change the divisor in the operand referenced by the message to any value other than zero and re-execute.
Checking the program calling conventions
JMP0811I-E/U
[PID:xxxxxxxx TID:xxxxxxxx] FAILURE IN CALLING CONVENTIONS OR PARAMETERS OF THE 'calledprogram name' PROGRAM. PGM=program-name. LINE=statement-number.
Remedy
Correct the programs so that the calling conventions and parameters match, then re-execute.
Internal program call parameter investigation
JMN3333I-S
THE NUMBER OF PARAMETERS SPECIFIED IN USING PHRASE OF CALL STATEMENT MUST BE THESAME NUMBER OF PARAMETERS SPECIFIED IN USING PHRASE OF PROCEDURE DIVISION.
Remedy
Correct the program so that the number of parameters is the same.
JMN3334I-S THE TYPE OF PARAMETER @2@ SPECIFIED IN USING PHRASE OR RETURNING PHRASE OF CALLSTATEMENT MUST BE THE SAME TYPE OF PARAMETER @3@ SPECIFIED IN PROCEDURE DIVISIONUSING PHRASE OR RETURNING PHRASE OF PROGRAM @1@.
@1@: Program name
@2@: Identifier
@3@: Identifier
Remedy
Correct the program so that the class name, FACTORY, and ONLY that are specified in the USAGE OBJECT REFERENCEclause of the object specified in the parameter are the same.
JMN3335I-S THE LENGTH OF PARAMETER @2@ SPECIFIED IN USING PHRASE OR RETURNING PHRASE OF CALLSTATEMENT MUST BE THE SAME LENGTH OF PARAMETER @3@ SPECIFIED IN PROCEDURE DIVISIONUSING PHRASE OR RETURNING PHRASE OF PROGRAM @1@.
@1@: Program name
@2@: Identifier
@3@: Identifier
Remedy
Correct the program so that the parameter lengths are the same.
JMN3414I-S RETURNING ITEM MUST BE SPECIFIED FOR CALL STATEMENT WHICH CALLS @1@. THERE ISRETURNING SPECIFICATION IN PROCEDURE DIVISION OF PROGRAM @1@.
@1@: Program name
- 64 -

Remedy
Correct the program so that the existence or non-existence of RETURNING phrase is matched.
JMN3508I-S RETURNING ITEM MUST NOT BE SPECIFIED FOR CALL STATEMENT WHICH CALLS @1@. THERE ISNOT RETURNING SPECIFICATION IN PROCEDURE DIVISION OF PROGRAM @1@.
@1@: Program name
Remedy
Correct the program so that the existence or non-existence of RETURNING phrase is matched.
External program call parameter investigation
JMP0812I-E/U
[PID:xxxxxxxx TID:xxxxxxxx] FAILURE IN '$1' OF CALL STATEMENT. PGM=program-name.LINE=statement-number.
Remedy
Based on the content indicated by $1, perform operations presented in "Table 5.2 The contents of $1 of JMP0812I-E/U " then tryagain.
Table 5.2 The contents of $1 of JMP0812I-E/U
$1 Corrective action taken by the programmer
USING PARAMETER NUMBER Match the number of USING phrase parameters
USING nTH PARAMETER
(nTH = 1ST, 2ND, 3RD, 4TH...)
Match the size of nth USING phrase parameters
RETURNING PARAMETER Match the size of RETURNING phrase parameters
Message Output Count
Specify a message count in compiler option CHECK at compile time. If one run unit contains two or more COBOL programs, which hadthe CHECK option, specified, the number of messages specified with the compile option for the program that is activated first will beused. The message count can be changed at execution time by using execution time option c.
The CHECK function can also be suppressed by specifying execution time option. The following CHECK functions can be suppressed.Plurals can be specified.
- noc : All the CHECK function
- nocb : CHECK(BOUND)
- noci : CHECK(ICONF)
- nocl : CHECK(LINKAGE)
- nocn : CHECK(NUMERIC)
- nocp : CHECK(PRM)
Program execution is continued until the message count reaches the specified count. Refer to "Format of Runtime Options" in the"NetCOBOL User's Guide" for the detail.
5.2.3 Examples of Using the CHECK Function
Checking Reference Modification
Program A
- 65 -

000000 @OPTIONS CHECK(BOUND) :000500 77 data-1 PIC X(12). 000600 77 data-2 PIC X(12). 000700 77 length-to-be-referenced PIC 9(4) BINARY. :001100 MOVE 10 TO length-to-be-referenced. 001200 MOVE data-1 (1:length-to-be-referenced) TO data-2 (4:length-to-be-referenced). :
The following message is written for data-2 when the MOVE statement on line 1200 is executed:
JMP0821I-E/U [PID:xxxxxxxx TID:xxxxxxxx] REFERENCE MODIFIER IS OUT OF RANGE. PGM=A. LINE=1200.1. OPD=data-2.
Checking Subscripts and Indexes
Program A
000000 @OPTIONS CHECK(BOUND) :000500 77 subscript PIC S9(4). 000600 01 d table. 000700 02 table-1 OCCURS 10 TIMES INDEXED BY index-1. 000800 03 element-1 PIC X(5). :001100 MOVE 15 TO subscript. 001200 ADD 1 TO element-1(subscript). 001300 SET index-1 TO 0. 001400 SUBTRACT 1 FROM element-1(index-1). :
When the ADD/SUBTRACT statement is executed, the following message is written:
JMP0820I-E/U [PID:xxxxxxxx TID:xxxxxxxx] SUBSCRIPT/INDEX IS OUT OF RANGE. PGM=A. LINE=1200.1. OPD=element-1JMP0820I-E/U [PID:xxxxxxxx TID:xxxxxxxx] SUBSCRIPT/INDEX IS OUT OF RANGE. PGM=A. LINE=1400.1. OPD=element-1
Checking Target Words of the OCCURS DEPENDING ON Clause
Program A
000000 @OPTIONS CHECK(BOUND) :000050 77 subscript PIC S9(4). 000060 77 cnt PIC S9(4). 000070 01 dtable. 000080 02 table-1 OCCURS 1 TO 10 TIMES DEPENDING ON cnt. 000090 03 element-1 PIC X(5). :000110 MOVE 5 TO subscript. 000120 MOVE 25 TO cnt. 000130 MOVE "ABCDE" TO element-1(subscript). :
The following message is written for the count:
JMP0822I-E/U [PID:xxxxxxxx TID:xxxxxxxx] ODO OBJECT VALUE IS OUT OF RANGE. PGM=A. LINE=120.1. OPD=element-1. ODO=cnt.
- 66 -

Checking Numeric Data Exceptions
Program A
000000 @OPTIONS CHECK(NUMERIC) :000050 01 CHAR PIC X(4) VALUE "ABCD".000060 01 EXTERNAL-DECIMAL REDEFINES CHAR PIC S9(4).000070 01 NUM PIC S9(4). :000150 MOVE EXTERNAL-DECIMAL TO NUM. :
For EXTERNAL-DECIMAL, the following message will appear.
JMP08281-E/U [PID:xxxxxxxx TID:xxxxxxxx] INVALID VALUE SPECIFIED. PGM=A. LINE=150. OPD= EXTERNAL-DECIMAL
Checking a zero divisor
Program A
000000 @OPTIONS CHECK(NUMERIC) :000060 01 DIVIDEND PIC S9(8) BINARY VALUE 1234.000070 01 DIVISOR PIC S9(4) BINARY VALUE 0.000080 01 RESULT PIC S9(4) BINARY VALUE 0. 000150 COMPUTE RESULT = DIVIDEND / DIVISOR.
For the DIVISOR, the following message will appear.
JMP08291-E/U [PID:xxxxxxxx TID:xxxxxxxx] DIVIDED BY ZERO. PGM=A. LINE=150. OPD= DIVISOR
Checking parameters for calling a method
Program A
000000 @OPTIONS CHECK(ICONF)000010 PROGRAM-ID. A. :000030 01 PRM-01 PIC X(9).000040 01 0BJ-U USAGE IS OBJECT REFERENCE. :000060 SET OBJ-U TO B.000070 INVOKE OBJ-U "C" USING BY REFERENCE PRM-01.
Class B/Method C 000010 CLASS-ID. B. :000030 FACTORY.000040 PROCEDURE DIVISION. :000060 METHOD-ID.C. :000080 LINKAGE SECTION.000090 01 PRM-01 PIC 9(9) PACKED-DECIMAL.000100 PROCEDURE DIVISION USING PRM-01. :
The following message is written when the INVOKE statement of program A is executed:
- 67 -

JMP08101-E/U [PID:xxxxxxxx TID:xxxxxxxx] FAILURE IN USING PARAMETER OF THE 'C' METHOD. PARAMETER=1. PGM=A LINE=70.1
Checking the program calling conventions
There are several calling conventions for Windows applications. The standard calling conventions and the specification method of thecalling conventions depend on the development language.
NetCOBOL uses the CALL statement or the WITH phrase of the Procedure Division statement to determine which calling conventionsare to be used when passing parameters. Refer to "Differences Among Calling conventions" in the "NetCOBOL User’s Guide".
If the calling conventions are different for the calling program and called program, an error will occur at linkage if the programs have astatic-link structure or dynamic-link structure. For a dynamic program structure, however, an error will not occur at linkage. As a result,the execution-time stack is destroyed and the program terminates abnormally. In addition, if the calling conventions of the calling programare STDCALL, the program might terminate abnormally if the calling conventions are the same, but the number of parameters is different.Thus, the program might terminate abnormally for the same reason as if the calling conventions were different. Therefore, program callingconventions are an object for checking.
Program A
000000 @OPTIONS CHECK(LINKAGE)000010 PROGRAM-ID. A. :000030 01 PRM-01 PIC S9(9) COMP-5. :000070 CALL "B" WITH C LINKAGE USING PRM-01. :
Program B(C functions)
#include <windows.h> :int WINAPI B(long FAR* data1) ...(*1){ :}
*1 For the following function declarations, the STDCALL calling conventions will be used.
int WINAPI function name() int CALLBACK function name() int PASCAL function name() int far pascal function name() int _stdcall function name()
The following message is written when the CALL statement of program A is executed:
JMP0811I-E/U [PID:xxxxxxxx TID:xxxxxxxx] FAILURE IN CALLING CONVENTIONS OR PARAMETERS OF THE 'B' PROGRAM. PGM=A LINE=7.1
Internal program call parameter investigation
Program A
000001 @OPTIONS CHECK(PRM)000002 PROGRAM-ID. A.000003 ENVIRONMENT DIVISION.000004 CONFIGURATION SECTION.000005 REPOSITORY.000006 CLASS CLASS1.000007 DATA DIVISION.000008 WORKING-STORAGE SECTION.
- 68 -

000009 01 P1 PIC X(20).000010 01 P2 PIC X(10).000011 01 P3 USAGE OBJECT REFERENCE CLASS1.000012 PROCEDURE DIVISION.000013 CALL "SUB1" USING P1 P2 *> JMN3333I-S000014 CALL "SUB2" *> JMN3414I-S000015 CALL "SUB1" USING P1 RETURNING P2 *> JMN3508I-S000016 CALL "SUB1" USING P2 *> JMN3335I-S000017 CALL "SUB3" USING P3 *> JMN3334I-S000018 EXIT PROGRAM.000019*000020 PROGRAM-ID. SUB1.000021 DATA DIVISION.000022 LINKAGE SECTION.000023 01 L1 PIC X(20).000024 PROCEDURE DIVISION USING L1.000025 END PROGRAM SUB1.000026*000027 PROGRAM-ID. SUB2.000028 DATA DIVISION.000029 LINKAGE SECTION.000030 01 RET PIC X(10).000031 PROCEDURE DIVISION RETURNING RET.000032 END PROGRAM SUB2.000033*000034 PROGRAM-ID. SUB3.000035 DATA DIVISION.000036 LINKAGE SECTION.000037 01 L-OR1 USAGE OBJECT REFERENCE.000038 PROCEDURE DIVISION USING L-OR1.000039 END PROGRAM SUB3.000040 END PROGRAM A.
When you compile program A, the following diagnostic message is output at the time of compilation.
** DIAGNOSTIC MESSAGE ** (A)13: JMN3333I-S THE NUMBER OF PARAMETERSPECIFIED IN USING PHRASE OF CALL STATEMENT MUST BE THE SAME NUMBER OF PARAMETER SPECIFIED IN USING PHRASE OF PROCEDURE DIVISION.14: JMN3414I-S RETURNING ITEM MUST BE SPECIFIED FOR CALL STATEMENT WHICH CALLS 'SUB2'. THERE IS RETURNING SPECIFICATION IN PROCEDURE DIVISION OF PROGRAM 'SUB2'.15: JMN3508I-S RETURNING ITEM MUST NOT BE SPECIFIED FOR CALL STATEMENT WHICH CALLS 'SUB1'. THERE IS NOT RETURNING SPECIFICATION IN PROCEDURE DIVISION OF PROGRAM 'SUB1'.16: JMN3335I-S THE LENGTH OF PARAMETER 'P2' SPECIFIED IN USING PHRASE OR RETURNING PHRASE OF CALL STATEMENT MUST BE THE SAME LENGTH OF PARAMETER 'L1' SPECIFIED IN PROCEDURE DIVISION USING PHRASE OR RETURNING PHRASE OF PROGRAM 'SUB1'.17: JMN3334I-S THE TYPE OF PARAMETER 'P3' SPECIFIED IN USING PHRASE OR RETURNING PHRASE OF CALL STATEMENT MUST BE THE SAME TYPE OF PARAMETER 'L-OR1' SPECIFIED IN PROCEDURE DIVISION USING PHRASE OR RETURNING PHRASE OF PROGRAM 'SUB3'.STATISTICS: HIGHEST SEVERITY CODE=S, PROGRAM UNIT=1
External program call parameter investigation
In a program invocation, an error in passing parameters causes a program malfunction because the program refers to or updates anunexpected data item or area.
When a COBOL program compiled by specifying a CHECK(PRM) compile option calls another COBOL program compiled in the sameway, a message is output if the lengths of each of the parameters do not match.
000010 @OPTIONS CHECK(PRM)000020 IDENTIFICATION DIVISION.000030 PROGRAM-ID. A.000040 DATA DIVISION.000050 WORKING-STORAGE SECTION.000060 01 USE-PRM01 PIC 9(04).
- 69 -

000070 01 USE-PRM02 PIC 9(04).000080 01 RET-PRM01 PIC 9(04).000090 PROCEDURE DIVISION.000100 CALL 'B' USING USE-PRM01 USE-PRM02000110 RETURNING RET-PRM01.000120 END PROGRAM A.
000000 @OPTIONS CHECK(PRM)000010 IDENTIFICATION DIVISION.000020 PROGRAM-ID. B.000030 DATA DIVISION.000070 LINKAGE SECTION.000080 01 USE-PRM01 PIC 9(08).000090 01 USE-PRM02 PIC 9(04).000100 01 RET-PRM01 PIC 9(04).000120 PROCEDURE DIVISION USING USE-PRM01 USE-PRM02000130 RETURNING RET-PRM01.000140 END PROGRAM B.
When the CALL statement in program A is executed, the following message is output:
[PID:xxxxxxxx TID:xxxxxxxx] FAILURE IN 'USING 1ST PARAMETER' OF CALL STATEMENT. PGM=A. LINE=10.1.
5.2.4 NotesYou should consider the following things when using the CHECK function.
- Always use the CHECK function and correct abnormalities based on the detected information. If a detected abnormality is notcorrected, serious trouble that can be difficult to detect, such as memory destruction, can occur at execution. The results of executingapplications for which detected abnormalities have not been corrected will be unpredictable. Execution can be continued after an abnormality is detected by specifying a message output count, however, operation after detectionof an abnormality cannot be guaranteed.
- The CHECK function performs processing other than the processing described in the COBOL program such as checking data.Therefore, the program size increases and execution speed deteriorates when the CHECK function is used.
- Use the CHECK function during debugging only. When debugging is completed, recompile the program with compiler optionNOCHECK specified.
- In arithmetic statements with an ON SIZE ERROR or NOT ON SIZE ERROR phrase, CHECK(NUMERIC) does not check for a zerodivisor as the COBOL code already handles that situation.
- If zero-divisor checking is performed, the program terminates abnormally, regardless of the specification of the message output count.
- For a CHECK (LINKAGE) check, the following phenomenon will occur if the output count has been specified and execution iscontinued after an abnormality was detected: If an abnormality was detected for a lower level call for a deep call hierarchy, a message will also be output for the upper level callas well as for the call for which the abnormality was detected. If the upper level call is normal, message output will be stopped onlyby correcting the lowest level call.
- 70 -

- CHECK(PRM) does not affect the program size or execution speed at the time of compilation.
- CHECK(PRM) does not investigate CALL statements that specify identifiers as program names.
- CHECK(PRM) does not perform an investigation when an internal program is called by a CALL statement in which the programname is specified in an identifier.
- Both of the calling and called programs must be compiled with the NetCOBOL compiler V8.0L10 or later with the CHECK(PRM)option in order to check parameters for calling external programs. A parameter check is not exercised if a program calls a programwritten in another language or is called by a program written in another language.
- In a CHECK(PRM) investigation for calling an external program an error is not always found if the difference in the number of callingand called parameters is more than 3.
- In the checks performed when CHECK(PRM) is specified, the parameter length of a variable-length item is the maximum length, notthe length at the time of execution. Therefore, for a variable-length item, a message may be output even if the parameter lengthsactually match.
- CHECK(PRM) will check parameters for calls made using the COBOL and C calling conventions. The parameter check is notperformed for the STDCALL calling convention.Refer to "Differences Among Calling conventions" in the "NetCOBOL User's Guide" for details of the calling conventions.
- If a calling or called program does not specify a RETURNING phrase, the PROGRAM-STATUS is passed implicitly. Therefore theCHECK(PRM) checks will find a 4-byte RETURNING parameter in these situations where the RETURNING phrase is omitted.
- The CHECK function is effective only in programs that specify the CHECK option. When two or more programs are linked, onlyspecify the CHECK option in the programs that you want to target.
5.3 Using the TRACE FunctionThe TRACE function outputs trace information for the COBOL statements that have been executed up to program abnormal termination.
This section describes how to use the TRACE function.
5.3.1 Flow of DebuggingThe following section shows the flow of debugging operation when using the TRACE function:
- 71 -

Figure 5.2 Flow of debugging with TRACE function
5.3.2 Trace InformationThe TRACE function writes the statement numbers of COBOL statements that were executed, up to abnormal termination, as traceinformation.
Number of Trace Information Items
When compiler option TRACE is specified without specifying the number of information items at compile time, up to 200 trace informationitems are produced.
If one run unit contains two or more COBOL programs which had the TRACE option specified, the number specified with the TRACEoption for the program that is activated first will be used.
To change the number of trace items to be generated, use the execution-time option r. The TRACE function can also be suppressed byspecifying execution time option nor. Refer to "Format of Runtime Options" in the "NetCOBOL User's Guide" for the detail.
Note
Zero cannot be specified for the number of trace information items.
- 72 -

Trace Information Storage Destination
Trace information is stored in files specified in the environment variable information @CBR_TRACE_FILE. Refer to"@CBR_TRACE_FILE (Specify the trace information output file)" in the "NetCOBOL User’s Guide".
If the environment variable information @CBR_TRACE_FILE is not specified, trace information is stored in files named after theexecutable file with the extensions TRC and TRO.
The trace information is always stored in a file with the extension TRC. When the number of stored information items reaches the specifiedcount at compilation or execution, the contents of the file with the extension TRC are converted to a file with the extension TRO.
Examples of trace information storage file names that are assumed when the environment variable information @CBR_TRACE_FILE isspecified and when it is not specified are provided below.
Example
If C:\PROG1.TRC is specified in the environment variable information @CBR_TRACE_FILE
- Trace information storage destination (current information): C:\PROG1.TRC
- Trace information storage destination (information on the previous generation): C:\PROG1.TRO
If the environment variable information @CBR_TRACE_FILE is not specified
- Executable program storage destination: C:\PROG2.EXE
- Trace information storage destination (current information): C:\PROG2.TRC
- Trace information storage destination (information on the previous generation): C:\PROG2.TRO
Output Format of Trace Information
The output format of trace information is shown below.
NetCOBOL DEBUG INFORMATION DATE 2007-07-04 TIME 11:39:22 PID=00000123 (1)TRACE INFORMATION (2) (3) (4) (5) (6)1 External-program-name [Internal-program-name] Compilation-date TID=000000992 (7) 1100.1 TID=000000993 1200.1 TID=000000994 1300.1 TID=000000995 (8) 1300.2 (9) (5) 6 Class-name [Method-name] Compilation-date TID=000000997 2100.1 TID=000000998 2200.1 TID=000000999 JMPnnnnI-x xxxxxxxxx xx xxxxxxxxx. (10) 10 THE INTERRUPTION WAS OCCURRED.PID=00000123,... (11)11 EXIT-THREAD TID=00000099 (12):
- [1] Process ID (hexadecimal notation): The process identification number assigned by the operating system when the program wasrun.
- [2] Trace information sequence number (decimal notation): The value is incremented whenever trace information output is displayed.Since trace information is overwritten to two files alternately, this value indicates the sequence number of the information from thestart of the program.
- [3] External program name: An external program name is output.
- [4] Internal program name: The name is the output when an internal program executes. This information is not displayed for externalprograms.
- [5] Compilation date: When an external program executes, the compilation date and time of the program are output.
- [6] Thread ID (hexadecimal notation): The thread identification number assigned by the operating system when the program was run.
- 73 -

- [7] Statement or procedure-name/paragraph-name that was executed: The statement number of the statement, procedure name, orparagraph name that was executed is the output.
- [8] Class-name: A class-name is listed here. If an inheriting method is executed, the class-name of the parent that has defined theprocedures for the method will be listed.
- [9] Method-name: method-name is listed.
- [10] Execution-time message: If messages are generated by the runtime system during execution of the program, those messages willbe shown here.
- [11] Exception report message: This message is generated when an exception (such as a reference to an illegal address) has beenreported by the operating system. The message is not generated when the program has ended normally or when a U-level error hasoccurred.
- [12] Thread end report message: This message is generated when the program terminates normally and the thread has ended.
Trace Information File
The trace information file of each process is output. In order to prevent overwriting the results of each run with trace, change the name ofthe trace output file each time you execute the same program.
When the trace information file name of each process is changed, the environment variable information@CBR_TRACE_PROCESS_MODE is specified.
Refer to "@CBR_TRACE_PROCESS_MODE (Unique file name for each Trace file output)" in the "NetCOBOL User's Guide" for thedetail.
An example of the file name when @CBR_TRACE_PROCESS_MODE is specified is shown below.
Example
When the environment variable information @CBR_TRACE_PROCESS_MODE is specified
Executable file name:SAMPLE.EXEProcess-ID:00000EC4Execution date:12/1/2010Execution time:10:48:50
The newest trace information file name is :
SAMPLE-00000EC4_20100112_104850.TRC
The older trace information file name is :
SAMPLE-00000EC4_20100112_104850.TRO
5.3.3 NotesThis section provides you with some notes/suggestions you should take into account when you use the TRACE function.
- 74 -

- Trace information can be collected only for COBOL programs compiled with compiler option TRACE specified.
Figure 5.3 Collecting TRACE information
- The TRACE function performs processing other than the processing described in the COBOL program, such as collection of traceinformation. Therefore, the program size increases and the execution speed deteriorates when the TRACE function is used.
Use the TRACE function during debugging only. When debugging is completed, recompile the program with compiler optionNOTRACE specified.
The number of trace information items cannot be set to 0.
- When the TRACE function is selected, trace information is generated regardless of whether the program terminated normally orabnormally.
- When a program is executed again while a trace information file exists, the contents of the original trace information file will be lost.
- When a trace information file is no longer needed, delete the file.
- No exception report message may be generated when the TRACE function is used in conjunction with the Debug function ofNetCOBOL Studio or the COBOL debugger.
- No information is included in a trace information file that identifies a prototype-declared method.
In referencing the statement number of a method, reference the class name and the method name to determine whether the methodhas been separated by a prototype declaration. With a separated method, the statement number is expressed by the line number of thesource file of the separated method, not by the line number of the class definition source file.
- A trace information file is output for each executable file processed. Information cannot be output from two or more processes to the same file at the same time- this will produce an output error at executiontime.
- 75 -

In order to prevent overwriting the results of each run with trace, change the name of the trace output file each time you execute thesame program.
5.4 Using the COUNT functionThe COUNT function provides the ability to report the execution count for each statement written in a source program sequentially, alongwith the percentage of one count vs. another for all the statements. In addition, it shows the count by verb along with its percentage. TheCOUNT function enables the user to know exactly how many times each statement is executed and helps to optimize programs.
5.4.1 Flow of DebuggingThe following section shows the flow of debugging operation when using the COUNT function.
Figure 5.4 Flow of debugging with COUNT function
5.4.2 Count InformationWhen the compile option COUNT is enabled, the data will be written to a file specified in the environment variable name SYSCOUNT.
Output Format of Count Information
The output format of count information is shown below:
[1]NetCOBOL COUNT INFORMATION(END OF RUN UNIT) DATE 2007-07-04 TIME 20:45:21
- 76 -

PID:00000123 TID:00000099[2]STATEMENT EXECUTION COUNT PROGRAM-NAME : COUNT-PROGRAM [3] [5] [6] STATEMENT [4] EXECUTION PERCENTAGE NUMBER PROCEDURE-NAME/VERB-ID COUNT (%)------------- --------------------------- ----------------- ----------- 15 PROCEDURE DIVISION COUNT-PROGRAM 17 DISPLAY 1 14.2857 19 CALL 1 14.2857 21 DISPLAY 1 14.2857 23 STOP RUN 1 14.2857 31 PROCEDURE DIVISION INTERNAL-PROGRAM 33 DISPLAY 1 14.2857 35 INVOKE 1 14.2857 37 EXIT PROGRAM 1 14.2857------------- --------------------------- ----------------- ----------- 7[7]VERB EXECUTION COUNT PROGRAM-NAME : COUNT-PROGRAM [11] [13][8] [9] [10] PERCENTAGE [12] PERCENTAGEVERB-ID ACTIVE VERB TOTAL VERB (%) EXECUTION COUNT (%)------------ -------- ---------- -------- ------------------ --------CALL 1 1 100.0000 1 25.0000DISPLAY 2 2 100.0000 2 50.0000STOP RUN 1 1 100.0000 1 25.0000------------ -------- ---------- -------- ------------------ -------- 4 4 100.0000 4 [7]VERB EXECUTION COUNT PROGRAM-NAME : COUNT-PROGRAM (INTERNAL-PROGRAM) [11] [13][8] [9] [10] PERCENTAGE [12] PERCENTAGEVERB-ID ACTIVE VERB TOTAL VERB (%) EXECUTION COUNT (%)------------ -------- ---------- -------- ------------------ --------DISPLAY 1 1 100.0000 1 33.3333EXIT PROGRAM 1 1 100.0000 1 33.3333INVOKE 1 1 100.0000 1 33.3333------------ -------- ---------- -------- ------------------ -------- 3 3 100.0000 3 [14]PROGRAM EXECUTION COUNT PROGRAM-NAME : COUNT-PROGRAM [18] [20][15] [16] [17] PERCENTAGE [19] PERCENTAGEPROGRAM NAME ACTIVE VERB TOTAL VERB (%) EXECUTION COUNT (%)----------- ---------- ----------- --------- --------------- ----------COUNT-PROGRAM 4 4 100.0000 4 57.1429INTERNAL 3 3 100.0000 3 42.8571----------- ---------- ----------- --------- --------------- ---------- 7 7 100.0000 7 [1]NetCOBOL COUNT INFORMATION(END OF RUN UNIT) DATE 2007-07-04 TIME 20:45:21 PID=00000123 TID=00000099[2]STATEMENT EXECUTION COUNT CLASS-NAME : COUNT-CLASS [3] [5] [6] STATEMENT [4] EXECUTION PERCENTAGE NUMBER PROCEDURE-NAME/VERB-ID COUNT (%)------------- --------------------------- ----------------- ----------- 15 PROCEDURE DIVISION COUNT-METHOD 16 DISPLAY 1 50.0000 37 EXIT PROGRAM 1 50.0000
- 77 -

------------- --------------------------- ----------------- ----------- 2[7]VERB EXECUTION COUNT CLASS-NAME : COUNT-CLASS METHOD-NAME : COUNT-METHOD [11] [13][8] [9] [10] PERCENTAGE [12] PERCENTAGEVERB-ID ACTIVE VERB TOTAL VERB (%) EXECUTION COUNT (%)------------ -------- ---------- -------- ------------------ --------DISPLAY 1 1 100.0000 1 50.0000END METHOD 1 1 100.0000 1 50.0000------------ -------- ---------- -------- ------------------ -------- 2 2 100.0000 2[14]VERB EXECUTION COUNT CLASS-NAME : COUNT-CLASS [18] [20][15] [16] [17] PERCENTAGE [19] PERCENTAGEVERB-ID ACTIVE VERB TOTAL VERB (%) EXECUTION COUNT (%)------------ -------- ---------- -------- ------------------ --------COUNT METHOD 2 2 100.0000 2 100.0000------------ -------- ---------- -------- ------------------ -------- 2 2 100.0000 2[21]PROGRAM/CLASS/PROTOTYPE METHOD EXECUTION COUNTPROGRAM/CLASS/PROTOTYPE METHOD EXECUTION COUNTPROGRAM/CLASS [23] [24] PERCENTAGE [26] PERCENTAGE/METHOD-NAME ACTIVE VERB TOTAL VERB (%) EXECUTION COUNT (%)------------ ----------- ---------- ---------- ---------------- ---------COUNT PROGRAM 7 7 100.0000 7 100.0000COUNT CLASS 2 2 100.0000 2 100.0000------------ ----------- ---------- ---------- ---------------- --------- 9 9 100.000 9
- [1] Indicates that this is an output file for the COUNT function. In the parentheses, the stage when this report is generated will bedenoted. There are four stages when this report could be generated:
- END OF RUN UNIT
Upon completion of a COBOL run unit (i.e., at the time a STOP RUN statement or an EXIT PROGRAM statement of a mainprogram is executed), a report is produced.
- ABNORMAL END
When the program ends abnormally, a report is produced.
- END OF INITIAL PROGRAM
Upon completion of a program that has the INITIAL attribute, a report is produced. Upon completion of the internal program,however, no report will be produced.
- CANCEL PROGRAM
When a program that has the compile option COUNT enabled is canceled by a CANCEL statement, a report is produced. Uponcompletion of an internal program, however, no report will be produced.
- [2] The execution counts of source program images are listed here. Execution counts are shown by compilation unit of a sourceprogram. If a compilation unit is a program, PROGRAM-NAME shows an external program-name. In case of a class, CLASS-NAMEshows a class-name. In case of a method, CLASS-NAME shows a class-name and METHOD-NAME shows a method-name.
- [3] Statement-numbers appear in the following format:
[COPY qualifying value-] line number
If one line contains two or more statements, the same line number will be assigned to the second and succeeding statements.
- [4] Procedure names and statements are shown here. At the top of the procedure division, "PROCEDURE DIVISION" is followed bya program-name or method-name.
- 78 -

- [5] Statement execution counts are shown here. At the end, the total of those execution counts is calculated.
- [6] Percentage of the execution count for one specific statement vs. all executed statements.
- [7] Execution counts by verb are listed here. Verb execution counts are shown by program unit or method unit. For programs havinginternal programs or for classes having two or more methods, therefore, two or more listings of execution counts by verb will appear.PROGRAM-NAME denotes a program-name in the following format:
PROGRAM-NAME: program-name [(called internal program)]
- [8] Lists verbs in alphabetical order. Verbs to be listed here are those coded in the corresponding programs.
- [9] The number of imperatives actually executed among those written in the source program.
- [10] The total number of the verbs of that type found in the source program.
- [11] Percentage of those verbs actually executed vs. the total, using the following formula: [9] / [10] * 100.
- [12] Execution counts for each verb. At the bottom, the total of those execution counts is indicated.
- [13] Percentage of the execution count for a specific verb vs. that for all, using the following formula: each verb's execution count/total execution count * 100.
- [14] Execution counts by program or by method are listed here. This list is generated when a class or program has an internal program.
- [15] Program- or method-names in the order listed in the source program.
- [16] The number of verbs actually executed among those found in the source program.
- [17] The total number of verbs of that type found in the source program.
- [18] Percentage of actually executed verbs vs. the total number of verbs of that type, using the following formula: [16] / [17] * 100.
- [19] Verb execution counts by program or method. At the bottom, the total of those execution counts is indicated.
- [20] For each program or method, the percentage of actually executed verbs vs. the total number of the verbs of that type, using thefollowing formula: verb execution count for each program (or method)/total verb execution counts for all programs (or methods) *100.
- [21] Verb execution counts by source program (compilation unit) are listed here. If one run unit has two or more source programs (orcompilation units), the above-mentioned data repeatedly appear for each of such programs.
- [22] Names of external programs, classes, and prototype methods.
- [23] Refer to [16].
- [24] Refer to [17].
- [25] Refer to [18].
- [26] Verb execution counts for each compilation unit. At the end, the total of those counts is indicated.
- [27] Percentage of the verb execution counts for each compilation unit vs. that for all the compilation units. This is obtained bycalculating the following: verb execution count for each compilation unit / verb execution count for all the compilation units * 100.
5.4.3 Debugging Programs with the COUNT FunctionYou can utilize the COUNT function to debug your program for the following purposes:
- To check all the routes the program follows:
The listings generated by the COUNT function shows how many times statements were actually executed. This information allowsyou to check all the possible routes your program would follow.
- To improve the efficiency of your program
The listings generated by the COUNT function shows the percentage of execution counts for each statement and the percentage ofverb execution counts by program unit. This enables you to identify frequently used portions of your program. Optimizing theseportions will allow you to improve the efficiency of your program.
- 79 -

5.4.4 NotesThis section provides you with some notes/suggestions you should take into account when you use the COUNT function.
- The COUNT function performs tasks not described by COBOL statements, such as gathering COUNT information. When this functionis used, it will increase your program in size and slow down its executing speed. Therefore, it is recommended to use this only fordebugging activities. Debugged programs should be recompiled with the compile option NOCOUNT specified.
- If a file is produced due to the abnormal termination of a program, the statement that has caused it will be included in the report.
- If a CANCEL statement is executed, COUNT information for the program to be canceled will be written. If the canceled programcalls another program, COUNT information for the latter program will be shown under the calling program.
- You should specify the SYSCOUNT environment variable to define an output file name.
- When an application called from a different language program terminates abnormally, the COUNT information might not be output.
- COUNT information is output to the output file specified for environment variable SYSCOUNT. It cannot be output from two or moreprocesses to the same file at the same time - this will produce an output error at execution time. Change the output file name of eachprocess when you execute two or more processes at the same time.
5.5 Using the Memory Check FunctionThe memory check function is used to diagnose memory area destruction when a COBOL application is executed. The memory checkfunction checks the runtime system area at the start and end of the procedure division of a COBOL application. If the following runtimemessages are output or event occurs, the area may have been destroyed. Therefore, use the memory check function to check for the causeof memory destruction.
- JMP0009I-U INSUFFICIENT STORAGE AVAILABLE. (*1)
- JMP0010I-U LIBRARY WORK AREA IS BROKEN.
- An application error occurred (access violation).
*1 : This message can also be output even when virtual memory is not insufficient. Refer to "Virtual memory shortages" in the"NetCOBOL User’s Guide".
When using the memory check function, specify environment variable information @CBR_MEMORY_CHECK=MODE1.
Refer to "@CBR_MEMORY_CHECK (Specify the inspection using the memory check function)" in the "NetCOBOL User’s Guide".
5.5.1 Flow of DebuggingThe following section shows the flow of debugging operation when using the memory check function.
- 80 -

Figure 5.5 Flow of debugging with memory check function
5.5.2 Output MessageThe memory check function outputs the following messages when area destruction is detected. The messages are usually output to themessage box.
The following describes the messages of the memory check function:
When area destruction is detected at the start of a procedure division of a program or method
JMP0071I-U
[PID:xxxxxxxx TID:xxxxxxxx] LIBRARY WORK AREA DESTRUCTION WAS DETECTED. STARTPGM=program-name BRKADR=leading-address-of-destroyed-area
If area destruction is detected for a method, PGM=program-name will be replaced by CLASS=class-name METHOD=method-name.
When area destruction is detected at the end of a procedure division of a program or method
JMP0071I-U
- 81 -

[PID:xxxxxxxx TID:xxxxxxxx] LIBRARY WORK AREA DESTRUCTION WAS DETECTED . ENDPGM=program-name BRKADR=leading-address-of-destroyed-area
If area destruction is detected for a method, PGM=program-name will be replaced by CLASS=class-name METHOD=method-name.
5.5.3 Diagnostic reportThe following is an example of a diagnostic report output when the memory check function detects area destruction. The diagnostic reportis output by the COBOL Error Report of the NetCOBOL debugging functions. Refer to "5.6 Using the COBOL Error Report" for detailsabout the COBOL Error Report and how to read the output information of the diagnostic report.
NetCOBOL COBOL ERROR REPORT
<<Summary>>The COBOL runtime message occurred:Application : D:\APL\EXDTM.EXE(PID=000000B2)Exception Number : JMP0071I-U [PID:000000B2 TID:00000085] LIBRARY WORK AREA DESTRUCTION WAS DETECTED. START PGM=EXDTS BRKADR=0x00DC1198.Generation Time : MM/DD/YYYY(HH:MM:SS)Generation Module : D:\APL\EXDTS.DLLTime Stamp : MM/DD/YYYY(HH:MM:SS)File Size : 26524bytes
<<Destroyed Area>>Location : 00DC1198Contents : Address +0 +1 +2 +3 +4 +5 +6 +7 +8 +9 +a +b +c +d +e +f 00DC1198 41 41 41 41 41 41 41 41 41 41 41 41 41 41 41 41 AAAAAAAAAAAAAAAA 00DC11A8 41 41 41 41 41 41 41 41 41 41 41 41 41 41 41 41 AAAAAAAAAAAAAAAA 00DC11B8 41 41 41 41 41 41 41 41 41 41 41 41 41 41 41 41 AAAAAAAAAAAAAAAA 00DC11C8 41 41 41 41 41 41 41 41 41 41 41 41 41 41 41 41 AAAAAAAAAAAAAAAA 00DC11D8 41 41 41 41 41 41 41 41 41 41 41 41 41 41 41 41 AAAAAAAAAAAAAAAA 00DC11D8 41 41 41 41 41 41 41 41 41 41 41 41 41 41 41 41 AAAAAAAAAAAAAAAA 00DC11F8 00 00 00 00 00 00 00 00 00 00 00 00 00 00 00 00 ................ 00DC1208 00 00 00 00 00 00 00 00 00 00 00 00 00 00 00 00 ................ 00DC1218 11 00 11 00 00 01 08 00 54 4D 45 4D 00 00 00 00 ........TMEM.... 00DC1228 80 00 00 00 98 11 DC 00 A8 12 DC 00 46 00 00 00 ............F... 00DC1238 00 00 00 00 00 00 00 00 00 00 00 00 00 00 00 00 ................ 00DC1248 00 00 00 00 00 00 00 00 00 00 00 00 00 00 00 00 ................ 00DC1258 00 00 00 00 00 00 00 00 00 00 00 00 00 00 00 00 ................ 00DC1268 00 00 00 00 00 00 00 00 00 00 00 00 00 00 00 00 ................ 00DC1278 00 00 00 00 00 00 00 00 00 00 00 00 00 00 00 00 ................ 00DC1288 00 00 00 00 00 00 00 00 00 00 00 00 00 00 00 00 ................
<<Detail>>Thread ID : 00000085Register : EAX=0012E27C EBX=1C03F3C8 ECX=00000000 EDX=00000000 ESI=0000005F : EDI=0013AAF0 EIP=77EED7A2 ESP=0012E278 EBP=0012E2CC EFL=00000246 : CS=001B SS=0023 DS=0023 ES=0023 FS=0038 GS=0000Stack Commit : 00004000 (Top:00130000, Base:0012C000)Instruction : Address +0 +1 +2 +3 +4 +5 +6 +7 +8 +9 +a +b +c +d +e +f 77EED792 45 C0 00 00 00 00 8D 45 B0 50 FF 15 C0 D3 F0 77 FAULT ->77EED7A2 5E 8B E5 5D C2 10 00 A1 18 64 F1 77 8B 4C 24 04
Module File : D:\APL\EXDTS.DLLSection Relative Position : .text+000000FFExport Relative Position : EXDTS+000000CB
Symbol Relative Position : EXDTS+000000FFCompilation Information : ASCII, SINGLE THREAD, NOOPTIMIZEExternal Program/Class : EXDTSSource File : Exdts.cob
- 82 -

Source Line : IN ENTRY-CODE
<Call Stack>[ 1]---------------------------------------------------------------------------------
Omitted hereafter
5.5.4 Identifying programsThe following shows how to identify programs that caused area destruction.
Assume that an area destruction message is output for the following call relationship:
The memory check function checks the runtime system area at the start and end of the procedure division of a program. In this example,area destruction is not detected by the check at the start of the procedure division of COBOL program A or by the check at the start of theprocedure division of COBOL program B. Area destruction is detected by the check at the start of the procedure division of COBOLprogram C. Accordingly, area destruction occurred before invoking COBOL program C after the check at the start of the procedure divisionof COBOL program B.
5.5.5 Identifying destroyed locationsThe area destruction watch function of the COBOL Error Report is used to identify destroyed locations. To output the diagnostic reportfor identifying a destroyed location, set the leading address of the destroyed area into the @CBR_ATTACH_TOOL environment variablebefore starting the COBOL Error Report.
Specifying method
The following describes how to specify the destroyed addresses in the COBOL Error Report.
As an example, assume that the memory check function is enabled and the following message output:
JMP0071I-U [PID:00000010 TID:0000000E] LIBRARY WORK AREA DESTRUCTION WAS DETECTED. START PGM=A BRKADR=0x00202020
1. Before starting the COBOL application, specify environment variable information @CBR_ATTACH_TOOL, as follows. Refer to"5.6.3.1 Starting the COBOL Error Report for applications that generate application errors and U-level runtime messages".
@CBR_MEMORY_CHECK need not be disabled.
@CBR_ATTACH_T00L=SNAP -w 0x00202020
For the destroyed area address to be specified after the -w option, specify the address of "BRKADR=destroyed-address" in themessage reported by the memory check function.
- 83 -

2. Start the COBOL application. The diagnostic report that watches for area destruction will be output after the COBOL applicationends. Refer to "5.6.4.3.4 Area destruction watch" for the format and how to read the output diagnostic report.
5.5.6 NotesThe memory check function checks the runtime system area at the start and end of the procedure division of a program. As a result, theexecution speed will be slower. When debugging ends, disable the memory check function (environment variable information@CBR_MEMORY_CHECK). In addition, disable the area destruction watch function of the COBOL Error Report (environment variableinformation @CBR_ATTACH_TOOL).
5.6 Using the COBOL Error ReportThis section begins by providing preliminary information about the COBOL Error Report and proceeds to explain how to run the functionand how to use the report file generated by it to aid in troubleshooting.
5.6.1 COBOL Error Report overviewThe COBOL Error Report outputs diagnostic information for the following problems:
- Application errors and runtime messages of U-level
The COBOL Error Report outputs error information such as the location where the error occurred, program calling relationship, andapplication state. The COBOL Error Report uses COBOL language-level information such as the program name and line number tooutput the error information.
- No response
The COBOL Error Report outputs information such as the program being executed, program calling relationship, and thread state sothat the location that did not respond can be identified. The COBOL Error Report uses COBOL language-level information to outputthe information.
- Area destruction
The COBOL Error Report watches for writing to specific areas. Each time the area is written to, the COBOL Error Report outputs thewritten contents and the location to the diagnostic report. This diagnostic report can then be used to easily identify the program thatcaused area destruction.
The COBOL Error Report outputs Dump for the following problems:
- Application errors except a stack overflow exception (0xC00000FD)
- Runtime messages of U-level
- JMP0009I-U
- JMP0010I-U
- JMP0370I-U
The COBOL Error Report can also be used for troubleshooting when the application error or runtime messages occurred when operating.
The COBOL Error Report has the following features:
- The COBOL Error Report works directly on operational modules without having to reconfigure the application to use it.
- The COBOL Error Report can output the COBOL language-level information when the debugging information file made with COBOLcompiler exists.
- The COBOL Error Report works in conjunction with the higher-level tool PowerCOBOL. On a system with PowerCOBOL installed,information about PowerCOBOL can be reported in a PowerCOBOL language format. For more information on linking withPowerCOBOL, refer to the "PowerCOBOL User’s Guide".
5.6.2 Resources used by the COBOL Error ReportThis section focuses on the programs and resources the COBOL Error Report uses to generate diagnostic reports.
- 84 -

5.6.2.1 ProgramsFor application errors and runtime messages of U-level errors, the COBOL Error Report is enabled while the COBOL runtime environmentis open. Hence, the COBOL Error Report works on the following kinds of programs:
- COBOL programs
- Non-COBOL programs linked with a COBOL program
(Only those programs that run during the lifetime of the COBOL runtime environment, from opening to closing.)
Since the COBOL Error Report maintains user resource compatibility, you can use it without having to recompile and relink old resources.
5.6.2.2 Relationships between compiler and linkage options and output informationThere are no special constraints on creating programs to be the object of the COBOL Error Report. The COBOL Error Report will generatea diagnostic report on any program as long as it is a COBOL program. The coverage of information in the diagnostic report, however,varies with each combination of compiler and linkage options specified. A summary of the correspondence between the possiblecombinations of compiler and linkage options and output information in the diagnostic report is given in "Table 5.3 Relationships betweenCOBOL programs and output information".
Table 5.3 Relationships between COBOL programs and output information
Step Details [1] [2] [3] [4] [5] [6]
Compiling Specification of the TEST option No No Yes Yes Yes Yes
Linkage Specification of the /DEBUG options No Yes No No Yes Yes
Execution Availability of a debugging information file No No No Yes No Yes
Diagnostics Information level Export name +Offset
Yes Yes Yes Yes Yes Yes
Symbol name +Offset
No Yes No No Yes Yes
Program name +Line number
No No No No No Yes
For details about export and symbol names, refer to "Export relative position" and "Symbol relative position" of "5.6.4.2.1 For applicationerrors, runtime messages, and no response".
The level of information output to the diagnostic report is determined by the compilation, linkage, and run conditions.
For example, if no option is specified at compilation and linkage (conditions of column [1]), information of the "Export name + Offset"level will be output to the diagnostic report.
If COBOL language-level information such as the program name and line number is output to the diagnostic report, statements that causeproblems can be easily identified. Therefore, it is recommended that options be specified at compilation and linkage and that applicationsbe executed where the COBOL Error Report can access the debugging information file (conditions of column [6]).
When the COBOL Error Report can output information to the language-level, items of information are generated in the form of thefollowing examples.
Example
Output example: In case of [6] in "Table 5.3 Relationships between COBOL programs and output information"
Module File : D:\APL\SAMPDLL2.dllSection Relative Position : .text+0000025DExport Relative Position : SAMPDLL2+00000229Symbol Relative Position : SAMPDLL2+0000025DCompilation Information : ASCII, SINGLE THREAD, NOOPTIMIZEExternal Program/Class : SAMPDLL2Source File : SAMPDLL2.cobSource Line : 35
- 85 -

The COBOL Error Report will not generate language-level information when it examines the following kinds of programs but will stillgenerate the export and symbol names and their offsets from the beginning:
- A program in which neither a compiler option nor a linkage option is specified
- When the COBOL Error Report cannot read the debugging information file at execution time even if you specify both the compileroption and the linkage option
The export name, the symbol name, and the offset from each head are generated in the form of the following examples.
Example
Output example: Only the export name and the offset (In case of [1][3][4] in "Table 5.3 Relationships between COBOL programs andoutput information")
Module File : D:\APL\SAMPDLL2.dllSection Relative Position : .text+0000025DExport Relative Position : SAMPDLL2+00000229
Output example: Symbol name and offset (In case of [2][5] in "Table 5.3 Relationships between COBOL programs and outputinformation")
Module File : D:\APL\SAMPDLL2.dllSection Relative Position : .text+0000025DExport Relative Position : SAMPDLL2+00000229Symbol Relative Position : SAMPDLL2+0000025D
Since export and symbol names each represent a compilation unit, they can easily be identified without needing language-level informationoutput at execution time.
At this level, an object program listing is required to locate problems. The object program listing is created when the compiler optionsLIST and PRINT are specified at compilation. Refer to "LIST (Determines whether to output the object program listings)" and "PRINT(Whether compiler listing should be output and the output destination specification)" in the "NetCOBOL User’s Guide."
An example of an object program listing is shown below. A summary method of locating problems from export and symbol name relativeoffsets is described below.
ADDR OBJECT CODE LABEL INSTRUCTION BEGINNING OF SAMPDLL2 (1) -> 00000000 31 db 0x31 00000001 08 db 0x08 00000002 53414D50444C4C32 dc "SAMPDLL2" 0000000A 08 db 0x08 0000000B 4E6574434F424F4C dc "NetCOBOL" 00000013 07 db 0x07 00000014 XXXXXXXXXXXX dc "XXXXXX" 0000001B XXXXXXXXXXXXXXXX dc "XXXXXXXX" 00000023 XXXXXXXXXXXXXXXX dc "XXXXXXXX" 0000002B 2B30303030 dc "+0000" 00000030 2031 dc " 1" 00000032 0000 dc 0x0000 00000034 PROLOGUEAD: 00000034 XXXXXXXX db 0xXXXXXXXX : PLB.1(2) -> 00000038 _SAMPDLL2: 00000038 55 push ebp 00000039 8BEC mov ebp,esp 0000003B 81ECB0000000 sub esp,000000B0 00000041 8BD7 mov edx,edi 00000043 8BFD mov edi,ebp 00000045 81EF54000000 sub edi,00000054 :
- 86 -
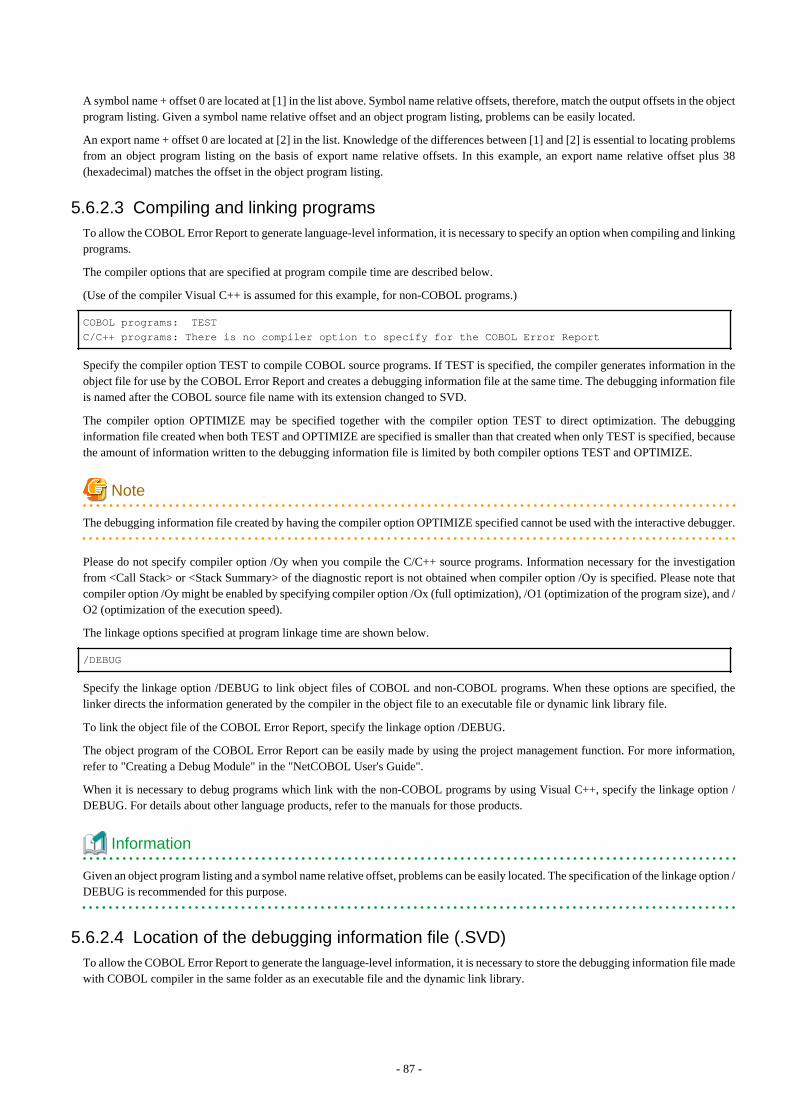
A symbol name + offset 0 are located at [1] in the list above. Symbol name relative offsets, therefore, match the output offsets in the objectprogram listing. Given a symbol name relative offset and an object program listing, problems can be easily located.
An export name + offset 0 are located at [2] in the list. Knowledge of the differences between [1] and [2] is essential to locating problemsfrom an object program listing on the basis of export name relative offsets. In this example, an export name relative offset plus 38(hexadecimal) matches the offset in the object program listing.
5.6.2.3 Compiling and linking programsTo allow the COBOL Error Report to generate language-level information, it is necessary to specify an option when compiling and linkingprograms.
The compiler options that are specified at program compile time are described below.
(Use of the compiler Visual C++ is assumed for this example, for non-COBOL programs.)
COBOL programs: TESTC/C++ programs: There is no compiler option to specify for the COBOL Error Report
Specify the compiler option TEST to compile COBOL source programs. If TEST is specified, the compiler generates information in theobject file for use by the COBOL Error Report and creates a debugging information file at the same time. The debugging information fileis named after the COBOL source file name with its extension changed to SVD.
The compiler option OPTIMIZE may be specified together with the compiler option TEST to direct optimization. The debugginginformation file created when both TEST and OPTIMIZE are specified is smaller than that created when only TEST is specified, becausethe amount of information written to the debugging information file is limited by both compiler options TEST and OPTIMIZE.
Note
The debugging information file created by having the compiler option OPTIMIZE specified cannot be used with the interactive debugger.
Please do not specify compiler option /Oy when you compile the C/C++ source programs. Information necessary for the investigationfrom <Call Stack> or <Stack Summary> of the diagnostic report is not obtained when compiler option /Oy is specified. Please note thatcompiler option /Oy might be enabled by specifying compiler option /Ox (full optimization), /O1 (optimization of the program size), and /O2 (optimization of the execution speed).
The linkage options specified at program linkage time are shown below.
/DEBUG
Specify the linkage option /DEBUG to link object files of COBOL and non-COBOL programs. When these options are specified, thelinker directs the information generated by the compiler in the object file to an executable file or dynamic link library file.
To link the object file of the COBOL Error Report, specify the linkage option /DEBUG.
The object program of the COBOL Error Report can be easily made by using the project management function. For more information,refer to "Creating a Debug Module" in the "NetCOBOL User's Guide".
When it is necessary to debug programs which link with the non-COBOL programs by using Visual C++, specify the linkage option /DEBUG. For details about other language products, refer to the manuals for those products.
Information
Given an object program listing and a symbol name relative offset, problems can be easily located. The specification of the linkage option /DEBUG is recommended for this purpose.
5.6.2.4 Location of the debugging information file (.SVD)To allow the COBOL Error Report to generate the language-level information, it is necessary to store the debugging information file madewith COBOL compiler in the same folder as an executable file and the dynamic link library.
- 87 -

Store the debugging information file in the operation machine together with an executable file and the dynamic link library when you usethe COBOL Error Report by operating environment. When the debugging information file does not exist, the COBOL Error Report outputsthe assembler-level information composed of export name, symbol name and offset. Refer to "5.6.2.2 Relationships between compilerand linkage options and output information" for output information on the COBOL Error Report.
5.6.3 Starting the COBOL Error Report
5.6.3.1 Starting the COBOL Error Report for applications that generate application errorsand U-level runtime messages
When an application error or U-level runtime message occurs, the COBOL Error Report detects the error and starts automatically.
Environment variable @CBR_JUSTINTIME_DEBUG can be used to control starting of the COBOL Error Report. When@CBR_JUSTINTIME_DEBUG has not been set, the COBOL Error Report will be started as the default. Refer to"@CBR_JUSTINTIME_DEBUG (Specify inspection using the debugger or the COBOL Error Report at abnormal termination)" in the"NetCOBOL User’s Guide."
The format of the start parameters is shown below. In the example below, the COBOL Error Report is directed to change the output folderof the report file and report event occurrence to an event log file.
Example
@CBR_JUSTINTIME_DEBUG=ALLERR, SNAP -r c:\log -l
5.6.3.2 Starting the COBOL Error Report for applications that do not respondTo start the COBOL Error Report for applications that do not respond, start the COBOL Error Report manually. When starting the COBOLError Report, the process ID of the application to be diagnosed must be specified in start parameter -p. Refer to "5.6.3.4 Startparameters".
To obtain the application process IDs, enter the following at the command prompt:
COBSNAP
When the command is run, a listing of the process IDs and applications will be displayed as shown below. The process IDs appear inhexadecimal. The application names are file names only.
PID Application
0 [System Process] 4 System 3F0 smss.exe 430 csrss.exe 448 winlogon.exe 474 services.exe 480 lsass.exe 52C testpgm.exe :
Search the list for the name of the application that does not respond to obtain its process ID.
The specification format for starting the COBOL Error Report for applications that do not respond is shown below.
Example
COBSNAP -p 0x52C
- 88 -

5.6.3.3 Starting the COBOL Error Report for applications that cause area destructionTo start the COBOL Error Report for an application that causes area destruction, specify starting of the COBOL Error Report in environmentvariable information @CBR_ATTACH_TOOL. The address of the area to be watched must be specified using the start parameter -w. .For the watch area address, specify the address of the destroyed area reported by the memory check function of the runtime system.
The specification format for starting the COBOL Error Report for applications that cause area destruction is shown below:
Example
@CBR_ATTACH_TOOL=SNAP -w 0xDC1198
For details about the format of environment variable @CBR_ATTACH_TOOL, refer to "@CBR_ATTACH_TOOL (Invoke debugger orCOBOL Error Report from application)" in the "NetCOBOL User’s Guide". For details about the check function, refer to "5.5 Using theMemory Check Function".
Note
If environment variable @CBR_JUSTINTIME_DEBUG has been set, delete the setting before starting the COBOL Error Report.
5.6.3.4 Start parameters"Table 5.4 Start parameters" lists the start parameters of the COBOL Error Report. Where the start parameters are specified depends onthe method used to start the COBOL Error Report.
a. Starting the COBOL Error Report for applications that generate application errors and U-level runtime messages with the startparameters in environment variable @CBR_JUSTINTIME_DEBUG.
b. Starting the COBOL Error Report for applications that do not respond, specifying the start parameters in the COBSNAP command.
c. Starting the COBOL Error Report for applications that cause area destruction, specifying the start parameters in environment variable@CBR_ATTACH_TOOL.
In "Table 5.4 Start parameters" a circle indicates that the listed start parameter is valid for the method, a, b, or c above.
Table 5.4 Start parameters
Specificationformat
a b c Description
-d {YES | NO} Yes - - Specifies whether to output the dump.
YES : Output the dump.
NO : Do not output the dump.
Omitting this start parameter defaults to YES.
-i {0 | 1 | 2} Yes Yes - Specifies the output contents.
2 : Output the environment variable information, initial file name and the contentsof various information files.
1 : Output the environment variable information and initial file name.
0 : Do not output the environment variable information or initial file name.
Omitting this start parameter defaults to 2.
-o folder-name Yes - - Specifies the output destination folder for the dump file as either an absolute pathor a relative path.
Specify an existing folder. (*)
A relative path specifies a folder relative to where the executable file exists.
- 89 -

Specificationformat
a b c Description
If the specified folder does not exist and output is not possible, the dump file isoutput to the standard output destination folder.
If this start parameter is omitted, the dump file is output to the standard outputdestination folder.
Refer to "5.6.5.2 Dump output destination" for information concerning the standardoutput destination folder.
-r folder-name Yes Yes Yes Specifies the output destination folder for the diagnostic report file as either anabsolute path or a relative path.
Specify an existing folder. (*)
A relative path locates the diagnostic report file output destination folder relativeto the folder in which the executable file exists.
If the specified output destination folder does not exist and output is not possible,the diagnostic report file is output to the standard output destination folder.
Similarly, if this start parameter is omitted, the diagnostic report file is output tothe standard output destination folder.
Refer to "5.6.4.1 Diagnostic report output destination" for information concerningthe standard output destination folder.
-l [computer-name]
Yes - - Specifies that the occurrence of each application error or runtime message bewritten to an event log file.
If computer-name is specified, the occurrence of each application error or runtimemessage is written to the event log file of the named computer.
If computer-name is not specified, the occurrence of each application error orruntime message is written to the event log file of the computer on which theproblem has occurred.
-t parameter-count
Yes Yes - Specifies the number of parameters output to the stack summary. The number ofparameters must be used from 1 to 16.
Omitting this start parameter defaults to 8.
-s output-unit-count
Yes Yes - Specifies the size for outputting to the stack dump as the output unit count (1 unit:1024 bytes).
Specify a value greater than 0 for the output unit count.
0: Output all stack contents.
1 or greater: Output stack contents having a size of the specified value ́ 1024 bytes.
Omitting this start parameter defaults to 2.
-p process-ID - Yes - Specifies the process ID of the application that does not respond.
Specify the process ID as a hexadecimal value beginning with 0x.
-w address[,length]
- - Yes Specifies the address and length of the area to be watched.
Specify the address as a hexadecimal value beginning with 0x.
Specify 4, 8, 12, or 16 as the length. Omitting the length defaults to 4.
* : The following access authority to Everyone group is necessary for the folder.
- Modify
- Read & execute
- List folder contents
- 90 -
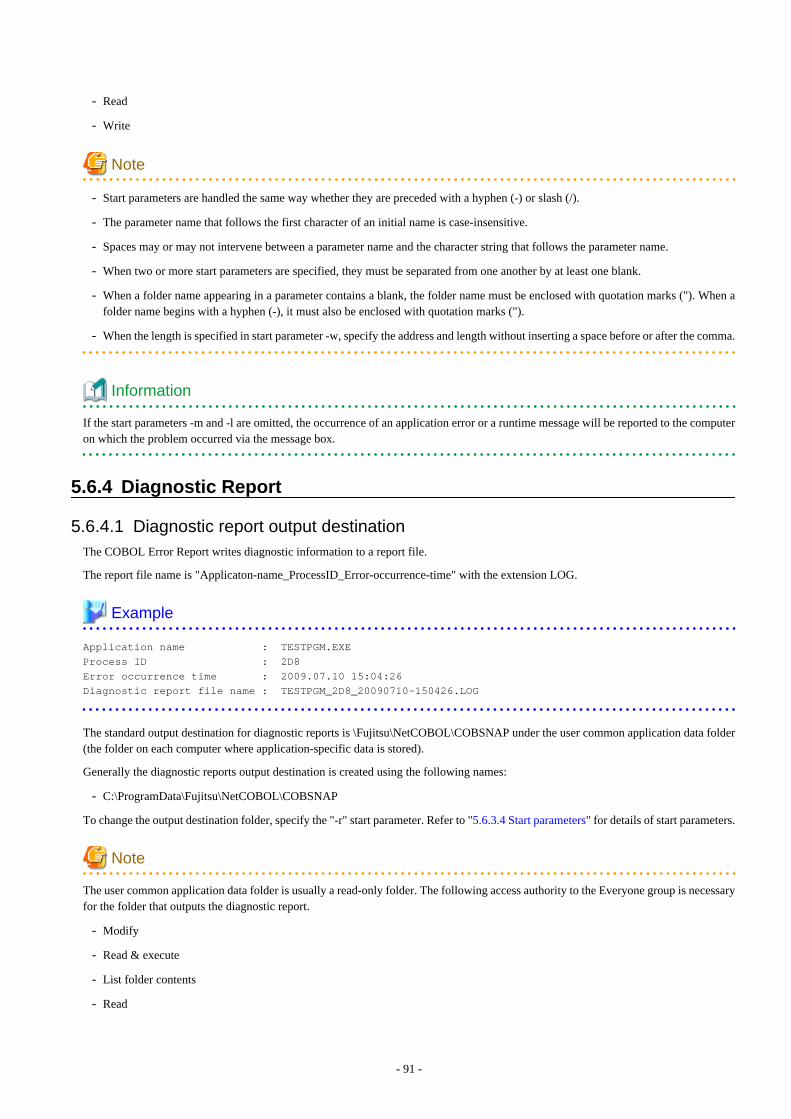
- Read
- Write
Note
- Start parameters are handled the same way whether they are preceded with a hyphen (-) or slash (/).
- The parameter name that follows the first character of an initial name is case-insensitive.
- Spaces may or may not intervene between a parameter name and the character string that follows the parameter name.
- When two or more start parameters are specified, they must be separated from one another by at least one blank.
- When a folder name appearing in a parameter contains a blank, the folder name must be enclosed with quotation marks ("). When afolder name begins with a hyphen (-), it must also be enclosed with quotation marks (").
- When the length is specified in start parameter -w, specify the address and length without inserting a space before or after the comma.
Information
If the start parameters -m and -l are omitted, the occurrence of an application error or a runtime message will be reported to the computeron which the problem occurred via the message box.
5.6.4 Diagnostic Report
5.6.4.1 Diagnostic report output destinationThe COBOL Error Report writes diagnostic information to a report file.
The report file name is "Applicaton-name_ProcessID_Error-occurrence-time" with the extension LOG.
Example
Application name : TESTPGM.EXEProcess ID : 2D8Error occurrence time : 2009.07.10 15:04:26Diagnostic report file name : TESTPGM_2D8_20090710-150426.LOG
The standard output destination for diagnostic reports is \Fujitsu\NetCOBOL\COBSNAP under the user common application data folder(the folder on each computer where application-specific data is stored).
Generally the diagnostic reports output destination is created using the following names:
- C:\ProgramData\Fujitsu\NetCOBOL\COBSNAP
To change the output destination folder, specify the "-r" start parameter. Refer to "5.6.3.4 Start parameters" for details of start parameters.
Note
The user common application data folder is usually a read-only folder. The following access authority to the Everyone group is necessaryfor the folder that outputs the diagnostic report.
- Modify
- Read & execute
- List folder contents
- Read
- 91 -

- Write
The COBOL Error Report writes the occurrence of each event to the message box and to the application event log file.
In the message box, a message indicating the event occurrence and a message inquiring whether to open the diagnostics report are output.Clicking the [Yes] button in the message box opens the diagnostics report.
Note
If the application is operated as a background service, the diagnostic report cannot be opened from the message box.
Each event log is designated by NetCOBOL SNAP as a source name, a message number as an event ID, a severity code as a type, and amessage body as an explanation. The severity codes of the COBOL Error Report messages and the event log types are associated as shownbelow to accommodate differences in level classifications between the system and the COBOL Error Report.
Table 5.5 Correspondence between the severity codes of COBOL Error Report messages and event log types
Severity code Event log type
I (INFORMATION) INFORMATION
W (WARNING) WARNING
E (ERROR)
U (UNRECOVERABLE) ERROR
The event occurrence report is directed by default to the message box. Use the start parameter -l to change the destination. For detailsabout the start parameters, refer to "5.6.3.4 Start parameters".
If diagnostic report output fails, for example, due to inadequate disk space, an error message is issued to the event output destination.
Note
Many services do not perform I-O from screens. If event logs are used under a service that does not perform I-O from screens, specify the“-l” start parameter and specify the event log as the event notification destination.
5.6.4.2 Diagnostic report output informationThe COBOL Error Report generates the following items of information in a diagnostic report:
5.6.4.2.1 For application errors, runtime messages, and no response
Summary
A summary of the diagnostic information
- Event detected
A diagnostic report always begins with the following line:
The application error occurred:orThe COBOL runtime message occurred:orDiagnosed an application with no response:
- Application
The application name (absolute path name format) and process ID (hexadecimal)
- 92 -

- Exception number
When an application error occurs, an exception code (hexadecimal) and exception name are generated. For details about the exceptioncode and exception name, refer to "Table 5.6 Exception codes and exception names". When a runtime message occurs, its body isgenerated. No information is generated for an application that does not respond.
- Generation time
When an application error or runtime message occurs, the date and time when the error occurred is generated. For no response, thedate and time when the COBOL Error Report was started is generated.
- Generation module
When an application error or runtime message occurs, the name of the module in which the error occurred (absolute path name), itscreation time, and file size are generated. No information is generated for an application that does not respond.
Detail
When an application error or runtime message occurs, the location at which the error occurred is generated. No information is generatedfor an application that does not respond.
- Thread ID
The thread ID (hexadecimal) of the thread in which the error occurred
- Register
A listing of the register values (hexadecimal) in effect when the error occurred
- Stack commit
The state of the stack (all in hexadecimal) when the error occurred
- Commit size
Allocated stack size (Commit size = top address - base address)
- Top address
Highest-order address of stack
- Base address
Lowest-order address of allocated stack
- Instruction
The machine language codes (hexadecimal) 16 bytes before and after the error location
- Module file
The name, in absolute path format, of the module in which the error occurred
- Section relative position
The relative location (hexadecimal) of the module from the beginning of the .text section
- Export relative position
If the module has export information, the export name having its address closest to the error location and the relative value(hexadecimal) from the beginning of the export name are generated.
The export name of a COBOL program is shown below:
External program : External program nameENTRY : Entry nameClass : _class name_FACTORYMethod : __class name_method name@###, or __class name__ENTRY_method name@###Method (PROPERTY): __class name__GET_method name@###, __class name__SET_method name@###,
- 93 -

__class name__ENTRY__GET_method name@###, or __class name__ENTRY__SET_method name@###
The export name of a non-COBOL program is shown below:
Function: Function name or _function name@###
The "###" of "@###" following the method name or function name is a decimal value representing the parameter byte count.
When no symbol name or program name is generated, the compilation unit can be identified from the export name if an export namehas been defined for each compilation unit.
- Symbol relative position
If the module has COFF symbol information, the symbol name and the relative value (hexadecimal) from the beginning of the symbolname are generated.
The symbol name of a COBOL program is a compilation unit name. The compilation unit names of COBOL programs are shownbelow.
External program : External program nameClass : Class nameMethod : Class name_method nameMethod (PROPERTY): Class name_GET_method name , or class name_SET_method name
- Compilation information
For a COBOL program, the information at program compilation is generated. For a non-COBOL program, this information is notgenerated.
- Code system (ASCII or Unicode)
- Object format (single thread or multithread)
- Optimization (OPTIMIZE or NOOPTIMIZE)
- Program name
For a COBOL program, the external program name or class name and the internal program name or method name are generated. Fora non-COBOL program, this information is not generated.
- Source file
The name of the source file of the program that caused the error is generated.
- Source line
The line number of the statement that caused the error is generated.
- Supplementary information
In a COBOL program, if an error is located in a statement in a declarative section procedure, the source statement branching to thedeclarative section is listed; if not, no supplementary information is generated.
- Call stack
The calling path up to the program that caused the error is generated. If there is no debugging information file, the caller of the internalprogram is not generated.
System information
General system information about the computer is generated.
- Computer name
- User name
- Windows version
- Version number
- 94 -

- Service pack
Command line
The command character string in effect when the application was run
Environment variable
The environment variable setting in effect when the application was run
Execution environment information
The items of COBOL execution environment information that are generated are listed below. If an initial file does not exist, "NONE" isgenerated in the place of the initial file name and the program name. If an initial file exists and the program is running in multithreadmode, "NONE" is generated in the place of the program name.
- Runtime system
The version and module type of COBOL runtime system.
- Runtime mode
The information at execution of the runtime system
- Code system (ASCII or Unicode)
- Operating mode (single thread or multithread)
- Program name
The main program of COBOL recognized by the runtime system (corresponds to the section name in the initial file)
- .CBR file
The name (absolute path name) and contents of the runtime initial file referenced by the runtime system
- Various information files
The names (absolute path name) and contents of the following information files
- Entry information file
- Logical destination definition file
- ODBC information file
- Print information file
STACK/HEAP information
The size of the stack and heap (hexadecimal) specified at executable file linkage time
Task list
A listing of the process IDs (hexadecimal) and application names of the tasks running on the system
Module list
A listing of each module loaded by the application, including the file name, version information, and creation time. Lists are generated inthe order in which the modules were loaded.
Stack summary
The summarized stack information is generated as follows: (No internal program stack information is generated.)
- Frame pointer
Leading address (hexadecimal) of the stack frame of the called program
- 95 -

- Return address
Return address (hexadecimal) of the called program
- Parameter
Parameters (hexadecimal) passed to the called program
- Module file name and program name
Module file name and program name of the called program
For a parameter, the memory contents of the location (frame pointer + 8 bytes) where the parameter is stored on the stack are listed.
Stack dump
The contents of the stack when the error occurred are listed using hexadecimal and ASCII notation
Thread information
When an application error or runtime message occurs, the items of information listed below are generated with regard to the threads otherthan the thread in which the error occurred. For an application that does not respond, these items of information are generated for eachthread that has been created by the application.
- Thread ID
- Register
- Stack commit
- Module file
- Section relative position
- Export relative position
- Symbol relative position
- Compilation information
- Program name
- Source file
- Source line
- Call stack
- Stack summary
- Stack dump
The exception codes defined in the system and the exception names for the exception codes that are included in the diagnostic report arelisted in "Table 5.6 Exception codes and exception names".
Table 5.6 Exception codes and exception names
Code Exception name
Explanation
C0000005 EXCEPTION_ACCESS_VIOLATION
The program attempted to read or write to a virtual address, but the program did not have theappropriate access authority.
C0000006 EXCEPTION_IN_PAGE_ERROR
The system failed to load a nonexistent page as the program attempted to access it.
C0000017 EXCEPTION_NO_MEMORY
It failed in the allocation of the memory because of memory shortage or the heap destruction.
- 96 -

Code Exception name
Explanation
C000001D EXCEPTION_ILLEGAL_INSTRUCTION
The program attempted to execute an instruction undefined in the processor.
C0000025 EXCEPTION_NONCOUNTINUABLE_EXCEPTION
The program attempted to rerun in the wake of an irrecoverable exception.
C0000026 EXCEPTION_INVALID_DISPOSITION
An exception handler returned an invalid array to the exception dispatcher.
C000008C EXCEPTION_ARRAY_BOUNDS_EXCEEDED
An attempt by the program to access an array out of bounds was detected by the hardware.
C000008D EXCEPTION_FLT_DENORMAL_OPERAND
One of the operands of a floating-point arithmetic calculation is abnormal. This value is toolow to be represented as a standard floating-point value.
C000008E EXCEPTON_FLT_DIVIDE_BY_ZERO
The program attempted to divide a given floating-point value by a floating-point value of 0.
C000008F EXCEPTION_FLT_INEXACT_RESULT
The result of a floating-point arithmetic calculation cannot be accurately represented as adecimal.
C0000090 EXCEPTION_FLT_INVALID_OPERATION
This exception represents a floating-point exception other than the one defined in this table.
C0000091 EXCEPTION_FLT_OVERFLOW
The value of the exponent part of a floating-point arithmetic calculation exceeds the upper limitof the corresponding type.
C0000092 EXCEPTION_FLT_STACK_CHECK
A stack overflow or underflow resulted from a floating-point arithmetic calculation.
C0000093 EXCEPTION_FLT_UNDERFLOW
The value of the exponent part of a floating-point arithmetic calculation exceeds the lower limitof the corresponding type.
C0000094 EXCEPTION_INT_DIVIDE_BY_ZERO
The program attempted to divide an integer by 0.
C0000095 EXCEPTION_INT_OVERFLOW
The most significant bit of an integer calculation overflowed.
C0000096 EXCEPTION_PRIV_INSTRUCTION
The program attempted to execute an instruction but the calculation is not supported in thecurrent machine mode.
C00000FD EXCEPTION_STACK_OVERFLOW
A stack overflow occurred.
Common application errors in COBOL applications are access violation errors (EXCEPTION_ACCESS_VIOLATION) and zero divisionerrors (EXCEPTION_INT_DIVIDE_BY_ZERO). The following are the possible causes of access violation errors:
- Subscript or index values are outside the scope.
- Reference modification pointer values are outside the scope.
- The calling conventions or number of parameters between calling and called programs did not match.
- 97 -

The CHECK function can be used to easily detect these errors. If an error occurs, use the CHECK function to check. Refer to "5.2 Usingthe CHECK Function".
The output format of the source file names and line numbers of COBOL programs varies depending on the specification of the compileroptions NUMBER and OPTIMIZE. The relationships between the compiler options and output formats are summarized in "Table 5.7Compiler options and output formats".
Table 5.7 Compiler options and output formats
Output object NOOPTIMIZE option OPTIMIZE option
NUMBER/NONUMBERoptions
NUMBER option NONUMBER option
Source filename
Source file File name only
Library file File name only Not generated File name only
Path of libraryreading
The file name of the library fileread, the file name of thesource file, and the linenumbers in the source file aregenerated up to the end of thecalling path (*3).
Not generated (sourcefile name generated).(*4)
The file name of the library fileread and that of the source fileare output, but not the sourceline numbers (*5).
Line numbers In the entry code(*1)
IN ENTRY-CODE
In the exit code(*2)
IN EXIT-CODE
Statement File-relative-line-number [in-line-sequence-number]
[COPY-qualification-value-]editor-line-number(NUMBER)(*6)
File-relative-line-number
[Supplementation with term]
- *1
"In the entry code" means the range of the entry code of the program from the position PROLOGUEAD: +4 (hexadecimal) to ENDOF PROGRAM INITIALIZE ROUTINE in the object program listing.
- *2
"In the exit code" means the range of the exit code of the program from the position BEGINNING OF GOBACK COMMON ROUTINEto END OF GOBACK COMMON ROUTINE in the object program listing.
[Output Sample]
- *3
Source File: CPY2.cbl <- CPY1.cbl <- SRC.cobSource Line: 86 <- 55 <- 127
- *4
Source File: SRC.cobSource Line: 2-8600 (NUMBER)
- *5
Source File: CPY2.cbl <- SRC.cobSource Line: 86
- 98 -

- *6
An identifier (NUMBER) placed right after a line number identifies the line number as an editor line number or as a file relative linenumber.
Source Line: 95100 (NUMBER)
5.6.4.2.2 For area destruction watch
Summary
A summary of the diagnostic information
- Event detected
A diagnostic report always begins with the following line:
Watched the writing of an area:
- Application
The name of the application (absolute path name) and process ID (hexadecimal)
- Starting time
The date and time when the COBOL Error Report started
- Watch address
The address (hexadecimal) of the watch area
- Watch size
The size (decimal) of the watch area
Write information items
The locations in the watch area where writing occurred and the contents of the area after writing are listed in the order writing occurred.If writing to the watch area did not occur, information indicating this is generated in the diagnostic report.
- Counter
Incremented each time information is output. These values can be used to identify the order of writing.
- Watch area
The watch area contents in hexadecimal notation are generated.
- Write location
The location of writing
- Thread ID
- Module file
- Section relative position
- Export relative position
- Symbol relative position
- Compilation information
- Program name
- Source file
- Source line
- Call stack
- 99 -

If an application error or runtime message occurs during an area destruction watch, the following information will be added to thediagnostic report:
Error information
Information related to the application error or runtime message
- Counter
Values incremented each time information is output
- Error summary
Detected event and error code
- Problem location
Location where the error occurred
- Thread ID
- Register
- Stack commit
- Module file
- Section relative position
- Export relative position
- Symbol relative position
- Compilation information
- Program name
- Source file
- Source line
- Call stack
5.6.4.3 How to read diagnostic reportsThis section explains how to troubleshoot using diagnostic reports generated by the COBOL Error Report, with reference to examples.
5.6.4.3.1 Application error
An example of a diagnostic report generated to report an application error is shown below.
The program used by the example is composed of the following program.
- 100 -

NetCOBOL COBOL ERROR REPORT
<<Summary>>The application error occurred: Application : D:\APL\SAMPLE.exe(PID=000000A7) Exception Number : EXCEPTION_INT_DIVIDE_BY_ZERO(C0000094) Generation Time : MM/DD/YYYY(HH:MM:SS) Generation Module : D:\APL\SAMPDLL2.dll Time Stamp : MM/DD/YYYY(HH:MM:SS) File Size : 30720bytes
<<Detail>> Thread ID : 0000005E Register : EAX=00000000 EBX=7FFDF065 ECX=00000000 EDX=00000000 ESI=001421A6 : EDI=00405108 EIP=03BB125D ESP=0012FCD8 EBP=0012FD98 EFL=00010256 : CS=001B SS=0023 DS=0023 ES=0023 FS=0038 GS=0000 Stack Commit : 00004000 (Top:00130000, Base:0012C000) Instruction : Address +0 +1 +2 +3 +4 +5 +6 +7 +8 +9 +a +b +c +d +e +f 03BB124D 03 0F BF 05 32 50 BB 03 99 0F BF 0D 2A 50 BB 03 FAULT ->03BB125D F7 F9 0F BF C8 83 F9 00 7D 02 F7 D9 0F C9 C1 E9
Module File : D:\APL\SAMPDLL2.dll Section Relative Position : .text+0000025D Export Relative Position : SAMPDLL2+00000229 Symbol Relative Position : SAMPDLL2+0000025D Compilation Information : ASCII, SINGLE THREAD, NOOPTIMIZE External Program/Class : SAMPDLL2 Source File : SAMPDLL2.cob Source Line : 35
<Call Stack>[ 1]--------------------------------------------------------------------- Module File : D:\APL\SAMPDLL1.dll Section Relative Position : .text+0000026B Export Relative Position : SAMPDLL1+00000237 Symbol Relative Position : SAMPDLL1+0000026B Compilation Information : ASCII, SINGLE THREAD, NOOPTIMIZE External Program/Class : SAMPDLL1 Source File : SAMPDLL1.cob Source Line : 14[ 2]--------------------------------------------------------------------- Module File : D:\APL\SAMPLE.exe Section Relative Position : .text+0000047A Symbol Relative Position : SAMPLE+0000047A Compilation Information : ASCII, SINGLE THREAD, NOOPTIMIZE External Program/Class : SAMPLE Source File : SAMPLE.cob Source Line : 24[ 3]--------------------------------------------------------------------- Module File : D:\APL\SAMPLE.exe Section Relative Position : .text+0000000A Symbol Relative Position : SAMPLE+0000000A[ 4]--------------------------------------------------------------------- Module File : D:\APL\SAMPLE.exe Section Relative Position : .text+00000BEB Symbol Relative Position : _WinMainCRTStartup+0000014B[ 5]--------------------------------------------------------------------- Module File : C:\WINDOWS\System32\KERNEL32.dll Section Relative Position : .text+0001A623 Export Relative Position : RegisterWaitForInputIdle+00000117Omitted hereafter
- 101 -
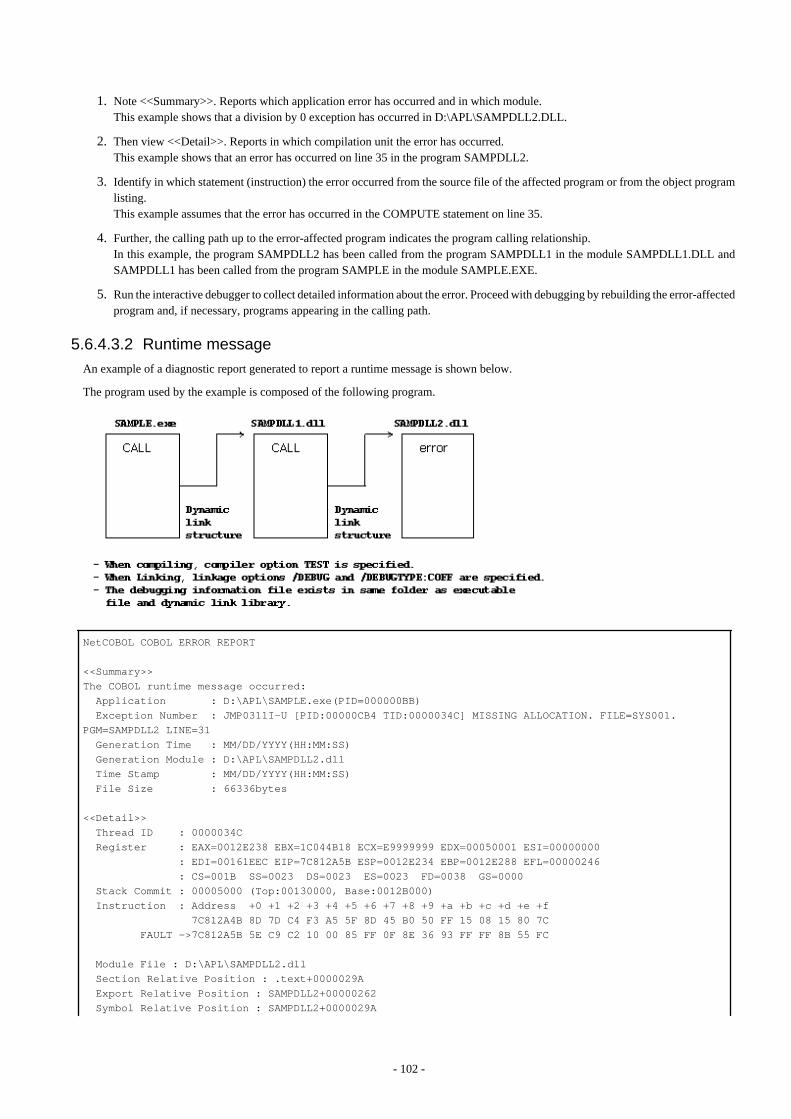
1. Note <<Summary>>. Reports which application error has occurred and in which module.This example shows that a division by 0 exception has occurred in D:\APL\SAMPDLL2.DLL.
2. Then view <<Detail>>. Reports in which compilation unit the error has occurred. This example shows that an error has occurred on line 35 in the program SAMPDLL2.
3. Identify in which statement (instruction) the error occurred from the source file of the affected program or from the object programlisting.This example assumes that the error has occurred in the COMPUTE statement on line 35.
4. Further, the calling path up to the error-affected program indicates the program calling relationship.In this example, the program SAMPDLL2 has been called from the program SAMPDLL1 in the module SAMPDLL1.DLL andSAMPDLL1 has been called from the program SAMPLE in the module SAMPLE.EXE.
5. Run the interactive debugger to collect detailed information about the error. Proceed with debugging by rebuilding the error-affectedprogram and, if necessary, programs appearing in the calling path.
5.6.4.3.2 Runtime message
An example of a diagnostic report generated to report a runtime message is shown below.
The program used by the example is composed of the following program.
NetCOBOL COBOL ERROR REPORT
<<Summary>>The COBOL runtime message occurred: Application : D:\APL\SAMPLE.exe(PID=000000BB) Exception Number : JMP0311I-U [PID:00000CB4 TID:0000034C] MISSING ALLOCATION. FILE=SYS001. PGM=SAMPDLL2 LINE=31 Generation Time : MM/DD/YYYY(HH:MM:SS) Generation Module : D:\APL\SAMPDLL2.dll Time Stamp : MM/DD/YYYY(HH:MM:SS) File Size : 66336bytes
<<Detail>> Thread ID : 0000034C Register : EAX=0012E238 EBX=1C044B18 ECX=E9999999 EDX=00050001 ESI=00000000 : EDI=00161EEC EIP=7C812A5B ESP=0012E234 EBP=0012E288 EFL=00000246 : CS=001B SS=0023 DS=0023 ES=0023 FD=0038 GS=0000 Stack Commit : 00005000 (Top:00130000, Base:0012B000) Instruction : Address +0 +1 +2 +3 +4 +5 +6 +7 +8 +9 +a +b +c +d +e +f 7C812A4B 8D 7D C4 F3 A5 5F 8D 45 B0 50 FF 15 08 15 80 7C FAULT ->7C812A5B 5E C9 C2 10 00 85 FF 0F 8E 36 93 FF FF 8B 55 FC
Module File : D:\APL\SAMPDLL2.dll Section Relative Position : .text+0000029A Export Relative Position : SAMPDLL2+00000262 Symbol Relative Position : SAMPDLL2+0000029A
- 102 -

Compilation Information : ASCII, SINGLE THREAD, NOOPTIMIZE External Program/Class : SAMPDLL2 Source File : SAMPDLL2.cob Source Line : 31
<Call Stack>[ 1]--------------------------------------------------------------------- Module File : c:\Program Files\Fujitsu NetCOBOL for Windows\F3BKATCH.dll Section Relative Position : .text+00002A1A Export Relative Position : NotifyExecErrorInfo+0000015E[ 2]--------------------------------------------------------------------- Module File : c:\Program Files\Fujitsu NetCOBOL for Windows\F3BIPRCT.dll Section Relative Position : .text+0000BEF8 Export Relative Position : JMP1MESS+00000B58[ 3]--------------------------------------------------------------------- Module File : c:\Program Files\Fujitsu NetCOBOL for Windows\F3BIIO.dll Section Relative Position : .text+000226C7 Export Relative Position : JMP5IOER+00000E97[ 4]--------------------------------------------------------------------- Module File : c:\Program Files\Fujitsu NetCOBOL for Windows\F3BIIO.dll Section Relative Position : .text+00002C71 Export Relative Position : JMP5VSEQ+00002C71[ 5]--------------------------------------------------------------------- Module File : c:\Program Files\Fujitsu NetCOBOL for Windows\F3BIIO.dll Section Relative Position : .text+00000622 Export Relative Position : JMP5VSEQ+00000622[ 6]--------------------------------------------------------------------- Module File : D:\APL\SAMPDLL2.dll Section Relative position : .text+00000298 Export Relative position : JMP5VSEQ+00000298[ 7]--------------------------------------------------------------------- Module File: D:\APL\SAMPDLL2.dll Section Relative Position : .text+0000029E Export Relative Position : SAMPDLL2+00000266 Symbol Relative Position : SAMPDLL2+0000029E Compilation Information : ASCII, SINGLE THREAD, NOOPTIMIZE External Program/Class : SAMPDLL2 Source File : SAMPDLL2.cob Source Line : 31[ 8]--------------------------------------------------------------------- Module File: D:\APL\SAMPLE.exe Section Relative Position : .text+00000823 Symbol Relative Position : SAMPLE+00000823 Compilation Information : ASCII, SINGLE THREAD, NOOPTIMIZE External Program/Class : SAMPLE Source File : SAMPLE.cob Source Line : 33[ 9]--------------------------------------------------------------------- Module File : D:\APL\SAMPLE.exe Section Relative Position : .text+0000000A Export Relative Position : SAMPLE+0000000A[10]--------------------------------------------------------------------- Module File : D:\APL\SAMPLE.exe Section Relative Position : .text+00000B6A Symbol Relative Position : _WinMainCRTStartup+000000CE[11]--------------------------------------------------------------------- Module File : C:\Windows\System32\KERNEL32.dll Section Relative Position : .text+00015FD7 Export Relative Position : RegisterWaitForInputIdle+00000049
<<System Information>> Computer Name : MACHINE01 User Name : user01
- 103 -

Windows Version : Microsoft Windows xx Version Number : x.x.xxxx Service Pack : Service Pack x
<<Command Line>> "D:\APL\SAMPLE.exe"
<<Environment Variable>> @WinCloseMsg=OFF @CnsWinSize=(80,24) @CBR_ENTRYFILE=ENTRY.DAT COMPUTERNAME=MACHINE01 ComSpec=C:\Windows\system32\cmd.exe HOMEDRIVE=C: HOMEPATH=\users\default
LOGONSERVER=\\WORK01 LIB=C:\Program Files\Fujitsu NetCOBOL for Windows NUMBER_OF_PROCESSORS=1 OS=Windows_xx Path=C:\Program Files\Fujitsu NetCOBOL for Windows;C:\Windows\system32;C:Windows; PROCESSOR_ARCHITECTURE=x86 PROCESSOR_IDENTIFIER=x86 Family 15 Model 2 Stepping 9, GenuineIntel PROCESSOR_LEVEL=15 PROCESSOR_REVISION=0209 SystemDrive=C: SystemRoot=C:\Windows TEMP=C:\TEMP TMP=C:\TEMP USERDOMAIN=WIN-DOMAIN USERNAME=user01 USERPROFILE=C:\Documents and Settings\user01 windir=C:\Windows
<<Execution Environment Information>>
Runtime System : Vxx.x.x PRODUCT Runtime Mode : ASCII, SINGLE THREAD Program Name : SAMPLE
.CBR File : D:\APL\COBOL85.CBR @WinCloseMsg=OFF @CnsWinSize=(80,24) [EOF]
@CBR_ENTRYFILE : D:\APL\ENTRY.DAT [ENTRY] SAMPDLL1=SAMPDLL1.DLL SAMPDLL2=SAMPDLL2.DLL SAMPDLL3=SAMPDLL3.DLL [EOF]Omitted hereafter
1. Note <<Summary>>. Reports which runtime message has occurred and in which module.This example shows that the runtime message JMP0311I-U has occurred in D:\APL\SAMPDLL2.DLL.
2. Then view <<Detail>>. It tells in which compilation unit the error has occurred. This example shows that an error has occurred on line 31 in the program SAMPDLL2.
3. Identify in which statement (instruction) the error has occurred from the source file of the affected program or from the objectprogram listing.This example assumes that the error has occurred in the OPEN statement on line 31.Because the information in the initial file is reflected in the environment variables, the file identifier, logical destination definition
- 104 -

file, print information file, and so forth, can be identified from the <<Environment Variable>>. Entry information is not reflectedin the environment variables. View the contents of the initial file and the entry information file included in the <<ExecutionEnvironment Information>> instead.In this example, check the settings of the environment variables to identify the error of no file being assigned to SYSIN.
4. Run the interactive debugger as needed to collect detailed information about the error.
Note
The <Call Stack> indicated in the <<Detail>> in a runtime message differs from that in an application error. In the case of an applicationerror, the calling path begins with the program that calls the error-affected program directly. The calling path for a runtime message, onthe other hand, starts with the runtime system program. In the example, the error-affected program is SAMPDLL2, and the seventh andsubsequent items of information in the <Call Stack> represent the calling relationship of the error-affected program.
5.6.4.3.3 No response
1. Note <<Thread Information>>. It provides information on all threads in the application.
2. The compilation unit in which the application has paused for each thread can be seen.
3. Identify in which statement (instruction) the application has paused from the source file of the program or from the object programlisting.
4. Locate roughly the position that did not respond from the source file or the object program listing.
5. Run the interactive debugger to collect detailed information.
5.6.4.3.4 Area destruction watch
The following is an example diagnostic report generated when watching for area destruction.
The program used in the example consists of the following programs:
NetCOBOL COBOL ERROR REPORT
<<Summary>>Watched the writing of an area:Application : D:\APL\EXDTM.EXE(PID=000000BE)Start Time : MM/DD/YYYY(HH:MM:SS)Watch Address : 00DC1198Watch Size : 4bytes
<<1>>==========================================================================Watch Area : +0 +1 +2 +3 B8 00 DC 00Thread ID : 00000070Module File : C:\Windows\System32\ntdll.dll
- 105 -

Section Relative Position : .text+00003A44Export Relative Position : RtlAllocateHeap+000003C2
<Call Stack>[ 1]--------------------------------------------------------------------------Module File : c:\Program Files\Fujitsu NetCOBOL for Windows\F3BIPRCT.dllSection Relative Position : .text+0002CB05Export Relative Position : JMP1TMEM+00000295[ 2]--------------------------------------------------------------------------Module File : c:\Program Files\Fujitsu NetCOBOL for Windows\F3BIPRCT.dllSection Relative Position : .text+0002298DExport Relative Position : JMP1EXDT+000005AD[ 3]--------------------------------------------------------------------------Module File : c:\Program Files\Fujitsu NetCOBOL for Windows\F3BIPRCT.dllSection Relative Position : .text+0002265AExport Relative Position : JMP1EXDT+0000027A[ 4]--------------------------------------------------------------------------Module File : D:\APL\EXDTM.EXE
Section Relative Position : .text+00000162Symbol Relative Position : EXDTM+00000162Compilation Information : ASCII, SINGLE THREAD, NOOPTIMIZEExternal Program/Class : EXDTMSource File : Exdtm.cobSource Line : IN ENTRY-CODE[ 5]--------------------------------------------------------------------------Module File : D:\APL\EXDTM.EXESection Relative Position : .text+0000000ASymbol Relative Position : EXDTM+0000000A[ 6]--------------------------------------------------------------------------Module File : D:\APL\EXDTM.EXESection Relative Position : .text+0000055CSymbol Relative Position : _WinMainCRTStartup+000000CE[ 7]--------------------------------------------------------------------------Module File : C:\Windows\System32\KERNEL32.dllSection Relative Position : .text+0001AD15Symbol Relative Position : GetProcessPriorityBoost+00000117
<<2>>==========================================================================Watch Area : +0 +1 +2 +3 00 00 00 00Thread ID : 00000070Module File : C:\Windows\System32\ntdll.dllSection Relative Position : .text+00003C85Export Relative Position : RtlAllocateHeap+00000603
<Call Stack>[ 1]--------------------------------------------------------------------------Module File : c:\Program Files\Fujitsu NetCOBOL for Windows\F3BIPRCT.dllSectionRelativePosition:.text+0002CB05Export Relative Position : JMP1TMEM+00000295[ 2]--------------------------------------------------------------------------Module File : c:\Program Files\Fujitsu NetCOBOL for Windows\F3BIPRCT.dllSection Relative Position : .text+0002298DExport Relative Position : JMP1EXDT+000005AD[ 3]--------------------------------------------------------------------------Module File : c:\Program Files\Fujitsu NetCOBOL for Windows\F3BIPRCT.dllSection Relative Position : .text+0002265AExport Relative Position : JMP1EXDT+0000027A[ 4]--------------------------------------------------------------------------Module File : D:\APL\EXDTS.DLLSection Relative Position : .text+00000152Export Relative Position : EXDTS+0000011E
- 106 -

Symbol Relative Position : EXDTS+00000152Compilation Information : ASCII, SINGLE THREAD, NOOPTIMIZEExternal Program/Class : EXDTSSource File : Exdts.cobSource Line : IN ENTRY-CODE
[ 5]--------------------------------------------------------------------------Module File : D:\APL\EXDTM.EXESection Relative Position : .text+00000238Symbol Relative Position : EXDTM+00000238Compilation Information : ASCII, SINGLE THREAD, NOOPTIMIZEExternal Program/Class : EXDTMSource File : Exdtm.cobSource Line : 16[ 6]--------------------------------------------------------------------------Module File : D:\APL\EXDTM.EXESection Relative Position : .text+0000000ASymbol Relative Position : EXDTM+0000000A[ 7]--------------------------------------------------------------------------Module File : D:\APL\EXDTM.EXESection Relative Position : .text+0000055CSymbol Relative Position : _WinMainCRTStartup+000000CE[ 8]--------------------------------------------------------------------------Module File : C:\Windows\System32\KERNEL32.dllSection Relative Position : .text+0001AD15Export Relative Position : IsProcessorFeaturePresent+00000117
<<3>>==========================================================================Watch Area : +0 +1 +2 +3 41 41 41 41Thread ID : 00000070Module File : D:\APL\EXDTM.EXESection Relative Position : .text+0000034ESymbol Relative Position : EXDTM+0000034ECompilation Information : ASCII, SINGLE THREAD, NOOPTIMIZEExternal Program/Class : EXDTMSource File : Exdtm.cobSource Line : 19
<Call Stack>[ 1]--------------------------------------------------------------------------Module File : D:\APL\EXDTM.EXESection Relative Position : .text+0000000ASymbol Relative Position : EXDTM+0000000A[ 2]--------------------------------------------------------------------------Module File : D:\APL\EXDTM.EXESection Relative Position : .text+0000055CSymbol Relative Position : _WinMainCRTStartup+000000CE[ 3]--------------------------------------------------------------------------Module File : C:\Windows\System32\KERNEL32.dllSection Relative Position : .text+0001AD15External Program/Class : IsProcessorFeaturePresent+00000117
<<4>>==========================================================================The COBOL runtime message occurred:Exception Number : JMP0071I-U [PID:000000B2 TID:00000085] LIBRARY WORK AREA DESTRUCTION WAS DETECTED. START PGM=EXDTS BRKADR=0x00DC1198.Thread ID : 00000070
Omitted hereafter
- 107 -
1. The watched memory areas are checked sequentially starting from the beginning. The contents written to the watch area and the write locations are given. Except for when the runtime system writes directly, the COBOL Error Report can generate watch area items for all write operations.As a result, watch area information is generated even for write operations using system functions invoked from the runtime system.In such cases, the callers of the system functions must be checked from the <Call Stack> to determine whether the system functionwas invoked from the runtime system or an application program. In this example, it is clear that the watch area contents <<1>> and <<2>> have been written using system functions invoked fromthe runtime system.
2. An invalid write can also be identified when runtime message JMP0071I-U occurs. In this example, checking the diagnostic report ("Diagnostic report" of "5.5 Using the Memory Check Function") when runtimemessage JMP0071I-U occurred shows that the statement indicated by the third watch area item corrupted the area. Normally, the watch area information generated immediately before the error information of runtime message JMP0071I-U indicatesthe program and instructions that corrupted the area.
5.6.5 Dump
5.6.5.1 What is dump?A dump records the memory contents when an error occurs. This information is a valuable resource for investigating the cause of the error.
The COBOL Error Report outputs the memory contents to a dump file when specific application errors and U level runtime messages areissued.
To suppress dump output, specify “-d NO” in the start parameters.
Information
Without dump information the time required to identify the causes of errors my be increased, and problems may become long-term. It isrecommended that dump output be enabled.
Dumps are read in by WinDbg (debug tool provided by Microsoft) and other debuggers and consequently can be used during debugging.Refer to the WinDbg help for information on using WinDbg.
5.6.5.2 Dump output destinationThe dump file name is "Application-name_ProcessID_Error-occurrence-time_COBSNAP" with the extension "DMP".
Example
Application name : TESTPGM.EXEProcess ID : 2D8Error occurrence time : 2009.07.10 15:04:26Dump file name : TESTPGM_2D8_20090710-150426_COBSNAP.DMP
The standard output destination for dumps is \Fujitsu\NetCOBOL\COBSNAP under the user common application data folder (the folderon each computer where application-specific data is stored).
Generally the dump output destination is created using the following names:
- C:\ProgramData\Fujitsu\NetCOBOL\COBSNAP
To change the output destination folder, specify the “-o” start parameter. Refer to "5.6.3.4 Start parameters" for details of start parameters.
- 108 -

Note
- The user common application data folder is normally a read-only folder. However, the dump standard output destination folder isgenerated as a folder that has the following access permissions set for the Everyone group:
- Modify
- Read & execute
- List folder contents
- Read
- Write
- Any user who can access the computer can reference the dump standard output destination folder. Depending on the applicationspecifications and its operation, the dump may contain personal information or confidential data. Thoroughly investigate theoperational safety of the dump output destination folder from the perspective of security and data protection. If necessary, specify the“-o” start parameter and change the dump output destination folder. If dump output is not required, specify "-d NO" to suppress dumpoutput.Refer to "5.6.3.4 Start parameters" for details of start parameters.
- The size of each dump file can be extremely large. Therefore, specify a drive folder that is guaranteed to have plenty of space as thedump output destination.
- In the following cases, the dump file might not be output.
- The COBOL program terminated abnormally while the system was loading.
- The COBOL program was linked to the other languages and it terminated abnormally.
5.6.5.3 Managing the number of dump filesThe upper limit for the number of dump files created by the COBOL Error Report is 10 per folder.
When the COBOL Error Report creates a dump file if there already are 10 files in the folder, it deletes the file with the oldest date.
5.6.6 NotesThis section presents notes on using the COBOL Error Report.
- In addition to the COBOL Error Report, the following functions launch automatically when application errors occur:
- Visual C++ Just-in-Time Debugger
- Windows Error Reports
Even though these functions are preprogrammed to launch on occurrence of application errors, the COBOL Error Report will launchif its startup is specified.
- The COBOL Error Report cannot be used while an application is being debugged using the interactive debugger, PowerCOBOLdebugger, or Visual C++ debugger or is being executed on Systemwalker.
- The COBOL Error Report will not be launched if the application itself handles application errors by using an exception handler forstructured exception handling. This applies to, for example, applications linked to non-COBOL programs that have an exceptionhandler and applications called from server programs such as a Web server that has an exception handler. To check for applicationerrors that occur in such applications, use the interactive debugger.
- The COBOL Error Report will not be launched from the system successfully if a stack overflow exception (0xC00000FD) occurs. Ifdiagnostic information about the error is desired, refer to followings:
- Windows Error Reports
- Statements in a program compiled with the compiler option OPTIMIZE specified may be moved or deleted by the compiler. Hence,inaccurate line numbers may be generated.
- 109 -

- If the following error message is output in the diagnostic report, the description method of the source file is incorrect.
"Outputting the language image information for this program failed because the information on program '$1' in the debugging information file '$2' contains an error."
- $1: Program name
- $2: Debugging information file name
To solve this problem, check the following and change the source file. If the problem is not solved, contact technical support.
- For COBOL programs:
Items related to the description method for the source file in Chapter 2, "Notes"
- For PowerCOBOL programs:
Notes on how to use the library file in "PowerCOBOL User's Guide"
- If a non-COBOL program or system function that does not generate a stack frame is in the calling path of a program, the informationitems of a program that invokes such a non-COBOL program or system function will not be generated in the <Call Stack> or <StackSummary> of the diagnostic report. For Visual C++, for example, this applies to a program compiled with the compiler option /Ox, /O1, /O2, or /Oy specified.
- If the stack is corrupted, calling path information in effect up to the moment of the corruption is covered in the diagnostic report alongwith information indicating that the stack is corrupted.
- After generating a diagnostic report about the application that does not respond, the COBOL Error Report aborts the process. Sincethe system could behave erratically after the abort, do not start the COBOL Error Report for a successfully running process or for aprocess that may affect the performance of the Windows system.
- When diagnosing application errors or runtime messages, the COBOL Error Report will not operate until a problem occurs. As aresult, the execution speed of an application will not change unless a problem occurs. When watching for area destruction, however,the execution speed of an application will be reduced by 50 to 90 percent. The execution speed is reduced because the application isexecuted under the COBOL Error Report.
5.7 Debugging Using Compiler Listings and Debugging ToolsThis section explains how to debug using the compiler listings and debugging tools below after an abnormal termination.
Compiler listings
- Object program listing, Source program listing
For determining the location of the error.
- Data Map Listing
For referencing data content at the time of the abnormal termination.
Debugging tools
- WinDbg (Debugging Tools for Windows - native x86)
This is a debug tool provided by Microsoft.
Debugging Tools for Windows - native x86 is information published on the Microsoft home page.
- Windows Error Report
Crash dumps are collected by the system WER function.
Other files
- Either of the following files output when linking
Program database file (.PDB) (When /DEBUG option is specified, output it.)
Link MAP file (.MAP) (When /MAP option is specified, output it.)
- 110 -

- Clash dump
Crash dump made by WER (Windows Error Report) function.
5.7.1 Flow of DebuggingThe flow of using compiler listings and debugging tools to locate an error is shown below.
Figure 5.6 Flow of debugging using an Object Program Listing
It is recommended that NONUMBER (default value) be made effective when the COBOL source is compiled. The following explanationsassume and describe the case where NONUMBER is effectively compiled.
A file relationship diagram is shown below.
- 111 -

Figure 5.7 A file relationship diagram
Note
- The data that can be referred when terminating abnormally is data used in the method that programs or terminates abnormally terminateabnormally, and data of caller. The data of the program and the method that doesn't appear to "Call Stack" of WinDbg cannot bereferred to.
- Data might not be able to be referred to correctly for the program or the method from which OPTIMIZE of the assembler option iseffectively translated because no storage of the execution result in the area and the statement might be moved and be deleted byoptimization.
- Because data might be stored in the register to confirm data, the knowledge of the assembler is necessary. The knowledge of theassembler is debugged and it is possible to debug it by machine instruction by using, and outputting Object Program Listing whentranslating. Please refer to the section "Object Program Listing" for the form of Object Program Listing.
- Inner program is not correctly output to "Call Stack". Please reproduce the same situation by using the debugging function ofNetCOBOL Studio when you want to output a correct call relation.
- 112 -

5.7.2 Source Program ListingWhen the compile option SOURCE is specified, a source program listing is generated in the compiler list file. In addition, when thecompiler option COPY is specified, library text fetched by the COPY statement is generated in the source program listing.
Source program listing output format
The output format of the source program listing is shown below.
LINE SEQNO A B [1] [2] 1 000100 IDENTIFICATION DIVISION. 2 000200 PROGRAM-ID. A. 3 000300* 4 000400 DATA DIVISION. 5 000500 WORKING-STORAGE SECTION. 6 000600 COPY A1. 1-1 C 000600 77 answer PIC 9(2). 1-2 C 000700 77 divisor PIC 9(2). 1-3 C 000800 77 dividend PIC 9(2). 7 000900* 8 001000 PROCEDURE DIVISION. 9 001100* 10 001200 MOVE 10 TO dividend. 11 001300 MOVE 0 TO divisor. 12 001400* 13 001500 COMPUTE answer = dividend / divisor. 14 001600* 15 001700 EXIT PROGRAM. 16 001800 END PROGRAM A.
- [1] Line number
Line numbers are displayed in either of the following formats:
1. If the compiler option NUMBER is enabled
[COPY-qualification-value-]user-line-number
- COPY-qualification-value
The identification number that is assigned to the library text included in the source program or to a line having a sequencenumber not in ascending order. COPY-qualification-value is assigned to COPY instructions or sequence numbers not inascending order in single unit steps beginning with 1.
- User-line-number
The value of the sequence number area in the source program. If a non-numeric character is included in the sequence numberarea, the sequence number of the line is changed to the immediately preceding, valid sequence number plus 1. When thesame sequence number appears in sequence, it is accepted without assuming it is invalid.
2. If the compiler option NONUMBER is enabled
[COPY-qualification-value-]source-file-relative-number
- COPY-qualification-value
The identification number that is assigned to the library text included in the source program. COPY-qualification-value isassigned to COPY instructions in single unit steps beginning with 1.
- source-file-relative-number
The compiler assigns line numbers as source-file-relative-number in ascending order in single unit steps beginning with 1.Source-file-relative-number is also assigned to source files included with a COPY instruction in single unit steps beginningwith 1, with "C" inserted between the line number and the source program to designate an inclusion of a source file.
- [2] Source program itself.
- 113 -

5.7.3 Object Program ListingWhen the compile option LIST is specified, an object program listing is generated in the compiler list file.
Object program listing output format
The output format of the object program listing is shown below.
BEGINNING OF NONDECLARATIVE PROCEDURES [9] BBK=00004(01) ............LX .........PN.PX [1] [2] [4]0000017A 8D05A0000000 lea eax,%GWA+000000A000000180 A39C000000 mov %GWA+0000009C,eax00000185 C7059800000000000000 mov %GWA+00000098,00000000 : OTHAR.1 [6]0000018F GLB.3 [3]--- 12 --- MOVE [5]0000018F 66A114000000 mov ax,%COA+00000014 : +10 [8]00000195 66A3DA000000 mov %GWA+000000DA,ax : divisor [7]0000019B A0DB000000 mov al,%GWA+000000DB : divisor+1000001A0 240F and al,0F000001A2 0C30 or al,30000001A4 A2DB000000 mov %GWA+000000DB,al : divisor+1--- 13 --- MOVE000001A9 66A112000000 mov ax,%C0A+00000012 : +00000001AF 66A3DC000000 mov %GWA+000000DC,ax : dividend000001B5 A0DD000000 mov al,%GWA+000000DD : dividend+1000001BA 240F and al,0F000001BC 0C30 or al,30000001BE A2DD000000 mov %GWA+000000DD,al : dividend+1--- 15 --- COMPUTE<REDUNDANT STORE><REDUNDANT STORE><REDUNDANT STORE><REDUNDANT STORE>--- 17 --- EXIT PROGRAM000001C3 EB8D jmp GLB.2 BBK=00005(00) NEVER EXECUTED .........PX
END OF A
- [1] Offset
An object relative offset of a statement in machine language.
- [2] Object code in machine language
The object code of the statement in machine language.
Note
With a forward-referencing branch instruction, the machine code area may have been altered.
- [3] Procedure name and procedure number
Compiler-generated procedure name and procedure number.
- [4] Assembler instruction
A statement in machine language represented in the Microsoft macro assembler language.
- 114 -

- [5] Verb name and line number
A verb name and a line number given in the COBOL program.
- [6] Area name
The name of the area used by the COBOL compiler.
- [7] Defined word written in the COBOL program
The following defined words and expressions are displayed in the object program listing:
Table 5.8 Defined words displayed in the object program listing
Defined word Expression in the object program listing
Defined word (alphanumeric) Defined word (alphanumeric)
Example. mov %GWA+00000108,AX :IDX
- [8] Constant written in the COBOL program
The following constants and expressions are displayed in the object program listing:
Table 5.9 Constants and expressions displayed in the object program listing
Literal Expression in the object program listing
Numeral Numeral
Example. sub esp,%COA+00000040 : +8
Character (alphanumeric) Character (alphanumeric)
Example. mov ax,%COA+00000012 : “ABCD”
Numeral (internal floating point)
Numeral (external floating point)
Boolean (internal)
Boolean (external)
None displayed
- [9] Optimization information
Optimization indicates the kind and location of an optimization operation. Refer to "OPTIMIZE (global optimization handling)" inthe "NetCOBOL User’s Guide".
5.7.4 Listings Relating to Data AreasSpecify the compiler option MAP to output information relating to data areas to the compiler list file.
There are three listings relating to data areas:
- Data map listing
- Program control information listing
- Section size listing
5.7.4.1 Data Map Listing
Format of Data Map Listing
[1] [2] [3] [4] [5] [6] [7] [8] [9] [12]LINE ADDR OFFSET REC-OFFSET LVL NAME LENGTH ATTRIBUTE BASE DIM ENCODING[10]**MAIN**15 GWA+00000124 FD OUTFILE LSAM BGW.000000 16 [GWA+00000020]+00000000 0 01 prt-rec 60 ALPHANUM BVA.000003 SJIS18 GWA+000001F8 0 77 answer 8 EXT-DEC BGW.000000 19 GWA+00000200 0 77 divisor 4 EXT-DEC BGW.000000
- 115 -

21 COA+00000060 0 01 CSTART 8 ALPHANUM BCO.000000 SJIS22 COA+00000068 0 01 CEND 8 ALPHANUM BCO.000000 SJIS23 COA+00000070 0 01 CRES 8 ALPHANUM BCO.000000 SJIS25 [GWA+00000018]+00000000 0 01 dividend 2 EXT-DEC BVA.000001 [11]**SUB1**48 [GWA+0000001C]+00000000 0 01 disp 8 EXT-DEC BVA.000002
The data map listing provides data area allocation information and data attribute information for data defined in the source program’sDATA DIVISION (the WORKING-STORAGE SECTION, FILE SECTION, CONSTANT SECTION, LINKAGE SECTION, andREPORT SECTION).
The elements of the data map listing shown above are:
- [1] LINE
1. Displays the line number in the following format:
When the compiler option NUMBER is specified:
[COPY qualification value-] user-line-number
2. When the compiler option NONUMBER is specified:
For details on the COPY qualification value, user-line-number, and relative-line-number see "5.7.2 Source Program Listing".
[COPY qualification value-] relative-line-number in source file
- [2] ADDR, OFFSET
The address displays the data item area allocated in the object program in the following format:
Section name + Relative address
Section name
Displays one of the following:
- COA (.rodata)
- GWA (.data)
- GW2 (.bss)
- EBP (stack)
- HGW (heap)
- HPA (heap)
Where the abbreviations stand for:
- COA - Constant Area
- GWA - Global Working Area
- GW2 - Global Working area 2
- EBP - Extended Base Pointer register (“E” added when processors went from 16 to 32 bit)
- HGW - Heap Global Working area
- HPA - HeaP Area
The methods for finding the base addresses of the various sections are as follows:
- Find the base addresses of COA (.rodata), GWA (.data), and GW2 (.bss) by referencing the link map listing. For details howyou do this, refer to “2) Retrieving base addresses of sections” in “5.7.5.3 Researching Data Values”.
- EBP is the processor’s EBP register. Find the address in this register using the debugger.
- HGW and HPA are stored in the stack. To find the base addresses, it is necessary to reference the program control informationlisting.
- 116 -

The base address of HGW is stored in BHG (Base for HGW). The base address of HPA is stored in BOD (Base for Object Data).Finding the base addresses for HGW and HPA is described in the following example:
Program control information listing
** STK ** : * SGM * ........ SGM POINTERS AREA 0 : EBP+FFFFFFB8 BOD 4EBP+FFFFFFBC BHG 4
The base address of HGW is stored in the location indicated by EBP+FFFFFFBC, and the base address of HPA is stored in thelocation indicated by EBP+FFFFFFB8. You figure the base addresses of HPA and HGW by finding the value in the EBP registerand adding the respective numbers. (Note that the stack grows downwards in memory, and the EBP stores the starting address ofthe stack, so offsets from EBP are generally negative numbers - hence all the leading “F”s. To add these negative offsets, simplyadd the two hex numbers, including the “F”s, and ignore the final carry digit on the addition of the leftmost digits. However, asyou’ll see in “5.7.5.3 Researching Data Values”, you can have the software do the addition for you.)
Relative address
Provides the relative address from the base address of the section.
If the section contains a pointer to the actual location of the data, then the location of the pointer is contained in square brackets( [ ] ) followed by the offset of the actual data from the address contained in the pointer.
The method for referencing the data area depends on whether or not a pointer is involved:
1. If there is no pointer e.g. DATA1 has “GWA+00000060” in the ADDR column:
Indicates that the data area DATA1 exists at the location 0x60 from the GWA base address.
2. If a pointer is indicated e.g. DATA2 shows “[GWA+0000007C]+0000000C” in the ADDR column:
An address is stored at the location 0x7C from the GWA base address (in the example, this address is 000210e8). The dataarea DATA2 exists at the location 0x0C from this address (in the example, this is the location 0x000210e8+0x0c).
- [3] REC-OFFSET
Displays the offset in the record as a decimal number.
- 117 -

- [4] LVL
Displays the level number defined in the source program.
- [5] NAME
Displays the data name defined in the source program. This name is truncated at 30 bytes. The data name is displayed in uppercaseletters when the compiler option ALPHAL is specified.
- [6] LENGTH
Displays the length of data items as a decimal number.
Not displayed for file names.
- [7] ATTRIBUTE
Displays data attributes. These attributes and their meaning are listed in "Table 5.10 Meanings of displayed data attribute abbreviations".
Table 5.10 Meanings of displayed data attribute abbreviations
Displayed Data Attribute Meaning
GROUP-F Fixed-length group item
GROUP-V Variable-length group item
ALPHA Alphabetic
ALPHANUM Alphanumeric
AN-EDIT Alphanumeric edited
NUM-EDIT Numeric edited
INDEX-DATA Index data
EXT-DEC Display decimal
INT-DEC Packed decimal
FLOAT-L Double-precision internal floating-point
FLOAT-S Single-precision internal floating-point
EXT-FLOAT External floating point
BINARY Binary
COMP-5 Binary
INDEX-NAME Index name
INT-BOOLE Internal Boolean
EXT-BOOLE External Boolean
NATIONAL National
NAT-EDIT National edited
OBJ-REF Object reference
POINTER Pointer data
For file description entries, file types and access modes are abbreviated as in "Table 5.11 Meanings of displayed file types/accessmode abbreviations ":
Table 5.11 Meanings of displayed file types/access mode abbreviations
Displayed Abbreviation Meaning
SSAM Sequential file, sequential access
LSAM Line sequential file, sequential access
- 118 -

Displayed Abbreviation Meaning
RSAM Relative file, sequential access
RRAM Relative file, random access
RDAM Relative file, dynamic access
ISAM Indexed file, sequential access
IRAM Indexed file, random access
IDAM Indexed file, dynamic access
PSAM Presentation file, sequential access
- [8] BASE
Displays the base register and base position allocated to the data item.
- [9] DIM
Displays the number of dimensions of subscripting or indexing.
- [10] and [11] Program name
Displays the program name used as a delimiter in a internal program.
Note that, in a class definition, the delimiters for definitions are displayed as follows:
**Class name**** FACTORY **** OBJECT **** MET (Method name)**
- [12] Encoding form
Displays the encoding forms of the following data items:
- ALPHANUM (Alphanumeric)
- AN-EDIT (Alphanumeric edited)
- NATIONAL (National)
- NAT-EDIT (National edited)
Displays the encoding forms using the following symbols:
- SJIS : Shift JIS
- UTF8 : UTF-8
- UTF16LE : UTF-16 little endian
- UTF16BE : UTF-16 big endian
- UTF32LE : UTF-32 little endian
- UTF32BE : UTF-32 big endian
5.7.4.2 Program Control Information Listing
Format of Program Control Information Listing
ADDR FIELD-NAME LENGTH[1] ** GWA ** GWA+00000000 GCB FIXED AREA 8GWA+00000008 TL 1ST AREA 16 ........ MUTEX HANDLE AREA 0 .
- 119 -
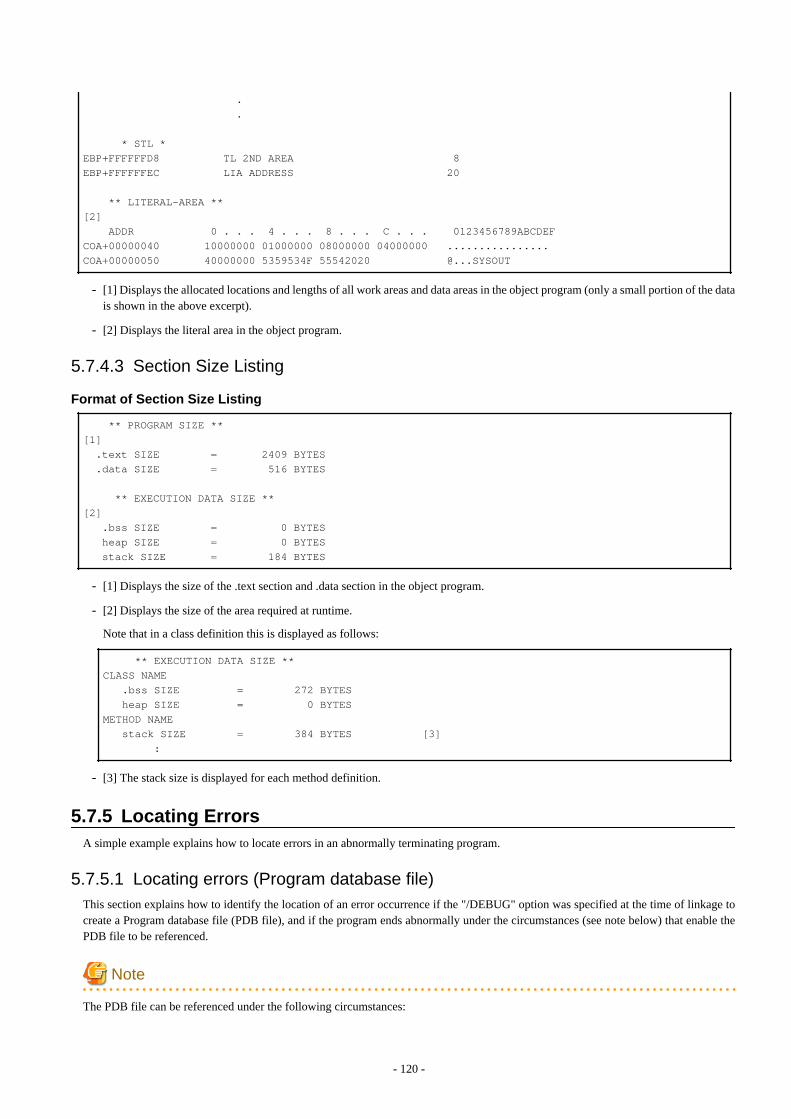
. . * STL * EBP+FFFFFFD8 TL 2ND AREA 8EBP+FFFFFFEC LIA ADDRESS 20
** LITERAL-AREA **[2] ADDR 0 . . . 4 . . . 8 . . . C . . . 0123456789ABCDEFCOA+00000040 10000000 01000000 08000000 04000000 ................COA+00000050 40000000 5359534F 55542020 @...SYSOUT
- [1] Displays the allocated locations and lengths of all work areas and data areas in the object program (only a small portion of the datais shown in the above excerpt).
- [2] Displays the literal area in the object program.
5.7.4.3 Section Size Listing
Format of Section Size Listing
** PROGRAM SIZE **[1] .text SIZE = 2409 BYTES .data SIZE = 516 BYTES
** EXECUTION DATA SIZE **[2] .bss SIZE = 0 BYTES heap SIZE = 0 BYTES stack SIZE = 184 BYTES
- [1] Displays the size of the .text section and .data section in the object program.
- [2] Displays the size of the area required at runtime.
Note that in a class definition this is displayed as follows:
** EXECUTION DATA SIZE **CLASS NAME .bss SIZE = 272 BYTES heap SIZE = 0 BYTESMETHOD NAME stack SIZE = 384 BYTES [3] :
- [3] The stack size is displayed for each method definition.
5.7.5 Locating ErrorsA simple example explains how to locate errors in an abnormally terminating program.
5.7.5.1 Locating errors (Program database file)This section explains how to identify the location of an error occurrence if the "/DEBUG" option was specified at the time of linkage tocreate a Program database file (PDB file), and if the program ends abnormally under the circumstances (see note below) that enable thePDB file to be referenced.
Note
The PDB file can be referenced under the following circumstances:
- 120 -

- In a development environment, the PDB file can be referenced if it is in a folder output at the time of linkage.
- In an operating environment, the PDB file can be referenced if it is in the same folder as the EXE file or the DLL file.
[LISTDBG.COB]
000010 IDENTIFICATION DIVISION.000020 PROGRAM-ID. LISTDBG.000030*000040 DATA DIVISION.000050 WORKING-STORAGE SECTION.000060 01 culc.000070 02 dividend PIC 9(2).000080 02 divisor PIC 9(2).000090 01 answer PIC 9(2).000100 PROCEDURE DIVISION.000120 MOVE 2 TO dividend.000130*000140 CALL "DIVPROC" USING culc RETURNING answer.000150*000160 DISPLAY "answer =" answer.000170 EXIT PROGRAM.000180 END PROGRAM LISTDBG.
[DIVPROC.COB]
000010 IDENTIFICATION DIVISION.000020 PROGRAM-ID. DIVPROC.000030*000040 DATA DIVISION.000050 WORKING-STORAGE SECTION.000060 LINKAGE SECTION.000070 01 Al.000080 02 dividend PIC 9(2).000090 02 divisor PIC 9(2).000100 01 answer PIC 9(2).000110*000120 PROCEDURE DIVISION USING Al RETURNING answer.000130*000140 MOVE 0 TO answer.000150 COMPUTE answer = dividend / divisor.000160*000190 EXIT PROGRAM.000200 END PROGRAM DIVPROC.
- Files
- Clash Dump
- Compiler listing specifying compiler option SOURCE, COPY and LIST
- Program Database file (.PDB)
- Debugging Tools
- WinDbg (Debugging Tools for Windows - native x86)
1. Use the following methods to check whether a crash dump relates to the investigation target:
- Check the crash dump filename.
The file name used for a crash dump collected by the Windows error report function is the name of the application that crashed.Check whether the crash dump filename is the name of the application being investigated.
- 121 -

- Check the time of issue.
Check whether the crash dump update date and time is the time that the application ended abnormally.
2. Open the crash dump from WinDbg and identify the location of and the reason for the exception occurrence.
- Start WinDbg.
- From the WinDbg "File" menu, select "Open Crash Dump..." and open the investigation target crash dump.
[WinDbg output]
Loading Dump File [C:\ProgramData\Fujitsu\NetCOBOL\COBSNAP\LISTDBG_1720_20140801-155635_cobsnap.dmp]User Mini Dump File with Full Memory: Only application data is available
Symbol search path is: *** Invalid ******************************************************************************** Symbol loading may be unreliable without a symbol search path. ** Use .symfix to have the debugger choose a symbol path. ** After setting your symbol path, use .reload to refresh symbol locations. *****************************************************************************Executable search path is: Windows 7 Version 7601 (Service Pack 1) MP (2 procs) Free x86 compatibleProduct: WinNt, suite: SingleUserTSMachine Name:Debug session time: Fri Aug 1 15:56:35.000 2014 (UTC + 9:00)System Uptime: 0 days 4:35:31.089Process Uptime: 0 days 0:00:01.000......................................................*** ERROR: Symbol file could not be found. Defaulted to export symbols for ntdll.dll -
************* Symbol Loading Error Summary **************Module name Errorntdll The system cannot find the file specified
You can troubleshoot most symbol related issues by turning on symbol loading diagnostics (!sym noisy) and repeating the command that caused symbols to be loaded.You should also verify that your symbol search path (.sympath) is correct.This dump file has an exception of interest stored in it.The stored exception information can be accessed via .ecxr.(1720.1108): Integer divide-by-zero - code c0000094 (first/second chance not available) ... [1]*** WARNING: Unable to verify checksum for LISTDBG.exe*** ERROR: Symbol file could not be found. Defaulted to export symbols for LISTDBG.exe - eax=00000002 ebx=7ffdf000 ecx=00000000 edx=00000000 esi=00000000 edi=00406100eip=00401516 esp=0012fd74 ebp=0012fe34 iopl=0 nv up ei ng nz na po cycs=001b ss=0023 ds=0023 es=0023 fs=003b gs=0000 efl=00010283LISTDBG!DIVPROC+0x20e: ... [3]00401516 f7f9 idiv eax,ecx ... [2]
[1] provides the reason the exception was issued: "Integer divide-by-zero - code c0000094" (zero divisor).
[2] provides the position of the exception occurrence:"00401516", the "idiv eax,ecx" instruction.
"idiv eax,ecx" is an instruction that performs signed division. The edx:eax register contents are divided by the ecx register contents,the quotient is set in eax, and the remainder is set in edx.
Use the r command to check the register contents.
[r command output]
0:000> reax=00000002 ebx=7ffdf000 ecx=00000000 edx=00000000 esi=00000000 edi=00406100eip=00401516 esp=0012fd74 ebp=0012fe34 iopl=0 nv up ei ng nz na po cycs=001b ss=0023 ds=0023 es=0023 fs=003b gs=0000 efl=00010283
- 122 -

LISTDBG!DIVPROC+0x20e:00401516 f7f9 idiv eax,ecx
The above output indicates that "edx:eax=0000000000000002" was divided by "ecx=00000000" but, since ecx is 0, a zero divisorexception was issued.
3. Identify the COBOL source line position.
The position in the COBOL source where the error occurred, is indicated by [3], "LISTDBG!DIVPROC+0x20e".
The output format for the information at [3] is "module name!symbol name + offset". This information in this example is as follows:
Module name : "LISTDBG"Symbol name : "DIVPROC"Offset from Symbol : 0x20e
The extension is deleted from the module name. Use the lm command to check the extension.
[lm command output]
0:000> lm v m LISTDBGstart end module name00400000 0040a000 LISTDBG C (export symbols) LISTDBG.exe Loaded symbol image file: LISTDBG.exe Image path: C:\work\tmp\tmp\LISTDBG.exe ... [4] Image name: LISTDBG.exe ... [5] Timestamp: Fri Aug 01 15:56:24 2014 (53DB3A18) CheckSum: 00000000 ImageSize: 0000A000 File version: 0.0.0.0 Product version: 0.0.0.0 File flags: 0 (Mask 0) File OS: 0 Unknown Base File type: 0.0 Unknown File date: 00000000.00000000 Translations: 0000.04b0 0000.04e4 0409.04b0 0409.04e4
Check the file extension at [4], Image path, or [5], Image name. In this example,"LISTDBG.exe". is shown.
The symbol is formed by combining the COBOL source "PROGRAM-ID", the "CLASS-ID", and the "METHOD-ID". This isoutput as the label name in the object program list.
The two files LISTDBG.cob and DIVPROC.cob are used to create "LISTDBG.exe". For "LISTDBG!DIVPROC+0x20e", obtainthe position "0x20e" from the Object Program Listing (DIVPROC.LST) of the DIVPROC.cob that contains the symbol "DIVPROC".
[Object Program Listing (DIVPROC.LST)]
BEGINNING OF DIVPROC00000000 32 db 0x3200000001 07 db 0x0700000002 44495650524F43 dc "DIVPROC"00000009 08 db 0x080000000A 4E6574434F424F4C dc "NetCOBOL"00000012 07 db 0x0700000013 5631302E352E30 dc "V10.5.0"0000001A 3230313430383031 dc "20140801"00000022 3131343033393030 dc "11403900"0000002A 2B30303030 dc "+0000"0000002F 30313031 dc "0101"00000033 00 db 0x0000000034 PROLOGUEAD:00000034 XXXXXXXX db 0xXXXXXXXX : PLB.100000038 _DIVPROC: ... [6]00000038 55 push ebp 00000039 8BEC mov ebp,esp0000003B 81ECC0000000 sub esp,000000C0
- 123 -

00000041 8BD7 mov edx,edi00000043 8BFD mov edi,ebp00000045 81EF64000000 sub edi,000000640000004B B90E000000 mov ecx,0000000E00000050 B800000000 mov eax,0000000000000055 FC cld 00000056 F3AB repe 00000058 8BFA mov edi,edx0000005A 897DEC mov ss:ebp-14,edi0000005D 8975F0 mov ss:ebp-10,esi00000060 895DF4 mov ss:ebp-0C,ebx00000063 6800000000 push 0000000000000068 C7859CFFFFFF00000000 mov ss:ebp+FFFFFF9C,0000000000000072 2EFF2534000000 jmp cs:0000003400000079 00000000000000 db 0x00000000000000
In the DIVPROC.cob Object Program Listing (DIVPROC.LST), search for "DIVPROC" to obtain the output position [6]. Fromthe line address of the next line of that symbol, obtain the offset position of that symbol, "000000000038" (hexadecimal number).
Add the address number (offset) obtained above to the offset value from the symbol, "0x20e", to obtain the offset value within thelist.
0x38+0x20e = 0x246
In the DIVPROC.cob Object Program Listing(DIVPROC.LST), search for address number "0x246 ".
[Object Program Listing(DIVPROC.LST)]
--- 14 --- MOVE
000001D0 B830300000 mov eax,00003030
000001D5 668945A0 mov ss:ebp-60,ax : answer
--- 15 --- COMPUTE ... [8]
000001D9 31D2 xor edx,edx
000001DB 8B3D18000000 mov edi,%GWA+00000018
000001E1 8A17 mov dl,ds:edi : dividend
000001E3 83E20F and edx,0F
000001E6 31C9 xor ecx,ecx
000001E8 8A4F01 mov cl,ds:edi+01 : dividend+1
000001EB 83E10F and ecx,0F
000001EE 8D1492 lea edx,ds:edx+edx*4
000001F1 8D1451 lea edx,ds:ecx+edx*2
000001F4 8A4F01 mov cl,ds:edi+01 : dividend+1
000001F7 80E1F0 and cl,F0
000001FA 80F950 cmp cl,50
000001FD 75XX jne GLB.4
000001FF F7DA neg edx
00000201 GLB.4
000001FE 02
00000201 31C0 xor eax,eax
00000203 8B3D18000000 mov edi,%GWA+00000018
00000209 8A4702 mov al,ds:edi+02 : divisor
- 124 -

0000020C 83E00F and eax,0F
0000020F 31C9 xor ecx,ecx
00000211 8A4F03 mov cl,ds:edi+03 : divisor+1
00000214 83E10F and ecx,0F
00000217 8D0480 lea eax,ds:eax+eax*4
0000021A 8D0441 lea eax,ds:ecx+eax*2
0000021D 8A4F03 mov cl,ds:edi+03 : divisor+1
00000220 80E1F0 and cl,F0
00000223 80F950 cmp cl,50
00000226 75XX jne GLB.5
00000228 F7D8 neg eax
0000022A GLB.5
00000227 02
0000022A 66A30A000000 mov %GWA+0000000A,ax : TRLP+0
00000230 66891512000000 mov %GWA+00000012,dx : TRLP+0
00000237 0FBF0512000000 movsx eax,%GWA+00000012 : TRLP+0
0000023E 99 cdq
0000023F 0FBF0D0A000000 movsx ecx,%GWA+0000000A : TRLP+0
00000246 F7F9 idiv ecx ... [7]
00000248 668945DA mov ss:ebp-26,ax : TRLS+0
0000024C 0FBF45DA movsx eax,ss:ebp-26 : TRLS+0
00000250 B102 mov cl,02
00000252 B500 mov ch,00
00000254 8D7DA0 lea edi,ss:ebp-60 : answer
00000257 E8XXXXXXXX call JMPZNCVZB_REG1
The instruction at address "00000246 " (the instruction at [7]) is "idiv ecx", which matches the instruction obtained at [2]. Thus, theposition of the instruction that ended abnormally can be identified as this one.
Search upwards from this instruction, looking for a line starting with the "--- nnn --- " format. In this example, "--- 15 --- COMPUTE" is found ([8]).
The part corresponding to the "nnn", that is "15", corresponds to the COBOL source line number.
In the DIVPROC.LST source program list, refer to the position at line number "15" ([9]).
[Source Program List(DIVPROC.LST)]
1 000010 IDENTIFICATION DIVISION. 2 000020 PROGRAM-ID. DIVPROC. 3 000030* 4 000040 DATA DIVISION. 5 000050 WORKING-STORAGE SECTION. 6 000060 LINKAGE SECTION. 7 000070 01 Al. 8 000080 02 dividend PIC 9(2). 9 000090 02 divisor PIC 9(2). 10 000100 01 answer PIC 9(2). 11 000110* 12 000120 PROCEDURE DIVISION USING Al RETURNING answer.
- 125 -

13 000130* 14 000140 MOVE 0 TO answer. 15 000150 COMPUTE answer = dividend / divisor. ... [9] 16 000160* 17 000170 EXIT PROGRAM. 18 000180 END PROGRAM DIVPROC.
5.7.5.2 Locating Errors (Link Map file)This section explains how to identify the location where an error occurred if "/MAP" was specified at linkage to create a Link Map File,and if a program ended abnormally when it is impossible to reference the PDB file.
- Files
- Clash Dump
- Compiler listing specifying compiler option SOURCE, COPY and LIST
- Link Map file (.MAP)
- Debugging Tools
- WinDbg (Debugging Tools for Windows - native x86)
The example used here is the same as in "Locating Errors (Program Database File)".
A crash dump is collected when a file is executed if the file was created with "/MAP", rather than "/DEBUG", specified at the time oflinkage.
Procedures 1. and 2. below are the same as in "Locating Errors (Program Database File)".
1. Check whether the crash dump relates to the investigation target.
2. Use the crash dump to identify the location of and the reason for the exception occurrence.
3. Identify the COBOL source line position.
The method for obtaining the COBOL source line position from the crash dump and the Link Map Listing is explained below.
a. Obtain the COBOL source line position from the WinDbg address information.
[Results output at WinDbg start]
Loading Dump File [C:\ProgramData\Fujitsu\NetCOBOL\COBSNAP\LISTDBG_1720_20140801-155635_cobsnap.dmp]User Mini Dump File with Full Memory: Only application data is available
Symbol search path is: *** Invalid ******************************************************************************** Symbol loading may be unreliable without a symbol search path. ** Use .symfix to have the debugger choose a symbol path. ** After setting your symbol path, use .reload to refresh symbol locations. *****************************************************************************Executable search path is: Windows 7 Version 7601 (Service Pack 1) MP (2 procs) Free x86 compatibleProduct: WinNt, suite: SingleUserTSMachine Name:Debug session time: Fri Aug 1 15:56:35.000 2014 (UTC + 9:00)System Uptime: 0 days 4:35:31.089Process Uptime: 0 days 0:00:01.000......................................................*** ERROR: Symbol file could not be found. Defaulted to export symbols for ntdll.dll -
************* Symbol Loading Error Summary **************Module name Errorntdll The system cannot find the file specified
You can troubleshoot most symbol related issues by turning on symbol loading diagnostics (!sym
- 126 -
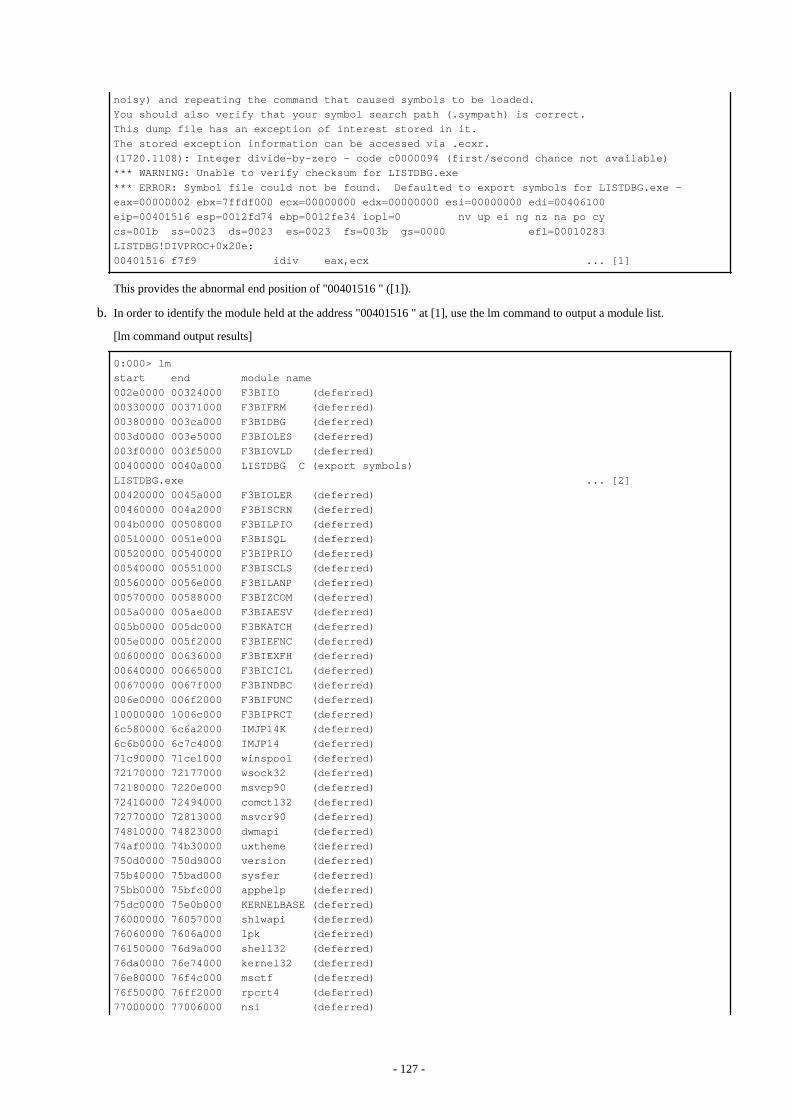
noisy) and repeating the command that caused symbols to be loaded.You should also verify that your symbol search path (.sympath) is correct.This dump file has an exception of interest stored in it.The stored exception information can be accessed via .ecxr.(1720.1108): Integer divide-by-zero - code c0000094 (first/second chance not available)*** WARNING: Unable to verify checksum for LISTDBG.exe*** ERROR: Symbol file could not be found. Defaulted to export symbols for LISTDBG.exe - eax=00000002 ebx=7ffdf000 ecx=00000000 edx=00000000 esi=00000000 edi=00406100eip=00401516 esp=0012fd74 ebp=0012fe34 iopl=0 nv up ei ng nz na po cycs=001b ss=0023 ds=0023 es=0023 fs=003b gs=0000 efl=00010283LISTDBG!DIVPROC+0x20e:00401516 f7f9 idiv eax,ecx ... [1]
This provides the abnormal end position of "00401516 " ([1]).
b. In order to identify the module held at the address "00401516 " at [1], use the lm command to output a module list.
[lm command output results]
0:000> lmstart end module name002e0000 00324000 F3BIIO (deferred) 00330000 00371000 F3BIFRM (deferred) 00380000 003ca000 F3BIDBG (deferred) 003d0000 003e5000 F3BIOLES (deferred) 003f0000 003f5000 F3BIOVLD (deferred) 00400000 0040a000 LISTDBG C (export symbols) LISTDBG.exe ... [2]00420000 0045a000 F3BIOLER (deferred) 00460000 004a2000 F3BISCRN (deferred) 004b0000 00508000 F3BILPIO (deferred) 00510000 0051e000 F3BISQL (deferred) 00520000 00540000 F3BIPRIO (deferred) 00540000 00551000 F3BISCLS (deferred) 00560000 0056e000 F3BILANP (deferred) 00570000 00588000 F3BIZCOM (deferred) 005a0000 005ae000 F3BIAESV (deferred) 005b0000 005dc000 F3BKATCH (deferred) 005e0000 005f2000 F3BIEFNC (deferred) 00600000 00636000 F3BIEXFH (deferred) 00640000 00665000 F3BICICL (deferred) 00670000 0067f000 F3BINDBC (deferred) 006e0000 006f2000 F3BIFUNC (deferred) 10000000 1006c000 F3BIPRCT (deferred) 6c580000 6c6a2000 IMJP14K (deferred) 6c6b0000 6c7c4000 IMJP14 (deferred) 71c90000 71ce1000 winspool (deferred) 72170000 72177000 wsock32 (deferred) 72180000 7220e000 msvcp90 (deferred) 72410000 72494000 comctl32 (deferred) 72770000 72813000 msvcr90 (deferred) 74810000 74823000 dwmapi (deferred) 74af0000 74b30000 uxtheme (deferred) 750d0000 750d9000 version (deferred) 75b40000 75bad000 sysfer (deferred) 75bb0000 75bfc000 apphelp (deferred) 75dc0000 75e0b000 KERNELBASE (deferred) 76000000 76057000 shlwapi (deferred) 76060000 7606a000 lpk (deferred) 76150000 76d9a000 shell32 (deferred) 76da0000 76e74000 kernel32 (deferred) 76e80000 76f4c000 msctf (deferred) 76f50000 76ff2000 rpcrt4 (deferred) 77000000 77006000 nsi (deferred)
- 127 -

77010000 770bc000 msvcrt (deferred) 770c0000 7715d000 usp10 (deferred)
Since the "00401516 " at [1] is included in "00400000 0040a000 LISTDBG C (export symbols) LISTDBG.exe " at [2], we canidentify that the abnormal end is in the "LISTDBG.exe" module.
c. The Link Map Listing created at the time of linkage using the "/MAP" specification can be used to identify the relevant part of themodule.
[Link Map Listing(LISTDBG.MAP)]
LISTDBG
Timestamp is 53db4524 (Fri Aug 01 16:43:32 2014)
Preferred load address is 00400000 ... [3]
Start Length Name Class 0001:00000000 00003f1eH .text CODE ... Address Publics by Value Rva+Base Lib:Object
0001:00000000 $LISTDBG.CODE 00401000 LISTDBG.OBJ 0001:00000000 _WinMain@16 00401000 f LISTDBG.OBJ 0001:000002d0 $DIVPROC.CODE 004012d0 DIVPROC.OBJ 0001:00000308 _DIVPROC 00401308 f DIVPROC.OBJ ... [4] 0001:0000054a _JMP1PLAN 0040154a f f3bicimp:F3BIPRCT.dll...
Check whether the module loading address "400000" at [2] is the same as the address at [3], "Preferred load address is “00400000".
- If module loading address at [2] and the address at [3] are the same
Compare the address "00401516" at [1] as is with the "Rva+Base" value and find the closest address that is smaller than theaddress at [1].
In this example, this is:
[4]" 0001:00000308 _DIVPROC 00401308 f DIVPROC.OBJ
Then, use the following calculation to obtain the symbol relative offset.
0x00401516 - 0x00401308 = 0x20e
The above results give the following information:
Module : "LISTDBG.exe"Symbol : "DIVPROC"Offset from Symbol: 0x20e
- If module loading address at [2] and the address at [3] are different
Calculate the relative offset of each.
First, obtain the relative offset of the abnormal end position.
0x00401516 - 0x00400000 = 0x1516
Then obtain the relative offsets of the symbol of each.
main 0x00401000 - 0x00400000 = 0x1000LISTDBG 0x00401000 - 0x00400000 = 0x1000DIVPROC 0x00401308 - 0x00400000 = 0x1308 ... [5]JMP1PLAN 0x0040154a - 0x00400000 = 0x154a :
Within the information shown above, find the offset that is closest to and smaller than the offset obtained at 1-.
- 128 -

In this example, this is:
[5]"DIVPROC 0x00401308 - 0x00400000 = 0x1308”
Then, use the following calculation to obtain the symbol relative offset.
0x1516 - 0x1308 = 0x20e
The above results give the following information:
Module : "LISTDBG.exe"Symbol : "DIVPROC"Offset from Symbol: 0x20e
Subsequent tasks are the same as in "Locating Errors (Program Database File)".
5.7.5.3 Researching Data ValuesIf the abnormal end location is a COBOL program or method, use the following to reference that program or method data:
- Files
- Clash Dump
- Compiler listing specifying compiler option SOURCE, COPY and MAP
- Debugging Tools
- WinDbg (Debugging Tools for Windows - native x86)
Note
- The only data that can be referenced at abnormal termination is the data used in the program or method that terminated abnormally.
- Additionally, if the compile option OPTIMIZE is specified, the optimization process may mean that execution results have not beenstored in a particular area and statements may have been moved or deleted. For this reason, examining data areas may not be reliable.
1) Retrieving base addresses of sections
You can find the base address of each section by using the link map listing and the debugger. The following describes where you can findeach section.
COA (.rodata)
Located in the link map listing at the address in the Rva+Base column on the line where the “Publics by Value” column is ‘$program-name.LIT’. [1] in the sample link map listing below.
GWA (.data)
Located in the link map listing at the address in the Rva+Base column on the line where the “Publics by Value” column is ‘$program-name.DATA’. [2] in the sample link map listing below.
GW2 (.bss)
Located in the link map listing at the address in the Rva+Base column on the line where the “Publics by Value” column is ‘$program-name.BSS’. [3] in the sample link map listing below.
EBP (stack)
Represents the EBP register. Find the address in this register using the debugger.
HGW (heap)
The base address of HGW is stored in the BHG pointer. Reference the program control information listing to find the location of theBHG pointer, then use the debugger to obtain the address in the BHG pointer - this is the base address of HGW. [4] in the sampleprogram control information listing below.
- 129 -

HPA (heap)
The base address of HPA is stored in the BOD pointer. Reference the program control information listing to find the location of theBOD pointer, then use the debugger to obtain the address in the BOD pointer - this is the base address of HPA. [5] in the sampleprogram control information listing below.
Sample link map listing, for a program called “A”:
Start Length Name Classv0001:00000000 000043a2H .text CODE :0003:00000030 00002580H .data DATA0003:000025b0 0000052cH .bss DATA0004:00000000 0000025cH .rodata DATA : Address Publics by Value Rva+Base Lib:Object : 0001:00000000 $A.CODE 00401000 A.OBJ 0001:00000000 _main 00401000 f A.OBJ :0003:00000030 $A.DATA [2] 00406030 A.OBJ :0004:00000000 $A.BSS [3] 00409f00 A.OBJ :0005:00000000 $A.LIT [1] 0040a000 A.OBJ :
The BHG and BOD pointers are found in the SGM POINTERS AREA in the program control information listing as illustrated in thefollowing sample:
** STK ** * SCB * EBP+FFFFFF40 SCB FIXED AREA 92 ........ TL 1ST AREA 0 * SGM * EBP+FFFFFF98 SGM POINTERS AREA 8 ........ VPA 0 ........ PSA 0 ........ BVA 0EBP+FFFFFF98 [5] BOD 4 EBP+FFFFFF9C [4] BHG 4. :
2) Retrieving the data address
You obtain information on the data address from the data map listing. For details on data map listing format, see the sections “Format ofData Map Listing” and “Data Map Listing Description” in "5.7.4.1 Data Map Listing".
Note
Data map listing addresses and offsets are written in hexadecimal, Big Endian, format. Addresses stored in memory are written in LittleEndian format, but the debugger expects addresses to be entered in Big Endian format. Therefore the byte order of addresses read frommemory must be reversed before being used, E.g. an address stored in 4 bytes of memory will appear as F8 C4 35 00, but the address is00 35 C4 F8 and this is the number to use when adding offsets or entering into the debugger’s address entry field.
Here is a sample data map listing.
LINE ADDR OFFSET REC-OFFSET LVL NAME LENGTH ATTRIBUTE BASE DIM**LISTDBG1** 6 GWA+000000E8 0 01 answer 2 EXT-DEC BGW.000000 7 GWA+000000EA 0 01 divisor 2 EXT-DEC BGW.000000
- 130 -

9 [GWA+00000020]+00000000 0 01 dividend 2 EXT-DEC BVA.00000110 [HGW+00000024]+00000000 0 01 dynamic-area 2 EXT-DEC BVA.000002
The location of the data is found in the ADDR and OFFSET columns (entries of the form “XXX+number” or “ [XXX+number-1]+number-2”). The length of the stored data is given in the LENGTH column. In the above example:
Data Item Data Stored at Data Area Length
answer Stored at the address produced by adding 000000E8 to the GWA base address. 2 bytes
divisor Stored at the address produced by adding 000000EA to the GWA base address 2 bytes
dividend The square brackets indicate that the (four-byte) base address of the data is storedat the location produced by adding 00000020 to the GWA base address. The datais stored at the location produced by adding the offset (in this case, 0000000) tothis address.
2 bytes
dynamic-area The square brackets indicate that the (four-byte) base address of the data is storedat the location produced by adding 00000024 to the HGW base address. The datais stored at the location produced by adding the offset (in this case, 00000000) tothis address.
2 bytes
3) Examining data values
Having derived the address(es) of the data in step 2 above, you can now use the debugger to examine the contents.
(Remember the note on reading addresses from memory given under step 3!)
1. Start the Debugging Tools for Windows.
2. From the File menu, select the Open Crash Dump command to open the Crash dump.
3. To examine the registers, from the View menu, select the Registers command. The Registers window is displayed. This snapshotshows the EBP register and value highlighted:
4. To examine memory, from the View menu, select the Memory command and enter the address to be referenced in the “Virtual”entry field. The following examples show how addresses are entered and data values examined.
Example
Example 1: Examining the "divisor" data item
The information of "divisor" in our example data map listing is as follows:
7 GWA+000000EA 0 01 divisor 2 EXT-DEC BGW.000000
- 131 -

The link map file shows the GWA base address to be 00406030.
We can let the debugger add the offset (0xEA) to the base address for us by entering “00406030+EA” in the address bar:
The debugger positions you at the resulting address. The above snapshot shows the 2 byte value of “divisor” to be 0x3030 (we added thehighlighting by selecting the two bytes - the debugger doesn’t “know” that the data item at this offset is 2 bytes long - and similarly inthe following examples).
Example 2: Examining the "dividend" data item
The information of "dividend" in our sample data map listing is as follows:
9 [GWA+00000020]+00000000 0 01 dividend 2 EXT-DEC BVA.000001
In an indirect reference such as this, the actual address of the data item is stored at the location indicated by [GWA+00000020].
As in example 1, the GWA base address is 00406030, so we enter 00406030+20 in the address bar:
The four bytes at this address (highlighted) make up the address of the “dividend” data item. However, remember that addresses storedin memory are in reverse byte order, To derive the address in the Big Endian format used for entering the data we must reverse the orderof the bytes: 004061f8.
The “dividend" data content is stored at 004061f8+00000000. So we enter the address 004061f8 in the address bar. (+0000000 is omitted.)
This shows the data content of the “dividend” data item to be 0x3130.
Example 3: Examining the "dynamic-area" data item
The information of "dynamic-area" in our sample data map listing is:
10 [HGW+00000024]+00000000 0 01 dynamic-area 2 EXT-DEC BVA.000002
- 132 -

Because the HGW base address is stored in the BHG pointer we must first find that value. From the program control information listingwe find that BHG is at the address EBP+FFFFFF9C. So, we first enter EBP+FFFFFF9C in the address bar (the debugger accepts registernames as part of the address expressions):
This shows that the HGW base address is 00c42a14.
Next, we look up the actual address stored at [HGW+00000024]. We therefore enter 00c42a14+24 in the address bar:
So the (base) address for the “dynamic-area” item is 00406118.
The content of “dynamic-area” is stored at 00406118+00000000. We enter 00406118 in the address bar. (+0000000 is omitted.)
This shows the data content of “dynamic-area” to be 0x3130.
Similarly, in the case of an address based on HPA such as: [HPA+xxxxxxxx]+yyyyyyyy,
we start with the BOD pointer to obtain the HPA base address and go on to examine the variable area.
- 133 -

Appendix A Debugger Command ListsThis appendix lists the debugger commands. For details on the command specification format, refer to Help.
Table A.1 Debugger Commands
Command Name Function
ALTERTHREAD Change the thread status.
ASSIGNDATA Allocate a data file.
AUTORUN Debugs automatically.
BREAK Sets a breakpoint.
CALLS Displays the calling path.
CLOSEDATA Close a data file.
CONTINUE Resumes execution.
COUNT Sets a passage count point.
CURRENTTHREAD Change the implicit thread.
DATACHK Monitors satisfaction of a conditional expression.
DELCOUNT Cancels a passage count point.
DELDCHK Cancels monitoring satisfaction of a conditional expression.
DELDTR Cancels monitoring changes in data item contents.
DELETE Cancels a breakpoint.
DELMON Cancels monitoring for changes in a data item.
DTRACE Monitors change in data item contents. (No interruption at change)
ENV Sets up and changes the debug environment.
LINKAGE Acquires a data area in the linkage section.
LIST References data area contents.
MONITOR Monitors changes in data item contents. (Interruption at change)
OPENDATA Open a data file.
READDATA Read from a data file.
RERUN Re-debug.
RUNTO Executes with a breakpoint specification.
SCOPE Changes program qualification.
SET Changes data area contents.
SKIP Changes the current execution position.
STATUS Displays debug status.
QUIT Ends debugging
THREADLIST Displays thread status.
WHERE Displays the current execution position.
WRITEDATA Write into a data file.
- 134 -

Index[A]
accelerator keys........................................................................ 13automatic debugging.................................................................22
[B]base addresses.........................................................................129Big Endian.............................................................................. 130breaking execution when data changes.................................... 18
[C]call stack window..................................................................... 16changing data contents..............................................................17changing statement execution sequence................................... 18CHECK function............................................................ 59,62,63checking data contents..............................................................17checking data modification locations....................................... 18COA........................................................................................116COBOL Error Report.......................................................... 59,84COBOL Runtime Options................................................... 48,53command file............................................................................ 22command line........................................................................... 45COUNT function................................................................. 59,76count information..................................................................... 76count information .................................................................... 76
[D]data addresses......................................................................... 130data address formats............................................................... 130data file I/O...............................................................................24data map listing.......................................................................110debugging functions................................................................. 59DEBUG linker option...............................................................87DEBUGTYPE linker option.....................................................87Dump...................................................................................... 108
[E]EBP.........................................................................................116
[F]functions, using ........................................................................17
[G]GW2........................................................................................116GWA.......................................................................................116
[H]HGW.......................................................................................116HPA........................................................................................ 116
[I]information file........................................................................... 6interactive debugger................................................................... 4
[L]line-number...............................................................................61line command window.........................................................14,15Little Endian........................................................................... 130locating errors......................................................................... 120
[M]main window............................................................................ 13menu commands....................................................................... 13message count...........................................................................65message output count................................................................70method for starting the debugger from the program you want todebug.......................................................................................... 9
[N]NONUMBER........................................................................... 61NUMBER................................................................................. 61
[O]object program list ................................................................. 114object program listing.............................................................114OPTIMIZE option................................................................. 6,87
[P]PowerCOBOL.......................................................................... 48program control information listing....................................... 110program list window.................................................................14
[R]relative address....................................................................... 117
[S]section size listing...................................................................120sequence number...................................................................... 61shortcut menu........................................................................... 13source file window....................................................................14source program listing............................................................ 113specifying start-parameters.......................................................42Start Debugging dialog box......................................................42starting with options set............................................................12start parameters.........................................................................12statement number......................................................................61status bar................................................................................... 16SVD file...............................................................................11,43SVD File................................................................................... 51
[T]TEST option.......................................................................... 6,87thread list window.................................................................... 16toolbar buttons.......................................................................... 13TRACE function..................................................................59,71trace information.............................................................72,73,75trace information items.............................................................72tracing the execution path.........................................................19
[V]verb-sequence-number-in-line-number.................................... 61Visual Basic, debugging with...................................................52
[W]watch window...........................................................................15way to start the remote debugger from the program the you wantto debug.................................................................................... 34
- 135 -


![COBOL文法書Sun [Sun] Oracle Solaris NetCOBOL V10 Win16 [Win16] Windows 95 COBOL85 V20L11 Windows 3.1 COBOL85 V20L11 Win32 [Win32] Windows 2000 NetCOBOL V10 Windows XP NetCOBOL V10](https://img.pdfslide.net/doc/110x75/60d2f11af182c74c0526bba8/cobol-sun-sun-oracle-solaris-netcobol-v10-win16-win16-windows-95-cobol85.jpg)


![NetCOBOL V11.1 FUJITSU Softwaresoftware.fujitsu.com/jp/manual/manualfiles/m170002/b1wd3304/05e… · [Win16] Windows 95 Windows 3.1 COBOL V20L11 [Win32] Windows Server 2012 R2 Windows](https://img.pdfslide.net/doc/110x75/6091023460f1733bfd3d59c8/netcobol-v111-fujitsu-win16-windows-95-windows-31-cobol-v20l11-win32-windows.jpg)