Embed Size (px)
Citation preview

©2019 VMware, Inc.
Debugging your Linux Kernel
with Ftrace
Steven Rostedt
Open Source Engineer
2019-03-10

2©2019 VMware, Inc.
There’s just too much to cover in this short time
Will go through what is available
Will show where to find documentation
Feel free to “try” to keep up
This is NOT a tutorial

3©2019 VMware, Inc.
The official tracer of the Linux kernel
Most distributions have Ftrace configured in their kernels
Must be “root” to access it
• It gives you info that security folks don’t want you to see
Fully functional with just “echo” and “cat” commands
• Also have tooling● trace-cmd● KernelShark
What is Ftrace?

4©2019 VMware, Inc.
Let’s jump right in
We’ll learn from examples No time to get bogged down on teaching Ftrace
This is about debugging the kernel Not about learing Ftrace Just using Ftrace to get the job done

5©2019 VMware, Inc.
Just the basics
There are tracers and events
Tracers function function_graph preemptirqsoff etc
Events scheduling interrupts exceptions etc

6©2019 VMware, Inc.
Where do we find ftrace?
Most distributions mount: /sys/kernel/debug find the “tracing” directory there
Can also mount the tracing directory directly mount -t tracefs nodev /sys/kernel/tracing

7©2019 VMware, Inc.
Let’s look at the tracing directory
# mount -t tracefs nodev /sys/kernel/tracing# cd /sys/kernel/tracing# ls
available_events per_cpu stack_traceavailable_filter_functions printk_formats stack_trace_filteravailable_tracers README timestamp_modebuffer_size_kb saved_cmdlines tracebuffer_total_size_kb saved_cmdlines_size trace_clockcurrent_tracer saved_tgids trace_markerdyn_ftrace_total_info set_event trace_marker_rawenabled_functions set_event_pid trace_optionsevents set_ftrace_filter trace_pipefree_buffer set_ftrace_notrace tracing_cpumaskinstances set_ftrace_pid tracing_max_latencykprobe_events set_graph_function tracing_onkprobe_profile set_graph_notrace tracing_threshmax_graph_depth snapshot uprobe_eventsoptions stack_max_size uprobe_profile

8©2019 VMware, Inc.
Enabling a tracer
Write the name into “current_tracer”
“nop” is how to disable a tracer
# echo function > current_tracer# echo nop > current_tracer

9©2019 VMware, Inc.
Where to see the output
Read the “trace” file
# echo function > current_tracer# cat trace
# tracer: function## _-----=> irqs-off# / _----=> need-resched# | / _---=> hardirq/softirq# || / _--=> preempt-depth# ||| / delay# TASK-PID CPU# |||| TIMESTAMP FUNCTION# | | | |||| | | soffice.bin-1850 [003] .... 1277817.313622: __fget_light <-sockfd_lookup_light soffice.bin-1850 [003] .... 1277817.313622: __fget <-__fget_light soffice.bin-1850 [003] .... 1277817.313623: ___sys_recvmsg <-__sys_recvmsg soffice.bin-1850 [003] .... 1277817.313623: copy_msghdr_from_user <-___sys_recvmsg soffice.bin-1850 [003] .... 1277817.313624: rw_copy_check_uvector <-import_iovec soffice.bin-1850 [003] .... 1277817.313624: __check_object_size <-rw_copy_check_uvector soffice.bin-1850 [003] .... 1277817.313624: __virt_addr_valid <-__check_object_size soffice.bin-1850 [003] .... 1277817.313625: check_stack_object <-__check_object_size soffice.bin-1850 [003] .... 1277817.313625: sock_recvmsg <-___sys_recvmsg soffice.bin-1850 [003] .... 1277817.313625: security_socket_recvmsg <-sock_recvmsg soffice.bin-1850 [003] .... 1277817.313626: apparmor_socket_recvmsg <-security_socket_recvmsg

10©2019 VMware, Inc.
Stop writing to the trace buffer
Stop updates to the trace without clearing it.
Note, tracing is still happening, just not recording (will have overhead)
# echo function > current_tracer# echo 0 > tracing_on# cat trace
# tracer: function## _-----=> irqs-off# / _----=> need-resched# | / _---=> hardirq/softirq# || / _--=> preempt-depth# ||| / delay# TASK-PID CPU# |||| TIMESTAMP FUNCTION# | | | |||| | | xfwm4-17105 [001] d... 1278457.346868: hrtick_update <-ttwu_do_activate xfwm4-17105 [001] d... 1278457.346868: ttwu_do_wakeup <-try_to_wake_up xfwm4-17105 [001] d... 1278457.346869: check_preempt_curr <-ttwu_do_wakeup xfwm4-17105 [001] d... 1278457.346869: resched_curr <-check_preempt_curr xfwm4-17105 [001] d... 1278457.346870: ttwu_stat <-try_to_wake_up xfwm4-17105 [001] d... 1278457.346870: _raw_spin_unlock_irqrestore <-try_to_wake_up xfwm4-17105 [001] d... 1278457.346871: _raw_spin_unlock_irqrestore <-ep_poll_callback xfwm4-17105 [001] d... 1278457.346871: _raw_spin_unlock_irqrestore <-__wake_up_common_lock

11©2019 VMware, Inc.
tracing_on (Caution)
Writing ASCII “0” into the file, stops tracing
Writing ASCII “1” into the file starts tracing
Note, be sure to add a space between the number and ‘>’
Do this:
Not this:
# echo 0 > tracing_on# echo 1 > tracing_on
# echo 0>tracing_on# echo 1>tracing_on

12©2019 VMware, Inc.
tracing_on (Caution)
Writing ASCII “0” into the file, stops tracing
Writing ASCII “1” into the file starts tracing
Note, be sure to add a space between the number and ‘>’
Do this:
Not this:
# echo 0 > tracing_on# echo 1 > tracing_on
# echo 0>tracing_on# echo 1>tracing_on
Why?

13©2019 VMware, Inc.
tracing_on (Caution)
Writes standard input and standard output into tracing_on respectively
# echo 0>tracing_on# echo 1>tracing_on

14©2019 VMware, Inc.
Trace Events
Displays various information about a point in the kernel
Created by the subsystem maintainers Supplies data fields that they feel is important
Grouped together by “system”s

15©2018 VMware, Inc.
Trace Event Systems
# ls events
alarmtimer fib6 iommu napi rseq udpasoc filelock irq net rtc v4l2block filemap irq_matrix nmi sched vb2bridge fs_dax irq_vectors oom scsi vmscanbtrfs ftrace jbd2 page_isolation signal vsyscallcfg80211 gpio kmem pagemap skb wbtcgroup hda kvm percpu smbus workqueueclk hda_controller kvmmmu power sock writebackcompaction hda_intel libata printk spi x86_fpucpuhp header_event mac80211 qdisc sunrpc xdpdevlink header_page mce random swiotlb xendma_fence huge_memory mei ras syscalls xfsdrm hyperv migrate raw_syscalls task xhci-hcdenable i2c mmc rcu tcpexceptions i915 module regmap thermalext4 initcall mpx regulator timerfib intel-sst msr rpm tlb

16©2019 VMware, Inc.
Enabling Trace Events
# echo 1 > events/sched/sched_waking/enable
Enabling a specific trace event
Enabling all events in a system
Enabling all events at once
# echo 1 > events/sched/enable
# echo 1 > events/enable

17©2019 VMware, Inc.
Disabling Trace Events
# echo 0 > events/sched/sched_waking/enable
Disabling a specific trace event
Disabling all events in a system
Disabling all events at once
# echo 0 > events/sched/enable
# echo 0 > events/enable

18©2019 VMware, Inc.
Debugging the Linux kernel
Performance issues
Warning messages
Hung tasks
Corrupted data
Kernel Crashes Even at boot up!

19©2019 VMware, Inc.
Performance issues
All Tracing has time stamps
Function Graph tracer records the time a kernel function runs

20©2018 VMware, Inc.
See interrupt latency# echo do_IRQ > set_ftrace_filter# echo 0 > tracing_on# echo function_graph > current_tracer# echo 1 > events/irq/enable# echo 1 > options/funcgraph-abstime# echo 1 > tracing_on# cat trace
# tracer: function_graph## TIME CPU DURATION FUNCTION CALLS# | | | | | | | |336316.242142 | 0) ==========> |336316.242142 | 0) | do_IRQ() {336316.242144 | 0) | /* irq_handler_entry: irq=9 name=acpi */336316.242301 | 0) | /* irq_handler_exit: irq=9 ret=handled */336316.242303 | 0) ! 160.658 us | }336316.242303 | 0) <========== |336316.245424 | 0) | /* softirq_raise: vec=1 [action=TIMER] */336316.245431 | 0) | /* softirq_entry: vec=1 [action=TIMER] */336316.245432 | 0) | /* softirq_exit: vec=1 [action=TIMER] */336316.246906 | 0) ==========> |336316.246906 | 0) | do_IRQ() {336316.246924 | 0) | /* irq_handler_entry: irq=51 name=DELL0823:00 */336316.246926 | 0) | /* irq_handler_exit: irq=51 ret=handled */336316.246937 | 0) + 33.511 us | }336316.246937 | 0) <========== |336316.246973 | 0) ==========> |336316.246973 | 0) | do_IRQ() {336316.246974 | 0) | /* irq_handler_entry: irq=17 name=i2c_designware.1 */336316.246989 | 0) | /* irq_handler_exit: irq=17 ret=handled */336316.246991 | 0) | /* irq_handler_entry: irq=17 name=idma64.1 */336316.246996 | 0) | /* irq_handler_exit: irq=17 ret=unhandled */336316.246998 | 0) + 25.292 us | }336316.246998 | 0) <========== |

21©2018 VMware, Inc.
See interrupt latency# echo do_IRQ > set_ftrace_filter# echo 0 > tracing_on# echo function_graph > current_tracer# echo 1 > events/irq/enable# echo 1 > options/funcgraph-abstime# echo 1 > tracing_on# cat trace
# tracer: function_graph## TIME CPU DURATION FUNCTION CALLS# | | | | | | | |336316.242142 | 0) ==========> |336316.242142 | 0) | do_IRQ() {336316.242144 | 0) | /* irq_handler_entry: irq=9 name=acpi */336316.242301 | 0) | /* irq_handler_exit: irq=9 ret=handled */336316.242303 | 0) ! 160.658 us | }336316.242303 | 0) <========== |336316.245424 | 0) | /* softirq_raise: vec=1 [action=TIMER] */336316.245431 | 0) | /* softirq_entry: vec=1 [action=TIMER] */336316.245432 | 0) | /* softirq_exit: vec=1 [action=TIMER] */336316.246906 | 0) ==========> |336316.246906 | 0) | do_IRQ() {336316.246924 | 0) | /* irq_handler_entry: irq=51 name=DELL0823:00 */336316.246926 | 0) | /* irq_handler_exit: irq=51 ret=handled */336316.246937 | 0) + 33.511 us | }336316.246937 | 0) <========== |336316.246973 | 0) ==========> |336316.246973 | 0) | do_IRQ() {336316.246974 | 0) | /* irq_handler_entry: irq=17 name=i2c_designware.1 */336316.246989 | 0) | /* irq_handler_exit: irq=17 ret=handled */336316.246991 | 0) | /* irq_handler_entry: irq=17 name=idma64.1 */336316.246996 | 0) | /* irq_handler_exit: irq=17 ret=unhandled */336316.246998 | 0) + 25.292 us | }336316.246998 | 0) <========== |

22©2018 VMware, Inc.
See interrupt latency# echo do_IRQ > set_ftrace_filter# echo 0 > tracing_on# echo function_graph > current_tracer# echo 1 > events/irq/enable# echo 1 > options/funcgraph-abstime# echo 1 > tracing_on# cat trace
# tracer: function_graph## TIME CPU DURATION FUNCTION CALLS# | | | | | | | |336316.242142 | 0) ==========> |336316.242142 | 0) | do_IRQ() {336316.242144 | 0) | /* irq_handler_entry: irq=9 name=acpi */336316.242301 | 0) | /* irq_handler_exit: irq=9 ret=handled */336316.242303 | 0) ! 160.658 us | }336316.242303 | 0) <========== |336316.245424 | 0) | /* softirq_raise: vec=1 [action=TIMER] */336316.245431 | 0) | /* softirq_entry: vec=1 [action=TIMER] */336316.245432 | 0) | /* softirq_exit: vec=1 [action=TIMER] */336316.246906 | 0) ==========> |336316.246906 | 0) | do_IRQ() {336316.246924 | 0) | /* irq_handler_entry: irq=51 name=DELL0823:00 */336316.246926 | 0) | /* irq_handler_exit: irq=51 ret=handled */336316.246937 | 0) + 33.511 us | }336316.246937 | 0) <========== |336316.246973 | 0) ==========> |336316.246973 | 0) | do_IRQ() {336316.246974 | 0) | /* irq_handler_entry: irq=17 name=i2c_designware.1 */336316.246989 | 0) | /* irq_handler_exit: irq=17 ret=handled */336316.246991 | 0) | /* irq_handler_entry: irq=17 name=idma64.1 */336316.246996 | 0) | /* irq_handler_exit: irq=17 ret=unhandled */336316.246998 | 0) + 25.292 us | }336316.246998 | 0) <========== |

23©2018 VMware, Inc.
See interrupt latency# echo do_IRQ > set_ftrace_filter# echo 0 > tracing_on# echo function_graph > current_tracer# echo 1 > events/irq/enable# echo 1 > options/funcgraph-abstime# echo 1 > tracing_on# cat trace
# tracer: function_graph## TIME CPU DURATION FUNCTION CALLS# | | | | | | | |336316.242142 | 0) ==========> |336316.242142 | 0) | do_IRQ() {336316.242144 | 0) | /* irq_handler_entry: irq=9 name=acpi */336316.242301 | 0) | /* irq_handler_exit: irq=9 ret=handled */336316.242303 | 0) ! 160.658 us | }336316.242303 | 0) <========== |336316.245424 | 0) | /* softirq_raise: vec=1 [action=TIMER] */336316.245431 | 0) | /* softirq_entry: vec=1 [action=TIMER] */336316.245432 | 0) | /* softirq_exit: vec=1 [action=TIMER] */336316.246906 | 0) ==========> |336316.246906 | 0) | do_IRQ() {336316.246924 | 0) | /* irq_handler_entry: irq=51 name=DELL0823:00 */336316.246926 | 0) | /* irq_handler_exit: irq=51 ret=handled */336316.246937 | 0) + 33.511 us | }336316.246937 | 0) <========== |336316.246973 | 0) ==========> |336316.246973 | 0) | do_IRQ() {336316.246974 | 0) | /* irq_handler_entry: irq=17 name=i2c_designware.1 */336316.246989 | 0) | /* irq_handler_exit: irq=17 ret=handled */336316.246991 | 0) | /* irq_handler_entry: irq=17 name=idma64.1 */336316.246996 | 0) | /* irq_handler_exit: irq=17 ret=unhandled */336316.246998 | 0) + 25.292 us | }336316.246998 | 0) <========== |

24©2018 VMware, Inc.
See interrupt latency# echo do_IRQ > set_ftrace_filter# echo 0 > tracing_on# echo function_graph > current_tracer# echo 1 > events/irq/enable# echo 1 > options/funcgraph-abstime# echo 1 > tracing_on# cat trace
# tracer: function_graph## TIME CPU DURATION FUNCTION CALLS# | | | | | | | |336316.242142 | 0) ==========> |336316.242142 | 0) | do_IRQ() {336316.242144 | 0) | /* irq_handler_entry: irq=9 name=acpi */336316.242301 | 0) | /* irq_handler_exit: irq=9 ret=handled */336316.242303 | 0) ! 160.658 us | }336316.242303 | 0) <========== |336316.245424 | 0) | /* softirq_raise: vec=1 [action=TIMER] */336316.245431 | 0) | /* softirq_entry: vec=1 [action=TIMER] */336316.245432 | 0) | /* softirq_exit: vec=1 [action=TIMER] */336316.246906 | 0) ==========> |336316.246906 | 0) | do_IRQ() {336316.246924 | 0) | /* irq_handler_entry: irq=51 name=DELL0823:00 */336316.246926 | 0) | /* irq_handler_exit: irq=51 ret=handled */336316.246937 | 0) + 33.511 us | }336316.246937 | 0) <========== |336316.246973 | 0) ==========> |336316.246973 | 0) | do_IRQ() {336316.246974 | 0) | /* irq_handler_entry: irq=17 name=i2c_designware.1 */336316.246989 | 0) | /* irq_handler_exit: irq=17 ret=handled */336316.246991 | 0) | /* irq_handler_entry: irq=17 name=idma64.1 */336316.246996 | 0) | /* irq_handler_exit: irq=17 ret=unhandled */336316.246998 | 0) + 25.292 us | }336316.246998 | 0) <========== |

25©2018 VMware, Inc.
See interrupt latency# echo do_IRQ > set_ftrace_filter# echo 0 > tracing_on# echo function_graph > current_tracer# echo 1 > events/irq/enable# echo 1 > options/funcgraph-abstime# echo 1 > tracing_on# cat trace
# tracer: function_graph## TIME CPU DURATION FUNCTION CALLS# | | | | | | | |336316.242142 | 0) ==========> |336316.242142 | 0) | do_IRQ() {336316.242144 | 0) | /* irq_handler_entry: irq=9 name=acpi */336316.242301 | 0) | /* irq_handler_exit: irq=9 ret=handled */336316.242303 | 0) ! 160.658 us | }336316.242303 | 0) <========== |336316.245424 | 0) | /* softirq_raise: vec=1 [action=TIMER] */336316.245431 | 0) | /* softirq_entry: vec=1 [action=TIMER] */336316.245432 | 0) | /* softirq_exit: vec=1 [action=TIMER] */336316.246906 | 0) ==========> |336316.246906 | 0) | do_IRQ() {336316.246924 | 0) | /* irq_handler_entry: irq=51 name=DELL0823:00 */336316.246926 | 0) | /* irq_handler_exit: irq=51 ret=handled */336316.246937 | 0) + 33.511 us | }336316.246937 | 0) <========== |336316.246973 | 0) ==========> |336316.246973 | 0) | do_IRQ() {336316.246974 | 0) | /* irq_handler_entry: irq=17 name=i2c_designware.1 */336316.246989 | 0) | /* irq_handler_exit: irq=17 ret=handled */336316.246991 | 0) | /* irq_handler_entry: irq=17 name=idma64.1 */336316.246996 | 0) | /* irq_handler_exit: irq=17 ret=unhandled */336316.246998 | 0) + 25.292 us | }336316.246998 | 0) <========== |

26©2018 VMware, Inc.
See interrupt latency# echo do_IRQ > set_ftrace_filter# echo 0 > tracing_on# echo function_graph > current_tracer# echo 1 > events/irq/enable# echo 1 > options/funcgraph-abstime# echo 1 > tracing_on# cat trace
# tracer: function_graph## TIME CPU DURATION FUNCTION CALLS# | | | | | | | |336316.242142 | 0) ==========> |336316.242142 | 0) | do_IRQ() {336316.242144 | 0) | /* irq_handler_entry: irq=9 name=acpi */336316.242301 | 0) | /* irq_handler_exit: irq=9 ret=handled */336316.242303 | 0) ! 160.658 us | }336316.242303 | 0) <========== |336316.245424 | 0) | /* softirq_raise: vec=1 [action=TIMER] */336316.245431 | 0) | /* softirq_entry: vec=1 [action=TIMER] */336316.245432 | 0) | /* softirq_exit: vec=1 [action=TIMER] */336316.246906 | 0) ==========> |336316.246906 | 0) | do_IRQ() {336316.246924 | 0) | /* irq_handler_entry: irq=51 name=DELL0823:00 */336316.246926 | 0) | /* irq_handler_exit: irq=51 ret=handled */336316.246937 | 0) + 33.511 us | }336316.246937 | 0) <========== |336316.246973 | 0) ==========> |336316.246973 | 0) | do_IRQ() {336316.246974 | 0) | /* irq_handler_entry: irq=17 name=i2c_designware.1 */336316.246989 | 0) | /* irq_handler_exit: irq=17 ret=handled */336316.246991 | 0) | /* irq_handler_entry: irq=17 name=idma64.1 */336316.246996 | 0) | /* irq_handler_exit: irq=17 ret=unhandled */336316.246998 | 0) + 25.292 us | }336316.246998 | 0) <========== |

27©2019 VMware, Inc.
set_ftrace_filter and set_ftrace_notrace
Only trace the functions you are interested it Just echo function names into the files
# echo foo > set_ftrace_notrace

28©2019 VMware, Inc.
set_ftrace_filter and set_ftrace_notrace
Only trace the functions you are interested it Just echo function names into the files
# echo foo > set_ftrace_notrace Can add more than one at a time (white space delimited)
# echo foo bar > set_ftrace_filter

29©2019 VMware, Inc.
set_ftrace_filter and set_ftrace_notrace
Only trace the functions you are interested it Just echo function names into the files
# echo foo > set_ftrace_notrace Can add more than one at a time (white space delimited)
# echo foo bar > set_ftrace_filter Append with the bash concatenation “>>”
# echo zoot >> set_ftrace_filter

30©2019 VMware, Inc.
set_ftrace_filter and set_ftrace_notrace
Only trace the functions you are interested it Just echo function names into the files
# echo foo > set_ftrace_notrace Can add more than one at a time (white space delimited)
# echo foo bar > set_ftrace_filter Append with the bash concatenation “>>”
# echo zoot >> set_ftrace_filter Clear with just writing nothing into it
# echo > set_ftrace_notrace

31©2019 VMware, Inc.
Documentation on Ftrace
linux.git/Documentation/trace/ftrace.rst

32©2018 VMware, Inc.
ftrace - a tool for everyone with BusyBox
Everything we did so far used echo or cat
Makes using ftrace extremely simple on limited systems
But can be very tedious Lots of things to remember (what file does what) Not very intuitive Can be painstaking Hard to do batch processing Hard to record specific functions

33©2018 VMware, Inc.
Introducing trace-cmd
An executable that interacts with the ftrace interface
No need to worry about mounting the tracefs system It does it for you
Saves the data to a file Uses per_cpu/cpuX/trace_pipe_raw Reads the binary data directly from the ring buffer Uses splice(2) to write directly to a file or network (zero copy)

34©2018 VMware, Inc.
Introducing trace-cmd
Download from the git repo (also included in some distros) Don’t use the distro version (yet)
make; make doc
sudo make install; sudo make install_doc
man trace-cmd
man trace-cmd record
man trace-cmd report
git.kernel.org/pub/scm/utils/trace-cmd/trace-cmd.git/

35©2019 VMware, Inc.
Anecdote
CONFIG_NOHZ_FULL If only one task is running on a CPU If it does not call system calls Define on the kernel command line
– nohz_full=2,3 rcu_nocbs=2,3
It prevents timer ticks from happening (ideally)
But does it work?

36©2019 VMware, Inc.
Running a single task (NO_HZ_FULL)
Test program by Frederic Weisbecker
diff --git a/user_loop.c b/user_loop.cindex 3cdc4f3..f8aa440 100644--- a/user_loop.c+++ b/user_loop.c@@ -1,5 +1,7 @@+#include <sys/mman.h> int main(void) {+ mlockall(MCL_FUTURE); while (1);
git://git.kernel.org/pub/scm/linux/kernel/git/frederic/dynticks-testing.git

37©2019 VMware, Inc.
Tracing a single task (NO_HZ_FULL)# trace-cmd record -p function_graph --max-graph-depth 1 -e irq -e sched -e timer \ taskset -c 3 ./user_loop
[ hit Ctrl^C]
# trace-cmd report -l --cpu 3
taskset-5953 3d... 51830.773222: funcgraph_entry: | do_syscall_64() { taskset-5953 3d... 51830.773225: funcgraph_exit: 3.119 us | } taskset-5953 3d... 51831.322685: funcgraph_entry: | __context_tracking_exit() { taskset-5953 3d... 51831.322687: funcgraph_exit: 2.477 us | } taskset-5953 3d... 51831.322687: funcgraph_entry: | smp_call_function_single_interrupt() { taskset-5953 3d..1 51831.322692: hrtimer_cancel: hrtimer=0xffff92eb1a8db4c0 taskset-5953 3d..1 51831.322694: hrtimer_start: hrtimer=0xffff92eb1a8db4c0 function=tick_sched_timer/0x0 expires=51830911844813 taskset-5953 3d... 51831.322695: funcgraph_exit: 8.021 us | } taskset-5953 3d... 51831.322696: funcgraph_entry: | __context_tracking_enter() { taskset-5953 3d... 51831.322696: funcgraph_exit: 0.768 us | } taskset-5953 3d... 51831.826632: funcgraph_entry: | __context_tracking_exit() { taskset-5953 3d... 51831.826635: funcgraph_exit: 3.147 us | } taskset-5953 3d... 51831.826635: funcgraph_entry: | smp_apic_timer_interrupt() { taskset-5953 3d.h1 51831.826637: hrtimer_cancel: hrtimer=0xffff92eb1a8db4c0 taskset-5953 3d.h. 51831.826638: hrtimer_expire_entry: hrtimer=0xffff92eb1a8db4c0 now=51830911853062 function=tick_sched_timer/0x0 taskset-5953 3d.h. 51831.826641: softirq_raise: vec=1 [action=TIMER] taskset-5953 3d.h1 51831.826643: sched_stat_runtime: comm=user_loop pid=5953 runtime=159905673 [ns] vruntime=1052796792 [ns] taskset-5953 3d.h. 51831.826653: hrtimer_expire_exit: hrtimer=0xffff92eb1a8db4c0 taskset-5953 3..s. 51831.826656: softirq_entry: vec=1 [action=TIMER] taskset-5953 3d.s1 51831.826658: timer_cancel: timer=0xffffffff869a5080 taskset-5953 3..s. 51831.826660: timer_expire_entry: timer=0xffffffff869a5080 function=clocksource_watchdog now=4346497312 taskset-5953 3d.s2 51831.826667: timer_start: timer=0xffffffff869a5080 function=clocksource_watchdog expires=4346497805 [timeout=493] cpu=4 idx=100 flags=D|P|I taskset-5953 3d.s2 51831.826669: sched_wake_idle_without_ipi: cpu=4 taskset-5953 3..s. 51831.826670: timer_expire_exit: timer=0xffffffff869a5080 taskset-5953 3..s. 51831.826672: softirq_exit: vec=1 [action=TIMER] taskset-5953 3d..1 51831.826676: hrtimer_start: hrtimer=0xffff92eb1a8db4c0 function=tick_sched_timer/0x0 expires=52107103844813 taskset-5953 3d... 51831.826678: funcgraph_exit: + 42.795 us | }

38©2019 VMware, Inc.
Introducing KernelShark 1.0
GUI front-end to trace-cmd
KernelShark was create in 2009 GTK version
VMware hired someone to work on it full time Rewritten from scratch (By Yordan Karadzhov) Uses Qt
Lives in the trace-cmd.git repo
make gui
sudo make install_gui

39©2019 VMware, Inc.
KernelShark 1.0

40©2019 VMware, Inc.
NO_HZ with an issue?

41©2019 VMware, Inc.
NO_HZ with an issue?

42©2019 VMware, Inc.
NO_HZ with an issue?

43©2018 VMware, Inc.
smp_call_function_single_interrupt()
__visible void __irq_entry smp_call_function_interrupt(struct pt_regs *regs){
ipi_entering_ack_irq();trace_call_function_entry(CALL_FUNCTION_VECTOR);inc_irq_stat(irq_call_count);generic_smp_call_function_interrupt();trace_call_function_exit(CALL_FUNCTION_VECTOR);exiting_irq();
}

44©2018 VMware, Inc.
smp_call_function_single_interrupt()
llist_for_each_entry_safe(csd, csd_next, entry, llist) {smp_call_func_t func = csd->func;void *info = csd->info;
/* Do we wait until *after* callback? */if (csd->flags & CSD_FLAG_SYNCHRONOUS) {
func(info);csd_unlock(csd);
} else {csd_unlock(csd);func(info);
}}

45©2018 VMware, Inc.
Tracing a single task (NO_HZ_FULL)# trace-cmd record -p function_graph -g smp_call_function_single_interrupt \ -e irq -e sched -e timer taskset -c 3 ./user_loop
[ hit Ctrl^C]
# trace-cmd report -l --cpu 3
[..]
taskset-38998 [003] 56399.881315: funcgraph_entry: | smp_call_function_single_interrupt() {taskset-38998 [003] 56399.881316: funcgraph_entry: | irq_enter() {taskset-38998 [003] 56399.881316: funcgraph_entry: | rcu_irq_enter() {taskset-38998 [003] 56399.881316: funcgraph_exit: 0.122 us | }taskset-38998 [003] 56399.881316: funcgraph_entry: | irqtime_account_irq() {taskset-38998 [003] 56399.881316: funcgraph_exit: 0.151 us | }taskset-38998 [003] 56399.881316: funcgraph_entry: | preempt_count_add() {taskset-38998 [003] 56399.881316: funcgraph_exit: 0.133 us | }taskset-38998 [003] 56399.881316: funcgraph_exit: 0.891 us | }taskset-38998 [003] 56399.881317: funcgraph_entry: | generic_smp_call_function_single_interrupt() {taskset-38998 [003] 56399.881317: funcgraph_entry: | flush_smp_call_function_queue() {taskset-38998 [003] 56399.881317: funcgraph_entry: | aperfmperf_snapshot_khz() {taskset-38998 [003] 56399.881317: funcgraph_entry: | ktime_get() {taskset-38998 [003] 56399.881317: funcgraph_exit: 0.159 us | }taskset-38998 [003] 56399.881317: funcgraph_exit: 0.510 us | }taskset-38998 [003] 56399.881318: funcgraph_exit: 0.858 us | }taskset-38998 [003] 56399.881318: funcgraph_exit: 1.095 us | }
[..]
46©2018 VMware, Inc.
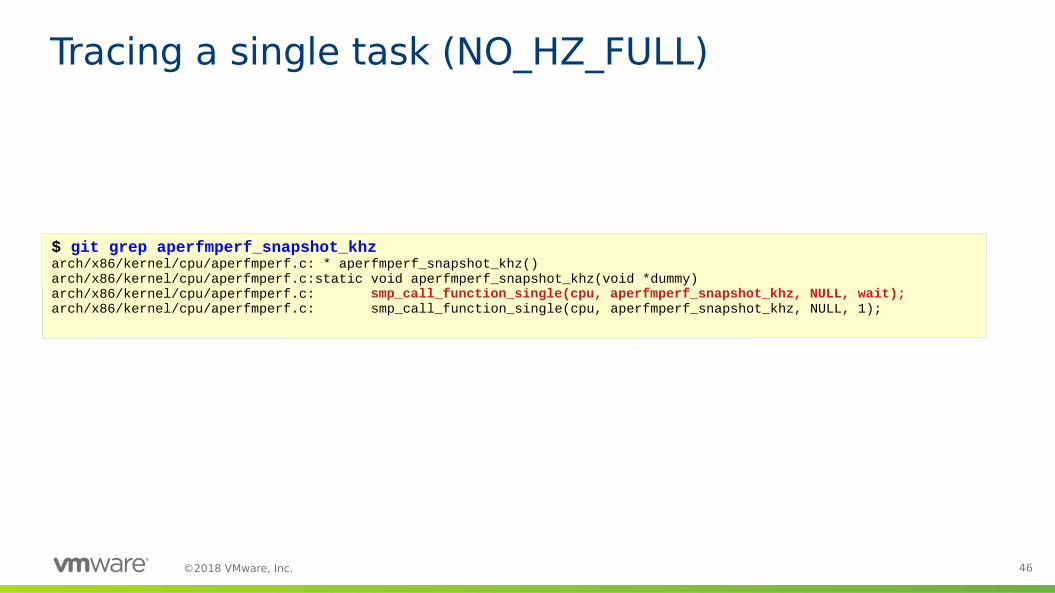
Tracing a single task (NO_HZ_FULL)
$ git grep aperfmperf_snapshot_khzarch/x86/kernel/cpu/aperfmperf.c: * aperfmperf_snapshot_khz()arch/x86/kernel/cpu/aperfmperf.c:static void aperfmperf_snapshot_khz(void *dummy)arch/x86/kernel/cpu/aperfmperf.c: smp_call_function_single(cpu, aperfmperf_snapshot_khz, NULL, wait);arch/x86/kernel/cpu/aperfmperf.c: smp_call_function_single(cpu, aperfmperf_snapshot_khz, NULL, 1);

47©2019 VMware, Inc.
aperfmperf_snapshot_khz()static bool aperfmperf_snapshot_cpu(int cpu, ktime_t now, bool wait){
s64 time_delta = ktime_ms_delta(now, per_cpu(samples.time, cpu));
/* Don't bother re-computing within the cache threshold time. */if (time_delta < APERFMPERF_CACHE_THRESHOLD_MS)
return true;
smp_call_function_single(cpu, aperfmperf_snapshot_khz, NULL, wait);
/* Return false if the previous iteration was too long ago. */return time_delta <= APERFMPERF_STALE_THRESHOLD_MS;
}
unsigned int arch_freq_get_on_cpu(int cpu){
if (!cpu_khz)return 0;
if (!static_cpu_has(X86_FEATURE_APERFMPERF))return 0;
if (aperfmperf_snapshot_cpu(cpu, ktime_get(), true))return per_cpu(samples.khz, cpu);
msleep(APERFMPERF_REFRESH_DELAY_MS);smp_call_function_single(cpu, aperfmperf_snapshot_khz, NULL, 1);
return per_cpu(samples.khz, cpu);}

48©2018 VMware, Inc.
Tracing a single task (NO_HZ_FULL)# trace-cmd record -p function -l arch_freq_get_on_cpu -l aperfmperf_snapshot_cpu \ --func-stack -e sched taskset -c 3 ./user_loop
[ hit Ctrl^C]
# trace-cmd report -O parent
bash-41423 [000] 61159.293176: kernel_stack: <stack trace>=> aperfmperf_snapshot_cpu (ffffffff8503bf15)=> arch_freq_prepare_all (ffffffff8503c0ad)=> cpuinfo_open (ffffffff85365f9e)=> proc_reg_open (ffffffff8535cb7a)=> do_dentry_open (ffffffff852d812f)=> path_openat (ffffffff852ec275)=> do_filp_open (ffffffff852ee963)=> do_sys_open (ffffffff852d9826)=> do_syscall_64 (ffffffff850042e0)=> entry_SYSCALL_64_after_hwframe (ffffffff85a00091) bash-41423 [000] 61159.293177: function: aperfmperf_snapshot_cpu <-- arch_freq_prepare_all bash-41423 [000] 61159.293178: kernel_stack: <stack trace>=> aperfmperf_snapshot_cpu (ffffffff8503bf15)=> arch_freq_prepare_all (ffffffff8503c0ad)=> cpuinfo_open (ffffffff85365f9e)=> proc_reg_open (ffffffff8535cb7a)=> do_dentry_open (ffffffff852d812f)=> path_openat (ffffffff852ec275)=> do_filp_open (ffffffff852ee963)=> do_sys_open (ffffffff852d9826)=> do_syscall_64 (ffffffff850042e0)=> entry_SYSCALL_64_after_hwframe (ffffffff85a00091)

49©2019 VMware, Inc.
Tracing a single task (NO_HZ_FULL)
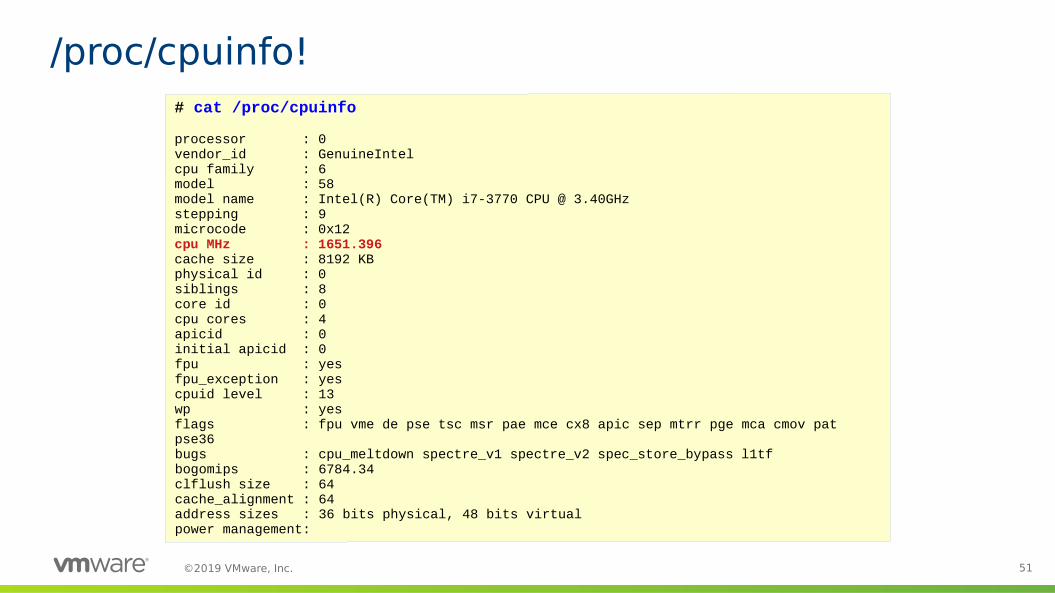
$ let x=1; while [ $x -lt 1000 ]; do let x=$x+1; cat /proc/cpuinfo >/dev/null; done

50©2019 VMware, Inc.
/proc/cpuinfo!# cat /proc/cpuinfo
processor : 0vendor_id : GenuineIntelcpu family : 6model : 58model name : Intel(R) Core(TM) i7-3770 CPU @ 3.40GHzstepping : 9microcode : 0x12cpu MHz : 1651.396cache size : 8192 KBphysical id : 0siblings : 8core id : 0cpu cores : 4apicid : 0initial apicid : 0fpu : yesfpu_exception : yescpuid level : 13wp : yesflags : fpu vme de pse tsc msr pae mce cx8 apic sep mtrr pge mca cmov pat pse36 bugs : cpu_meltdown spectre_v1 spectre_v2 spec_store_bypass l1tfbogomips : 6784.34clflush size : 64cache_alignment : 64address sizes : 36 bits physical, 48 bits virtualpower management:
51©2019 VMware, Inc.
/proc/cpuinfo!# cat /proc/cpuinfo
processor : 0vendor_id : GenuineIntelcpu family : 6model : 58model name : Intel(R) Core(TM) i7-3770 CPU @ 3.40GHzstepping : 9microcode : 0x12cpu MHz : 1651.396cache size : 8192 KBphysical id : 0siblings : 8core id : 0cpu cores : 4apicid : 0initial apicid : 0fpu : yesfpu_exception : yescpuid level : 13wp : yesflags : fpu vme de pse tsc msr pae mce cx8 apic sep mtrr pge mca cmov pat pse36 bugs : cpu_meltdown spectre_v1 spectre_v2 spec_store_bypass l1tfbogomips : 6784.34clflush size : 64cache_alignment : 64address sizes : 36 bits physical, 48 bits virtualpower management:

52©2019 VMware, Inc.
/proc/cpuinfo!# cat /proc/cpuinfo
processor : 0vendor_id : GenuineIntelcpu family : 6model : 58model name : Intel(R) Core(TM) i7-3770 CPU @ 3.40GHzstepping : 9microcode : 0x12cpu MHz : 1655.272cache size : 8192 KBphysical id : 0siblings : 8core id : 0cpu cores : 4apicid : 0initial apicid : 0fpu : yesfpu_exception : yescpuid level : 13wp : yesflags : fpu vme de pse tsc msr pae mce cx8 apic sep mtrr pge mca cmov pat pse36 bugs : cpu_meltdown spectre_v1 spectre_v2 spec_store_bypass l1tfbogomips : 6784.34clflush size : 64cache_alignment : 64address sizes : 36 bits physical, 48 bits virtualpower management:

53©2019 VMware, Inc.
Warning messagesWARNING: CPU: 0 PID: 1464 at kernel/sched/core.c:3799 rt_mutex_setprio+0x34d/0x450Modules linked in: ip6t_rpfilter ip6t_REJECT nf_reject_ipv6 xt_conntrack CPU: 0 PID: 1464 Comm: migrate Kdump: loaded Not tainted 5.0.0-test+ #140Hardware name: QEMU Standard PC (i440FX + PIIX, 1996), BIOS 1.12.0-1 04/01/2014RIP: 0010:rt_mutex_setprio+0x34d/0x450Code: 1c 48 89 4c 24 10 4c 89 4c 24 08 89 04 24 e8 0a b2 ff ff 44 8b 44 24 1c 48 8b 4c 24 10 4c 8b 4c 24 08 8b 04 24 e9 b4 fd ff ff <0f> 0b e9 ed fc ff ff e8 f4 7d ef ff e9 72 fe ff ff 4c 89 e7 e8 daRSP: 0018:ffffaa074096bba8 EFLAGS: 00010046RAX: 0000000000000000 RBX: ffff9597dcfe0040 RCX: 0000000000000000RDX: 0000000000000001 RSI: ffff9597dbde8040 RDI: ffff9597dcfe0040RBP: 0000000000000000 R08: ffffaa074096bce8 R09: 0000000000000000R10: ffff9597d8f4a914 R11: ffff95983d046f98 R12: ffff9597dcfe0040R13: ffff9597dbde8040 R14: ffffaa0740a73ce8 R15: ffff9597dbde8040FS: 00007fd6e59e5700(0000) GS:ffff95983d600000(0000) knlGS:0000000000000000CS: 0010 DS: 0000 ES: 0000 CR0: 0000000080050033CR2: 00007fda221f76a0 CR3: 0000000013296000 CR4: 00000000000006f0DR0: 0000000000000000 DR1: 0000000000000000 DR2: 0000000000000000DR3: 0000000000000000 DR6: 00000000fffe0ff0 DR7: 0000000000000400Call Trace: task_blocks_on_rt_mutex+0x1c5/0x200 __rt_mutex_start_proxy_lock+0x57/0xa0 futex_lock_pi+0x1d9/0x470 do_futex+0x2ef/0xac0 __x64_sys_futex+0x13c/0x180 do_syscall_64+0x55/0x160 entry_SYSCALL_64_after_hwframe+0x44/0xa9---[ end trace fad7e6e3c6e2b168 ]---

54©2018 VMware, Inc.
Stopping the trace on WARN_ON
Want to see what has happened
Prevent losing trace data by overwrite
Switches exist in /proc/sys/kernel
# cd /proc/sys/kernel/# cat traceoff_on_warning0
# echo 1 > traceoff_on_warning# cat traceoff_on_warning1

55©2018 VMware, Inc.
Stopping the trace on WARN_ON
Forcing a warning (for demonstration purposes)
diff --git a/kernel/sched/core.c b/kernel/sched/core.cindex ead464a0f2e5..6be322862f56 100644--- a/kernel/sched/core.c+++ b/kernel/sched/core.crostedt@oasis:~/work/git/linux-trace.git$ git diff kernel/diff --git a/kernel/sched/core.c b/kernel/sched/core.cindex ead464a0f2e5..6be322862f56 100644--- a/kernel/sched/core.c+++ b/kernel/sched/core.c@@ -3796,6 +3796,8 @@ void rt_mutex_setprio(struct task_struct *p, struct task_struct *pi_task) /* XXX used to be waiter->prio, not waiter->task->prio */ prio = __rt_effective_prio(pi_task, p->normal_prio); + WARN_ON_ONCE(prio == 0);+ /* * If nothing changed; bail early. */

56©2018 VMware, Inc.
Stopping the trace on WARN_ON
Trigger the warning
# echo 1 > /proc/sys/kernel/traceoff_on_warning# trace-cmd record -p function -e all# cat /sys/kernel/tracing/tracing_on1
# ./migrate -p 99# cat /sys/kernel/tracing/tracing_on0
# dmesg |tail
DR0: 0000000000000000 DR1: 0000000000000000 DR2: 0000000000000000DR3: 0000000000000000 DR6: 00000000fffe0ff0 DR7: 0000000000000400Call Trace: task_blocks_on_rt_mutex+0x1c5/0x200 __rt_mutex_start_proxy_lock+0x57/0xa0 futex_lock_pi+0x1d9/0x470 do_futex+0x2ef/0xac0 __x64_sys_futex+0x13c/0x180 do_syscall_64+0x55/0x160 entry_SYSCALL_64_after_hwframe+0x44/0xa9---[ end trace fad7e6e3c6e2b168 ]---
http://rostedt.homelinux.com/code/migrate.c

57©2018 VMware, Inc.
Stopping the trace on WARN_ON
See where it ended
# trace-cmd show | tail -20
sshd-1359 [000] d.s1 748.930546: lock_release: 0000000095b3b5d0 rcu_read_lock migrate-1386 [002] d..2 748.930546: do_error_trap <-do_invalid_op sshd-1359 [000] ..s1 748.930547: netif_receive_skb_internal <-napi_gro_receive migrate-1386 [002] d..2 748.930547: is_valid_bugaddr <-report_bug sshd-1359 [000] ..s1 748.930547: skb_defer_rx_timestamp <-netif_receive_skb_internal migrate-1386 [002] d..2 748.930547: __probe_kernel_read <-is_valid_bugaddr sshd-1359 [000] ..s1 748.930547: __rcu_read_lock <-netif_receive_skb_internal migrate-1386 [002] d..2 748.930547: __check_object_size <-__probe_kernel_read sshd-1359 [000] d.s1 748.930547: lock_acquire: 0000000095b3b5d0 read rcu_read_lock migrate-1386 [002] d..2 748.930547: check_stack_object <-__check_object_size sshd-1359 [000] ..s1 748.930547: __netif_receive_skb <-netif_receive_skb_internal sshd-1359 [000] ..s1 748.930547: __netif_receive_skb_one_core <-netif_receive_skb_internal sshd-1359 [000] ..s1 748.930547: __netif_receive_skb_core <-__netif_receive_skb_one_core sshd-1359 [000] ..s1 748.930548: netif_receive_skb: dev=ens9 skbaddr=0000000021f0ef9a len=52 sshd-1359 [000] ..s1 748.930548: packet_rcv <-__netif_receive_skb_core sshd-1359 [000] ..s1 748.930549: skb_push <-packet_rcv sshd-1359 [000] ..s1 748.930549: run_filter <-packet_rcv sshd-1359 [000] ..s1 748.930549: __rcu_read_lock <-run_filter sshd-1359 [000] d.s1 748.930549: lock_acquire: 0000000095b3b5d0 read rcu_read_lock migrate-1386 [002] d..2 748.930549: __warn <-report_bug

58©2018 VMware, Inc.
Stopping the trace on WARN_ON
Take it off line
# trace-cmd extract# trace-cmd report -l -O parent | tail -20
sshd-1359 [000] 748.930546: lock_release: 0xffffffff9a47ea80 rcu_read_lock migrate-1386 [002] 748.930546: function: do_error_trap <-- do_invalid_op sshd-1359 [000] 748.930547: function: netif_receive_skb_internal <-- napi_gro_receive migrate-1386 [002] 748.930547: function: is_valid_bugaddr <-- report_bug sshd-1359 [000] 748.930547: function: skb_defer_rx_timestamp <-- netif_receive_skb_internal migrate-1386 [002] 748.930547: function: __probe_kernel_read <-- is_valid_bugaddr sshd-1359 [000] 748.930547: function: __rcu_read_lock <-- netif_receive_skb_internal migrate-1386 [002] 748.930547: function: __check_object_size <-- __probe_kernel_read sshd-1359 [000] 748.930547: lock_acquire: 0xffffffff9a47ea80 read rcu_read_lock migrate-1386 [002] 748.930547: function: check_stack_object <-- __check_object_size sshd-1359 [000] 748.930547: function: __netif_receive_skb <-- netif_receive_skb_internal sshd-1359 [000] 748.930547: function: __netif_receive_skb_one_core <-- netif_receive_skb_internal sshd-1359 [000] 748.930547: function: __netif_receive_skb_core <-- __netif_receive_skb_one_core sshd-1359 [000] 748.930548: netif_receive_skb: dev=ens9 skbaddr=0xffff8f1f5de4c680 len=52 sshd-1359 [000] 748.930548: function: packet_rcv <-- __netif_receive_skb_core sshd-1359 [000] 748.930549: function: skb_push <-- packet_rcv sshd-1359 [000] 748.930549: function: run_filter <-- packet_rcv sshd-1359 [000] 748.930549: function: __rcu_read_lock <-- run_filter sshd-1359 [000] 748.930549: lock_acquire: 0xffffffff9a47ea80 read rcu_read_lock migrate-1386 [002] 748.930549: function: __warn <-- report_bug

59©2019 VMware, Inc.
Kernel Panic! BUG_ONWARNING: CPU: 0 PID: 1464 at kernel/sched/core.c:3799 rt_mutex_setprio+0x34d/0x450 Kernel panic - not syncing: sysrq triggered crash CPU: 1 PID: 1378 Comm: bash Not tainted 5.0.0-test+ #140 Hardware name: QEMU Standard PC (i440FX + PIIX, 1996), BIOS 1.12.0-1 04/01/2014 Call Trace: dump_stack+0x5c/0x80 panic+0x101/0x2a3 sysrq_handle_crash+0x2e/0x30 __handle_sysrq.cold.6+0x45/0x11a write_sysrq_trigger+0x2b/0x30 proc_reg_write+0x36/0x60 __vfs_write+0x33/0x1a0 vfs_write+0xa5/0x1a0 ksys_write+0x52/0xc0 do_syscall_64+0x55/0x160 entry_SYSCALL_64_after_hwframe+0x44/0xa9 RIP: 0033:0x7f2fccbd7414 Code: 89 02 48 c7 c0 ff ff ff ff c3 66 2e 0f 1f 84 00 00 00 00 00 66 90 48 8d 05 f1 34 2d 00 8b 00 85 c0 75 13 b8 01 00 00 00 0f 05 <48> 3d 00 f0 ff ff 77 54 c3 0f 1f 00 41 54 49 89 d4 55 48 89 f5 53 RSP: 002b:00007ffeb93da478 EFLAGS: 00000246 ORIG_RAX: 0000000000000001 RAX: ffffffffffffffda RBX: 0000000000000002 RCX: 00007f2fccbd7414 RDX: 0000000000000002 RSI: 000055a31b0856d0 RDI: 0000000000000001 RBP: 000055a31b0856d0 R08: 000000000000000a R09: 00007ffeb93da000 R10: 000000000000000a R11: 0000000000000246 R12: 00007f2fccea6760 R13: 0000000000000002 R14: 00007f2fccea1760 R15: 0000000000000002 Kernel Offset: 0x34000000 from 0xffffffff81000000 (relocation range: 0xffffffff80000000-0xffffffffbfffffff) ---[ end Kernel panic - not syncing: sysrq triggered crash ]---

60©2018 VMware, Inc.
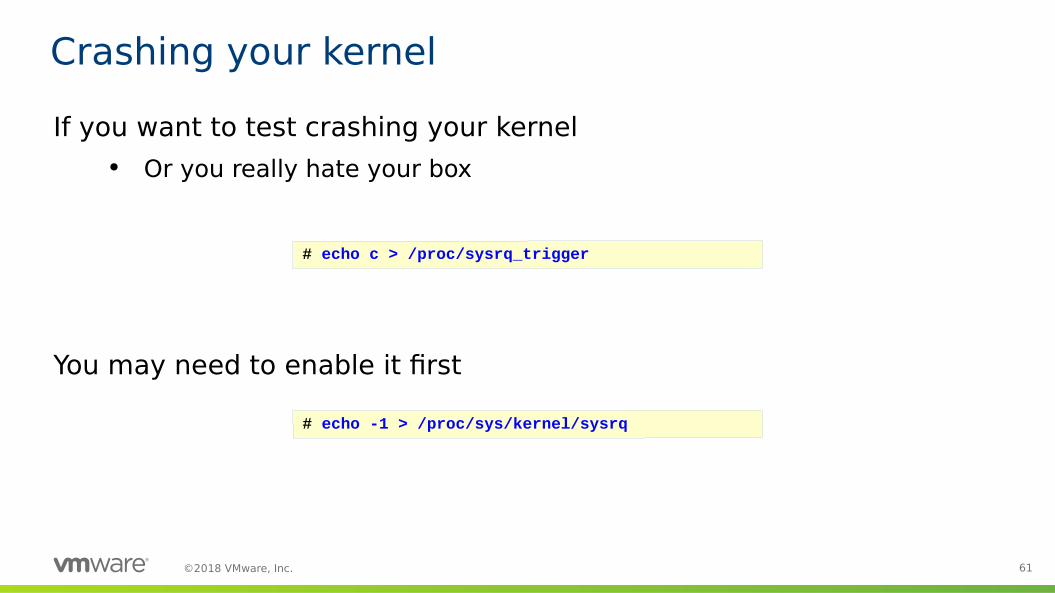
Crashing your kernel
If you want to test crashing your kernel Or you really hate your box
# echo c > /proc/sysrq_trigger
61©2018 VMware, Inc.
Crashing your kernel
If you want to test crashing your kernel Or you really hate your box
You may need to enable it first
# echo c > /proc/sysrq_trigger
# echo -1 > /proc/sys/kernel/sysrq

62©2018 VMware, Inc.
ftrace_dump_on_oops
Dumps the entire ftrace buffer to console
Over serial, can be a very long time (hours!)
Shrink the buffer first echo 10 > /sys/kernel/tracing/buffer_size_kb trace-cmd start -b 10 -p nop

63©2018 VMware, Inc.
ftrace_dump_on_oops
Dump all CPUS sysctl kernel.ftrace_dump_on_oops=1 echo 1 > /proc/sys/kernel/ftrace_dump_on_oops Kernel command line: ftrace_dump_on_oops

64©2018 VMware, Inc.
ftrace_dump_on_oops
Dump all CPUS sysctl kernel.ftrace_dump_on_oops=1 echo 1 > /proc/sys/kernel/ftrace_dump_on_oops Kernel command line: ftrace_dump_on_oops
Dump just triggered CPU sysctl kernel.ftrace_dump_on_oops=2 echo 2 > /proc/sys/kernel/ftrace_dump_on_oops Kernel command line: ftrace_dump_on_oops=orig_cpu

65©2018 VMware, Inc.
ftrace_dump_on_oopsfedora25 login: [44521.379198] sysrq: Trigger a crash[44521.382964] Kernel panic - not syncing: sysrq triggered crash[44521.383699] CPU: 2 PID: 1332 Comm: bash Not tainted 5.0.0-test+ #140[44521.385719] Hardware name: QEMU Standard PC (i440FX + PIIX, 1996), BIOS 1.12.0-1 04/01/2014[44521.385719] Call Trace:[44521.385719] dump_stack+0x5c/0x80[44521.385719] panic+0x101/0x2a3[44521.385719] sysrq_handle_crash+0x2e/0x30[44521.389695] __handle_sysrq.cold.6+0x45/0x11a[44521.389695] write_sysrq_trigger+0x2b/0x30[44521.389695] proc_reg_write+0x36/0x60[44521.389695] __vfs_write+0x33/0x1a0[44521.393706] ? __sb_start_write+0x12e/0x1d0[44521.393706] ? __sb_start_write+0x146/0x1d0[44521.393706] vfs_write+0xa5/0x1a0[44521.393706] ksys_write+0x52/0xc0[44521.393706] do_syscall_64+0x55/0x160[44521.393706] entry_SYSCALL_64_after_hwframe+0x44/0xa9[44521.397698] RIP: 0033:0x7f85891ba414[44521.397698] Code: 89 02 48 c7 c0 ff ff ff ff c3 66 2e 0f 1f 84 00 00 00 00 00 66 90 48 8d 05 f1 34 2d 00 8b 00 85 c0 75 13 b8 01 00 00 00 0f 05 <48> 3d 00 f0 ff ff 77 54 c3 0f 1f 00 41 54 49 89 d4 55 48 89 f5 53[44521.401721] RSP: 002b:00007ffe5cc9a878 EFLAGS: 00000246 ORIG_RAX: 0000000000000001[44521.401721] RAX: ffffffffffffffda RBX: 0000000000000002 RCX: 00007f85891ba414[44521.405694] RDX: 0000000000000002 RSI: 00005641fb814730 RDI: 0000000000000001[44521.405694] RBP: 00005641fb814730 R08: 000000000000000a R09: 00007ffe5cc9a400[44521.405694] R10: 000000000000000a R11: 0000000000000246 R12: 00007f8589489760[44521.409737] R13: 0000000000000002 R14: 00007f8589484760 R15: 0000000000000002[44521.409737] Dumping ftrace buffer:[44521.409737] ---------------------------------[44521.409737] <idle>-0 2dN.2 46024us : hrtimer_cancel: hrtimer=(____ptrval____)[44521.409737] bash-1332 2d.h1 46682us : hrtimer_cancel: hrtimer=(____ptrval____)[44521.409737] <idle>-0 2d.h2 47789us : hrtimer_cancel: hrtimer=(____ptrval____)[44521.409737] <idle>-0 2d.h2 48748us : hrtimer_cancel: hrtimer=(____ptrval____)[44521.409737] <idle>-0 2d.h2 49767us : hrtimer_cancel: hrtimer=(____ptrval____)[44521.409737] <idle>-0 2d.h2 50782us : hrtimer_cancel: hrtimer=(____ptrval____)[44521.409737] <idle>-0 2d.h2 51714us : hrtimer_cancel: hrtimer=(____ptrval____)

66©2018 VMware, Inc.
kexec / kdump
Load a kernel into memory Kernel command line: crashkernel=128M

67©2018 VMware, Inc.
kexec / kdump
Load a kernel into memory Kernel command line: crashkernel=128M
kdumpctl start (look it up!) Creates a special initramfs (for dumping kernel) Loads a kernel into the “crashkernel” memory

68©2018 VMware, Inc.
kexec / kdump
Load a kernel into memory Kernel command line: crashkernel=128M
kdumpctl start (look it up!) Creates a special initramfs (for dumping kernel) Loads a kernel into the “crashkernel” memory
On a crash, jumps and boots the crash kernel Mounts the filesystem Copies kernel memory into a vmcore file Usually to: /var/crash/<date-time>/vmcore

69©2019 VMware, Inc.
kexec / kdump

70©2019 VMware, Inc.
crash# crash vmlinux /var/crash/127.0.0.1-2019-03-10-03\:04\:04/vmcore
GNU gdb (GDB) 7.6Copyright (C) 2013 Free Software Foundation, Inc.License GPLv3+: GNU GPL version 3 or later <http://gnu.org/licenses/gpl.html>This is free software: you are free to change and redistribute it.There is NO WARRANTY, to the extent permitted by law. Type "show copying"and "show warranty" for details.This GDB was configured as "x86_64-unknown-linux-gnu"...
WARNING: kernel relocated [592MB]: patching 100429 gdb minimal_symbol values
KERNEL: vmlinux DUMPFILE: /var/crash/127.0.0.1-2019-03-10-03:04:04/vmcore [PARTIAL DUMP] CPUS: 4 DATE: Sun Mar 10 03:04:01 2019 UPTIME: 00:05:15LOAD AVERAGE: 0.01, 0.15, 0.08 TASKS: 125 NODENAME: fedora25.localdomain RELEASE: 5.0.0-test+ VERSION: #140 SMP PREEMPT Sat Mar 9 14:35:30 EST 2019 MACHINE: x86_64 (1896 Mhz) MEMORY: 2 GB PANIC: "Kernel panic - not syncing: sysrq triggered crash" PID: 1352 COMMAND: "bash" TASK: ffff99bfd0be4040 [THREAD_INFO: ffff99bfd0be4040] CPU: 2 STATE: TASK_RUNNING (PANIC)
crash>

71©2019 VMware, Inc.
crash trace extensioncrash> extend trace.so
extensions/trace.so: shared object loaded
crash> trace dump -t trace.dat
crash> quit
$ trace-cmd report | tail -20
bash-1352 [002] 45075.944411: write_msr: 835, value 5700 bash-1352 [002] 45075.944411: function: do_trace_read_msr bash-1352 [002] 45075.944411: read_msr: 836, value 10000 bash-1352 [002] 45075.944411: function: do_trace_write_msr bash-1352 [002] 45075.944411: write_msr: 836, value 5400 bash-1352 [002] 45075.944411: function: hpet_disable bash-1352 [002] 45075.944411: function: crash_save_cpu bash-1352 [002] 45075.944411: function: do_trace_read_msr bash-1352 [002] 45075.944411: read_msr: c0000100, value 7fbdc7040740 bash-1352 [002] 45075.944411: function: do_trace_read_msr bash-1352 [002] 45075.944411: read_msr: c0000102, value 0 bash-1352 [002] 45075.944411: function: append_elf_note bash-1352 [002] 45075.944411: function: final_note bash-1352 [002] 45075.944411: function: machine_kexec bash-1352 [002] 45075.944411: function: __phys_addr bash-1352 [002] 45075.944411: function: __phys_addr <idle>-0 [000] 45075.944479: function: do_trace_write_msr <idle>-0 [003] 45075.944479: function: do_trace_write_msr <idle>-0 [003] 45075.944479: write_msr: 80f, value ff <idle>-0 [000] 45075.944479: write_msr: 80f, value ff

72©2019 VMware, Inc.
crash trace extension

73©2019 VMware, Inc.
When all else fails...
trace_printk(fmt, ...)
Same syntax as printk(fmt, ...) Similar to printf(fmt, ...) Has special pointer expresions:
– %pS : displays symbol names - “do_IRQ”– %pb : bitmaps– %pM : MAC address– %pI (pee-eye) : IP address– etc
trace_printk(“%s:%d\n”, __func__, __LINE__)

74©2019 VMware, Inc.
Stopping the trace on WARN_ON
trace_printk() - The Shotgun Approach
--- a/kernel/sched/core.c+++ b/kernel/sched/core.c@@ -2656,13 +2656,22 @@ static inline void prepare_task_switch(struct rq *rq, struct task_struct *prev, struct task_struct *next) {+ trace_printk("%s:%d %s:%d ==> %s:%d\n", __func__, __LINE__,+ prev->comm, prev->pid, next->comm, next->pid); kcov_prepare_switch(prev);+ trace_printk("%s:%d\n", __func__, __LINE__); sched_info_switch(rq, prev, next);+ trace_printk("%s:%d\n", __func__, __LINE__); perf_event_task_sched_out(prev, next);+ trace_printk("%s:%d\n", __func__, __LINE__); rseq_preempt(prev);+ trace_printk("%s:%d\n", __func__, __LINE__); fire_sched_out_preempt_notifiers(prev, next);+ trace_printk("%s:%d\n", __func__, __LINE__); prepare_task(next);+ trace_printk("%s:%d\n", __func__, __LINE__); prepare_arch_switch(next);+ trace_printk("%s:%d\n", __func__, __LINE__); }

75©2019 VMware, Inc.
Stopping the trace on WARN_ON
trace_printk() - The Shotgun Approach
# trace-cmd show
# tracer: nop## entries-in-buffer/entries-written: 128676/1298206 #P:4## _-----=> irqs-off# / _----=> need-resched# | / _---=> hardirq/softirq# || / _--=> preempt-depth# ||| / delay# TASK-PID CPU# |||| TIMESTAMP FUNCTION# | | | |||| | | <idle>-0 [001] d..2 78797.344376: __schedule: prepare_task_switch:2668 <idle>-0 [001] d..2 78797.344376: __schedule: prepare_task_switch:2670 <idle>-0 [001] d..2 78797.344377: __schedule: prepare_task_switch:2672 <idle>-0 [001] d..2 78797.344377: __schedule: prepare_task_switch:2674 kauditd-32 [001] d..2 78797.344462: __schedule: prepare_task_switch:2660 kauditd:32 ==> swapper/1:0 kauditd-32 [001] d..2 78797.344462: __schedule: prepare_task_switch:2662 kauditd-32 [001] d..2 78797.344462: __schedule: prepare_task_switch:2664 kauditd-32 [001] d..2 78797.344462: __schedule: prepare_task_switch:2666 kauditd-32 [001] d..2 78797.344462: __schedule: prepare_task_switch:2668 kauditd-32 [001] d..2 78797.344463: __schedule: prepare_task_switch:2670 kauditd-32 [001] d..2 78797.344463: __schedule: prepare_task_switch:2672 kauditd-32 [001] d..2 78797.344463: __schedule: prepare_task_switch:2674 <idle>-0 [001] d..2 78797.345052: __schedule: prepare_task_switch:2660 swapper/1:0 ==> kauditd:32 <idle>-0 [001] d..2 78797.345053: __schedule: prepare_task_switch:2662 <idle>-0 [001] d..2 78797.345053: __schedule: prepare_task_switch:2664

©2019 VMware, Inc.
Thank You