Embed Size (px)
Citation preview

FACTORS AFFECTING GROUP PERFORMANCE: AN APPLICATION
OF SYSTEMS THEORY TO FLIGHTCREW PERFORMANCE
by
JO ANN HAMSHER JOHNSON, B.A.
A DISSERTATION
IN
PSYCHOLOGY
Submitted to the Graduate Faculty of Texas Tech University in Partial Fulfillment of the Requirements for
the Degree of
\.y
DOCTOR OF PHILOSOPHY
Approved
Accepted
December, 1987

/:C
Copyright 1987 Jo Ann Hamsher Johnson

ACKNOWLEDGMENTS
I would like to extend sincere thanks to a number of
key people who provided assistance throughout my academic
career and specifically in this endeavor. First, I would
like to thank Dr. Clay George who chaired this
dissertation. His patience, guidance and encouragement
have helped me over a number of roughspots in completing
this study. My committee members. Dr. Charles Halcomb,
Dr. Kim Faulkner, Dr. Richard McGlynn and Dr. Jane Winer
provided valuable advice and comments. Special thanks
are extended to the Psychology department faculty at
Texas Tech University who have shaped my professional
development as a psychologist during my undergraduate and
graduate career. The cooperation of my employer, the
LWFW Group is gratefully acknowledged. Lastly, I would
like to thank my family, especially my husband Bryan, for
always being there when I needed them.
ii
TABLE OF CONTENTS
ACKNOWLEDGMENTS ii
ABSTRACT V
LIST OF TABLES viii
LIST OF FIGURES ix
CHAPTER
I. INTRODUCTION 1
Systems Theory 4
Input Factors 7
Group Process 18
Relationship of Input Variables to the Group Process 19
Application of Systems Theory to
Flightcrews 27
Hypotheses 31
II. METHODS 34
Subjects 34
Materials 34
Procedure 37
Experimental Task 39
Design 43
III. RESULTS 44
IV. DISCUSSION 61 REFERENCES 68
iii
APPENDICES
A. THE WORKER MOTIVATION SCALE 72
B. HIGHEST FACTOR LOADINGS FOR ITEMS ON THE WORKER MOTIVATION SCALE 75
C. NORMATIVE SCORES FOR ITEMS ON THE
WORKER MOTIVATION SCALE 77
D. MAP OF WASHINGTON STATE 81
E. EXAMPLE OF OBSERVER COMMUNICATION CODING SHEET 83
F. WORK SATISFACTION AND CO-WORKER SATISFACTION SUBSCALES OF THE JOB DESCRIPTIVE INDEX 85
G. INSTRUCTION MANUAL GIVEN TO CREWMEMBERS 87
H. FLIGHT TRAINING QUESTIONS AND CORRECT ANSWERS 91
iv
ABSTRACT
Reviewers of group research have proposed the use of a
systems model for aiding in the understanding of group
processes (Hackman & Morris, 1975). According to systems
theory, one must assess all of the relevant group input
variables (e.g., member characteristics, group structure,
and environment) in order to understand how they will
impact upon the group process and ultimately upon the
performance of the group. Recent investigations of
flightcrew performance have suggested that while
crewmembers are highly trained in their specific skills,
there is a lack of coordination among members when an
emergency situation arises; the result is poor group
performance and possibly the loss of lives. Team
Motivation (TM), or an individual's motivation to see the
group achieve, was proposed as the relevant member
characteristic in understanding crew coordination in
flightcrews. TM scores have been used successfully to
predict helping behavior in group members (Johnson,
McDonald & George, 1984; Kesterson, 1986). Additional
research on the TM concept has suggested that TM behavior
can be shaped using appropriate training and feedback.
The present experiment was designed to examine the
relationship between Team Motivation, communication and
group performance, and secondly to examine whether the

motivation to achieve the group's goal could be increased
with training. Two students and one confederate
participated in a flight simulation game where students
were assigned the roles of navigator and flight engineer.
The confederate, serving as the pilot, followed only the
directions given by crewmembers, thus creating a
situation where crew coordination was necessary for the
group to succeed. Students could opt to assist the pilot
by supplying task-relevant communication, or continue to
serve in their assigned role. Two blocks of trials were
conducted with half of the groups receiving
training/feedback between the two blocks. Results
indicate that highly Team-Motivated groups were more
productive than groups which were low in Team-Motivation.
Additionally, high TM groups reported higher levels of
satisfaction with their task. The training/feedback
manipulation was not successful. This result was due to
several factors. As hypothesized, the group process was
defined as task-relevant communication, and it was
proposed that groups which exhibited more task-relevant
communication would have higher productivity. The
assumption that quantity was the key appears to have been
inaccurate. Rather, it is the timing or quality of the
communication that seems to be of importance. Future
researchers will need to be more aware of the criticality
of the communication and take more direct measures (e.g.,
vi

videotaping and using expert judges) before the impact of
communication can be fully understood.
vii
LIST OF TABLES
1. Means and Standard Deviations for Productivity and Task Relevant Communications on Trial Block 1, Trial Block 2 and Total ... 45
2. Means and Standard Deviations for Team Motivation Scores Pre and Post Administrations by Condition 48
3. Means and Standard Deviations for Team Motivation Scores, Test-Retest Students Only 49
4. Split Plot ANOVA for the Team Motivation Measure 50
5. Means and Standard Deviations for Work Satisfaction and Co-worker Satisfaction
Scores for Crewmember Role by Condition 53
6. ANOVA for Co-worker Satisfaction 54
7. ANOVA for Work Satisfaction 55 8. Means and Standard Deviations for
Productivity by Team Motivation and Training 56
9. Means and Standard Deviations for Productivity by Condition 57
10. Split Plot ANOVA for Productivity 59
11. Factor Loadings 76
12. Normative Scores 78
viii

LIST OF FIGURES
1. A Systems Model of Group Process 6
2. Model of Small Unit Structure 16
3. Proposed Model of Flightcrew Performance 32
4. Team Motivation Scores 51
5. Mean Productivity Scores 60
6. Map of Washington State 82
7. Diagram of Computer Screen Instrumentation Layout 88
ix
CHAPTER I
INTRODUCTION
Reviewers of group research have suggested the study
of group processes is a potential point for the
application of a wide range of social psychological
theories (McGrath & Kravitz, 1982). The present effort
is an attempt to extend our understanding of work-group
dynamics and the opportunities for improving work-group
performance by considering the group as a part of a
larger system whereby external and internal factors
influence the group and the group's performance. An
initial difficulty in applying social psychological
theory in the applied setting is the determination of
what a "group" is. For the purpose of this paper, the
criterion offered by McGrath and Kravitz (1982) will be
utilized. A group is said to consist of "two or more
individuals who are aware of one another and who take
each other into account" (p.199). This definition
implies the members of a group interact to at least a
minimal degree or, as described by Berkowitz (1980), the
group is viewed as a "social system" (p.418).
Although intuitively one might assume "two heads are
better than one," this point has been the subject of
debate by researchers. Collins and Raven (1969)
described a model of the group process proposed by

2
Collins and Guetzkow (1964) which identified two sources
of obstacles to group effectiveness: the task
environment and the interpersonal environment. These
obstacles may result in two types of behavior, group
(coordinated) and individual (uncoordinated), which
culminate in the group's overall productivity. Collins
and Guetzkow argued that although the group does possess
the potential for producing results which are better than
the individual members could produce alone, the
interpersonal environment can foster maladaptive as well
as contributory behaviors which may inhibit this.
Steiner (1972) also suggested that in many
instances groups fail to perform as effectively as
possible. He assumed groups are combinatorial in nature
and, therefore, are unable to generate any new knowledge
beyond that already possessed by group members. Steiner
characterized the group process as one of process loss.
According to him, the two basic determinants of group
productivity are the resources of the group and the task
demands. The resources of the group are generally any
personal characteristics (e.g., knowledge, ability,
personality, etc.) which the members bring into the group
situation. Task demands dictate what resources are
relevant to the completion of the group task and how
these resources should be combined. If the group
maximally utilizes its resources, it can achieve its
3
potential productivity level. Actual productivity is
thought to never reach this potential level due to
factors inherent in the group process. These factors
include both interpersonal and intrapersonal behaviors
which inhibit productivity in the group. Therefore, as
Steiner conceptualized the group process, it is an
interaction among group members consisting of both
productive and non-productive behaviors.
Other researchers have also taken a somewhat
negative view of the group process. Janis (1983)
described the process of "groupthink" whereby the group's
performance is hindered due to a decrease in the exchange
of discrepant information. The groups described by Janis
were highly cohesive and were generally involved in
decision making tasks. Janis suggested that in highly
cohesive groups there is more influence to conform with
group norms. Also, highly cohesive groups provide
feelings of security and prestige for the group members.
This feeling of security, coupled with the pressure to
conform, often yields a loss in group effectiveness due
to a lack of information exchange. To the extent the
structure of the group allows for a leadership position,
the leader can facilitate the occurrence of the
groupthink phenomenon by inhibiting the exchange of
information disparate with his/her own opinion. As an
example of this, the author cited the Bay of Pigs

4
incident during the administration of President John F.
Kennedy. The key individuals who were selected to
determine policy during the crisis were said to have
exhibited evidence of the "groupthink" phenomenon, thus
reducing their overall effectiveness.
If the group process, as suggested by these
researchers, generally results in a slightly negative
outcome, why then do researchers continue to focus
attention on the group process? The answer is based on
the supposition that we are in a world dominated by
groups and group activities. If the group is taken as a
given in our society, it becomes important for research
to address the issues of increasing the understanding of
the group process and how one might improve its
effectiveness. In order to address such issues, research
must more closely investigate the nature of the group
process. As suggested by the literature then, the group
is a highly complex, dynamic phenomenon in which members
integrate their resources and in which where both
adaptive and maladaptive behaviors are evidenced.
Systems Theory
In order to more closely investigate the group
process, one must impose structure as to how one will
conceptualize the group process itself. General Systems
Theory (GST) may serve as an appropriate model for

5
viewing the group process. According to GST, the outputs
or products of a systems are a reflection of the system
inputs and the system process which transforms the inputs
into the system's products (Berrien, 1976). Any change
in either the inputs or the process will affect the
system as a whole and consequently alter the output.
Within the systems framework, the group could be
described as a system whereby members contribute inputs
or resources into the systems, the system processes or
combines these inputs, and the result is the production
of an output such as a decision or a product.
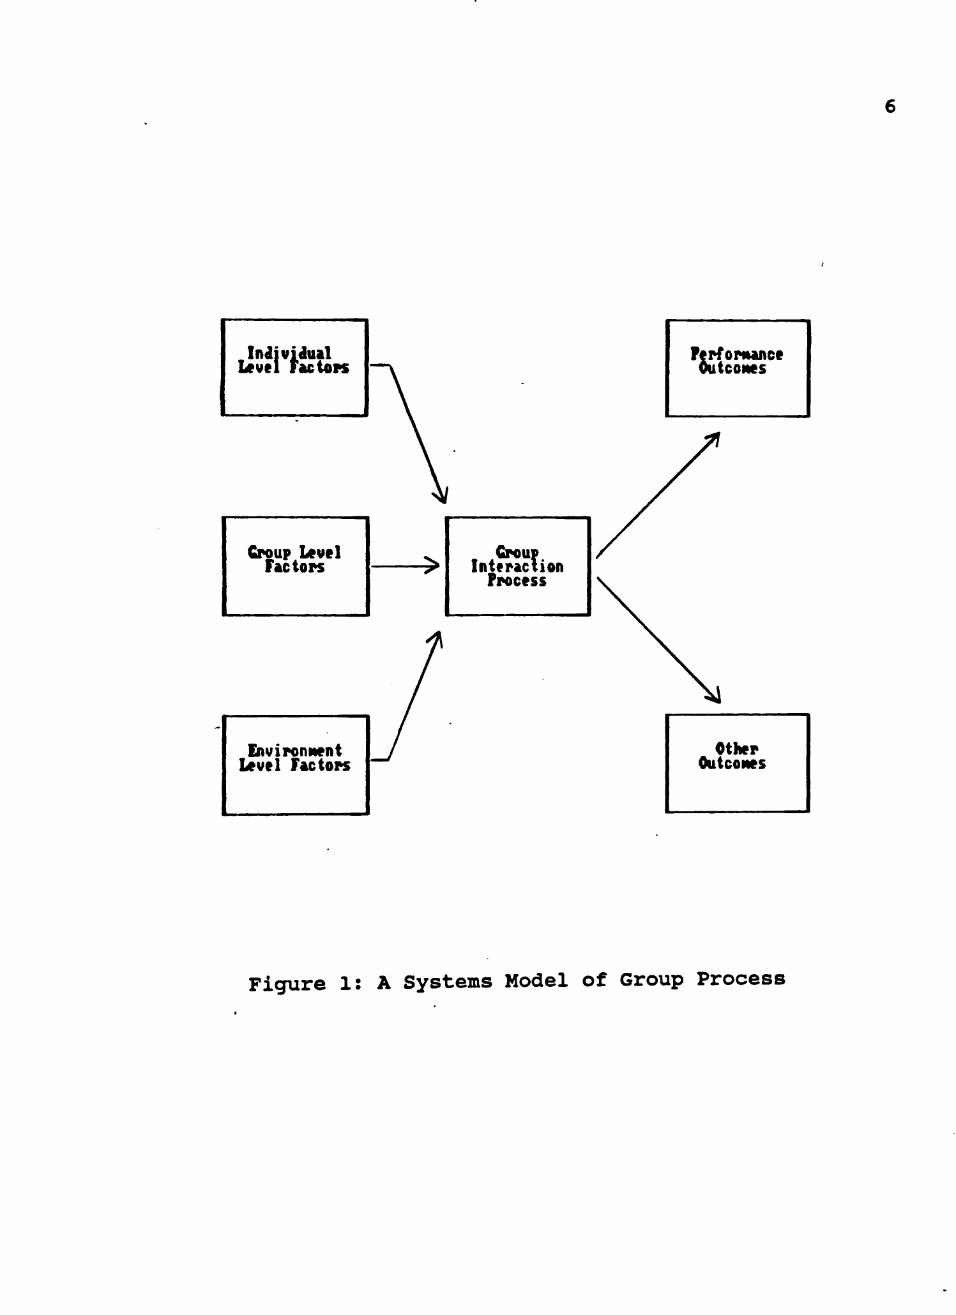
Hackman and Morris (1975) proposed a systems model
of the group process which was adapted from the
traditional model proposed by McGrath (1964) (see Figure
1) . The inputs into the system can be classified into
three factor groupings: (a) individual-level factors
which include member knowledge, skills, attitudes, and
personalities, (b) group-level factors which include
group structure, size, and cohesiveness, and (c)
environment-level factors which include group tasks and
organizational structure. Using this schema, one can
consider studies in group research from a more structured
viewpoint and derive hypotheses as to the impact of
inputs and process on system outputs.
Pcpfopnance OutCOMS
Croup L»vel Factops
Group Interaction Process
Environnent Level Factors
Other Outcones
F i g u r e 1: A Systems Model o f Group P r o c e s s
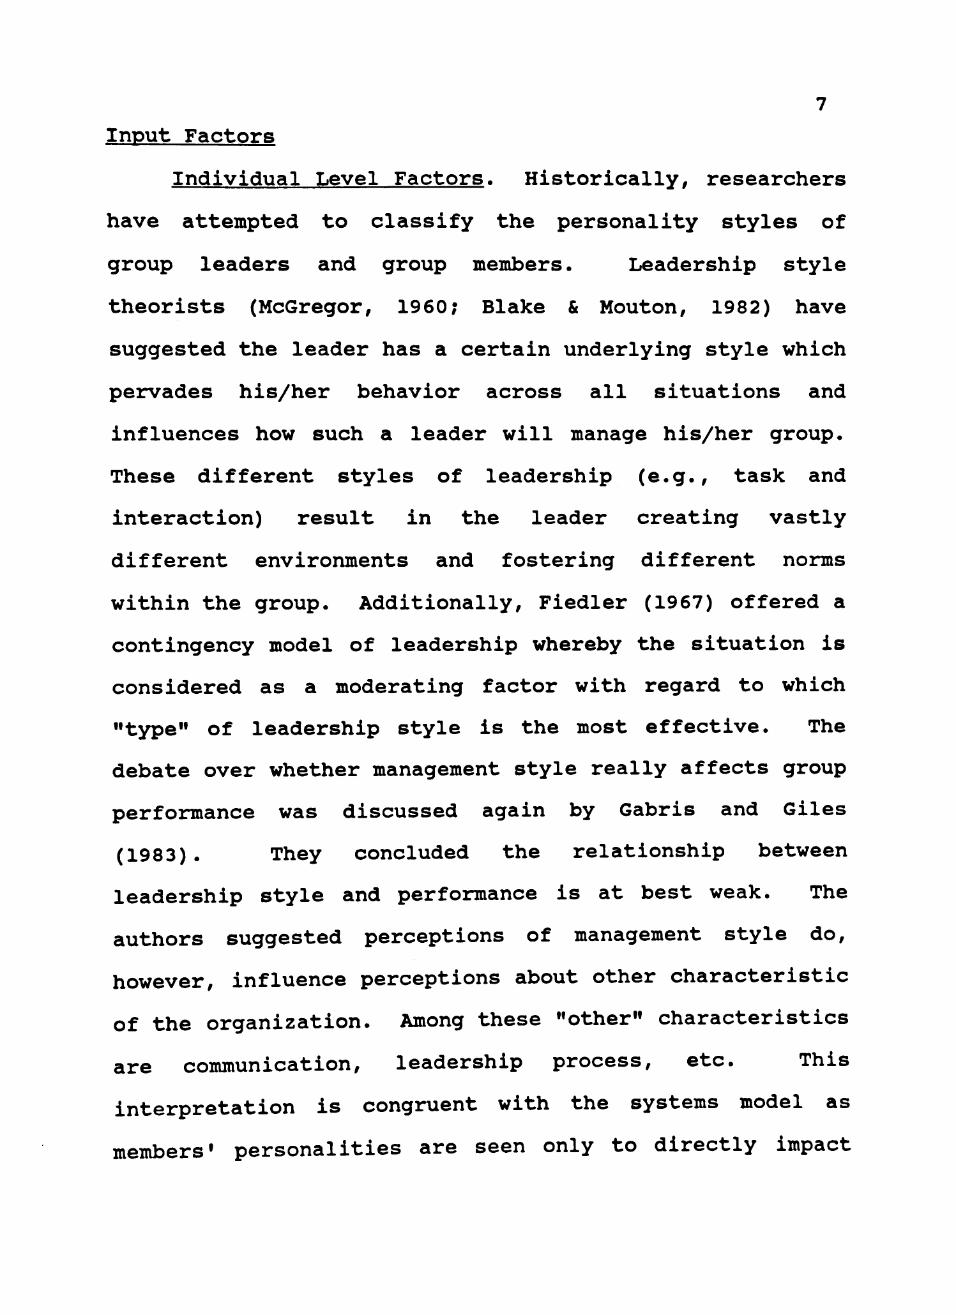
Input Factors
Individual Level Factors. Historically, researchers
have attempted to classify the personality styles of
group leaders and group members. Leadership style
theorists (McGregor, 1960; Blake & Mouton, 1982) have
suggested the leader has a certain underlying style which
pervades his/her behavior across all situations and
influences how such a leader will manage his/her group.
These different styles of leadership (e.g., task and
interaction) result in the leader creating vastly
different environments and fostering different norms
within the group. Additionally, Fiedler (1967) offered a
contingency model of leadership whereby the situation is
considered as a moderating factor with regard to which
"type" of leadership style is the most effective. The
debate over whether management style really affects group
performance was discussed again by Gabris and Giles
(1983). They concluded the relationship between
leadership style and performance is at best weak. The
authors suggested perceptions of management style do,
however, influence perceptions about other characteristic
of the organization. Among these "other" characteristics
are communication, leadership process, etc. This
interpretation is congruent with the systems model as
members' personalities are seen only to directly impact

8
the group process (interaction) while indirectly
affecting performance.
Other researchers realized that the characteristics
of other group members in addition to the leader can
impact on the group process. They have generalized
leadership research to encompass all the members of the
work group. Carter (1954) conducted a factor analysis on
the variables measuring individual behavior in small
groups and identified three major factors: (I) individual
prominence and achievement, (II) aiding attainment by the
group, and (III) sociability. The first factor describes
a member who is motivated to increase his/her own power.
The second factor describes a member who puts the group's
interests or goals before his/her own. The final factor
describes a member who has little concern for individual
or group performance, but is concerned with the
affillative aspects of the group situation. Borgatta,
Cottrell, and Mann (1958) identified factors
corresponding to factors I and II of Carter's model when
they described the behavior of students in problem
solving groups.
Building upon the theoretical work of Carter, the
Orientation Inventorv (ORI) developed by Bass (1962) is a
self-report instr\iment designed to classify individuals
on three dimensions: self, interaction and task
orientations. Bass surmised that how a person responds

9
to a task and to co-workers depends upon the
satisfactions they seek. The author described three
kinds of satisfactions which motivate the person's
behavior: (a) self orientation—attaining personal goals,
even at others' expense, (b) interaction orientation—
having a good time, and (c) task orientation—getting the
job done. Depending upon the group situation and the
overall environment, different motivations may be more
beneficial in achieving group goals. In his review of
research involving the ORI, Ray (1973) concluded
organizations should place emphasis on selecting those
individuals high in task orientation in order to maximize
efficiency. Berkowitz (1980) in describing group
productivity also concluded that the degree to which an
individual is concerned with getting the group's job
completed is an important dimension.
An analogous inventory measure, specific to military
personnel, was reported by George (1967, 1977).
According to George, individuals in groups seek to
maximize personal achievement, socialization and/or
coordination. Coordination or task orientation was found
to predict group performance, and this characteristic was
also reported to be trainable (George, Hoak, & Boutwell,
1962) . At the most basic level. Team motivation (TM) is
characterized as recognizing and acting upon the group's
need without specific direction to do so. The high TM

10
individual is said to voluntarily help a co-worker when
and only when such action will facilitate group
effectiveness. In a study which considered the
initiative taking behavior of individuals, leaderless
groups of ROTC cadets were assigned the task of
assembling from a stack of parts, one fewer rifles than
the group had members (George, Simms, & Lumpkin, 1969).
Those who quickly assembled a rifle, or who had no parts
to work with, could choose to help the others or remain
an observer. After completion of the tasks, each member
wrote a critical incident report on at least one other
cadet whose behavior had affected the group's
performance. Additionally, an assigned observer rated
each cadet on coordinative types of behaviors.
Coordination (assumed to be functionally equivalent to
the presumed TM trait) correlated .47 (p<.05) with the
number of positive critical incidents (making
suggestions, giving direct aid, etc.), and -.37 (p<.05)
with negative critical incidents. No direct measure of
TM was taken in this study.
Johnson, McDonald, and George (1985) drawing from
the works of Carter, Bass, and George developed the
Worker Motivation Scale to assess the motivations of
workers within a group. Items on the scale are said to
measure individuals on three motivation dimensions: team,
affiliation, and prominence. Team Motivation (TM) is
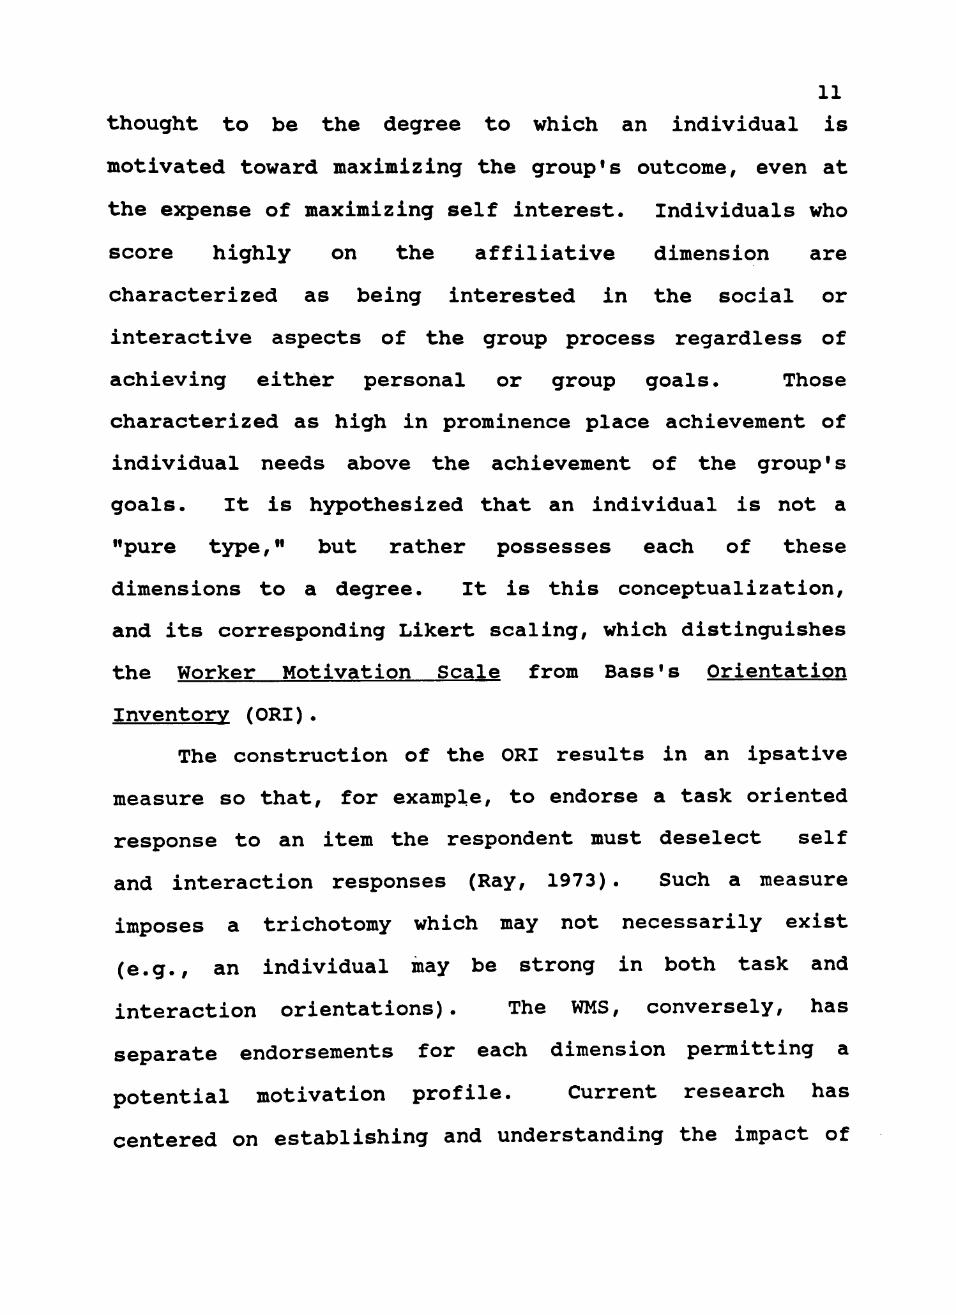
11
thought to be the degree to which an individual is
motivated toward maximizing the group's outcome, even at
the expense of maximizing self interest. Individuals who
score highly on the affillative dimension are
characterized as being interested in the social or
interactive aspects of the group process regardless of
achieving either personal or group goals. Those
characterized as high in prominence place achievement of
individual needs above the achievement of the group's
goals. It is hypothesized that an individual is not a
"pure type," but rather possesses each of these
dimensions to a degree. It is this conceptualization,
and its corresponding Likert scaling, which distinguishes
the Worker Motivation Scale from Bass's Orientation
Inventorv (ORI).
The construction of the ORI results in an ipsative
measure so that, for example, to endorse a task oriented
response to an item the respondent must deselect self
and interaction responses (Ray, 1973). Such a measure
imposes a trichotomy which may not necessarily exist
(e.g., an individual may be strong in both task and
interaction orientations). The WMS, conversely, has
separate endorsements for each dimension permitting a
potential motivation profile. Current research has
centered on establishing and understanding the impact of

12
the single dimensions on the group process before
shifting to the more complex profile model.
Initial validation of the TM dimension (Johnson,
McDonald & George, 1985) indicated those individuals
measured as high in team orientation facilitated group
performance on an interdependent task more so than did
those individuals measured to be low on this dimension.
In this study, individuals were pretested on the team
motivation measure and were placed into either high or
low TM, same gender workgroups: six high TM groups and
eight low TM groups. Those males with TM scores greater
than 44 were defined as high TM subjects, while those
with scores less than 37 were defined as low TM subjects.
Females with scores above 44 were considered to be high
TM subjects, and those with scores less than 36 were
identified as low TM subjects. Those scoring in the
middle range were excluded from the group task portion of
the experiment. Each workgroup was comprised of two
subjects and a same gender confederate. The role of the
confederate was to work slowly and hinder the progress of
the group, unless other group members initiated aid to
the inefficient confederate. The groups' task involved
pricing, extending and totaling a series of invoices.
The mean productivity score (total number of completed
invoices) for the high TM groups was found to be
13
significantly better than that of the low TM groups
(t(12)=5.27, p<.0002).
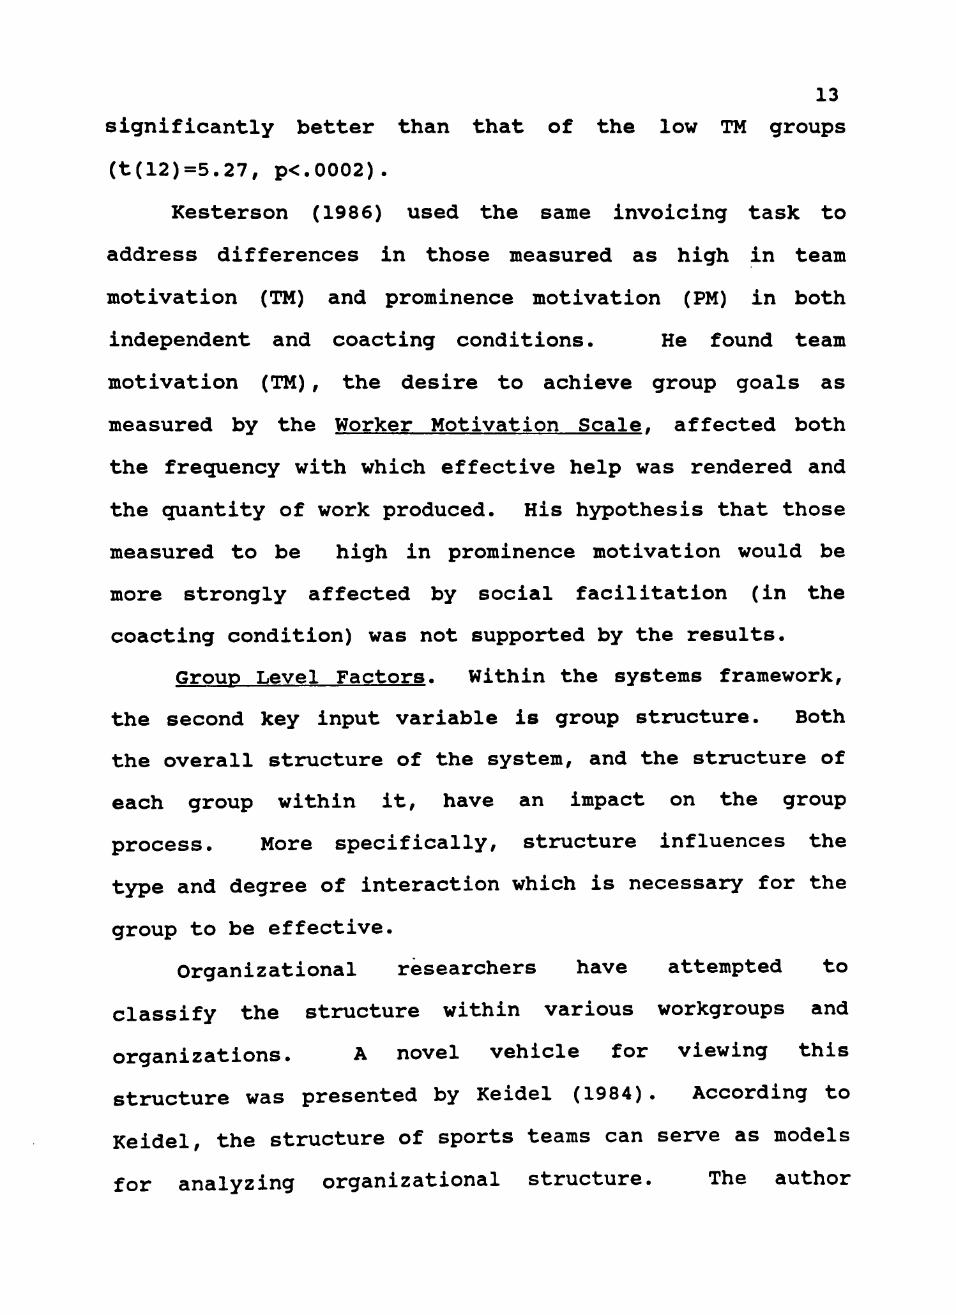
Kesterson (1986) used the same invoicing task to
address differences in those measured as high in team
motivation (TM) and prominence motivation (PM) in both
independent and coacting conditions. He found team
motivation (TM), the desire to achieve group goals as
measured by the Worker Motivation Scale, affected both
the frequency with which effective help was rendered and
the quantity of work produced. His hypothesis that those
measured to be high in prominence motivation would be
more strongly affected by social facilitation (in the
coacting condition) was not supported by the results.
Group Level Factors. Within the systems framework,
the second key input variable is group structure. Both
the overall structure of the system, and the structure of
each group within it, have an impact on the group
process. More specifically, structure influences the
type and degree of interaction which is necessary for the
group to be effective.
Organizational researchers have attempted to
classify the structure within various workgroups and
organizations. A novel vehicle for viewing this
structure was presented by Keidel (1984). According to
Keidel, the structure of sports teams can serve as models
for analyzing organizational structure. The author

14
identifies three major sports as analogous to
organizations: baseball, basketball, and football. Each
model is based upon the concept of internal
"interdependence." This interdependence refers to how
parts of the organization interact.
Baseball teams are said to have a high degree of
pooled interdependence with little interaction among the
group members. Each member functions autonomously, and
the team performance is the sum of each member's
individual performance. An example of an organization
which would fit the baseball model is a sales
organization with high performance. In general,
salespersons work on their own, and the year-end
performance of the organization is measured as the sum of
each salesperson's sales record. The organization is
considered a sum of its parts; such an organization is
classified as a network according to Keidel.
Football teams are characterized by sequential
interdependence, whereby the parts of the team interact
in a series. Interaction occurs at the sub-unit level.
The football team is thought to be comprised of several
such sub-units (e.g., kicking team, offense, defense,
etc.) and the total team performance is the sum of the
sub-units' performances. Football-like companies would
include those such as a mass assembly line where
production occurs in discrete steps. The best

15
description of such an organization's structure is
mechanistic. Companies which are analogous to this model
require a high degree of managerial coordination and the
roles and responsibilities of members must be specified
in order to achieve this coordination.
Lastly, the basketball team has a high degree of
reciprocal interdependence. Each part interacts with the
other parts. In basketball the basic unit is the team,
and performance of such a team is a function of player
interaction. "Think-tank" consulting firms are one
example of a basketball-like company. These types of
organizations are highly flexible and could best be
described as organic in nature. Coordination is
generally handled by members who share the responsibility
for the organization.
While those who are familiar with these sports could
find fault with Keidel's suggestion that baseball and
football do not require interaction among members, his
models suggest a continuum of interdependence which is
useful when characterizing organizations as well as the
workgroups within an organization.
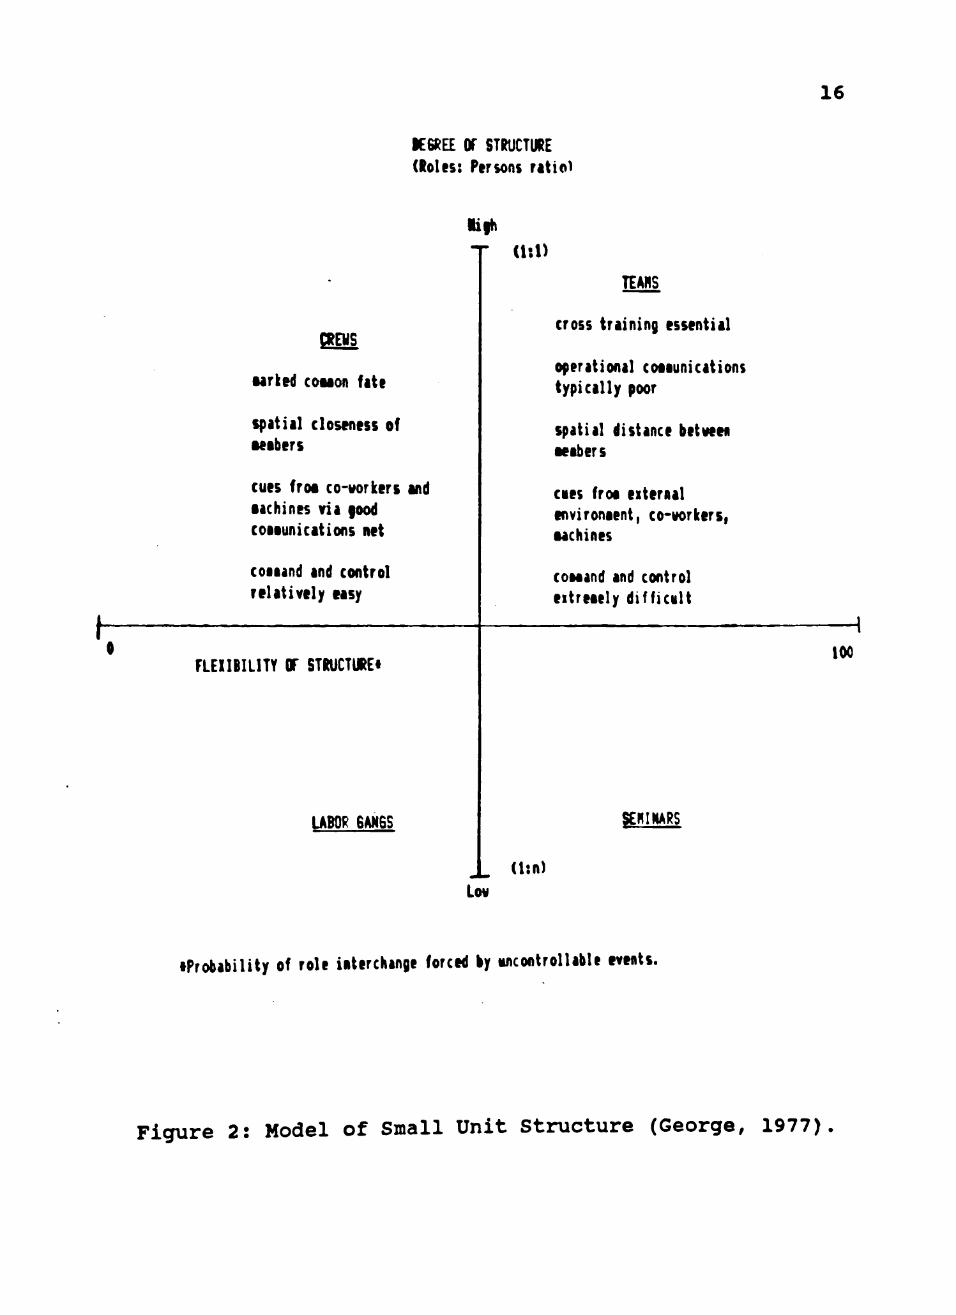
A classification scheme conceptually similar to
Keidel's has been proposed by George (1977). In order to
perceive the structure of a given group, one can view the
group in terms of its degree of structure and the
flexibility of its structure (See Figure 2).
16
lEGREE or STRUCTURE (Roles: Persons r t t io^
Ulh T (1:1)
CTEWS
Mrked couon fate
spat i l l closeness of •ethers
cues f r o i co-vorkers and •achines via (ood coiiunications net
coiaand and control re la t ive ly easy
TEAHS
cross training essential
operational cotiunications typical ly poor
spatial distance betveea •eabers
cies froa eiteraal environaent, co-«K>rkers, tachines
coMand and control e i t re te ly d i f f i c a l t
FLEIIBILITY OF STRUCTURE*
UB0R6WISS SEHIHARS
(l:n) Lov
iProbability of role intirclianje forced ly uncontrollable events.
100
Figure 2: Model of Small Unit Structure (George, 1977).
17
The degreee of structure refers to the degree of role
differentiation among group members or, put simply, the
number of discrete roles. Flexibility refers to the
probability that role interchange will occur during the
completion of the group task. A "team" would be an
example of a group which is both highly structured and
also highly flexible. In a "team" situation, members are
given a specific role assignment; however, due to the
nature of the task there is a high probability the
members will be called upon to aid each other in the
completion of the task. A crew is an example of a group
which, while highly structured, has a low degree of
flexibility; members have specified roles and do not
expect role interchange to be necessary in the completion
of the task.
Examples of low structure, low flexibility groups
include labor gangs in which there are generally a few
roles and each member works independently. Seminars
would be the final example of group structure, that of a
group which has low structure and high flexibility.
The structure inherent within the group can
influence how the group will "process" its task. In
groups where there is a high degree of flexibility,
interaction is more probable to occur and members'
expectation of the degree to which they should assist
others members will be high.

18 However, in group situations where role interchange
is not expected (low flexibility such as the crew or
labor gang), the importance of the quality and quantity
of interaction becomes crucial when a critical event
occurs.
Environment Level Factors. According to the systems
model, environment-level factors such as group task
characteristics, reward structure and level of
environmental stress are the remaining inputs influencing
the group process. These environment-level factors like
the group-level factors described previously will
influence the expectations of group members and degree
and type of interaction necessary for the group to
complete its tasks.
Group Process
The majority of the research views the process stage
of the systems model as the interaction or communication
phase. According to Redding (1972), communication is a
cost factor to an organization. It entails expenditure
of time, effort, and resources. Both the message sender
and the message receiver must pay a price; therefore, the
amount of communication desirous within a work group is a
function of this cost/benefit relationship.

19 Relationship of Input Variables to the Group Process
Individual Level Factors. The studies of
personality variables have been concerned mainly with the
impact of personality on performance or the influence of
the leader's attitudes upon the superior-subordinate
relationship.
Previously, Mann (1959) reviewed the literature from
1900 to 1957 regarding the relationship between
personality and performance in small groups and uncovered
several proposed relationships pertaining to the
understanding of personality and interaction.
Adjustment, extroversion, masculinity, dominance, and
conservatism were found to be positively related to the
task activity rate. Task activity was considered to be
the number of acts initiated which were relevant to the
completion of the task. These relationship, however, did
not hold when the analysis controlled for total activity
rate. In other words, those individuals possessing the
above characteristics demonstrated more activity overall,
some of which was related to the completion of the task.
Mann also found reference to the relationship between
intelligence/adjustment and social-emotional acts. The
more intelligent or better adjusted the individual, the
more likely he/she is to concentrate on positive-social
emotional behaviors.

20
Superior-subordinate communications are described by
Jablin (1979) as those exchanges between organization
members where at least one person is in a position of
power/authority over another. Communication can occur
either downward or upward. Downward communication is
generally characterized by information exchange
concerning instructions, feedback, or policy. Upward
communication usually involves information about the
subordinate, co-workers, or task. According to the
author, the majority of superior-subordinate interaction
concerns tasks issues. With regard to the influence of
personality, Jablin's review implies an interpersonal
orientation on the part of the leader results in greater
overall communication. Trust is another concept
considered to be important to the development of a
positive superior-subordinate relationship. Leaders must
be able to trust their subordinates in order to be
effective: the leader must view the worker as capable
(Dvidedi, 1983) . This development of trust may be
hindered by those leaders who hold to McGregor's Theory X
assumptions, that is, those managers who view workers as
somewhat lazy and dependent may have difficulty
developing a climate of trust in which their subordinates
perceive an openness to communicate.
Feldman (1984) further considered the leader's
ability to influence the group climate through the

21
development of group norms. As members work together as
a unit, norms relating to expected productivity and
acceptable behaviors are said to develop (Tuclcman, 1965) .
According to Feldman, explicit statements by supervisors
are one means by which groups norms are defined and
developed. Group leaders may set standards for the group
which will facilitate performance, for example,
requesting members to make suggestions and contribute
ideas. Managers can also define role expectations in
terms of group members, such as defining the leader as
the sole authority. Although not directly studied, the
personality orientation of the leader may influence the
standards and role expectations he/she fosters within the
group.
Direct testing of the impact of leader/member
personality upon the interaction process is not found in
the recent literature. Indirect reference to such
concepts can be seen in articles addressing the nature of
trust and supportive relationships among superiors and
subordinates. Emphasizing Redding's discussion of the
cost of communication, the amount of interaction in
general is not correlated with productivity in a perfect
fashion. Perhaps the personality orientation of the
leader and/or worker affects both the amount of
interaction and, more importantly, the relevance of the
interaction.

22
The relationship between personality orientation and
productivity has been researched somewhat more
extensively. Indik, Georgopoulos, and Seashore (1961)
studied whether the nature of the superior-subordinate
relationship affects the job performance of subordinates.
Using a survey technique and performance results, the
authors concluded a high level of performance is
associated with the following: (a) an openness of
communication channels between the superior and the
subordinate, (b) the subordinates' approval of the
superior's supportive behavior, (c) a high degree of
mutual understanding of each others' viewpoints, and (d)
autonomy on task matters.
More recently, McDonald-Pierce (1986) studied the
effect of the level of team motivation (TM) as measured
by the Worker Motivation Scale and group cohesiveness on
the productivity of groups working on an interdependent
task. Using a modification of the invoice task,
previously used by Johnson, McDonald and George (1985)
and manipulating perceived cohesiveness of group members,
McDonald-Pierce found groups measured to be high in
cohesiveness performed significantly better than those
defined as low in cohesiveness, regardless of the groups'
TM level.
Finally, Downs and Pickett (1977) investigated the
relationship between leadership styles and group

23
compatibility upon productivity. Their subjects were
members of a women's organization who were placed in
groups based upon their results on Shultz's FIRO-B. The
composition of the groups was such that the group was
either: (1) compatible-overpersonal, (2) compatible-
underpersonal, or (3) incompatible. Compatibility refers
to the amount of similarity in needs, while
overpersonal/underpersonal refers to the need for
interchange in the area of affection. Group leadership
was varied using confederates who utilized either a task
orientation or an equal task/person orientation as
described by the Managerial Grid. In general, the
results showed an interaction of leadership and
compatibility, especially for the overpersonal groups.
Groups defined as overpersonal were the most productive
for the task leader but reported higher degrees of
satisfaction with the task/person oriented leader.
This study might be criticized for a variety of
reasons. First, the researchers failed to utilize the
full Managerial Grid delineation of behavior by including
a person-oriented leader in the paradigm. They could
have used the individual's need for affection as measured
by the FIRO-B to make this categorization. Also, the
nature of the group task may have resulted in an
unexpected confound. The task involved a group
discussion and test over an assigned reading, which

24
pertained to communication achievement in groups and
compatibility. The content of the reading itself may
have affected the satisfaction ratings reported by the
group members.
Summarizing the literature reviewed thus far, one
finds studies which indicate member personalities do have
an indirect impact on group productivity. However, the
field lacks studies which directly measure how this
effect takes place. Studies need to be designed whereby
the interaction-productivity link becomes further
established, as well as establishing the nature of the
personality-process link.
Group and Environment Level Factors. Organization
characteristics are thought to impact first upon the
group structural properties, and then to indirectly
affect productivity (Pearce & David, 1983). From their
literature review, Pearce and David suggested the design
of the organization will affect group performance through
its impact upon group communication (especially
information flow). They proposed a model of social
network analysis which focuses on the interpersonal
processes of the group and uses the group structure as
the moderating variable. Properties considered to
describe the group include: (1) connectedness or level of
cohesiveness, (2) centrality or the degree to which
relationships are guided by structure, (3) reciprocity or
25
the openness of communication, (4) vertical
differentiation or the degree to which different
organizational levels are members of the same workgroup,
(5) horizontal differentiation or the degree to which
job areas are represented in the workgroup, and (6)
coalitions. The two organization designs considered in
this model are: (1) mechanistic and (2) organic. The
authors proposed a series of hypotheses to describe how
organizational design ultimately impacts on performance.
In general, mechanistic organizations result in high
group centrality and high vertical differentiation, both
of which are considered to have a positive effect on
performance. Thus, the positive effects of a mechanistic
structure appear to result from roles that are clearly
defined and represented within the workgroup. Organic
designs are said to result in the following: high
connectedness, high reciprocity, and high horizontal
differentiation. These are also proposed to have a
positive impact on group performance as they foster a
supportive environment. Organic designs are also said to
foster the development of two types of members: stars and
liaisons. Stars are those individuals who become the
focus of communication and who are thought to have
influence on the jobs of other meinbers. Liaisons are
those individuals who serve as the communicators among
workgroups. These hypotheses and others proposed by the

26
authors were not directly tested in their paper; rather,
the authors suggested them as a framework for future
research.
Greenbaum, Holden, and Spataro (1983) reported a
study of an industrial organization which sought to alter
the group structure in hopes of increasing group
effectiveness. Specifically, they sought to implement
employee participative methods in the form of workgroup
meetings. Employees were instructed the goals of these
meetings were to encourage open discussion of work-
related problems, to increase coordination and
productivity, to increase an individual's knowledge of
the organization, and to create a better superior-
subordinate climate. Groups of 4 to 11 members from the
same work area met once a month for these meetings. The
chairperson of the group (usually the superior) was
instructed to encourage participation of all members.
The total number of meetings per group over a five year
period was 42. Participants were asked to complete a
series of questionnaires which investigated the members'
feelings about the meeting, job satisfaction, perceptions
of the supervisor, and autocratic-democratic tendencies.
Analysis of survey responses indicated the organization's
goal of increasing communication was achieved. As this
was a longitudinal study an actual measure of
productivity had not yet been taken.

27
Research on organization structure suggests
structure should be seen as an influence on the
communication network within workgroups. As was
discussed previously, the nature of the group also
influences the degree to which interaction is necessary
for task accomplishment. In an assembly line situation,
for example, interaction among group members is not as
necessary for task completion as it is in a "think-tank"
situation. To the extent interaction is not an existing
norm of the group, the necessity for it in a critical
situation can be crucial for the successful completion of
the group task.
Application of Systems Theory to Flightcrews
The literature suggests an attempt to study the
group process within the context of the systems model
must be approached with caution. While several studies
have been able to demonstrate relationships between
selected links within the model, there has not been a
successful testing of the full model (Haclonan & Morris,
1984). Hackman and Morris proposed methodological
difficulties make the study of the full model difficult;
however, these proposed difficulties may only emphasize
that, in many cases, the group situation has not been
adequately defined. The interaction or communication
process has been characterized by most researchers as a

28
means of providing task-relevant information which is
pertinent to the successful completion of the task. As
the studies which addressed the impact of group structure
have shown, in some cases the conveyance of information
is considered to be necessary and appropriate, while in
other situations communication among group members is not
seen as necessary for completing the group tasks (e.g.,
routine assembly line work). Consequently, when one sets
out to study the group process within the context of the
systems model, one must address the issue of whether this
model is representative of the group process itself.
Group interaction is of vital importance in many settings
which lend themselves to the application of systems
theory.
Foushee (1982, 1984) suggested human errors, which
are prevalent in airline disasters, can be associated
with two types of non-productive behaviors. In the first
instance, members of the crew fail to provide the pilot
with vital information at a critical moment. In the
second instance, the pilot fails to act upon the vital
information which is provided to him/her. Both of these
cases result in an obviously undesired outcome—the plane
crashes or experiences a near collision. The literature
regarding group process and systems theory provides one
with a context for viewing the aircrew and suggests
possible explanations for their ineffective behavior.

29
Helmreich (1984) discussed the influence of aircrew
member characteristics upon crew coordination and
stressed the difference between personality traits and
attitudes. A personality trait is a relatively stable
characteristic of the individual that is resistant to
change. Conversely, attitudes are less deeply ingrained
and are subject to change through the use of many
techniques.
In a study of 245 airline pilots serving as captains
and first officers, Helmreich concluded the personality
characteristics of crew members and their attitudes
concerning appropriate management of the flight deck, as
measured by the Cockpit Management Attitudes Survey, are
independent in their influence. He further suggested
attempts to improve aircrew performance through training
should focus on changing the individual's beliefs through
the presentation of empirical data, group discussions,
and behavioral exercises. Helmreich, Foushee, Benson,
and Russini (1985) studied aircrew performance and found
pilot's attitudes regarding cockpit management as
measured by the Cockpit Management Attitudes Survey were
significant predictors of behavior as evaluated by
trained observers. The effective pilot was characterized
as one who could recognize personal limitations in
emergencies and who encouraged other crewmembers to
question decisions and actions. The effective pilot was

30
also aware of the importance of verbalizing plans, as
well as maintaining a positive flightdeck climate. The
ineffective pilot was characterized as possessing those
traits stereotypic of the "macho pilot." A flightdeck
managed by such an ineffective pilot should reflect less
team coordination than a flightdeck managed by an
effective pilot. In terms of member characteristics,
pilots of commercial airlines often possess differing
attitudes and personalities which influence the operation
of the flightcrew. Some pilots may foster environments
where trust and interaction are the norm, while others
may influence group norms such that free communication
among members may be prohibited. Also, they may consider
other flightcrew members to be of lower expertise than
themselves and consequently fail to perceive them as
credible sources of information.
Utilizing George's structure analogy, the aircrew is
operating in a highly structured, low flexibility
situation. Each flightdeck member has an assigned role
(e.g., pilot, navigator, etc.) with defined tasks. Under
normal flying conditions each member is responsible for
his/her own function. However, when a critical situation
arises the crew must rely upon relevant interaction to
avoid disaster. It is under this condition the
importance of group interaction process assumes a
significant role, and whereby the systems model becomes

31
the most appropriate means for studying, understanding,
and improving aircrew performance.
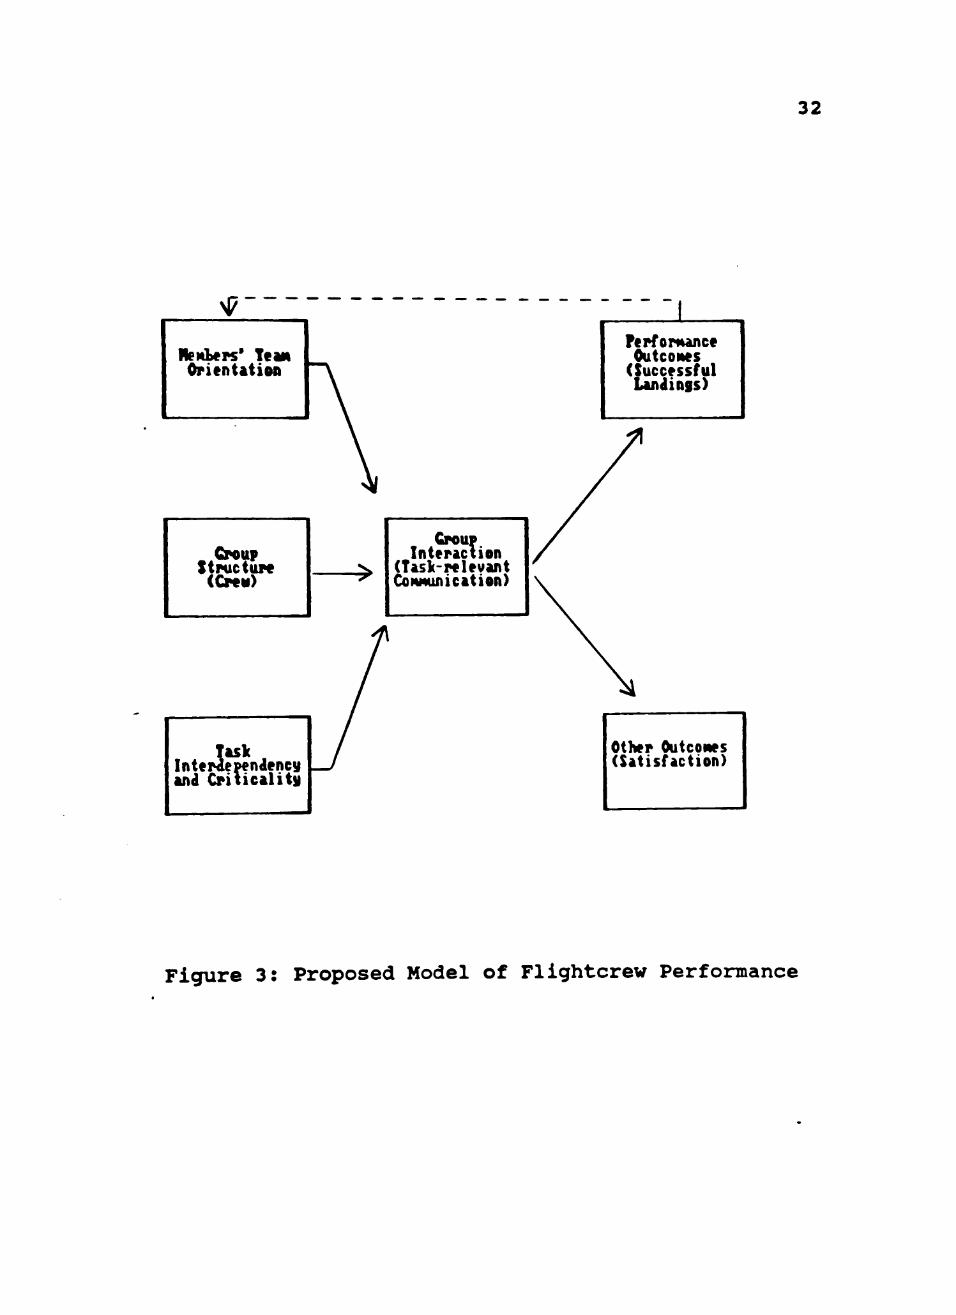
The systems model as adapted by Hackman and Morris
(1983) can be applied directly to the aircrew situation
as seen in Figure 3; specific hypotheses are proposed.
Hypotheses
1. Highly Team-Motivated individuals tend to
provide assistance to other group members when the
success of the group is dependent upon the group
performing as a coordinated unit (Johnson, McDonald &
George, 1985). In situations where the criticality of
the interaction becomes important, highly Team-Motivated
groups will exhibit more task-relevant communication.
2. In the flightcrew situation, interaction is
viewed as the key to group performance (Foushee, 1982).
Groups which convey more task-relevant interaction will
have higher performance outcomes as measured by
productivity and group satisfaction.
3. An individual's motivation to ensure that the
group achieves its goals can be increased through
appropriate training and feedback (George, 1977). After
training and feedback, those members initially
characterized as low in team motivation will show
significant improvement in their TM score.
32
^
HeMLers' Tcan Orientation
Performance Outcones
(Successful Landings)
Croup Structure
(CFOM)
Group Interaction
(TAS Irrelevant CoNHunication)
Task Interdependency and Criticality
Other Outcones (Satisfaction)
Figure 3: Proposed Model of Flightcrew Performance

33
4. Highly Team-Motivated groups will express
greater satisfaction with their group and the task, as
compared to groups low in Team Motivation.
5. There is an interaction between training and
motivation, such that, with appropriate training and
feedback, there will be no difference in the performance
of low or high Team-Motivated groups.

CHAPTER II
METHODS
Subjects
Undergraduate students (n=157) enrolled in the
introductory psychology course at Texas Tech University
served as subjects. After an initial test, students were
divided into 24 dyads. Voluntary participation is one
means of partially fulfilling course requirements.
Materials
The six Team Motivation (TM) items of the Worker
Motivation Scale were used to make assignment to groups.
These items are constructed so as to assess the extent to
which an individual is motivated toward the achievement
of the group's goals. Those scoring high on such items
are said to find more reward with completion of the
group's task and achievement of the group's goals than in
fulfilling any personal goals such as recognition of
effort (Prominence Motivation)and/or interaction with
others (Affiliation Motivation). Individuals scoring low
on Team items are assumed to be more focused on
fulfilling personal needs in a group situation. Appendix
A contains a complete example of the Worker Motivation
Scale. McDonald and George (1986) conducted a factor
analysis on the WMS items using responses for 452
students. Based upon their analysis 4 items were dropped
34

35 from the original pool of 23 items; the revised measure
was used in this study. Assignment of items to each of
the three subscales was based upon the item's highest
factor loading (see Appendix B) . In addition, the same
data were used to develop normative scores for the WMS
(see Appendix C).
The reliability and validity of the WMS was assessed
by McDonald, George, Hoyer, and Roark (1986) in a study
using 91 undergraduate students. Participants were given
both the WMS and the Wonder lie Personnel Test (Wonderlic,
1978) . Students were re-administered the WMS after a 3
week interval. Test-retest reliabilities for the
subscales were: (a) .57 for Team Motivation, (b) .66 for
Affiliation Motivation, and (c) .58 for Prominence
Motivation. There were no significant correlations
between the Wonderlic Personnel Test and the WMS. In
the present study, a portion of the students (n = 23)
were re-administered the WMS after an interval of
approximately 3-7 days, the test-retest reliability on
the Team Motivation subscale was .67.
The groups were asked to participate in a flight
simulation task using "Solo Flight" developed by
MicroProse Software and marketed for use with Commodore
computers. The flight game which is one option of the
program requires the "pilot" to navigate a path from an
airport of origin to a destination airport within a given

36
geographical area (Washington State). An enlarged map of
the geographical area (reproduced from the game manual,
see Appendix D) which detailed altitude Information,
terrain, major landmarks, etc., was located adjacent to
the workgroup and in nearest proximity to the student
assigned the role of the "navigator." Additionally the
game randomly creates emergencies where there may be an
instrument malfunction or instrument failure. The
probability of such incidents increased as the time
elapsed in the air for a given flight increased.
A trained, independent observer coded the task-
relevant communication of each role member on each flight
run using the method of interaction process analysis
developed by Bales (1950). Bales' method of analysis
requires the observer to code each of the participants'
communications into observation categories: giving a
suggestion or direction, giving an opinion, evaluation,
and analysis, or giving orientation and information.
Appendix E contains an example of the coding sheet. In
this study, the observation categories were further
defined using descriptive information gathered in a pre
test of the flight simulation method. The observer was
stationed behind a one-way mirror and was able to both
see and hear the communication via a speaker in the
experimental room.

37
Additional materials used in this study included a
critical incident report which group members were asked
to complete at the conclusion of the experiment. This
report asked students to explain "What their group did or
might have done to improve their performance." Finally,
a satisfaction measure comprised of the work and co
worker scales of the Job Descriptive Index (Smith,
Kendall & Hulin, 1969) was administered to students after
completion of the experiment (see Appendix F).
Procedure
The experiment was conducted in two sessions. All
students participated in the first session in which they
were administered the Worker Motivation Scale (WMS).
This session lasted approximately 20 minutes, and at the
conclusion students were told that a portion of the group
would be contacted by a research assistant to participate
in an additional 1 1/2 to 2 hour session. The importance
of attendance in the subsequent session was stressed.
Students were assigned to either a low or high Team
Motivated group based on their scores on the Team
Motivation subscale of the WMS. Twelve groups were
comprised of students with scores above the mean (a score
of 27) in Team Motivation and twelve groups were
comprised of those with scores below the mean. The

38
experimenter was not informed as to the time assignments
for the high and low Team Motivated groups.
The second session entailed the flight simulation
itself. Students were randomly assigned to either the
navigator or flight engineer role when they arrived for
the experiment. The third group member, who served as
the pilot, was a male confederate in all conditions. It
was decided to use a confederate in this role for the
following reasons: (a) to control for expertise in
executing the technical aspects of the flight simulation
game, and (b) to create a more realistic aircrew
situation by instructing the students the "pilot" had
greater actual flying experience and more simulator
training than the other group members. The confederate
was previously trained in the technique of "flying" the
plane, and was instructed to follow only the instructions
given by the two crewmembers (e.g., if the navigator
failed to indicate a desired flight path, the pilot would
not consult the map and navigate the plane himself, or if
an instrument failure occurred, the pilot would not act
unless instructed by a co-worker). These instructions
were given to the confederate so as to create help-
necessitating situations, whereby the success of the
group would become dependent on team effort and
coordination. The confederate was instructed to utilize
any suggestions made by the group members, and members

39
were allowed to communicate both before, during and after
each trial session.
Experimental Task
Students were seated at a table on each side of the
pilot so each member was able to view the computer
screen. An enlarged flight map was taped to the wall
adjacent to the member assigned to the role of the
navigator. The groups participated in two 40-minute
trial blocks. Each block was comprised of five flight
simulations in which the group had to successfully
navigate to and land at a specified airport. On each
flight the group always departed from the same airport.
The second trial block was essentially a repeat of the
first, that is, the groups "flew" to the same five
airports in the same order as in the first trial block;
however, because the computer program randomly created
difficulties/emergencies, each flight situation was
unique.
Prior to the first flight, students were instructed
as to their roles and task as follows:
You are here to participate in an experiment to find out how well three people can operate together as a work team in a cockpit simulation. Your tasks as a work group or team will be to function as efficiently and as effectively as possible in completing your tasks. Specifically, you will be delivering 5 bags of mail, one to each of five airports in

40 the state of Washington in the least amount of time possible.
Bryan has already been trained and has spent many hours over the past several months flying the simulation game. He already has his private pilot's license and has had experience in piloting and navigation including the use of flight simulators. He will serve as your pilot in today's experiment.
Subject #1 your job will be that of the navigator. Your task is to assist in directing the plane on the most efficient route to your airport destination. You will be using the map, located to the right of your seat, the flight screen view of the local terrain, and the navigation instruments on the instrumentation panel.
Subject #2 your job will be that of the flight engineer. Your task is to monitor the instrumentation panel in terms of the fuel gauge and indicator lights and note any malfunctions.
I will now show you on a flight demonstration what each of the instruments are. Please refer to the attached drawing and explanations as I explain the purposes of the instruments.
There will be two trials. On each trial your goal is to deliver 5 mail bags, one to each of five airports in the following order. You will be given one attempt to get to each destination.
1. Portland to Kelso 2. Portland to Olympia 3. Portland to Seattle 4. Portland to Chelan 5. Portland to Yakima
You will receive feedback from the computer if your plane crashes. As a part of the game, the computer also gives you points based upon how efficiently your group completes its tasks of reaching an airport. I will record the time it takes you on each attempt.

41 Remember, each member of the team has a specific task to complete, but as members of a work team you are free to help if it will aid the group in performing better.
This simulation is designed to represent real world flying and therefore conditions may change during the experiment. For example, weather conditions may vary. Any malfunctions (instrument or a need for fuel) can be corrected by landing at any airport.
You have a maximum of 8 minutes for each attempt to reach an airport.
Appendix G contains an example of the instruction
manual provided to each group member. After the
instructions were read, students observed a demonstration
flight by the computer. During the demonstration, each
instrument was explained regarding how to read and
interpret the information the instrument provided.
Students were instructed to refer to their manuals during
the experiment if they had any questions regarding an
instrument. Additionally, navigation using the map and
navigational instruments was explained. After the
explanation, each student was asked a series of questions
pertaining to reading and interpreting those instruments
which were primary to their assigned role (see Appendix
H) . If a student answered a question incorrectly, the
instrument was again reviewed.
Half of the twelve high Team Motivated groups and
half of the twelve low Team Motivated groups were
randomly assigned to a feedback condition. These groups
42
were given a 5 minute feedback session between the first
and second trial blocks in which their performance on
their initial five flights was reviewed and they were
asked what they might do to improve their group
performance. If the group members were unable to
generate suggestions pertaining to increasing
communication and helping each other, it was suggested to
them by the following statement:
This is a complex task and it is difficult for one person to do alone. It may help you if when you know something you will tell each other and help each other out. What kinds of information do you think it is important to give?
Groups in the nonfeedback condition were given a 5
minute empty period between the first and second trial
blocks. At the conclusion of the experiment, students
were asked to write a critical incident report on their
group describing "What the group did or could have done
to improve their performance." Additionally, students
were asked to complete (1) the work and co-worker scales
of the Job Descriptive Index (JDI) and (2) the WMS.
Students were then briefed concerning the hypotheses
under study and the manipulations of the experiment.
They were asked to refrain from discussing the experiment
with any other students to prevent influencing the
behavior of other groups. The students were also told a

43
final report of the study would be make available to them
upon request.
Design
A two-by-two-by-two analysis of variance design
with repeated measures and coefficients of correlation
were the primary methods of analyses used. Independent
variables were high or low scores on the Team Motivation
subscale of the WMS and training or no training between
trial blocks. The repeated measure was trial blocks.
The dependent measures were number of successful landings
on each trial block, the number of task-relevant
communications made by group members, and member
satisfaction as measured by the work and co-worker scales
of the JDI.

CHAPTER III
RESULTS
It was suggested earlier in the discussion of
systems theory that in situations where coordination
among crew members is important to the completion of the
group task (such as created by the experimental
situation), highly Team-Motivated groups would exhibit
more task-relevant communication. Table 1 presents the
means and standard deviations for productivity and amount
of task-relevant communication. The amount of task-
relevant communication for Trial Block 1 was used to
test this hypothesis as data for this block were free of
the influence of the feedback condition. A composite
task-relevant communication score for Trial Block 1 was
computed by summing the number of task-relevant
statements made by each group across the five flight
runs. Due to the extreme variability of this measure
(Trial Block 1 M = 61.792, SD = 63.953), a non-parametric
analysis was conducted. A median talk score was computed
for the total sample on Trial Block 1 (Trial Block 1
Median=33.50) and groups were classified as to having
scores above or below the median. The low TM groups were
evenly split with half (n=6) of the low TM groups scoring
above the median and half below on the talk measure.
44

45
TABLE 1
Means and Standard Deviations for Productivity and Task Relevant Communications on Trial Block 1,
Trial Block 2 and Total (n = 24 groups)
Productivity Task-Relevant Communication
M SD M SD
Trial 1 1.83 .92 61.79 63.95
Trial 2 3.00 .88 68.29 48.26
Total 4.83 1.40 130.08 109.45
46
The high TM groups reflected the same distribution; half
(n=6) reported composite talk scores above the median
while the remaining were below.
Hypothesis 2 predicted groups which conveyed more
task-relevant interaction would have higher performance
outcomes as measured by productivity and group
satisfaction. A composite measure of task-relevant
communication for each trial block was calculated by
summing the total number of task-relevant statements made
by each group across the five flights. Additionally, a
total task-relevant talk score was computed by summing
the number of statements across both trial blocks.
Productivity for each trial block was defined as the
number of successful flights. The coefficient of
correlation between Trial Block 1 productivity and Trial
Block 1 amount of task-relevant talk was positive and
significant [r (22) = .42, p = .042]. The coefficient of
correlation between Trial Block 2 productivity and Trial
Block 2 talk was not significant [r (22) = .05, n.s.].
A composite work satisfaction score for each group
was computed by averaging the students' work satisfaction
score as measured by the JDI. A composite co-worker
satisfaction score for each group was computed in the
same manner using the co-worker satisfaction scale of the
JDI. The coefficient of correlation between total task-
relevant communication and work satisfaction was positive

47 and significant [r (22) = .43, p = .034], The
coefficient of correlation between total task-relevant
communication and co-worker satisfaction was [r (22) =
.36, E =.086].
Hypothesis 3 predicted those initially characterized
as low in Team Motivation would score higher on the TM
scale of the Worker Motivation Scale after training and
feedback than they did originally. That is, those
individuals who received appropriate feedback and
simulation training would significantly improve their TM
scores. Table 2 presents the means and standard
deviations for TM scores for the pretest and posttest
administrations, and Table 3 presents the same
information for the test-retest students. A two-by-two-
by-two split plot ANOVA was used to test this hypothesis.
As shown in Table 4 the results indicate main effects for
both level of Team Motivation and Time. Students
originally characterized as low in Team Motivation showed
the greatest change in their TM score. However, as shown
in Figure 4, when the scores of the test-retest students
are also considered, a general regression toward the mean
for the Low TM students is observed regardless of
participation in the experiment. Additionally, those
students initially characterized as low in Team
Motivation who did not serve in the feedback condition
showed the greatest overall change.

48 TABLE 2
Means and Standard Deviations for Team Motivation Scores Pre and Post Administrations by Condition
(n = 12 students per condition)
Team Team
Team Team
(pretest) (posttest)
(pretest) (posttest)
Low Team Motivation No Feedback M SD
21.50 27.17
3.73 5.02
High Team Motivation No Feedback M Sp
29.33 29.83
1.07 4.30
Low Team Motivation Feedback M sp
23.00 2.92 25.17 4.82
High Team Motivation Feedback M sp
31.42 3.92 31.17 3.90

49 TABLE 3
Means and Standard Deviations for Team Motivation Scores, Test-Retest Students Only
(n = 23 Low Team; n = 11 High Team)
Low Team High Team Motivation Motivation (Pretest) (Pretest) M SD M SD
Team (pretest) 23.97 2.01 30.64 1.91 Team (posttest) 25.52 3.42 30.45 3.47

TABLE 4
Split Plot ANOVA for the Team Motivation Measure (n = 48 students)
50
Source SS
Between Subjects
Team (A) Feedback A*B Error
931. (B) 12.
23. 877.
Within Subjects
Pre-post A*C B*C A*B*C Error
(C) 98. 86. 27. 11,
455.
1
26 76 01 46
,01 .26 .09 .34 .79
* p < .05 (two tail)
DF
1 1 '1 44
1 1 1 1
44
MS
931. 12. 23. 19.
98. 86. 27. 11. 10.
I
26 76 01 94
.01
.26
.09 ,34 ,36
F
46. .
1.
9. 8. 2. 1,
•
70 64 15
,46 .33 .62 .10
P
.001*
.428
.289
.004*
.006*
.113
.301

51
S a
S
32
31
3D
23
28
27
26
25
24
23
22
21
20 L
* — — - ^ ^
A
% • •
^ y^
^ /
D
•
• •
^ ^ A
^ m
D
/ ^A A ^ ^ o
LI6END
• High Teai-feedback • High Teaa-Mo Feedback A High Teai Test-retest
OLov Teaa-Feedback 0 Lov Teaa-No Feedback A Lov Teaa Test-retest
TH Pretest TH Posttest
Figure 4: Team Motivation Scores
52
Hypothesis 4 predicted highly Team-Motivated groups
would express greater satisfaction with their group and
with the task. The students' scores on the work and co
worker scales of the JDI served as dependent variables in
the analysis and levels of Team Motivation, presence or
absence of feedback, and assigned role with the group
served as the independent variables. Table 5 presents
the means and standard deviations for the work and co
worker satisfaction measures. The results show a
significant TM by Role interaction for group satisfaction
[F(l,40) = 3.36, p = .037 one-tailed] (see Table 6). High
Team Motivated members reported the greatest
satisfactions and this was most apparent for members who
served in the navigator role. The results for work
satisfaction were in the same direction; however, they
did not reach the level of statistical significance (see
Table 7).
Hypothesis 5 predicted given sufficient training
there would be no difference in the performance of low
and high TM groups. Tables 8 and 9 present the means and
standard deviations for productivity by condition. A
two-by-two-by-two split plot ANOVA with repeated measures
on the last factor was used to test for differences in
productivity. High and low scores were used to
establish the level of TM, and the presence or absence of
feedback established the levels of Feedback.

53
TABLE 5
Means and Standard Deviations for Work Satisfaction and Co-worker Satisfaction Scores for Crewmember Role by
Condition (n = 12 students per condition)
Work Co-worker
Work Co-worker
Work Co-worker
Work Co-worker
Low Team Motivation No Feedback Navigator M sp
30.50 10.56 33.67 20.54
Low Team Motivation Feedback Navigator M sp
30.67 7.87 39.00 12.07
High Team Motivation No Feedback Navigator M sp
40.33 7.79 48.83 4.22
High Team Motivation Feedback Navigator M sp
38.50 9.25 43.50 10.08
Low Team Motivation No Feeciback Flight Engr. M sp
37.33 14.25 45.33 7.00
Low Team Motivation Feedback Flight Engr. M sp
30.83 8.84 39.00 4.05
High Team Motivation No Feedback Flight Engr. M sp
33.33 13.03 43.50 6.83
High Team Motivation Feedback Flight Engr. M sp
34.00 8.92 38.83 6.21

54
TABLE 6
ANOVA for Co-worker Satisfaction (n - 48)
Source
Team (A) Feedback Role (C) A*B A*C B*C A*B*C Error
* E < .05
SS
234.08 (B) 90.75
2.08 60.75
352.08 90.75 114.08
4187.33
(one tail)
DF
1 1 1 1 1 1 1
40
MS
234.08 90.75 2.08 60.75 352.08 90.75 114.08
Z
2.24 .87 .02 .58
3.36 .87
1.09
P
.143
.357
.889
.451
.074*
.357
.303

TABLE 7
ANOVA for Work Satisfaction (n = 48)
55
Source
Team (A) Feedback Role (C) A*B A*C B*C A*B*C Error
* E < .05
SS
212.52 (B) 42.19
15.19 20.02
256.69 13.02 63.02
4251.17
(one tail)
PF
1 1 1 1 1 1 1
40
MS
212.52 42.19 15.19 20.02 256.69 13.02 63.02
F
2.00 .40 .14 .19
2.42 .12 .59
P
.165
.532
.707
.667
.128
.728
.446

TABLE 8
Means and Scandard Deviations for Productivity by Team Motivation and Training (n = 12 groups per
condition)
56
Trial Trial Total
Trial Trial Total
1 2
1 2
Low Team Motivation M
1.67 2.67 4.33
No M
2.00 2.83 4.83
sp
1.07 .65
1.44
Feedback sp
.85 1.11 1.52
High Team Motivation M
2.00 3.33 5.33
Feedback M
1.67 3.17 4.83
sp
.74
.98 1.23
sp
.98
.58 1.33

57 TABLE 9
Means and Standard Deviations for Productivity By Condition (n = 6 groups)
Trial 1 Trial 2 Total
Trial 1 Trial 2 Total
Low Team Motivation No Feedback M SD
2.00 2.50 4.50
1.10 .84
1.64
High Team Motivation No Feedback M SD
2.00 3.17 5.17
.63 1.33 1.47
Low Team Motivation Feedback M SD
1.33 2.83 4.17
1.03 .41
1.33
High Team Motivation Feeciback M sp
2 . 0 0 3 . 5 0 5 . 5 0
. 8 9
. 5 5 1 . 0 5

58
As can be seen in Table 10, Team Motivation was the
only significant effect. Regardless of feedback, high
Team Motivated groups performed significantly better
(see Figure 5) . This variable accounted for 13% of the
variance. The effect size was .75 standard deviation
units, with the high TM groups producing a mean of 5.33
(SD = 1.23) successful landings and the low TM groups
producing a mean of 4.33 successful landings (Sp = 1.44).

TABLE 10
Split Plot ANOVA for Productivity (n = 24 groups)
59
Source SS
Between Subjects
Team (A) 3.00 Feedback (B) 0.00 A*B .33 Error 19.33
Within Subjects
Pre-post (C) 16.33 A*C .33 B*C 1.33 A*B*C .33 Error 12.67
DF
1 1 1
20
1 1 1 1
20
MS
3.00 0.00 .33 .97
16.33 .33
1.33 .33 .63
F
3.10 0.00 .34
25.79 .53
2.11 .53
P
.093* 1.000 .564
.001*
.477
.162
.477
* E < .05 (one tail)

60
6
^
4.00
3.75
3.50
3.25
3.00
2.75
2.50
2.25
2.00
1.75
1.50
1.25
1.00
.75
.50
.25
0.00
JlfiEHL
fHigh Teaa-Feedback A High Teaa-No Feedback • Low Teaa-Feedback • Lov Teaa-No Feedback
Trial llock 1 Trial Block 2
Figure 5: Mean Product iv i ty Scores

CHAPTER IV
DISCUSSION
The intent of the present study was to suggest a
possible framework for understanding crew coordination
and the potential for ineffectiveness of crews in
critical situations. A systems model of group process as
it applies to crew situations was recommended as a means
to facilitate understanding of the group interaction and
performance. Specific hypotheses were proposed to
establish the links between system inputs (member
characteristics), the group process (communication) , and
outputs (productivity and satisfaction). The data
support the view that system inputs, in this case,
members' motivations to achieve group goals, can affect
group performance outcomes. However, this finding is not
new and has been demonstrated by previous researchers
(Bass, 1962; George, 1977; Johnson, McDonald & George,
1985; Kesterson, 1986).
The intent to measure the process by which member
characteristics influence performance was not fulfilled.
Communication, operationalized as the number of task-
relevant communications was proposed as the intervening
process. Hypothesis 1 was intended to address this input
to process link in the systems model, that is, whether
members' team motivation was related to the amount of
61

62
task-relevant communication. There was no significant
difference in the amount of task-relevant communication
exhibited by high and low Team Motivated groups on the
first trial block. There are several possible reasons
for this lack of support. The most obvious explanation
is that the null hypothesis is correct; motivation to
achieve group goals is not related to the amount of task-
relevant communication expressed by group members. A
second possibility, which will be discussed further in a
moment, is that the the method of operationalizing the
communication process may have been inappropriate. The
wide variability in number of task-relevant comments made
during each block of flights indicates that the tallying
of discrete statements may have been too ambiguous.
While Bales' method recjuires the observer to code
statements into specific categories, the method still
allows for a great deal of personal judgment regarding
the moment one statement is completed and the next
statement is initiated. Several independent observers
were used, and it is possible that, despite their
training, their judgments differed. A measure of inter-
rater reliability would assist in testing this
possibility; however, the researcher failed to anticipate
this situation and such data were not collected.
The significant correlation between Trial Block 1
talk and Trial Block 1 productivity, and the lack of a

63
similar relationship on the second block of trials
suggests yet another possibility. While the original
hypothesis suggested the amount of task relevant
communication was the intervening process, it may be
that, rather than the amount of communication, it is the
quality and timing of the interaction which is the
critical factor. George (1977) discussed this
possibility when referring to task difficulty. On the
first block of trials, the task is considered the most
difficult and most unfamiliar. At this level, task
relevant communication, in general, is related to group
performance. However, on the second block of trials,
students have gained the experience necessary to make a
determination as to what information is important to
convey. Rather than overloading the pilot with
information, students are able to be selective in their
communication and provide only information which is
critical to performance; consecjuently, the correlation
vanishes. The timing and criticality of the information
communicated was not directly measured in this study.
Anecdotal evidence collected during observation of the
experiment by the researcher provides some support for
this suggestion. During the first block of trials the
quality of the task relevant information tended to be
role-related and nondescript. Flight engineers gave
instrument status information regarding fuel or indicator

64
lights, while navigators provided general directional
information. On the second block of flights, students
were more pointed in their communications based upon the
outcomes of their initial flights. They told the pilot
essential information only, such as in what direction to
fly, the sighting of the airport, orders to decrease
speed, directions for alignment with the runway, etc.
These observations suggest that over time, the students
learned they needed to provide only essential or critical
information to the pilot, not just information in
general.
Earlier in this paper it was mentioned that previous
attempts to study groups from a systems viewpoint have
only been able to establish partial links in the model:
input to process, input to product, and process to
product. Regrettably, like its predecessors, this study
was unable to establish links in the full systems model.
While the relationship between the input factor of member
motivations and group outcomes, both performance and
satisfaction were demonstrated, the discrete links within
the systems model only found limited support. Despite
this, however, some theoretical and practical
implications can be drawn from the results.
In the proposed model, communication was suggested
as the intervening process between input factors and
group outcomes. The relationships between the
65
communications in each trial block and the group
performance suggests the concept of "communication" must
be more clearly defined in subsequent studies. While the
present study conceptualized communication mostly from a
(quantitative standpoint, and secondarily as a cjuality
issue (by measuring only task-relevant information),
future studies may be aided by focusing more on the
cjuality issues. The interpretation of the results could
have been enriched by having a measure of the criticality
of the information. For example, giving directional
information is task relevant, but it is more critical
when provided if the plane is off-course. Other
researchers may want to videotape group interaction so
they can analyze both what information is given and more
importantly when the information is provided.
Additionally, it may be beneficial to have expert judges
(in this case trained pilots) review the communications
and give ratings as to the criticality of the information
(i.e., is one comment more helpful than another).
Furthermore, the study by McDonald-Pierce (1986)
emphasizes the need to consider all of the relevant input
factors when applying the systems model to a group
process situation. As defined by GST, any alteration to
one element of the system will modify the influence of
the remaining factors. In this experiment an attempt was
made to define each of the input factors including member

66
characteristics, group structure, and group environment;
however, additional uncontrolled inputs such as
cohesiveness were not measured and taken into account.
Regarding the practical application of these results
to the issue of improving flightcrew performance, the
results continue to suggest that member characteristics
and group structure remain important factors in improving
crew coordination. While human factors specialists and
trainers have greatly increased the proficiency of
individual crewmembers from a technical standpoint, other
factors still recjuire additional modification. In a
recent report completed by the FAA as a summary of their
investigation of Delta Airlines, they cite a general lack
of crew coordination and communication in flightcrews as
the culprit in many of the hazardous flight incidents
reported. As summarized by the media, the report said:
There is no evidence that Delta's crews are (on the whole) either unprofessional or purposefully negligent. Rather, it was observed that crew members are frequently acting as individuals rather than as members of a smoothly functioning team, (reported by The Dallas Morning News, September 19,1987)
Continued research in this area should concentrate
on 1) identifying all of the relevant input variables,
and 2) improving the understanding of the communication
process. While this study focused on member
characteristics as the key input variable, modifications
67
in group structure and norms, as indicated in the
McDonald-Pierce study (1986), could also facilitate crew
coordination. Additionally, the results of this effort
suggest that merely encouraging conimunication will not be
enough. Training will need to be more specific than
this. A study by George (1967) reported that with
appropriate experiences the motivations of members could
be shaped so as to increase motivations to achieve group
goals. Such factors for flightcrews could include
simulation training, teambuilding seminars and a general
reemphasis on the need to keep the group's goals in the
forefront of member actions.

REFERENCES
Bales, R. F. (1950). A set of categories for the analysis of small group interaction. American Sociolocfical Review. 15. 258-263.
Bass, B. M. (1962) . The orientation inventory. Palo Alto, CA: Consulting Psychologists Press, Inc.
Berkowitz, L. (1980). A survey of social psvcholocrv. Dallas, TX: Holt, Rinehart and Winston.
Berrien, F. K. (1976). A general systems approach to organizations. In M. D. Dunnette (Ed.), The handbook of industrial and organizational psvcholocrv. Chicago: Rand McNally.
Blake, R. R. & Mouton, J. S. (1982). Theory and research for developing a science of leadership. The Journal of Applied Behavioral Science. 18. 275-291
Borgatta, E. R., Cottrell, L. S., Jr., & Mann, J. H. (1958) . The spectrum of individual interaction characteristics: An inter-dimensional analysis. Psychological Reports. 4./ 279-319.
Carter, L. F. (1954). Evaluating the performance of individuals as members of small groups. Personnel Psychology, 2, 477-484.
Collins, B. E. & Raven, B. H. (1969). Group structure: Attraction, coalitions, communication and power. In G. Lindzey & E. Aronson (Eds.), The handbook of social psycholocrv (Vol. 4). Reading, MA: Addison-Wesley.
Downs, C. W. & Pickett, T. (1977). An analysis of 9 leadership-group compatibility contingencies upon productivity and member satisfaction. Communication Monographs, 44, 220-230.
Dvidedi, R. S. (1983). Management by trust: A conceptual model. Group and Organization Studies, 8, 375-405.
Feldman, D. C. (1984). The development and enforcement of group norms. Academv of Management Review. 9, 47-53.
Fiedler, R. E. (1967). A theory of leadership pffecstiveness. New York: McGraw-Hill.
68

69 Foushee, H. C. (1982). The role of communications, socio-
psychological, and performance in the maintenance of crew coordination. Aviation. Space and Environmental Medicine. 53. 1062-1066.
Foushee, H. C. (1984). Dyads and triads at 35,0000 feet: Factors affecting group process and aircrew performance. American Psychologist. 39. 885-893.
Gabris, G. T. & Giles, W. A. (1983). Perceptions of management style and employee performance: Resurrecting a diminishing debate. Public Personnel Management Journal. 12. 167-180.
George, C. E. (1967). Training for coordination within rifle scfuads. Alexandria, VA: HumRRO (AD-653845) .
George, C. E. (1977). Testing for coordination in small units. Proceeding of the Military Testing Conference. 19. 487-497.
George, C. E., Hoak, G. R., & Boutwell, J. (1963). Pilot studies of small group effectiveness. (Research memorandum, HumRRO Division, No. 4.). Fort Benning, GA: HumRRO (AD-627214) .
George, C. E. , Simms, J. D., & Lumpkin, M. A. (1969). Education for responsibility. Texas Tech University. (AD-703844).
Greenbaum, H. H., Holden, E. J., Jr., & Spataro, L. (1983). Organizational structure and communication processes: A study of change. Group and Organization Studies. 8., 61-82.
Hackman, J. R. & Morris, C. G. (1975). Group tasks, group interaction process, and group performance: A review and proposed integration. In L. Berkowitz (Ed.), Advances in experimental social psychology (Vol. 8). New York: Academic Press.
Helmreich, R. L. (1984). Cockpit management attitudes. Human Factors. 16, 583-589.
Helmreich, R.L., Foushee, H. C., Benson, R., & Russini, W. (1985). Cockpit resource management; Exploring the attitude-performance linkage. Austin: NASA-University of Texas Report 85-5.
70 Helmreich, R. L., Hackman, J. R., & Foushee, H. C.
(1985). Evaluating Flightcrew Performance: Policy. pressures, pitfalls, and pressure. Unpublished manuscript.
Indik, B. P., Georgopoulos, B. S., & Seashore, S. E. (1961). Superior-subordinate relationships and performance. Personnel Psvcholocfyr 14, 357-374.
Jablin, F. M. (1979). Superior-subordinate communication: The state of the art. Psvchological Bulletin, M / 1201-1222.
Janis, I. L. (1983). Groupthink: Psvchological studies of policv decisions and fiascoes. Boston: Houghton Mifflin.
Johnson, J., McDonald, L., & George, C. E. (1985). Influence of task orientation on group performance. Unpublished manuscript.
Keidel, R. w. (1984). Baseball, football, and basketball: Models for business. Organizational Dynamics, 12., 5-18.
Kesterson, B. (1986). The effect of worker motivation on group performance. Unpublished doctoral dissertation, Texas Tech University.
Latane, B. & Darley, J. M. (1970). The unresponsive bystander: Why doesn't he help? New York: Meredith Corporation.
McDonald, L. G. & George, C. E. (1986). Factor analysis on the worker motivation scale. Unpublished manuscript.
McDonald, L. G., George, C. E., Hoyer, J., & Roark, J. (1986). Reliability and validity of the worker motivation scale. Unpublished manuscript.
McDonald-Pierce, L. G. (1986). Motivation and productivitv in small. task-oriented groups. Unpublished doctoral dissertation, Texas Tech University.
McGrath, J. E. & Kravitz, D. A. (1982). Group research. Annual Review of Psvcholocrv. H , 195-230.
McGregor, D. (1960). The human side of enterprise. New York: McGraw-Hill.
71 Mann, R. D. (1959) . A review of the relationships
between personality and performance in small groups. Psvchological Bulletin. 56^ 241-270.
Pearce, J. A., II, & David, F. R. (1983). A social network approach to organizational design-performance. Academy of Management Review. B, 436-444.
Ray, J. J. (1973) . Task orientation and interaction orientation scales. Personnel Psychology. 26. 61-73.
Redding, W. C. (1972). Communication within the organization: An interpretive review of theory and research. New York: Industrial Communication Councel.
Smith, P. C , Kendal, L. M., & Hulin, C. L. (1969). The measurement of satisfaction in work and retirement. Chicago: Rand McNally.
Steiner, I. D. (1972). Group process and productivity. New York: Academic Press, Inc.
Tuckman, B. W. (1965) . Developmental secjuence in small groups. Psychological Bulletin, 63. 384-399.
APPENDIX A
THE WORKER MOTIVATION SCALE
72

73
Rate the degree to which you agree with each statement by marking on your answer sheet from 1 (strongly disagree) to 7 (strongly agree). Please do not mark on this sheet.
1. I would prefer to work on a committee of friendly people than a committee of hard workers.
2. Praise for my efforts is more important to me than a feeling of personal satisfaction with my performance.
3. I would prefer to be known as a good team player than as a successful person.
4. The most important cjuality of a leader is an ability to get things done.
5. Generally, I prefer that my groups's effort be praised than my individual effort.
6. In order to be successful, often you must ignore the needs of others.
7. I find I only feel happy when I am with others.
8. Generally, I tend to follow the crowd.
9. I would prefer to be admired by others than to be accepted by them.
10. I would prefer to work productively alone than in a productive groups.
11. I would be highly aggressive in order to obtain personal success.
12. Working with friendly people is more important than the type of work I do.
13. Generally, cooperation is better than competition.
14. The most important quality of a leader is to be easy-to-talk-to.
15. Failure of my groups on an important project is worse than if my self respect is damaged.
16. As a leader, I rarely need help making decisions.
17 Helping to complete a group task is more important than being recognized and accepted by the group.

74 18. I would rather be Icnow as the friendliest member of
a group than the most productive.
19. Having good friends is more important than being successful.

APPENDIX B
HIGHEST FACTOR LOADINGS FOR ITEMS ON
THE WORKER MOTIVATION SCALE
75

76
TABLE 11
Factor Loadings
Item TM PM AM
1 .42
2 .35
3 .32
4 .40
5 .48
6 .44
7 .33
8 .42
9 .36
10 -37
11 .47
12 '36
13 -.33
14 .50
15 .43
16 -41
17 .38
18
19
.45
-.42

APPENDIX C
NORMATIVE SCORES FOR ITEMS ON THE
THE WORKER MOTIVATION SCALE
77

78
TABLE 12
Normative Scores
T Score
10 11 12 13 14 15 16 17 18 19 20 21 22 23 24 25 26 27 28 29 30 31 32 33 34 35 36 37 38 39 40 41 42 43 44 45 46 47 48
TM Score
6
7
8
9
10
11
12
13
14 15
16
17
18
19
20
21
22 23
24
25
26
PM Score
7 8
9
10
11 12
13 14
15 16
17
18 19
20
21 22
23
AM Score
6
7
8
9
10
11
12
13
14
15
16
17
18
19
20

79
T Score
49 50 51 52 53 54 55 56 57 58 59 60 61 62 63 64 65 66 67 68 69 70 71 72 73 74 75 76 77 78 79 80 81 82 83 84 85 86 87 88 89 90
TABLE 12 •
TM Score
27
28
29
30 31
32
33
34
35
36
37
38
39 40
41
42
- Continued
PM Score
24 25
26 27
28
29 30
31
32 33
34 35
36
37 38
39
40 41
42
43 44
45 46
47
48 49
AM Score
21
22
23
24
25
26
27
28
29
30
31
32
33
34
35
36
37
38
39
40

80
TABLE 12 - Continued
T Score
91 92 93 94
TM Score
PM Score
AM Score
41
42
Mean = 50, SD = 10

APPENDIX D
MAP OF WASHINGTON STATE
81

82
WASHINGTON
Figure 6: Map of Washington State

APPENDIX E
EXAMPLE OF OBSERVER
COMMUNICATION CODING SHEET
83

84
OBSERVATION CHECKLIST: C»OUrNUMBXa:
TUALONE
Kuw Nuwan Q ^
Y n No
KuM SiKxxuruL- Yis No
Fftoil? To7
?PWnc>F ABKA-
r̂vEs fuocEsnoN AND DDVACTION
jIVES OPimON, BVATUATION, AND ANALYBIS, tXPKZiStS FEEUNCI AMD WUBES.
iTVSS OKIEKTATIOK AJfD IN70KMAT10N; aCrftATt, CLAKiriES, AND OONnXMS
WAVlQATe» FDCHTEWCTWEER
KuN NUMBER TWO RimSuccBssruL: YBS No
FmcM? To?
OVESTION ARtA
Drvts fvccKsnoN AND DOLKCTION
jJVXS OPINION. KVAQUATION, AND ANALYIIS, EXPR£SSES PBZXINCf AND VHHSk.
SrvXS ORITNTATION AND XKPORUATIOK; KXPKATt. CUUUriES. AND CONTOUa
NAVIGATOR
•
FLIGHT ENGTKEER

APPENDIX F
WORK SATISFACTION AND CO-WORKER SATISFACTION
SUBSCALES OF THE JOB DESCRIPTIVE INDEX
85

86 FOR EACH ITEM LISTED BELOW, PLEASE PUT "Y" BESIDE AN ITEM IF THE ITEM DESCRIBES A PARTICULAR ASPECT OF THE TASK YOU JUST COMPLETED, "N" IF THE ITEM DOES NOT DESCRIBE THAT ASPECT, OR "?" IF YOU CAN NOT DECIDE.
The following items apply to the nature of the work you did:
Fascinating Routine Satisfying Boring Good Creative Respected Hot Pleasant Useful Tiresome Healthful Challenging On your feet Frustrating Simple Endless Gives a sense of accomplishment
The following items apply to your co-workers:
Stimulating Boring Slow Ambitious Stupid Responsible Fast Intelligent Easy to make enemies Talk too much Smart Lazy Unpleasant No privacy Active Narrow interests Loyal Hard to meet

APPENDIX G
INSTRUCTION MANUAL GIVEN TO CREWMEMBERS
87

88
COCKPIT LAYOUT
Throttle Outside
3-D View
Affftuc3e& Artifidol Horizon
WlVefticol Velocity Indicator
VORl Rodiol
VORl DME
V 0 R 2 Rodiol
Mognetic Compass
Engine Overheat
V0R2 DME
US Glideslope
Lending Gear
Figure 7: Diagram of Instumentation Layout

89 Flight Instrumentation
Navigational Instruments
Magnetic Compass:
VOR radials:
shows what direction you are flying.
a course from the VOR your current position.
avoid This the the
represents station to VOR navigation is needed to mountain ranges in some states, type of navigation requires reading of VOR bearing on instrument panel, and interpreting them in terms of your state map. Each of the two VOR stations (located on the map) sends out radio signal. North of the VOR station is radial 360, East is 090, South is 180, and West is 270. To find a particular airport, determine its radial intersection from both VORs. Next intercept a radial outbound from one VOR and fly until it crosses the other radial.
VOR DME:
ILS Glidescope:
shows the number of miles from VOR station to your aircraft.
the
indicates your plane's relationship to the airport glidescope, as a landing aid.
Indicator Instruments
Throttle:
Airspeed:
shows your current engine power setting. The higher your engine power, the faster you can go, and the faster you consume fuel. Numbers 0 through 9 on the keyboard set the throttle from engine off (0) to highest power (9).
shows your current airspeed in knots.
Attitude & Artificial Horizon: shows the attitude of your aircraft in relation to level flight.

90 Altimeter: shows your current altitude in feet,
from sea level. Be aware that in Washington the ground levels are significantly above sea level.
Vertical Velocity Indicator: shows the rate your plane is changing altitude up (climbing) or down (diving)•
Flaps: shows whether the flaps are up (0) or down (20 or 40) . Flaps down slows the plane and provides extra lift, reducing your stall speed. Press F to change your flaps setting
Fuel Gauge: indicates the amount of fuel you have remaining.
Status Lights (black=off, light=on)
Engine Overheat: shows when your engine is running dangerously hot.
Brakes: shows when your landing gear brakes are on. Press B to turn on and off your landing gear brakes.
Landing Gear: show when your landing gear is lowered. Press L to raise and lower your landing gear.
Weather
The current weather conditions are displayed at the bottom of the screen: wind direction and speed, cloud ceiling in feet, and visibility in miles. Under windy conditions, landing your aircraft becomes tricky, especially if the wind is blowing across the runway. Use less flaps and higher airspeeds to compensate for winds. Low clouds often require instrument flying, although you may choose to fly above the clouds.
APPENDIX H
FLIGHT TRAINING QUESTIONS
AND CORRECT ANSWERS
91
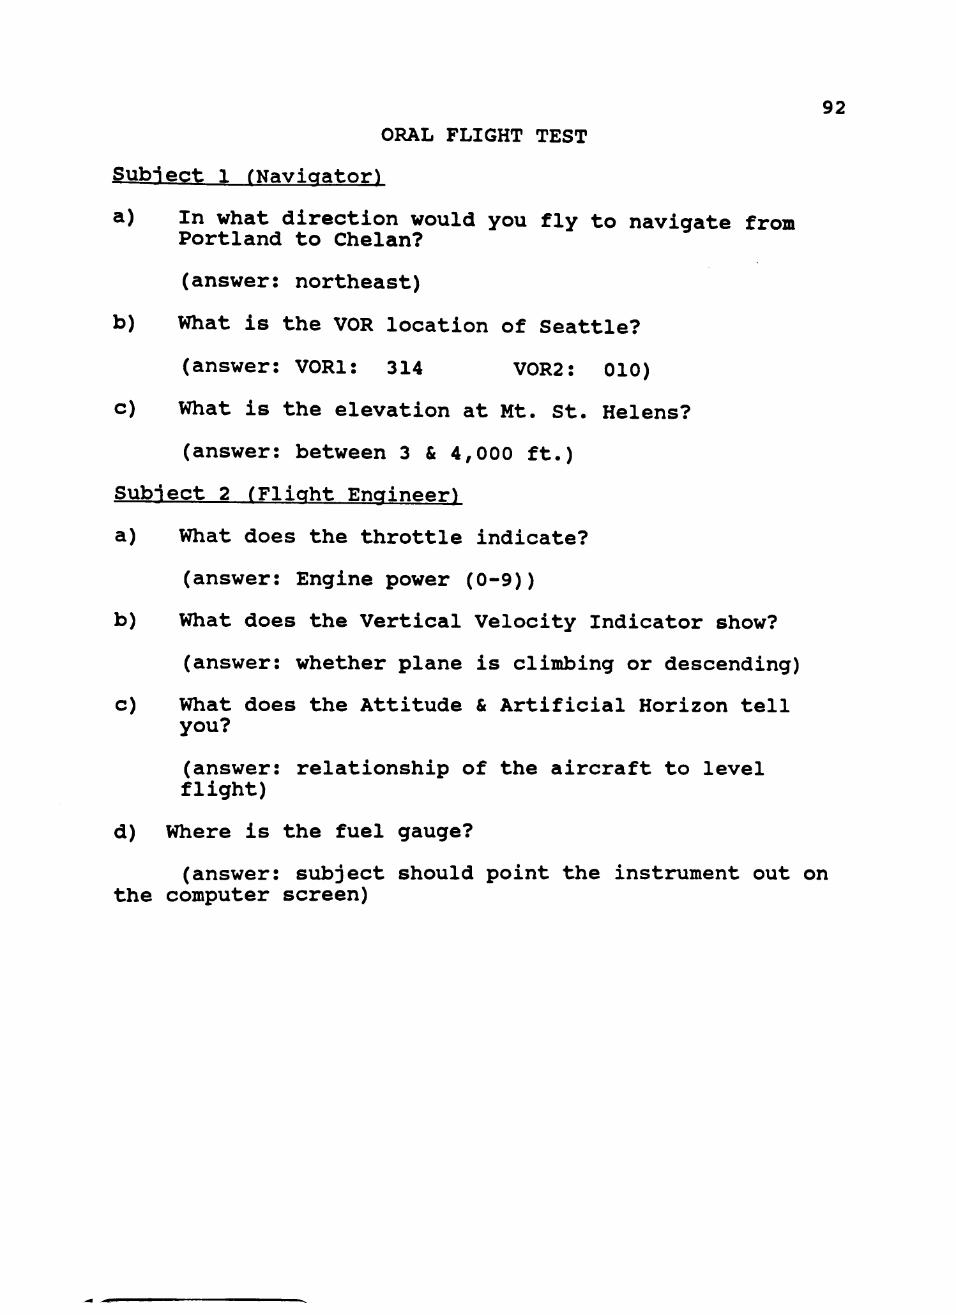
92 ORAL FLIGHT TEST
Subject 1 (Navigator)
a) In what direction would you fly to navigate from Portland to Chelan?
(answer: northeast)
b) What is the VOR location of Seattle?
(answer: VORl: 314 V0R2: 010)
c) What is the elevation at Mt. St. Helens?
(answer: between 3 & 4,000 ft.)
Subject 2 (Flight Engineer)
a) What does the throttle indicate?
(answer: Engine power (0-9))
b) What does the Vertical Velocity Indicator show?
(answer: whether plane is climbing or descending)
c) What does the Attitude & Artificial Horizon tell you?
(answer: relationship of the aircraft to level flight)
d) Where is the fuel gauge?
(answer: subject should point the instrument out on the computer screen)


![Fall Commencement [Program], December 19, 1987](https://img.pdfslide.net/doc/110x75/627c18388e5957549c112699/fall-commencement-program-december-19-1987.jpg)