Embed Size (px)
Citation preview
December 2002
SCM Processes ReplaceApps: 2003 To 2008
D E C E M B E R 2 0 0 2
SCM Processes Replace Apps: 2003 To 2008
US firms will spend a total of $35 billion over the next
five years to improve processes that monitor, manage, and
optimize their supply networks. The result? Supply chain
ISVs will coalesce around four major platforms.
I N T E RV I E W S• Process and people issues hamper supply chain performance.• SCM apps indigestion curbs appetite for future spending.
A N A LY S I S• Process focus dominates future supply chain spending.• Demand and order management will attract most dollars.• Services will take the lion’s share of supply chain spending.• Microsoft will have cornered the midmarket by 2006.
W H AT I T M E A N S• In 2005, there will be only four SCM platforms vendors left:
IBM, Microsoft, Oracle, and SAP.• The rise of chief process officers.• i2 will play second fiddle to ERP vendors.
R E L AT E D M AT E R I A L• Online spreadsheet for supply network sizing model.
G R A P E V I N E
E N D N OT E S20
19
18
16
5
2
By Navi Radjou
With Laurie M. Orlov
Liz Herbert
Taichi Nakashima
Ryan Hudson
© 2002, Forrester Research, Inc. All rights reserved. Forrester, Forrester eResearch, Forrester Wave, WholeView, Technographics,TechStrategy, and TechRankings are trademarks of Forrester Research, Inc. All other trademarks are the property of their respectivecompanies. Forrester clients may make one attributed copy or slide of each figure contained herein. Additional reproduction is strictlyprohibited. For additional reproduction rights and usage information, go to www.forrester.com. Information is based on best availableresources. Opinions reflect judgment at the time and are subject to change.
Headquarters
Forrester Research, Inc.
400 Technology Square
Cambridge, MA 02139
USA
+1 617/613-6000
Fax: +1 617/613-5000
www.forrester.com
The TechStrategyTM Report
I N T E R V I E W S
Supply Chain Initiatives Elicit Tepid Support
To assess the sagging economy’s impact on supply chain investments,
Forrester spoke with 26 executives in $1B+ manufacturing firms who are
responsible for supply chain management (SCM). We found that users are
scaling back future SCM investments as they struggle with the hodgepodge
of existing planning tools like demand forecasting and execution apps like
inventory management software.
SCM INVESTMENTS TARGET COST AND SERVICE IMPROVEMENTIn this climate, manufacturers and retailers want to cut costs and hold on to theircustomers. Their existing supply chain initiatives reflect those priorities (see Figure 1-1).
“Our No. 1 supply chain focus is reducing operational costs.” (Electronics company)
“Improving customer service levels is our biggest concern.” (CPG company)
Variability And Process Inflexibility Hamper PerformanceWhen asked what is dragging down supply chain performance, 46% of intervieweescited difficulties in getting processes and people adjusted to changes. And 42% pointed to increased supply and demand variability (see Figure 1-2).
“Internally, we lack a common view of demand because our customer service group is separate from our supply chain organization.” (Construction company)
“Heightened geopolitical instability and things like the West Coast strike are a realproblem for us.” (Petrochemicals company)
And App Indigestion Curbs Interest In New InvestmentsWhile SCM app deployments have peaked -- with the exception of product life-cyclemanagement and aftermarket service -- they have yet to extend outside users’ four walls(see Figure 2-1). And 54% of users question their value -- as people and process issuesmake ROI elusive (see Figure 2-2). The result? Only 8% of interviewees plan to significantlyincrease app spending in the next three years (see Figure 2-3).
2
DECEMBER 2002 © 2002, Forrester Research, Inc. Reproduction Prohibited
SCM Processes Replace Apps: 2003 To 2008I N T E R V I E W S
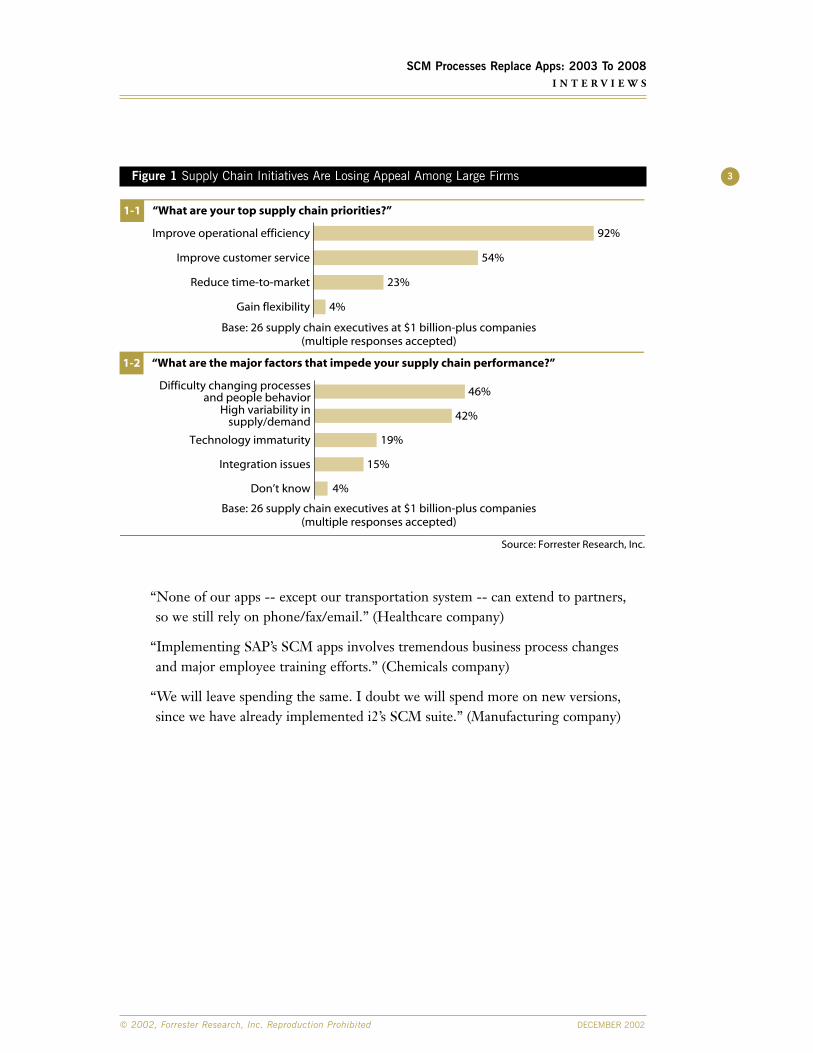
Figure 1 Supply Chain Initiatives Are Losing Appeal Among Large Firms
“None of our apps -- except our transportation system -- can extend to partners, so we still rely on phone/fax/email.” (Healthcare company)
“Implementing SAP’s SCM apps involves tremendous business process changes and major employee training efforts.” (Chemicals company)
“We will leave spending the same. I doubt we will spend more on new versions,since we have already implemented i2’s SCM suite.” (Manufacturing company)
3
© 2002, Forrester Research, Inc. Reproduction Prohibited DECEMBER 2002
SCM Processes Replace Apps: 2003 To 2008I N T E R V I E W S
Source: Forrester Research, Inc.
“What are your top supply chain priorities?”1-1
“What are the major factors that impede your supply chain performance?”1-2
4%
23%
54%
92%Improve operational efficiency
Improve customer service
Reduce time-to-market
Gain flexibility
Base: 26 supply chain executives at $1 billion-plus companies(multiple responses accepted)
Don’t know 4%
Integration issues 15%
Technology immaturity 19%
Difficulty changing processesand people behavior 46%
High variability insupply/demand 42%
Base: 26 supply chain executives at $1 billion-plus companies(multiple responses accepted)
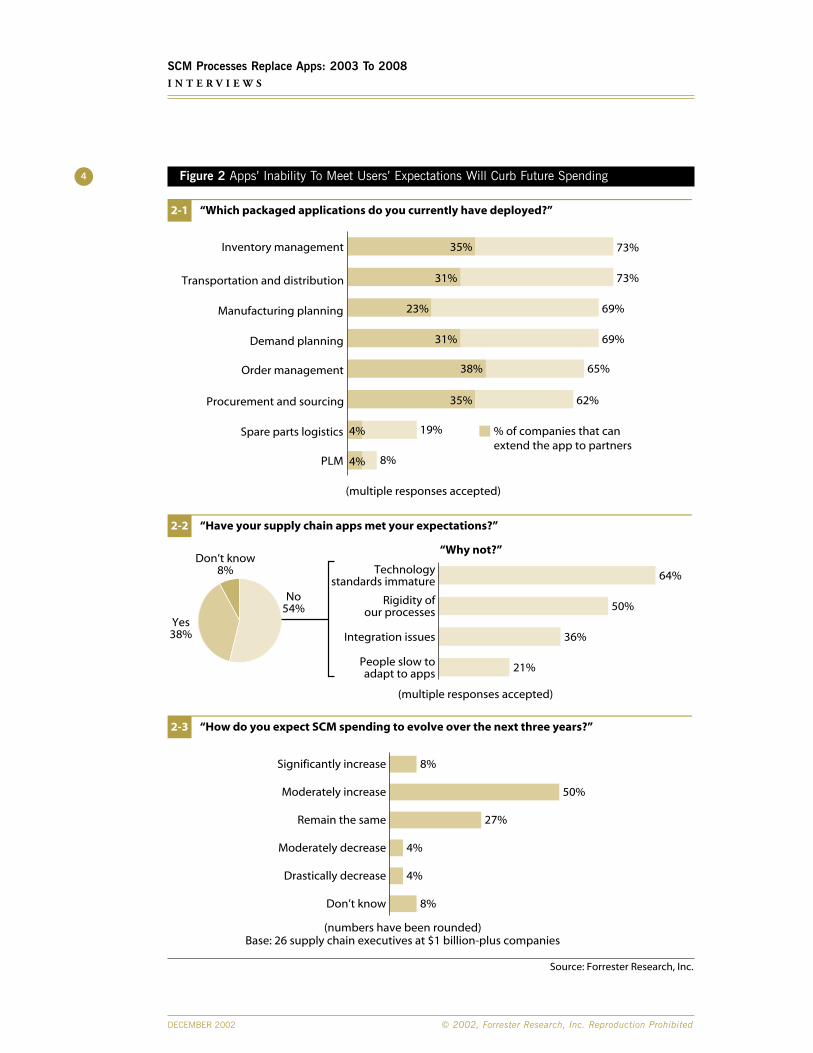
Figure 2 Apps’ Inability To Meet Users’ Expectations Will Curb Future Spending4
DECEMBER 2002 © 2002, Forrester Research, Inc. Reproduction Prohibited
SCM Processes Replace Apps: 2003 To 2008I N T E R V I E W S
Source: Forrester Research, Inc.
“Which packaged applications do you currently have deployed?”2-1
“Have your supply chain apps met your expectations?”2-2
“How do you expect SCM spending to evolve over the next three years?”2-3
73%
73%
69%
69%
65%
62%
19%
8%
35%
31%
23%
31%
38%
35%
4%
4%
Inventory management
Transportation and distribution
Manufacturing planning
Demand planning
Order management
Procurement and sourcing
Spare parts logistics
PLM
% of companies that canextend the app to partners
21%
36%
50%
64%Technologystandards immature
Rigidity ofour processes
Integration issues
People slow toadapt to apps
Don’t know8%
Yes38%
No54%
“Why not?”
Significantly increase
Moderately increase
Remain the same
Moderately decrease
Drastically decrease
8%
4%
4%
27%
50%
8%
Don’t know
Base: 26 supply chain executives at $1 billion-plus companies
(multiple responses accepted)
(numbers have been rounded)
(multiple responses accepted)
A N A L Y S I S
Supply Network Processes Eclipse Apps
US firms will spend on average $4.8 billion a year through 2008 to tune
their supply network processes. CPG and retail will invest the most,
leading spending in hot areas like order and demand management. SAP
and Oracle will join Microsoft and IBM in the innovation race to offer
platforms that support firms’ migration to adaptive supply networks.
FUNCTIONAL APPS TAKE A BACK SEAT TO PROCESSESIn a survey with 124 execs, Forrester found that large US firms spend an average of $6.8 million per supply chain project (see the November 2002 Forrester Report “NavigatingThe Supply Chain Project Maze”).1 Two-thirds of SCM spending goes into packagedsoftware licenses.2 Yet just 41% of users say their app investments yielded positive ROI.3
Why have firms failed to extract the most value from their SCM apps? Because:
• Apps are deployed within departments. Firms invest in packaged apps toautomate specific business functions. For instance, Caterpillar bought EDS PLM tools to support R&D, apps from i2 Technologies to coordinate manufacturing,and mySAP CRM to manage sales. But as Caterpillar tries to orchestrate thesedisparate functions into cross-functional processes like product life-cyclemanagement, it finds its performance hamstrung by apps weaknesses.
• Planning is out of sync with execution. After implementing execution apps likewarehouse management, firms expanded their SCM apps portfolio with decision-support tools like Manugistics’.4 But firms use these optimization tools only oncein a supply chain planning cycle that ranges from weeks to months. Even worse:Supply chain exceptions -- like a delayed pickup truck -- aren’t fed back into theplanning app until these minor events escalate into crises (see the March 22, 2001Forrester Brief “Optimization Is Dead. Long Live Adaptive Planning!”).5
• Processes have piecemeal apps support. When selecting an app to automate a supply chain process, firms overlook the vendor’s ability to support connectionsto other business processes. For instance, firms’ disaffection with eProcurementstemmed from the apps’ inability to link procurement to other process steps likespend analysis, contract management, and settlement (see the November 5, 2001Forrester Brief “eProcurement: Winners Will Thrive On Process Skill”).6
5
© 2002, Forrester Research, Inc. Reproduction Prohibited DECEMBER 2002
SCM Processes Replace Apps: 2003 To 2008A N A L Y S I S
But Growing Market Pressure Will Test Firms’ Supply Chain CompetenceAs US firms recover and resume expansion, they will realize that they are stuck with a medley of SCM apps -- which hold them back as they attempt to make their supplychain processes:
• Extended -- to support multifirm partnering. As firms outsource and globalizetheir supply chains, they need to extend their stovepiped operations across a networkof alliances (see the May 2001 Forrester Report “The Collaboration Imperative”).7
For instance, Microsoft can’t launch its Xbox’s next version unless it extends itsproduct life-cycle management process to design partners NVIDIA and TSMC as well as to production and service contractors Flextronics and Solectron.
• Dynamic -- to satisfy fickle customers. Traditional make-to-stock industries like CPG and auto are being forced by finicky customers to adjust production andinventory levels on the fly for all existing and new products -- or face excessinventory and lost sales (see the March 2002 Forrester Report “Balancing SupplyAnd Demand”).8 As Ford and Sara Lee strive to make their manufacturing andorder fulfillment demand-driven, they expect suppliers to match their velocity.
• Flexible -- to cope with supply uncertainty. SCM planning apps used bymanufacturers and retailers couldn’t forecast -- let alone help circumvent -- thehuge supply disruptions caused by September 11 or the San Francisco port lockout.Firms like Dole Food Company and Ericsson have come to recognize theimportance of infusing flexibility into processes like sourcing through alternatesupply agreements -- or production by shifting capacity in case of a plant fire.9
PROCESS-FOCUSED SPENDING WILL HIT $9.1 BILLION IN 2008To extend their supply chain processes across departmental and partner boundaries,Forrester expects firms to stop investing in narrowly focused functional SCM apps.Instead they will hone their ability to monitor, manage, and optimize their supplynetwork processes (see Figure 3 and see Figure 4). Forrester projects that the totalspending on supply network process improvement initiatives in the US will rise from $2.4 billion in 2003 to $9.1 billion in 2008 -- as (see Figure 5 and see Figure 6):
• Product-centric OEMs discover product life-cycle management. GM’selevation of design guru Bob Lutz to vice chairman clearly indicates that productinnovation has become a manufacturer priority. In the next five years, spending oncollaborative product life-cycle management (CPLM) from innovation-seekingfirms will nearly quadruple -- to reach $1.2 billion in 2008 (see the May 2002Forrester Report “The Collaborative Product Life Cycle”).10
6
DECEMBER 2002 © 2002, Forrester Research, Inc. Reproduction Prohibited
SCM Processes Replace Apps: 2003 To 2008A N A L Y S I S
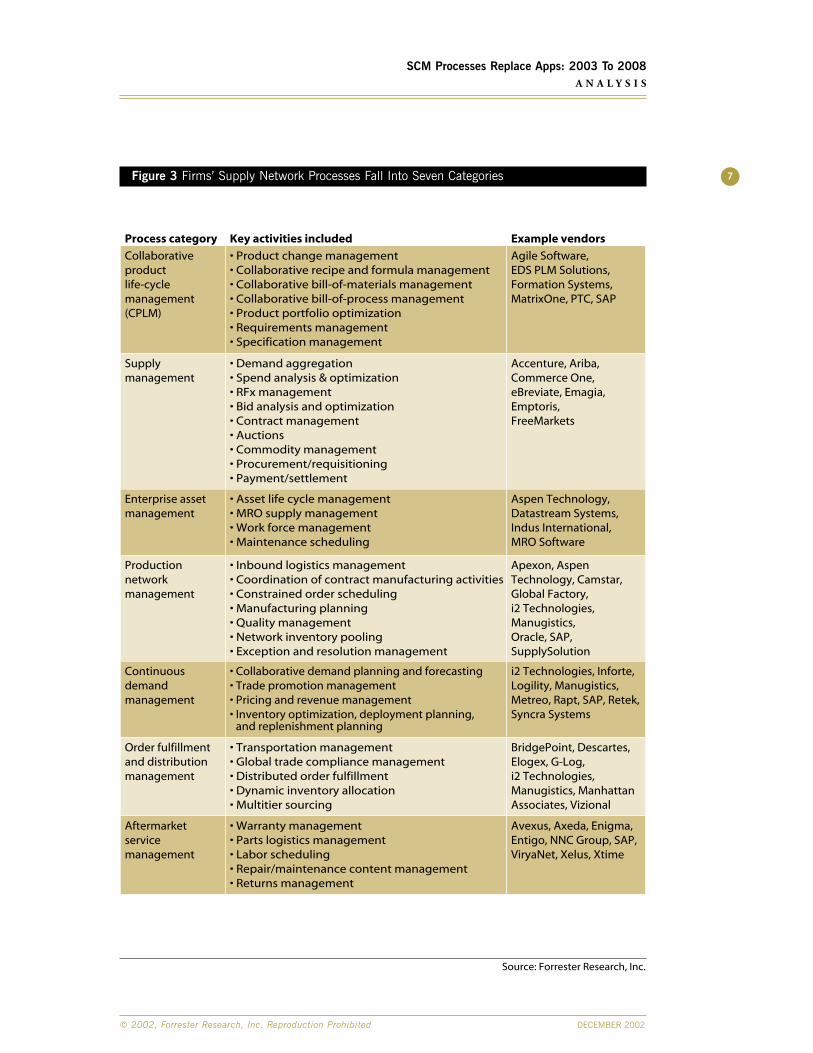
Figure 3 Firms’ Supply Network Processes Fall Into Seven Categories 7
© 2002, Forrester Research, Inc. Reproduction Prohibited DECEMBER 2002
SCM Processes Replace Apps: 2003 To 2008A N A L Y S I S
Source: Forrester Research, Inc.
Process category Key activities included
Collaborative product life-cycle management(CPLM)
Supply management
Enterprise assetmanagement
Production networkmanagement
Continuous demandmanagement
Order fulfillmentand distributionmanagement
Aftermarket servicemanagement
Example vendors
Agile Software, EDS PLM Solutions, Formation Systems,MatrixOne, PTC, SAP
Accenture, Ariba, Commerce One, eBreviate, Emagia, Emptoris, FreeMarkets
Aspen Technology, Datastream Systems, Indus International, MRO Software
Apexon, Aspen Technology, Camstar, Global Factory, i2 Technologies, Manugistics,Oracle, SAP, SupplySolution
i2 Technologies, Inforte,Logility, Manugistics,Metreo, Rapt, SAP, Retek, Syncra Systems
BridgePoint, Descartes, Elogex, G-Log, i2 Technologies, Manugistics, Manhattan Associates, Vizional
Avexus, Axeda, Enigma, Entigo, NNC Group, SAP, ViryaNet, Xelus, Xtime
• Product change management• Collaborative recipe and formula management• Collaborative bill-of-materials management• Collaborative bill-of-process management • Product portfolio optimization• Requirements management• Specification management
• Demand aggregation• Spend analysis & optimization• RFx management• Bid analysis and optimization• Contract management• Auctions• Commodity management • Procurement/requisitioning• Payment/settlement
• Asset life cycle management• MRO supply management• Work force management• Maintenance scheduling
• Inbound logistics management • Coordination of contract manufacturing activities• Constrained order scheduling• Manufacturing planning• Quality management• Network inventory pooling• Exception and resolution management
• Collaborative demand planning and forecasting• Trade promotion management• Pricing and revenue management• Inventory optimization, deployment planning,
and replenishment planning
• Transportation management • Global trade compliance management• Distributed order fulfillment• Dynamic inventory allocation• Multitier sourcing
• Warranty management• Parts logistics management• Labor scheduling• Repair/maintenance content management• Returns management
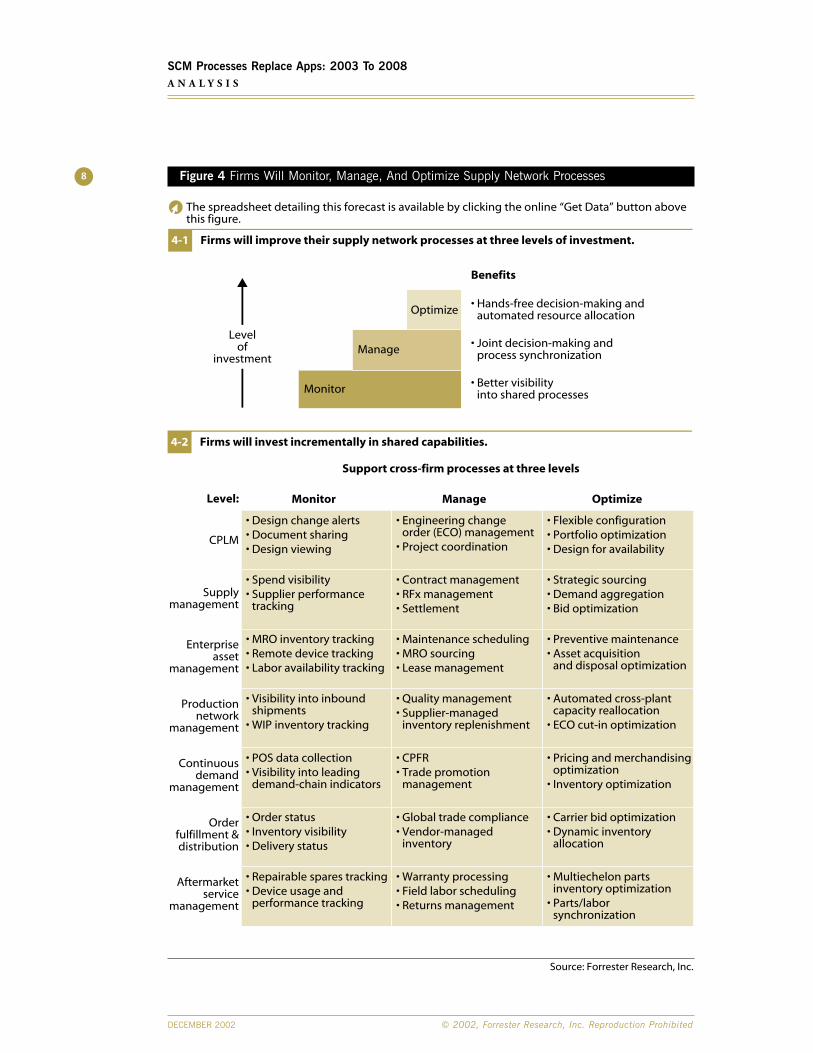
Figure 4 Firms Will Monitor, Manage, And Optimize Supply Network Processes8
DECEMBER 2002 © 2002, Forrester Research, Inc. Reproduction Prohibited
SCM Processes Replace Apps: 2003 To 2008A N A L Y S I S
Source: Forrester Research, Inc.
Firms will invest incrementally in shared capabilities.4-2
Firms will improve their supply network processes at three levels of investment.4-1
Benefits
• Hands-free decision-making andautomated resource allocation
• Joint decision-making andprocess synchronization
• Better visibilityinto shared processes
Levelof
investment
Monitor
Manage
Optimize
Monitor Manage Optimize
Support cross-firm processes at three levels
• Flexible configuration• Portfolio optimization• Design for availability
• Engineering changeorder (ECO) management
• Project coordination
• Design change alerts• Document sharing• Design viewing
• Strategic sourcing• Demand aggregation• Bid optimization
• Spend visibility• Supplier performance
tracking
• Preventive maintenance• Asset acquisition
and disposal optimization
• MRO inventory tracking• Remote device tracking• Labor availability tracking
• Automated cross-plantcapacity reallocation
• ECO cut-in optimization
• Visibility into inboundshipments
• WIP inventory tracking
• Pricing and merchandisingoptimization
• Inventory optimization
• POS data collection• Visibility into leading
demand-chain indicators
• Carrier bid optimization• Dynamic inventory
allocation
• Order status • Inventory visibility• Delivery status
• Multiechelon partsinventory optimization
• Parts/laborsynchronization
• Repairable spares tracking• Device usage and
performance tracking
• Contract management• RFx management• Settlement
• Maintenance scheduling• MRO sourcing• Lease management
• Quality management• Supplier-managed
inventory replenishment
• CPFR• Trade promotion
management
• Global trade compliance• Vendor-managed
inventory
• Warranty processing• Field labor scheduling• Returns management
Level:
CPLM
Supplymanagement
Enterpriseasset
management
Productionnetwork
management
Continuousdemand
management
Orderfulfillment &distribution
Aftermarketservice
management
The spreadsheet detailing this forecast is available by clicking the online “Get Data” button abovethis figure.
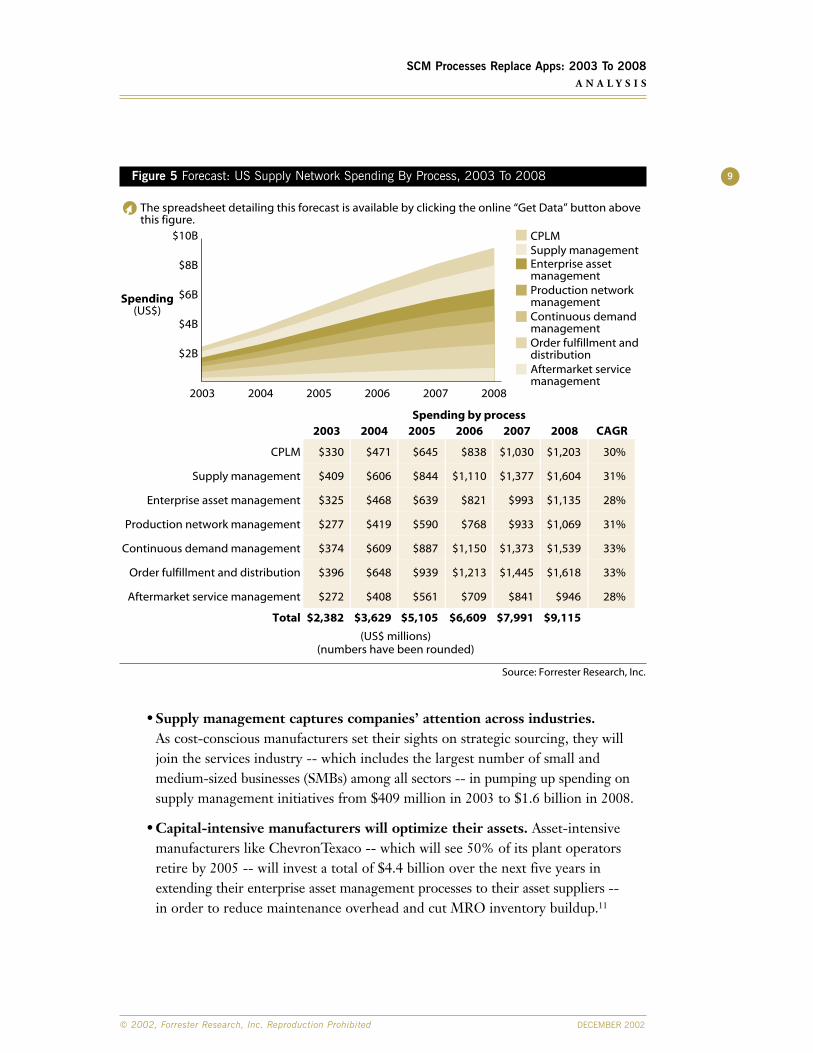
Figure 5 Forecast: US Supply Network Spending By Process, 2003 To 2008
• Supply management captures companies’ attention across industries. As cost-conscious manufacturers set their sights on strategic sourcing, they willjoin the services industry -- which includes the largest number of small andmedium-sized businesses (SMBs) among all sectors -- in pumping up spending onsupply management initiatives from $409 million in 2003 to $1.6 billion in 2008.
• Capital-intensive manufacturers will optimize their assets. Asset-intensivemanufacturers like ChevronTexaco -- which will see 50% of its plant operatorsretire by 2005 -- will invest a total of $4.4 billion over the next five years inextending their enterprise asset management processes to their asset suppliers -- in order to reduce maintenance overhead and cut MRO inventory buildup.11
9
© 2002, Forrester Research, Inc. Reproduction Prohibited DECEMBER 2002
SCM Processes Replace Apps: 2003 To 2008A N A L Y S I S
Source: Forrester Research, Inc.
2003 2004 2005 2006 2007 2008 CAGR
$330 $471 $645 $838 $1,030 $1,203 30%
$409 $606 $844 $1,110 $1,377 $1,604 31%
$325 $468 $639 $821 $993 $1,135 28%
CPLM
Supply management
Enterprise asset management
$277 $419 $590 $768 $933 $1,069 31%
$374 $609 $887 $1,150 $1,373 $1,539 33%
Production network management
Continuous demand management
$396 $648 $939 $1,213 $1,445 $1,618 33%
$272 $408 $561 $709 $841 $946 28%
Order fulfillment and distribution
Aftermarket service management
Total $2,382 $3,629 $5,105 $6,609 $7,991 $9,115
Spending by process
$2B
$4B
$6B
$8B
$10B
2003 20082004 2005 2006 2007
Spending(US$)
Enterprise assetmanagement
Supply managementCPLM
Order fulfillment anddistribution
Continuous demandmanagement
Production networkmanagement
Aftermarket servicemanagement
(US$ millions)(numbers have been rounded)
The spreadsheet detailing this forecast is available by clicking the online “Get Data” button abovethis figure.
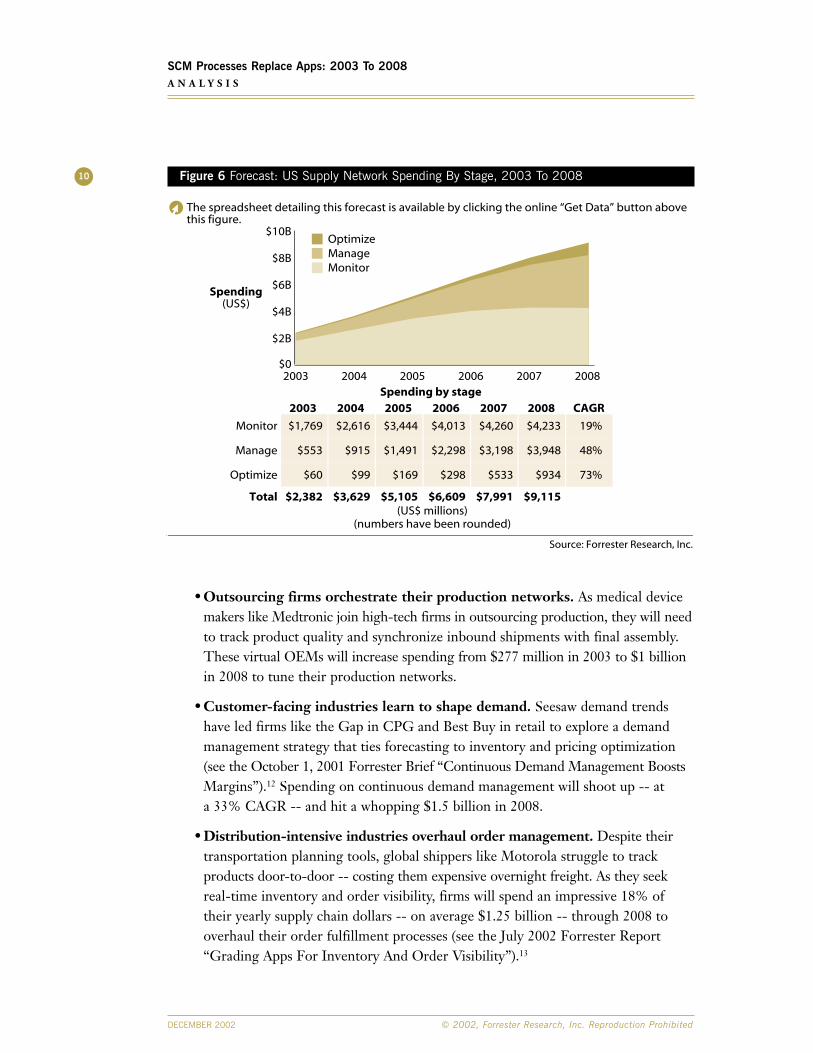
Figure 6 Forecast: US Supply Network Spending By Stage, 2003 To 2008
• Outsourcing firms orchestrate their production networks. As medical devicemakers like Medtronic join high-tech firms in outsourcing production, they will needto track product quality and synchronize inbound shipments with final assembly.These virtual OEMs will increase spending from $277 million in 2003 to $1 billionin 2008 to tune their production networks.
• Customer-facing industries learn to shape demand. Seesaw demand trendshave led firms like the Gap in CPG and Best Buy in retail to explore a demandmanagement strategy that ties forecasting to inventory and pricing optimization(see the October 1, 2001 Forrester Brief “Continuous Demand Management BoostsMargins”).12 Spending on continuous demand management will shoot up -- at a 33% CAGR -- and hit a whopping $1.5 billion in 2008.
• Distribution-intensive industries overhaul order management. Despite theirtransportation planning tools, global shippers like Motorola struggle to trackproducts door-to-door -- costing them expensive overnight freight. As they seekreal-time inventory and order visibility, firms will spend an impressive 18% oftheir yearly supply chain dollars -- on average $1.25 billion -- through 2008 tooverhaul their order fulfillment processes (see the July 2002 Forrester Report“Grading Apps For Inventory And Order Visibility”).13
10
DECEMBER 2002 © 2002, Forrester Research, Inc. Reproduction Prohibited
SCM Processes Replace Apps: 2003 To 2008A N A L Y S I S
Source: Forrester Research, Inc.
2003 2004 2005 2006 2007 2008 CAGR
Monitor
Manage
Optimize
Spending by stage
$2B
$0
$4B
$6B
$8B
$10BOptimizeManageMonitor
2003 20082004 2005 2006 2007
$1,769 $2,616 $3,444 $4,013 $4,260 $4,233
$553 $915 $1,491 $2,298 $3,198 $3,948 48%
$60 $99 $169 $298 $533 $934 73%
Total $2,382 $3,629 $5,105 $6,609 $7,991 $9,115
19%
(US$ millions)(numbers have been rounded)
The spreadsheet detailing this forecast is available by clicking the online “Get Data” button abovethis figure.
Spending(US$)
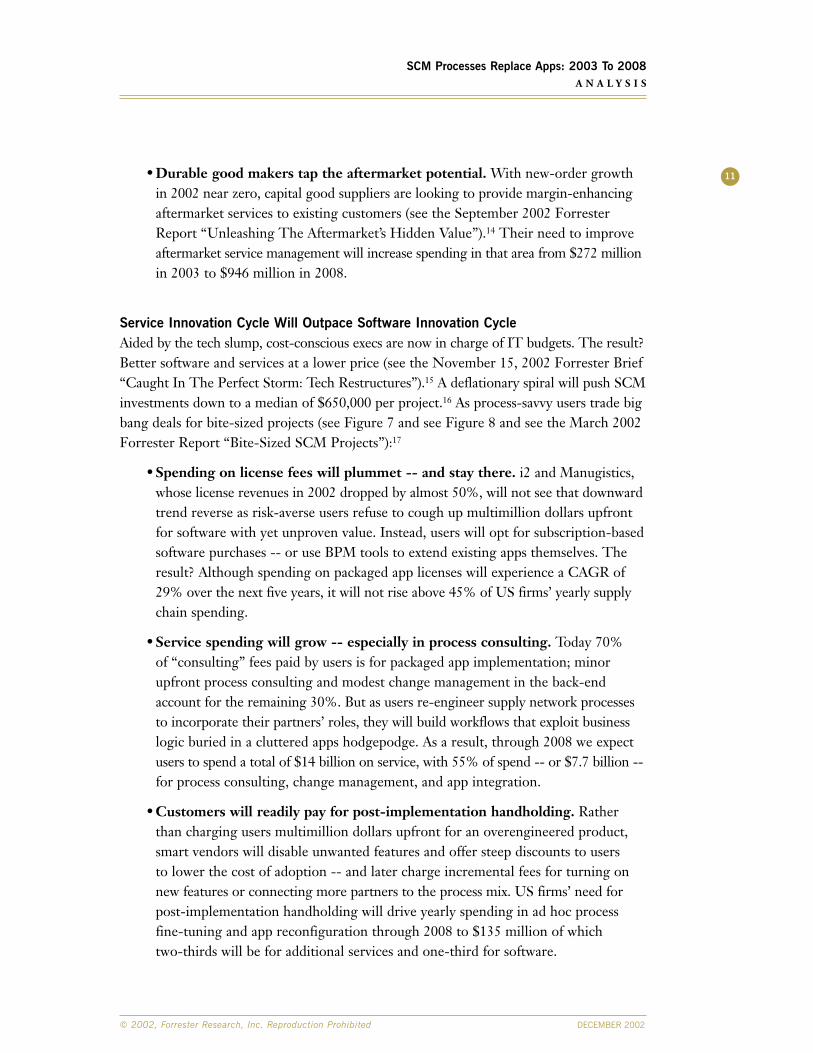
• Durable good makers tap the aftermarket potential. With new-order growthin 2002 near zero, capital good suppliers are looking to provide margin-enhancingaftermarket services to existing customers (see the September 2002 ForresterReport “Unleashing The Aftermarket’s Hidden Value”).14 Their need to improveaftermarket service management will increase spending in that area from $272 millionin 2003 to $946 million in 2008.
Service Innovation Cycle Will Outpace Software Innovation CycleAided by the tech slump, cost-conscious execs are now in charge of IT budgets. The result?Better software and services at a lower price (see the November 15, 2002 Forrester Brief“Caught In The Perfect Storm: Tech Restructures”).15 A deflationary spiral will push SCMinvestments down to a median of $650,000 per project.16 As process-savvy users trade bigbang deals for bite-sized projects (see Figure 7 and see Figure 8 and see the March 2002Forrester Report “Bite-Sized SCM Projects”):17
• Spending on license fees will plummet -- and stay there. i2 and Manugistics,whose license revenues in 2002 dropped by almost 50%, will not see that downwardtrend reverse as risk-averse users refuse to cough up multimillion dollars upfrontfor software with yet unproven value. Instead, users will opt for subscription-basedsoftware purchases -- or use BPM tools to extend existing apps themselves. Theresult? Although spending on packaged app licenses will experience a CAGR of29% over the next five years, it will not rise above 45% of US firms’ yearly supplychain spending.
• Service spending will grow -- especially in process consulting. Today 70% of “consulting” fees paid by users is for packaged app implementation; minor upfront process consulting and modest change management in the back-endaccount for the remaining 30%. But as users re-engineer supply network processesto incorporate their partners’ roles, they will build workflows that exploit businesslogic buried in a cluttered apps hodgepodge. As a result, through 2008 we expectusers to spend a total of $14 billion on service, with 55% of spend -- or $7.7 billion --for process consulting, change management, and app integration.
• Customers will readily pay for post-implementation handholding. Ratherthan charging users multimillion dollars upfront for an overengineered product,smart vendors will disable unwanted features and offer steep discounts to users to lower the cost of adoption -- and later charge incremental fees for turning onnew features or connecting more partners to the process mix. US firms’ need forpost-implementation handholding will drive yearly spending in ad hoc processfine-tuning and app reconfiguration through 2008 to $135 million of which two-thirds will be for additional services and one-third for software.
11
© 2002, Forrester Research, Inc. Reproduction Prohibited DECEMBER 2002
SCM Processes Replace Apps: 2003 To 2008A N A L Y S I S
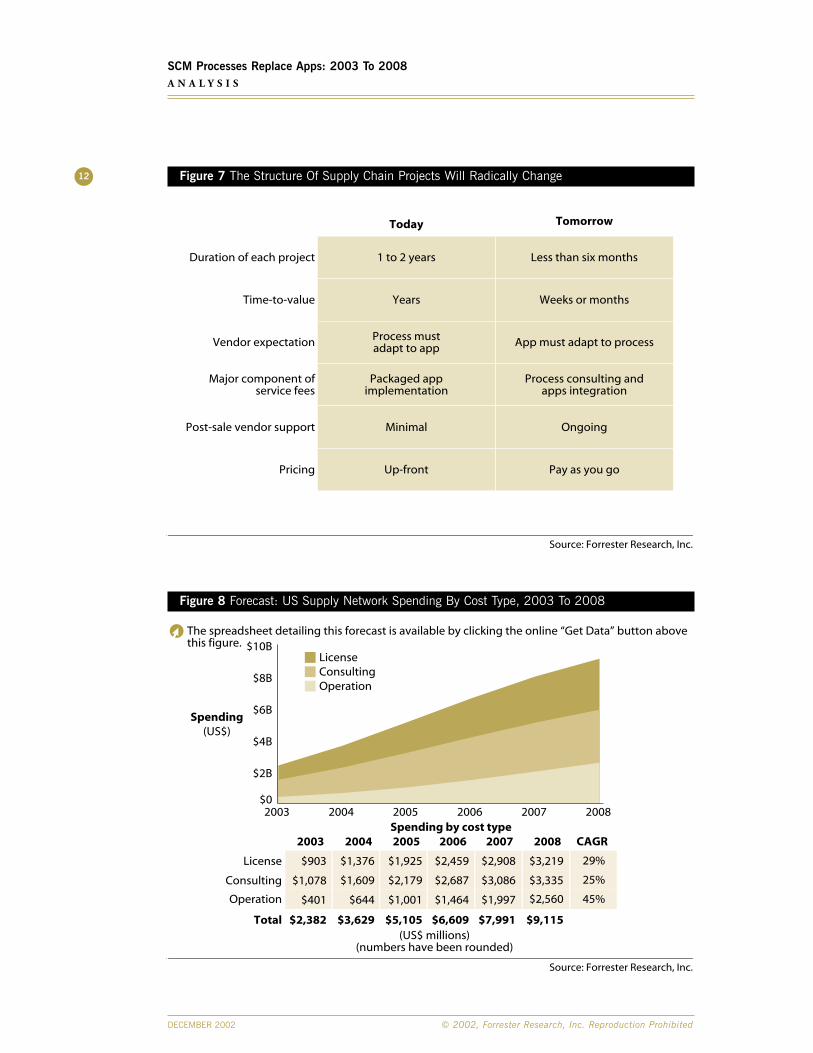
Figure 7 The Structure Of Supply Chain Projects Will Radically Change
Figure 8 Forecast: US Supply Network Spending By Cost Type, 2003 To 2008
12
DECEMBER 2002 © 2002, Forrester Research, Inc. Reproduction Prohibited
SCM Processes Replace Apps: 2003 To 2008A N A L Y S I S
Source: Forrester Research, Inc.
Today Tomorrow
Duration of each project
Time-to-value
Vendor expectation
Major component ofservice fees
Post-sale vendor support
Pricing
1 to 2 years
Years
Process mustadapt to app
Packaged appimplementation
Minimal
Up-front
Less than six months
Weeks or months
App must adapt to process
Process consulting andapps integration
Ongoing
Pay as you go
Source: Forrester Research, Inc.
2003 2004 2005 2006 2007 2008
2003 2004 2005 2006 2007 2008
CAGR
$903 $1,376 $1,925 $2,459 $2,908 $3,219 29%
$1,078 $1,609 $2,179 $2,687 $3,086 $3,335 25%
$401 $644 $1,001 $1,464 $1,997 $2,560 45%
License
Consulting
Operation
Total $2,382 $3,629 $5,105 $6,609 $7,991 $9,115
Spending by cost type
$0
$2B
$4B
$6B
$8B
$10BLicenseConsultingOperation
Spending(US$)
(US$ millions)(numbers have been rounded)
The spreadsheet detailing this forecast is available by clicking the online “Get Data” button abovethis figure.
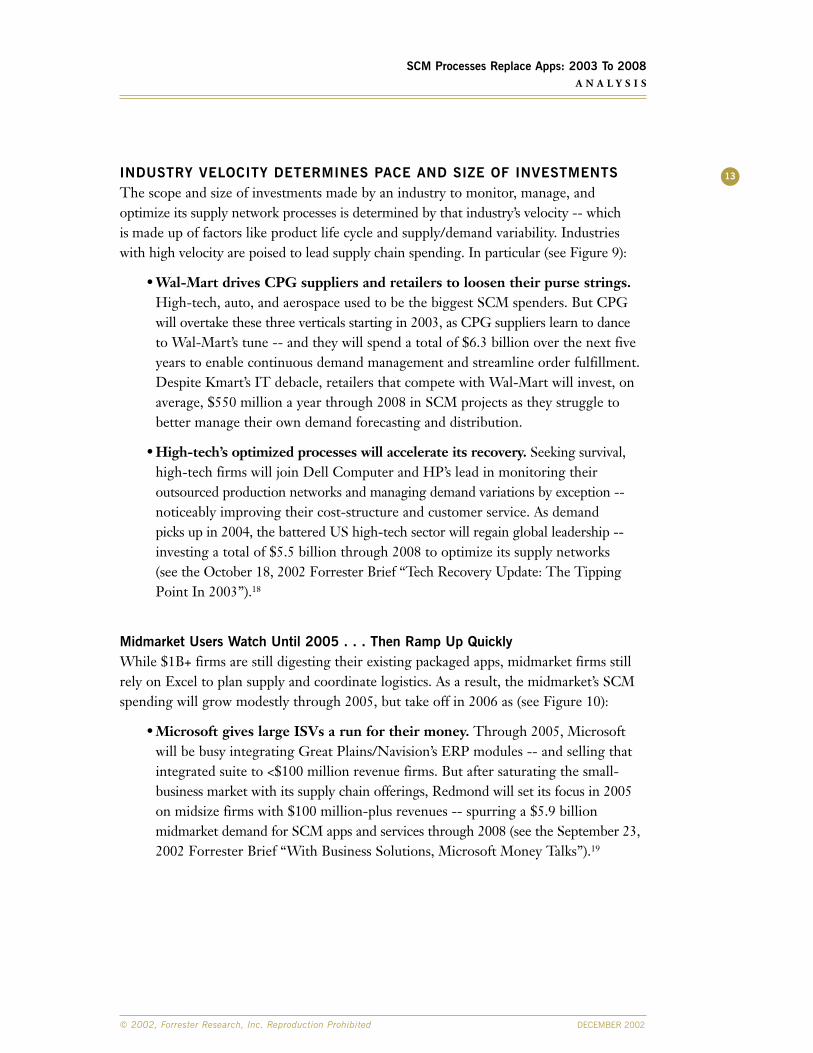
INDUSTRY VELOCITY DETERMINES PACE AND SIZE OF INVESTMENTSThe scope and size of investments made by an industry to monitor, manage, andoptimize its supply network processes is determined by that industry’s velocity -- which is made up of factors like product life cycle and supply/demand variability. Industrieswith high velocity are poised to lead supply chain spending. In particular (see Figure 9):
• Wal-Mart drives CPG suppliers and retailers to loosen their purse strings.High-tech, auto, and aerospace used to be the biggest SCM spenders. But CPGwill overtake these three verticals starting in 2003, as CPG suppliers learn to danceto Wal-Mart’s tune -- and they will spend a total of $6.3 billion over the next fiveyears to enable continuous demand management and streamline order fulfillment.Despite Kmart’s IT debacle, retailers that compete with Wal-Mart will invest, onaverage, $550 million a year through 2008 in SCM projects as they struggle tobetter manage their own demand forecasting and distribution.
• High-tech’s optimized processes will accelerate its recovery. Seeking survival,high-tech firms will join Dell Computer and HP’s lead in monitoring theiroutsourced production networks and managing demand variations by exception --noticeably improving their cost-structure and customer service. As demand picks up in 2004, the battered US high-tech sector will regain global leadership --investing a total of $5.5 billion through 2008 to optimize its supply networks (see the October 18, 2002 Forrester Brief “Tech Recovery Update: The TippingPoint In 2003”).18
Midmarket Users Watch Until 2005 . . . Then Ramp Up QuicklyWhile $1B+ firms are still digesting their existing packaged apps, midmarket firms stillrely on Excel to plan supply and coordinate logistics. As a result, the midmarket’s SCMspending will grow modestly through 2005, but take off in 2006 as (see Figure 10):
• Microsoft gives large ISVs a run for their money. Through 2005, Microsoftwill be busy integrating Great Plains/Navision’s ERP modules -- and selling thatintegrated suite to <$100 million revenue firms. But after saturating the small-business market with its supply chain offerings, Redmond will set its focus in 2005on midsize firms with $100 million-plus revenues -- spurring a $5.9 billionmidmarket demand for SCM apps and services through 2008 (see the September 23,2002 Forrester Brief “With Business Solutions, Microsoft Money Talks”).19
13
© 2002, Forrester Research, Inc. Reproduction Prohibited DECEMBER 2002
SCM Processes Replace Apps: 2003 To 2008A N A L Y S I S
Figure 9 Forecast: US Supply Network Spending By Industry, 2003 To 200814
DECEMBER 2002 © 2002, Forrester Research, Inc. Reproduction Prohibited
SCM Processes Replace Apps: 2003 To 2008A N A L Y S I S
Source: Forrester Research, Inc.
2003 2004 2005 2006 2007 2008
2003 2004 2005 2006 2007 2008
CAGR
$126 $185 $247 $304 $351 $384 25%
$204 $296 $398 $499 $589 $661 26%
$82 $110 $144 $182 $221 $255 26%
$395 $630 $918 $1,213 $1,480 $1,692 34%
$152 $218 $296 $377 $454 $521 28%
$62 $86 $115 $145 $174 $199 26%
$354 $571 $817 $1,052 $1,263 $1,433 32%
$220 $341 $492 $653 $809 $942 34%
$176 $253 $346 $449 $546 $627 29%
$115 $171 $239 $310 $372 $413 29%
$196 $328 $486 $639 $772 $873 35%
$117 $158 $209 $272 $342 $415 29%
$70 $120 $181 $242 $296 $341 37%
$113 $161 $217 $272 $322 $360 26%
Aerospace and Defense
Automotive
Construction
CPG
Healthcare
Heavy industries
High-tech
Industrial equipment and supplies
Petrochemicals
Public sector
Retail
Services
Transportation
Utilities
$2,382 $3,629 $5,105 $6,609 $7,991 $9,115
Spending by industry
ConstructionCPGHealthcareHeavy industriesHigh-techIndustrial equipmentand suppliesPetrochemicalsPublic sector
ServicesTransportationUtilities
Retail
Aerospace and defenseAutomotive
$0
$2B
$4B
$6B
$8B
$10B
Spending(US$)
(US$ millions)(numbers have been rounded)
The spreadsheet detailing this forecast is available by clicking the online “Get Data” button abovethis figure.
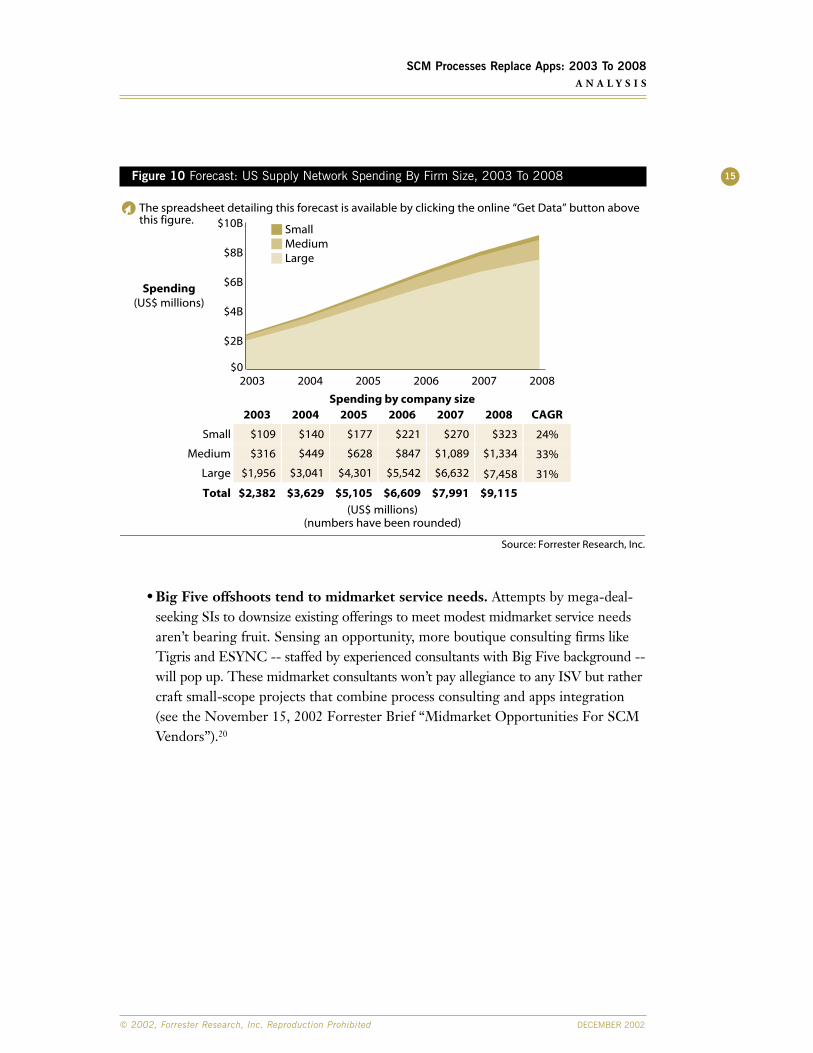
Figure 10 Forecast: US Supply Network Spending By Firm Size, 2003 To 2008
• Big Five offshoots tend to midmarket service needs. Attempts by mega-deal-seeking SIs to downsize existing offerings to meet modest midmarket service needsaren’t bearing fruit. Sensing an opportunity, more boutique consulting firms likeTigris and ESYNC -- staffed by experienced consultants with Big Five background --will pop up. These midmarket consultants won’t pay allegiance to any ISV but rathercraft small-scope projects that combine process consulting and apps integration(see the November 15, 2002 Forrester Brief “Midmarket Opportunities For SCMVendors”).20
15
© 2002, Forrester Research, Inc. Reproduction Prohibited DECEMBER 2002
SCM Processes Replace Apps: 2003 To 2008A N A L Y S I S
Source: Forrester Research, Inc.
2003 2004 2005 2006 2007 2008 CAGR
24%
33%
31%
Small
Medium
Large
Total
$109
$316
$1,956
$2,382
$140
$449
$3,041
$3,629
$177
$628
$4,301
$5,105
$221
$847
$5,542
$6,609
$270
$1,089
$6,632
$7,991
$323
$1,334
$7,458
$9,115
Spending by company size
$0
$2B
$4B
$6B
$8B
$10B SmallMediumLarge
2003 20082004 2005 2006 2007
Spending(US$ millions)
(US$ millions)(numbers have been rounded)
The spreadsheet detailing this forecast is available by clicking the online “Get Data” button abovethis figure.
W H A T I T M E A N S
i2 Technologies and Manugistics survive . . . barely.i2 and Manugistics have been struggling over the past year, with falling licensesales and elusive cash flow. As they seek survival, we expect i2 and Manugistics to do what Forrester has suggested for a long time: rationalize their convolutedapps portfolio by divesting non-core optimization tools -- and focus on improvingtheir supply chain execution apps.21 But once they get leaner, these best-of-breedSCM vendors will find rare upselling or cross-selling opportunities -- as many oftheir existing customers warm up to ERP vendors’ SCM offerings.22
SCM vendors will rally around IBM, Microsoft, SAP, and Oracle.The pace of vendor consolidation will accelerate in 2003 -- paving the way forfour major supply chain platforms and a constellation of best-of-breed vendors(see Figure 11 and see the August 22, 2002 Forrester Brief “Software InnovationShifts To Platforms & Portfolios”).23 Oracle is already sprucing up its B2Binfrastructure and tools with Web services to provide support for cross-functionprocesses (see the October 2002 Forrester Report “Web Services PlatformShootout”).24 And SAP is rolling out xApps -- composite software that tiestogether business logic scattered across SAP and non-SAP apps. This platformorientation will drive large SCM vendors to pick a camp. Expect i2 to migrate its Distributed Order Management suite to WebSphere and Manugistics to craft.NET-anchored pricing optimization solutions.
Vendors will appoint a chief process officer.As the innovation focus shifts from app to process, expect more vendors to boosttheir process IQ by emulating Rapt -- which hired Intel veteran Karen Alter as chief process architect to develop best practices around pricing managementprocesses. We already heard from a major app vendor that it has appointed a “process evangelist” who will work closely with the heads of the vendor’s CRM,SCM, and PLM product lines to design composite apps that let users manageand optimize cross-functional aftermarket service management processes.
16
DECEMBER 2002 © 2002, Forrester Research, Inc. Reproduction Prohibited
SCM Processes Replace Apps: 2003 To 2008W H A T I T M E A N S
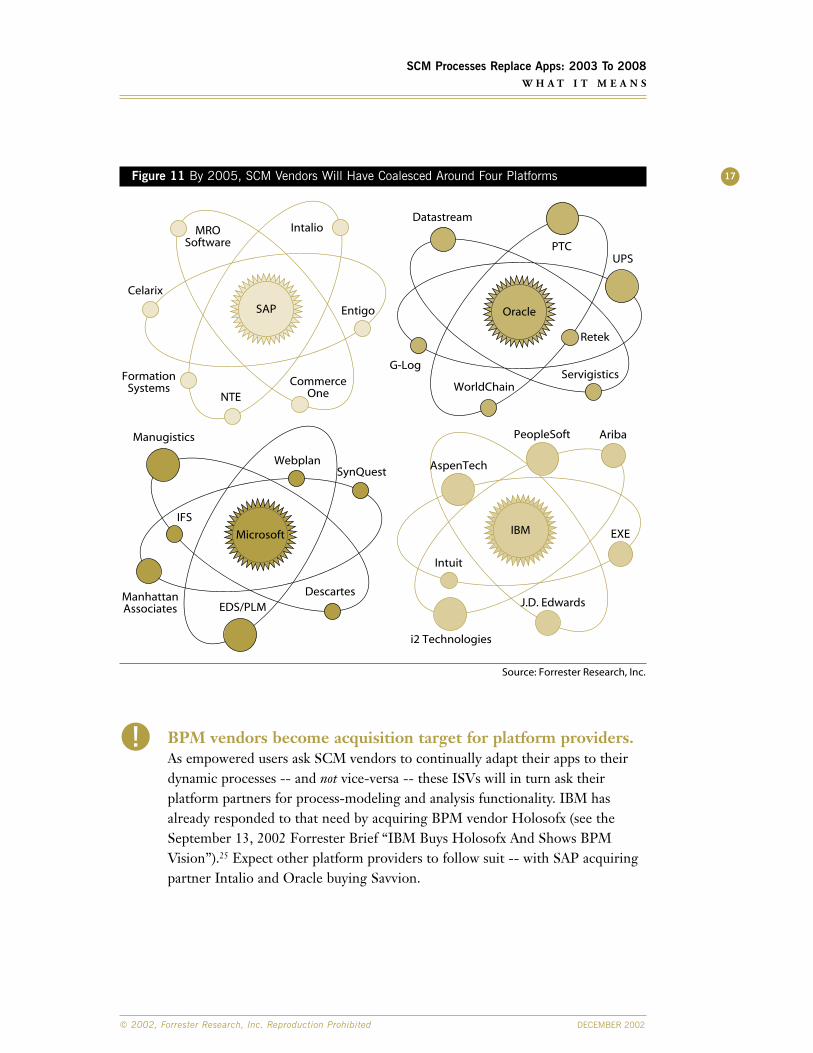
Figure 11 By 2005, SCM Vendors Will Have Coalesced Around Four Platforms
BPM vendors become acquisition target for platform providers.As empowered users ask SCM vendors to continually adapt their apps to theirdynamic processes -- and not vice-versa -- these ISVs will in turn ask theirplatform partners for process-modeling and analysis functionality. IBM hasalready responded to that need by acquiring BPM vendor Holosofx (see theSeptember 13, 2002 Forrester Brief “IBM Buys Holosofx And Shows BPMVision”).25 Expect other platform providers to follow suit -- with SAP acquiringpartner Intalio and Oracle buying Savvion.
17
© 2002, Forrester Research, Inc. Reproduction Prohibited DECEMBER 2002
SCM Processes Replace Apps: 2003 To 2008W H A T I T M E A N S
Source: Forrester Research, Inc.
Celarix
Intalio
CommerceOne
Datastream
PTC
WorldChain
Webplan
Manugistics
EDS/PLMDescartesManhattan
Associates
i2 Technologies
J.D. Edwards
Intuit
AspenTech
Ariba
EXE
PeopleSoft
SAP
IBMMicrosoft
Oracle
FormationSystems
Entigo
MROSoftware
NTE
UPS
G-Log
Retek
Servigistics
SynQuest
IFS
R E L A T E D M A T E R I A L
Online Resource
The underlying spreadsheet detailing the forecasts in Figures 5, 6, 8, 9 and 10 isavailable by clicking the online “Get Data” buttons above the figures.
Methodology
Forrester surveyed 26 executives in $1B+ manufacturing firms who are responsible forsupply chain management (SCM). We also interviewed 36 vendors and integrators.
Companies Interviewed For This Report
Related Research
November 2002 Forrester Report “Navigating The Supply Chain Project Maze”August 22, 2002 Forrester Brief “Software Innovation Shifts To Platforms & Portfolios”March 2002 Forrester Report “Bite-Sized SCM Projects”
Accorduswww.accordus.comAgile SoftwareCorporationwww.agilesoft.comBristleconewww.bcone.comCap Gemini Ernst & Youngwww.cgey.comCelarixwww.celarix.comChainalyticswww.chainalytics.comClarkston Consultingwww.clarkstonconsulting.comCommerce OneOperationswww.commerceone.comDatastream Systemswww.datastream.netEnigmawww.enigma.comExelwww.exel.com
Formation Systemswww.formationsystems.comFreeMarketswww.freemarkets.comG-Logwww.glog.comGT Nexuswww.gtnexus.comi2 Technologieswww.i2.comIBMwww.ibm.comIndus Internationalwww.indus.comInfosys Technologieswww.infosys.comManugisticswww.manugistics.comMatrixOnewww.matrixone.comMicrosoftwww.microsoft.comMRO Softwarewww.mro.comNNC Groupwww.nncgroup.com
PTCwww.ptc.comRaptwww.rapt.comRetek www.retek.comRyder Systemwww.ryder.comSAPwww.sap.comSierra Atlanticwww.sierraatlantic.comUPS Supply ChainSolutionswww.ups-scs.comWachovia Securitieswww.wachoviasec.comWebplanwww.webplan.comWorldChainwww.worldchain.comXeluswww.xelus.comYantra Corporationwww.yantra.com
18
DECEMBER 2002 © 2002, Forrester Research, Inc. Reproduction Prohibited
SCM Processes Replace Apps: 2003 To 2008R E L A T E D M A T E R I A L
G R A P E V I N E
Microsoft turns the process focus on itself.We knew that Microsoft’s internal IT staff used Web services to create an Excel front endto interface with Siebel server -- making Siebel more user-friendly. Now, as Redmondprepares to deliver apps that target cross-functional processes, it has appointed Jeff Raikesas group vice president of its Office division to monitor, manage, and optimize thatdivision’s cross-functional processes for product life-cycle management and order fulfillment.
……
SAP sued by DOJ’s antitrust lawyers?When Forrester asked 124 senior execs to select a single vendor that they turn to fortheir supply chain project, ERP vendors like SAP outnumbered best-of-breed playerslike i2 by a margin of 4 to 1. One SI that implements i2’s apps concurred with that trendand joked: “We won’t be surprised if i2 and Manugistics end up suing SAP for antitrustlaw violations.” Should SAP begin hiring lawyers well-versed in the Sherman Act? Notjust yet. With Microsoft entering the SCM market and more PeopleSoft users deploying its integrated SCM suite, SAP will not monopolize the SCM market anytime soon.
……
Rock-solid evidence that pharma firms need CPLM apps.We knew a lot of healthcare-industry processes are manual, given the sector’s aversionfor packaged apps, but we were blown away by a story narrated by Simon Parmett, SVP at Agile Software. We learned from Parmett that a medical device maker piles up all itsengineering change orders (ECOs) waiting to be faxed to its contract manufacturer on a table -- and uses rocks to keep the ECO piles intact. But the old desk bends in themiddle so the piles in the center kept getting mixed up. So the firm hired four people tomanually route ECOs -- and justified the hiring since: “They help keep the piles neat.”
……
Vendors setting up shop in D.C. shouldn’t hold their breath.The Government Electronics & Information Technology Association predicts thatfederal government IT spending will hit $74 billion in 2003. In particular, the formation of the Department of Homeland Security will drive huge spending on IT security andapps. No wonder that vendors and SIs are flocking to D.C. these days. But here is aquote from Steve Cooper -- CIO for the Office of Homeland Security -- that shouldcool off mega-deal-seeking vendors: “We expect our IT projects to last no longer than12 months and cost under $1 million.”26
19
© 2002, Forrester Research, Inc. Reproduction Prohibited DECEMBER 2002
SCM Processes Replace Apps: 2003 To 2008G R A P E V I N E
E N D N O T E S1 In a survey with 124 North American execs -- who work for firms ranging from $500 million to
more than $10 billion in revenue -- Forrester learned that their organizations spent an average of $6.8 million and 1.6 years per supply chain project.
2 The average license-to-service ratio in the supply chain software industry is 2 to 1.
3 In a survey with supply chain executives at 22 companies, only 41% interviewees described the ROIfrom their SCM investments as “more positive than expected.”
4 The Supply-Chain Operations Reference (SCOR) model introduced in 1996 by the Supply-ChainCouncil formalized the distinction between PLAN and EXECUTE. For more information on theSCOR model, please visit the Supply-Chain Council’s Web site at: http://www.supply-chain.org.
5 Firms need to augment their existing supply chain planning tools with adaptive planning apps --event-driven software that allows them to proactively sense and correct deviations from theirexisting supply chain plans.
6 eProcurement buyers will ultimately choose their software vendor based on how well the vendorsupports connections to other business processes. They will choose horizontal process breadthwhen spend is fragmented and vertical depth for large categories of spending.
7 To best serve customers, firms must embrace dynamic collaboration -- a strategy of win-winpartnerships that share business activities like design, supply chain, and service across a network of allies.
8 Firms faced with mass customization and shorter product life cycles can’t just rely on inventorystrategies like postponement and lean manufacturing. To accommodate swings between supply anddemand, firms need network-aware inventory management to optimize inventory based on serviceand cost constraints.
9 In 2000, a fire in Philips’ New Mexico plant disrupted Ericsson’s chip supplies for its key newhandset. Ericsson lost three market share points against Nokia that year.
10 Firms must establish tighter linkages between engineering, manufacturing, and support to increasethe cost-effectiveness and profitability of their products over their life cycle. Firms that adoptcollaborative product life-cycle management (CPLM) will internalize three principles: 1) sourcingaccompanies parts; 2) plant assets notify engineering; and 3) products converse with OEMs.
11 The average age of a ChevronTexaco employee is 47, with half of the workers retiring in 10 years.Source: Chevron Now Online, Jan/Feb 2001.
12 To avoid plummeting profits and write-offs when bad demand plans fail to predict rapid decline inorders, firms must adopt a systematic way to manage demand. This brief introduces “continuousdemand management” -- an iterative, technology-assisted process to reduce demand variability.
20
DECEMBER 2002 © 2002, Forrester Research, Inc. Reproduction Prohibited
SCM Processes Replace Apps: 2003 To 2008E N D N O T E S
13 To gain visibility into orders and inventory outside their own walls, firms will augment their SCMplanning and execution software with adaptive logistics management apps. These apps will let firmssense and interpret events, decide and act on exceptions, and learn to transform existing processes.
14 Over the next decade, Forrester believes that durable goods manufacturers will shift theirinnovation focus from products to services. Firms that aspire to build a service-driven supplynetwork must selectively invest in aftermarket overhauling efforts -- or lose lucrative post-salesupport deals to competitors.
15 The effects of the current recession will persist even as the economy recovers in 2004. The result?Vendors to cluster for buyers and shelter -- with users finally in charge. Empowered users willcause license fees to permanently plummet and will begin to rate vendors on quality, service, andusability.
16 Including license, service, and operation, total project cost will average $587,000 at the monitorstage, $660,000 at the manage stage, and $750,000 at the optimize stage.
17 Users complain that traditional SCM app implementations take too long and cost too much. Thisreport explains how to roll out small-scope SCM projects -- with quick ROI -- that fund firms’ nextinitiatives.
18 Despite a comeback during the second half of 2002, Forrester estimates that tech sector revenueswill end the year down 8%. Forrester expects the battered tech sector to recover modestly in 2003with a growth rate of 5.6% but achieve double-digit expansion only in 2004.
19 Microsoft will exploit its huge VAR network and a simplified pricing strategy to establish itsmidmarket credibility as an enterprise app vendor. Microsoft will emerge as a formidablemidmarket competitor for vendors like SAP, JD Edwards, and Oracle.
20 Midmarket firms lack the IT bandwidth needed to implement SCM packaged apps -- or the extrastaff to manage several service providers. So ISVs should package implementation services andmethodologies together in fixed-price, bite-sized packages.
21 According to Morgan Stanley analyst Chuck Phillips, i2 lost one-third of its Q3 2002 R&D budget --or $47 million -- to integrating its hodgepodge of 144 apps -- inherited through multipleacquisitions. Source: http://www.morganstanley.com/mrchuck/695.html.
22 When Forrester asked 124 senior execs to select a single vendor they turn to for their supply chainprojects, ERP vendors like SAP and Oracle outnumbered best-of-breed players like i2 andManugistics by a margin of 4 to 1.
23 The Internet’s discovery phase was fueled by massive innovation from software startups. But in thebuild-out phase of the next 10 years, innovation will shift to the platforms and portfolios ofsoftware giants like IBM, Microsoft, Oracle, and SAP.
24 Web services infrastructure will transform today’s software runtimes into a more flexible service-oriented architecture. IBM and Microsoft today lead the charge with the best strategy and strongestWeb services platforms -- followed by Oracle and BEA.
21
© 2002, Forrester Research, Inc. Reproduction Prohibited DECEMBER 2002
SCM Processes Replace Apps: 2003 To 2008E N D N O T E S
25 By acquiring Holosofx to add process-modeling and analysis feature to its WebSphere BusinessIntegrator portfolio, IBM is joining other integration vendors in the race to embed business processmanagement (BPM) capabilities into their offerings.
26 According to the Government Electronics and Information Technology Association, the budget for the proposed Department of Homeland Security is an estimated $37.7 billion. Source:http://www.washingtontechnology.com/cgi-bin/udt/im.display.printable?client.id=wtonline-test&story.id=19512.
22
DECEMBER 2002 © 2002, Forrester Research, Inc. Reproduction Prohibited
SCM Processes Replace Apps: 2003 To 2008E N D N O T E S
Upcom
ing E
vents
ww
w.fo
rreste
r.com
Whole
Vie
w™
AutomotiveDistribution, Suppliers, Retail
Consumer Devices &ServicesBroadband, Consumer Electronics, Devices, PCs, Mobile Devices, PCs & Peripherals
Consumer PackagedGoodsMerchandising, Distributors, Logistics, Retail
Content ManagementWeb Content, Enterprise Content, Digital Assets, Digital Asset Management, Document Management
Customer Relationship ManagementSales, Marketing, & Service, Call Centers, Email, Email Management
Enterprise ApplicationsERP, Enterprise Services Automation, B2B Sell-Side, MRP
Financial ServicesBanking, Insurance, Investment, Credit
HealthcareHealth Plans, Pharmaceuticals, Healthcare Providers, Biotechnology
InfrastructurePortals, Servers, Corporate Wireless, Storage, Tools
Integration & Web ServicesMiddleware, EAI/B2B Integration Tools
Manufacturing & B2BCollaboration, Trade Forecasts, Energy, Chemicals, New Business Models
Marketing Branding, Promotion, Cross-Media Marketing, Advertising
Media & EntertainmentPublishing, Television, Music, Content Syndication
Networks & Security Enterprise Network Management, Equipment, Services
Procurement & Sourcing Purchasing, Supplier Management, Marketplaces, Direct/Indirect Purchasing
RetailManufacturers, Retailers, Channels, Operations
ServicesASPs, Hosting, Outsourcing, Systems Integrators
Site Technology & Design Site Design, Commerce Platforms, Measurement, User Experience
Supply Chain Planning & Execution, Logistics,Product Design, Distribution
Technology Leadership Budgeting, Organization, Staffing, Partnerships
TelecomTelecom Services, Mobile Services, Carrier Strategy, Communications Infrastructure
TravelAirlines, Hotels, Business & Leisure Travel, Travel Agencies, Rental Cars
Forrester’s WholeViewTM Research provides clients with unified guidance on customer trends,
business strategy, and technology investments through Technographics®, TechStrategyTM, and
TechRankingsTM. WholeView Research drills down into the most important details of an issue
while maintaining a holistic perspective of the impact of technology change on business.
Forrester also offers Events and Strategic Services that further enhance the WholeView. Each
Event provides new ideas, clear direction, and innovative strategies with a WholeView perspective.
Strategic Services deliver custom guidance for the complex business decisions that drive your
company’s success.
Forrester Events
Effective Site Design Boot Camp
Cambridge, Mass.February 5-6, 2003
Automotive Summit 2003From Push To Pull: The New Demand-Driven Auto Industry
Los Angeles, Calif.February 18-19, 2003
Technology Leadership Forum 2003Organic IT: The Next Computing Revolution
Scottsdale, Ariz.February 23-25, 2003